Autocorrelation analysis of ANTARES data 1 Introduction
Autocorrelation analysis of ANTARES data 1 Introduction
Autocorrelation analysis of ANTARES data 1 Introduction

You also want an ePaper? Increase the reach of your titles
YUMPU automatically turns print PDFs into web optimized ePapers that Google loves.
32ND INTERNATIONAL COSMIC RAY CONFERENCE, BEIJING 2011<br />
<strong>Autocorrelation</strong> <strong>analysis</strong> <strong>of</strong> <strong>ANTARES</strong> <strong>data</strong><br />
FABIAN SCHÜSSLER 1 ON BEHALF OF THE <strong>ANTARES</strong> COLLABORATION<br />
1 Commissariat à l’énergie atomique et aux énergies alternatives<br />
Institut de recherche sur les lois fondamentales de l’Univers<br />
91191 Gif-sur-Yvette Cedex, France<br />
fabian.schussler@cea.fr<br />
Abstract: Clustering <strong>of</strong> neutrino arrival directions would provide hints for their astrophysical origin. The two-point<br />
autocorrelation method is sensitive to a large variety <strong>of</strong> cluster morphologies and, due to its independence from Monte<br />
Carlo simulations, provides complementary information to searches for the astrophysical sources <strong>of</strong> high energy muon<br />
neutrinos. We present the <strong>analysis</strong> <strong>of</strong> the autocorrelation function as a function <strong>of</strong> the angular scale <strong>of</strong> <strong>data</strong> collected<br />
during 2007-08 with the <strong>ANTARES</strong> neutrino telescope.<br />
Keywords: neutrino astronomy, neutrino telescopes, point sources, autocorrelation<br />
1<br />
2<br />
3<br />
4<br />
5<br />
6<br />
7<br />
8<br />
9<br />
10<br />
11<br />
12<br />
13<br />
14<br />
15<br />
16<br />
17<br />
18<br />
19<br />
20<br />
21<br />
22<br />
23<br />
24<br />
25<br />
26<br />
27<br />
28<br />
1 <strong>Introduction</strong><br />
The key question to resolve the long standing mystery <strong>of</strong><br />
the origin <strong>of</strong> cosmic rays is to locate the sources and study<br />
the acceleration mechanisms able to produce fundamental<br />
particles with energies orders <strong>of</strong> magnitude above manmade<br />
accelerators. Over the last years it has become more<br />
and more obvious that multiple messengers will be needed<br />
to achieve this task. Fundamental particle physics processes<br />
like the production and subsequent decay <strong>of</strong> pions<br />
in interactions <strong>of</strong> high energy particles predict that the acceleration<br />
sites <strong>of</strong> high energy cosmic rays are also sources<br />
<strong>of</strong> high energy gamma rays and neutrinos. The detection<br />
<strong>of</strong> astrophysical neutrinos and the identification <strong>of</strong> their<br />
sources is one <strong>of</strong> the main aims <strong>of</strong> large neutrino telescopes<br />
operated at the South Pole (IceCube), in Lake Baikal and<br />
in the Mediterranean Sea (<strong>ANTARES</strong>).<br />
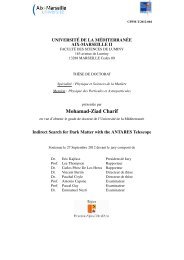
1.1 The <strong>ANTARES</strong> neutrino telescope<br />
Whereas physics <strong>data</strong> taking started already during the<br />
deployment phase, the <strong>ANTARES</strong> detector [1] became<br />
fully equipped and operational in 2008. The detector<br />
is composed <strong>of</strong> 12 detection lines placed at a depth <strong>of</strong><br />
2475m <strong>of</strong>f the French coast near Toulon. The detector<br />
lines are about 450m long and hold a total <strong>of</strong> 885 optical<br />
modules (OMs), 17” glass spheres housing each a 10”<br />
photomultiplier tube. The OMs look downward at 45 ◦ in<br />
order to optimize the detection <strong>of</strong> upgoing, i.e. neutrino<br />
induced, tracks. The geometry and size <strong>of</strong> the detector<br />
makes it sensitive to neutrinos in the TeV-PeV energy<br />
Figure 1: Schematic view <strong>of</strong> the <strong>ANTARES</strong> detector.<br />
range. A schematic layout is shown in Fig. 1. 29<br />
1.2 Neutrino detection 31<br />
The neutrino detection relies on the emission <strong>of</strong> Cherenkov 32<br />
light by high energy muons originating from charged cur- 33<br />
rent neutrino interactions inside or near the instrumented 34<br />
volume. All detected signals are transmitted via an optical 35<br />
cable to a shore station, where a farm <strong>of</strong> CPUs filters the 36<br />
<strong>data</strong> for coincident signals or hits in several adjacent OMs. 37<br />
The muon direction is then determined by maximising 38<br />
a likelihood which compares the times <strong>of</strong> the hits with 39<br />
30
F. SCHÜSSLER et al. <strong>ANTARES</strong> AUTOCORRELATION<br />
cumulative events<br />
6<br />
10<br />
5<br />
10<br />
10 4<br />
10<br />
3<br />
10 2<br />
<strong>data</strong><br />
total MC<br />
m MC<br />
n MC<br />
events<br />
5<br />
10<br />
10 4<br />
3<br />
10<br />
10 2<br />
<strong>data</strong><br />
total MC<br />
m MC<br />
n MC<br />
10<br />
10<br />
1<br />
1<br />
-7 -6.5 -6 -5.5 -5 -4.5 -4 -3.5 -3<br />
reconstruction quality L<br />
10 -1<br />
-1 -0.8 -0.6 -0.4 -0.2 0 0.2 0.4 0.6 0.8 1<br />
cos(zenith angle)<br />
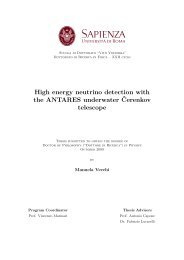
Figure 2: Distribution <strong>of</strong> the quality parameter Λ (left plot) and the cosine <strong>of</strong> the reconstructed zenith angle (right plot)<br />
<strong>of</strong> the selected <strong>data</strong> events (markers) compared to Monte Carlo simulations <strong>of</strong> atmospheric muons (red, dotted line) and<br />
atmospheric neutrinos (blue, dashed line).<br />
40<br />
41<br />
42<br />
43<br />
44<br />
45<br />
46<br />
47<br />
48<br />
49<br />
50<br />
51<br />
52<br />
53<br />
54<br />
55<br />
56<br />
57<br />
58<br />
59<br />
60<br />
61<br />
62<br />
63<br />
64<br />
65<br />
66<br />
67<br />
68<br />
69<br />
70<br />
the expectation from the Cherenkov signal <strong>of</strong> a muon track.<br />
1.3 Astrophysical neutrinos<br />
Two main backgrounds for the search for astrophysical<br />
neutrinos can be identified: downgoing atmospheric<br />
muons which have been mis-reconstructed as upgoing and<br />
atmospheric neutrinos originating in cosmic ray induced<br />
air showers at the opposite side <strong>of</strong> the Earth. Depending<br />
on the requirements <strong>of</strong> the <strong>analysis</strong> both backgrounds can<br />
at least partially be discriminated using various parameters<br />
like the quality <strong>of</strong> the event reconstruction or an estimator<br />
for the deposited energy [2].<br />
In addition, analysing the reconstructed arrival directions<br />
<strong>of</strong> the events allows to search for an excess over the uniform<br />
atmospheric backgrounds. Despite important efforts,<br />
no clear signature for point sources <strong>of</strong> astrophysical neutrinos<br />
has been found so far [3, 4, 5, 6]. Both the distribution<br />
and morphologies <strong>of</strong> sources potentially emitting neutrinos<br />
in the TeV energy range are yet unknown but are possibly<br />
very inhomogeneous with most <strong>of</strong> them being located<br />
in the Galactic disk and spatially extended (e.g. shell type<br />
supernova remnants like RXJ1713 [7]). It seems therefore<br />
interesting to study the intrinsic clustering <strong>of</strong> the arrival directions<br />
<strong>of</strong> neutrinos. Possible <strong>analysis</strong> biases are naturally<br />
avoided as no prior information about the potential sources<br />
is required. Covering a large angular range, i.e. neutrino<br />
emission regions <strong>of</strong> very different sizes, this study complements<br />
the searches for point like sources and, if successful,<br />
would provide hints for underlying, yet unresolved, source<br />
morphologies and source distributions.<br />
2 <strong>Autocorrelation</strong> <strong>analysis</strong> 71<br />
The most commonly used method to detect intrinsic clus- 72<br />
ters within a set <strong>of</strong> N events is the standard 2-point auto- 73<br />
correlation distribution. It is defined as the differential dis- 74<br />
tribution <strong>of</strong> the number <strong>of</strong> observed event pairs N p in the 75<br />
<strong>data</strong> set as a function their mutual angular distance ∆Ω. 76<br />
To suppress statistical fluctuations that would reduce the 77<br />
sensitivity <strong>of</strong> the method, we analyse here the cumulative 78<br />
autocorrelation distribution defined as 79<br />
N p (∆Ω) =<br />
N∑<br />
N∑<br />
i=1 j=i+1<br />
H(∆Ω ij −∆Ω), (1)<br />
whereH is the Heaviside step function. 80<br />
2.1 Data set 81<br />
The analysed <strong>data</strong> set has been recorded by the <strong>ANTARES</strong> 82<br />
neutrino telescope in 2007 and 2008. During this period 83<br />
the detector was in its construction phase and has been 84<br />
operated in various setups ranging from 5 active lines at 85<br />
the beginning <strong>of</strong> 2007 to a fully operational detector <strong>of</strong> 12 86<br />
lines since mid 2008. After applying a run selection re- 87<br />
moving for example periods without precise detector align- 88<br />
ment information, the <strong>data</strong>set corresponds to about 300 89<br />
effective days. Comprising mainly atmospheric muons, 90<br />
about 100 million events were reconstructed with the stan- 91<br />
dard <strong>ANTARES</strong> reconstruction algorithm. Basic selec- 92<br />
tion criteria include a cut on the reconstructed zenith an- 93<br />
gle θ to ensure that only upgoing muon tracks are selected 94<br />
(cos(θ) > 0) and a cut on the angular uncertainty β given 95<br />
by the covariance matrix <strong>of</strong> the final likelihood fit (β < 1 ◦ ). 96<br />
The final selection criteria is a cut on the fit quality parame- 97<br />
terΛ, which is derived from the value <strong>of</strong> the maximal like- 98<br />
lihood itself. Before unblinding the <strong>data</strong>, this cut has been 99<br />
optimized by means <strong>of</strong> MC simulations to yield the best 100<br />
average upper limit on the neutrino flux in the search for 101
W<br />
32ND INTERNATIONAL COSMIC RAY CONFERENCE, BEIJING 2011<br />
< D<br />
number <strong>of</strong> pairs N<br />
pairs<br />
5<br />
10<br />
10 4<br />
3<br />
10<br />
10 2<br />
]<br />
[s<br />
14<br />
12<br />
10<br />
8<br />
6<br />
1 point-like source<br />
3 point-like sources<br />
10<br />
1<br />
<strong>data</strong><br />
mean randomized sky<br />
0 2 4 6 8 10 12 14 16 18 20<br />
angular distance D W [deg]<br />
4<br />
2<br />
0<br />
0 2 4 6 8 10 12 14 16 18<br />
number <strong>of</strong> signal events per source<br />
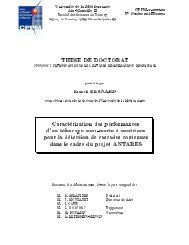
Figure 3: Left: Cumulative autocorrelation distribution <strong>of</strong> the selected <strong>data</strong>set (open markers) shown in comparison with<br />
the reference distribution (red solid line). Right: Performance <strong>of</strong> the algorithm to detect a single or multiple point-like<br />
sources.<br />
102<br />
103<br />
104<br />
105<br />
106<br />
107<br />
108<br />
109<br />
110<br />
111<br />
112<br />
113<br />
114<br />
115<br />
116<br />
117<br />
118<br />
119<br />
120<br />
121<br />
122<br />
123<br />
124<br />
125<br />
126<br />
127<br />
128<br />
129<br />
130<br />
131<br />
132<br />
133<br />
134<br />
135<br />
point like sources [5, 6]. 2190 events pass the final criterion<br />
Λ > −5.4. The Λ and zenith angle distributions <strong>of</strong><br />
events passing all quality criteria (except the ones shown in<br />
the plot) are shown in figure 2.<br />
Following eq. 1, the cumulative autocorrelation distribution<br />
<strong>of</strong> the selected events has been determined. It is shown in<br />
the left plot <strong>of</strong> figure 3.<br />
2.2 Reference autocorrelation distribution<br />
To detect structures in the sky distribution <strong>of</strong> the analysed<br />
events we need a reference autocorrelation distribution<br />
to compare with. This reference has been determined<br />
by scrambling the <strong>data</strong> themselves, a method which allows<br />
to avoid systematic uncertainties introduced by the use <strong>of</strong><br />
Monte Carlo simulations. The scrambling method uses<br />
the local coordinates (zenith and azimuth) and the detection<br />
time T i <strong>of</strong> all selected <strong>data</strong> events. While keeping the<br />
pairs <strong>of</strong> zenith/azimuth for all events in order to avoid losing<br />
information about possible correlations between them,<br />
the detection time is drawn randomly from another event<br />
within the same detector configuration in order to keep<br />
track <strong>of</strong> the changing asymmetry <strong>of</strong> the detector. Using all<br />
selected events, a randomized sky map with the same number<br />
<strong>of</strong> events as in the <strong>data</strong> and naturally the same sky coverage<br />
is constructed. This randomized sky is then analysed<br />
in exactly the same way as the <strong>data</strong> to derive the autocorrelation<br />
function. The randomization process is performed<br />
about 10 6 times and the derived autocorrelation distributions<br />
are averaged in order to suppress statistical fluctuations.<br />
The resulting reference distribution is shown as a red<br />
dotted line in the left plot <strong>of</strong> figure 3.<br />
2.3 Comparison between <strong>data</strong> and reference<br />
Structures in the sky distribution <strong>of</strong> our <strong>data</strong> will show up<br />
as differences between the autocorrelation distributions <strong>of</strong><br />
the <strong>data</strong> and the reference distribution. The comparison<br />
between them is performed by using the formalism intro- 136<br />
duced by Li&Ma [8]. This formalism results in the raw sig- 137<br />
nificances <strong>of</strong> the differences as a function <strong>of</strong> the cumulative 138<br />
angular scale which is shown in figure 4. As the compari- 139<br />
son is performed bin-by-bin and as we scan over different 140<br />
angular scales, this result has to be corrected for the cor- 141<br />
responding trial factor. We apply the method proposed by 142<br />
Finley and Westerh<strong>of</strong>f [9] and perform about 10 5 pseudo 143<br />
experiments in which the autocorrelation distributions <strong>of</strong> 144<br />
randomized sky maps are compared with the reference dis- 145<br />
tribution. The probability to obtain the same or higher sig- 146<br />
nificance as the maximum deviation observed in the <strong>data</strong> is 147<br />
calculated and given as final p-value <strong>of</strong> the <strong>analysis</strong>. 148<br />
2.4 Performance and sensitivity 149<br />
The performance <strong>of</strong> the algorithm has been determined us- 150<br />
ing mock <strong>data</strong> sets for which we scrambled the selected 151<br />
<strong>data</strong> events as described above. While keeping the total 152<br />
number <strong>of</strong> events in the toy model constant and taking 153<br />
into account the angular resolution, we added predefined 154<br />
source structures with various sizes and source luminosi- 155<br />
ties. These mock <strong>data</strong> sets where then analysed in exactly 156<br />
the same way as described above. As can be seen in the 157<br />
right plot <strong>of</strong> figure 3, the algorithm is sensitive enough to 158<br />
obtain a 3σ evidence in the exemplary case <strong>of</strong> 3 point like 159<br />
sources emitting each about 6 events. This source luminos- 160<br />
ity is at the detection threshold <strong>of</strong> the dedicated search for 161<br />
a point like excess in the same <strong>data</strong>set [5, 6], which under- 162<br />
lines the complementarity <strong>of</strong> the two methods. 163<br />
An important free parameter <strong>of</strong> the <strong>analysis</strong> is the binning 164<br />
<strong>of</strong> the autocorrelation distribution as it will determine the 165<br />
sensitivity to certain angular scales and which is connected 166<br />
to the angular resolution. For the used quality selection 167<br />
an average angular resolution <strong>of</strong> 0.5 ◦ has been determined 168<br />
from Monte Carlo simulations. Using toy simulations with 169<br />
various source scenarios an optimal binning <strong>of</strong> 0.1 ◦ has 170<br />
been determined. 171
s<br />
F. SCHÜSSLER et al. <strong>ANTARES</strong> AUTOCORRELATION<br />
significance < D W [s ]<br />
2.5<br />
2<br />
1.5<br />
1<br />
0.5<br />
0<br />
2<br />
1.5<br />
1<br />
0.5<br />
0<br />
-0.5<br />
-1<br />
-1.5<br />
-2<br />
0 0.5 1 1.5 2 D W<br />
[deg]<br />
-0.5<br />
-1<br />
-1.5<br />
-2<br />
-2.5<br />
0 20 40 60 80 100 120 140 160 180<br />
angular distance D W [deg]<br />
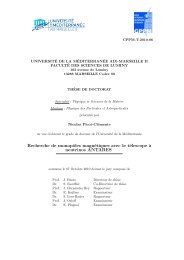
Figure 4: The significance <strong>of</strong> intrinsic clustering <strong>of</strong> <strong>data</strong> taken with the <strong>ANTARES</strong> neutrino telescope in 2007/2008. The<br />
trial factor is not corrected for. The inset shows an enlarged view <strong>of</strong> the significance for small angular distances.<br />
172<br />
173<br />
174<br />
175<br />
176<br />
177<br />
178<br />
179<br />
180<br />
181<br />
182<br />
183<br />
184<br />
185<br />
186<br />
187<br />
188<br />
189<br />
190<br />
191<br />
192<br />
193<br />
2.5 Results and discussion<br />
The described <strong>analysis</strong> has been applied to the 2090 selected<br />
<strong>data</strong> events recorded by the <strong>ANTARES</strong> neutrino<br />
telescope between 2007 and 2008. The uncorrected significance<br />
as a function <strong>of</strong> the cumulative angular scale is<br />
shown in figure 4. A maximum deviation between the <strong>data</strong><br />
and the reference distribution <strong>of</strong> 1.1 σ is found for an angular<br />
scale < 7 ◦ . Correcting for the scanning trial factor<br />
this corresponds to a p-value <strong>of</strong> 55 % and is therefore not<br />
significant.<br />
In the search for the sources <strong>of</strong> high energy cosmic rays, the<br />
detection <strong>of</strong> astrophysical sources <strong>of</strong> neutrinos may play a<br />
crucial role. Various experiments are currently taking <strong>data</strong><br />
or are in a preparatory phase to achieve this goal and the<br />
recorded <strong>data</strong> is scrutinized in numerous ways in order to<br />
extract a maximum <strong>of</strong> information. We presented here the<br />
first search for intrinsic clustering <strong>of</strong> <strong>data</strong> recorded with the<br />
<strong>ANTARES</strong> neutrino telescope. The <strong>data</strong>, taken during the<br />
deployment phase <strong>of</strong> the detector, do not show evidence for<br />
deviations from the isotropic arrival direction distribution<br />
expected for the background <strong>of</strong> atmospheric neutrinos and<br />
contamination by mis-reconstructed atmospheric muons.<br />
trum unfolding with the <strong>ANTARES</strong> detector, these pro- 200<br />
ceedings, 2011 201<br />
[3] R. Abbasi et al. (AMANDA Collaboration), Search for 202<br />
point sources <strong>of</strong> high energy neutrinos with final <strong>data</strong> 203<br />
from AMANDA-II, PRD 79, 062001, 2009 204<br />
[4] R. Abbasi et al. (IceCube Collaboration), Time- 205<br />
integrated Searches for Point-like Sources <strong>of</strong> Neutrinos 206<br />
with the 40-string IceCube Detector, APJ 732, 18-34, 207<br />
2011 208<br />
[5] M. Ageron et al. (<strong>ANTARES</strong> Collaboration), Point- 209<br />
like source search with 2007-2008 <strong>data</strong>, in preparation, 210<br />
2011 211<br />
[6] C. Bogazzi for the <strong>ANTARES</strong> Collaboration, Search- 212<br />
ing for point sources <strong>of</strong> high energy cosmic neutrinos 213<br />
with the <strong>ANTARES</strong> telescope, these proceedings, 2011 214<br />
[7] F. Aharonian et al. (HESS Collaboration), Primary par- 215<br />
ticle acceleration above 100 TeV in the shell-type super- 216<br />
nova remnant RX J1713.7-3946 with deep HESS obser- 217<br />
vations, A&A 464, 235-243, 2007 218<br />
[8] T.-P. Li and Y.-Q. Ma, Analysis methods for results in 219<br />
gamma-ray astronomy, APJ 272, 317-324, 1983 220<br />
[9] C. Finley and S. Westerh<strong>of</strong>f, On the evidence for clus- 221<br />
tering in the arrival directions <strong>of</strong> AGASA’s ultrahigh en- 222<br />
ergy cosmic rays, APP 21, 359-367, 2004 223<br />
194<br />
195<br />
196<br />
197<br />
198<br />
199<br />
References<br />
[1] M. Ageron et al. (<strong>ANTARES</strong> Collaboration),<br />
<strong>ANTARES</strong>: the first undersea neutrino telescope, to<br />
appear in NIM A, 2011<br />
[2] D. Palioselitis for the <strong>ANTARES</strong> Collaboration, Muon<br />
energy reconstruction and atmospheric neutrino spec-