You also want an ePaper? Increase the reach of your titles
YUMPU automatically turns print PDFs into web optimized ePapers that Google loves.
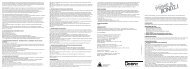
Braem<br />
Fig 1 Positioning of the dentin sample with the surface to be<br />
tested oriented downwards on a Plexiglas plate.<br />
Fig 2 Top view of the test jig after preparation of the bond and<br />
placement of the perforated Mylar strip. The upper part of the jig<br />
is fixed prior to the application of the restorative material.<br />
the adhesive maximum and stressed until failure or 10 4 cycles.<br />
The applied stress in each succeeding test was increased<br />
or decreased by a fixed increment of stress, according<br />
to whether the previous test resulted in failure or no<br />
failure, also described as a staircase approach. 6 This fixed<br />
increment is based on pilot testing and fixed at 8% of the microshear<br />
strength.<br />
The results of the fatigue test were analyzed using logistic<br />
regression 4 to determine the load at which 50% of the<br />
specimens fail, further referred to as the “median microshear<br />
fatigue resistance” or μSFR. To compare the fatigue<br />
data obtained from the different experimental groups, a multiple<br />
logistic regression analysis was conducted (Statistica<br />
6.0, StatSoft; Tulsa, OK, USA).<br />
RESULTS<br />
The microshear strength and the μSFR for each material are<br />
given in Table 2. The μSFR was about 43% lower than the respective<br />
microshear strength value (Table 2), ranging from<br />
24% in the case of Optibond Solo Plus and iBond, up to 76%<br />
for Clearfil Protect Bond.<br />
Comparing the slope β 1 obtained from the logistic regression<br />
(Table 2), a very steep curve can be seen for Xeno III<br />
(β 1 = 6.5079) and Adper Prompt-L-Pop (β 1 = 5.8161), being<br />
almost 10 times steeper than that of the other resin bonding<br />
agents. In Xeno III, failures were noted after 145, 915, 196,<br />
565, 645, 1465 and 460 cycles and after 245, 1625, 150,<br />
1080, 550, 3595 and 270 cycles for Adper Prompt-L-Pop.<br />
The same can be said, although to a lesser degree, of Fuji II<br />
LC (β 1 = 1.1195) with failures at 75, 30, 65, 185, 55, 6750,<br />
40, 565, 7540, 50, and 80 cycles. G-Bond on the other hand<br />
shows a rather flat curve with β 1 = 0.1652, with failures noted<br />
at 65, 130, 135, 4430, 9475, 260, 55, and 155 cycles.<br />
Using the results from the logistic regression, the 25%<br />
Fig 3 Placement of the test jig in the fatigue machine. The jig is<br />
fixed using compressed air (1). The piezo-electric force transducers<br />
(2) record the applied loads.<br />
and 75% quartiles can be calculated, giving an indication of<br />
the range of the results around the μSFR (Table 2). Comparing<br />
the different adhesives using multiple logistic regression,<br />
the bond strength in MPa (p < 0.0001) as well as<br />
the adhesive (p = 0.0003) contribute significantly to the<br />
model.<br />
DISCUSSION<br />
The lack of fatigue data in the dental literature on adhesive<br />
interfaces is profound. Only some data are available today,<br />
4,5,7,10,12,13 in spite of the necessity to complete the quasi-static<br />
bond strength tests with clinically relevant dynamic<br />
fatigue data. A prerequisite is that the setup is of clinical rel-<br />
Vol 9, Supplement 2, 2007 251