Create successful ePaper yourself
Turn your PDF publications into a flip-book with our unique Google optimized e-Paper software.
Blunck/Zaslansky<br />
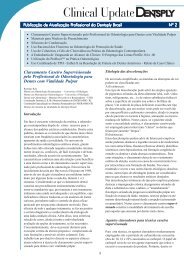
0<br />
20<br />
40<br />
60<br />
80<br />
100 %<br />
+<br />
Syntac<br />
OptiBond FL<br />
Clearfil SE Bond<br />
a.<br />
MQ1<br />
results after<br />
2 nd TC<br />
enamel<br />
+<br />
+<br />
*<br />
*<br />
*<br />
Prompt L-Pop 1999<br />
Prompt L-Pop 2000<br />
Adper Prompt L-Pop / Tetric Ceram<br />
Adper Prompt L-Pop / Filtek Z250<br />
Xeno III / Quixfil<br />
Xeno III / Tetric Ceram<br />
Xeno III / Dyract eXtra<br />
Futurabond NR<br />
One-up Bond F Plus<br />
AQ Bond<br />
iBond<br />
G-Bond<br />
Hybrid Bond<br />
tri-S bond<br />
+<br />
Syntac<br />
OptiBond FL<br />
Clearfil SE Bond<br />
b.<br />
MQ1<br />
results after<br />
3 rd TC<br />
enamel<br />
+<br />
Prompt L-Pop 1999<br />
Prompt L-Pop 2000<br />
Adper Prompt L-Pop / Tetric Ceram<br />
Adper Prompt L-Pop / Filtek Z250<br />
0<br />
20<br />
40<br />
6<br />
0<br />
80<br />
*<br />
100 %<br />
Xeno III / Tetric Ceram<br />
Xeno III / Dyract eXtra<br />
AQ Bond<br />
iBond<br />
Fig 1 Results of marginal quality<br />
1 in % relative to the enamel margin<br />
length in Class V cavities for<br />
self-etching adhesive systems<br />
after (a) 1-year water storage and<br />
a 2nd TC and (b) after after 3-<br />
year water storage and a 3rd TC<br />
(o and + = outliers, * = statistically<br />
significantly different compared<br />
to Syntac, Opti Bond FL,<br />
and Clearfil SE Bond, p < 0.05).<br />
weighted by the SE) through the six MQ1 data points for every<br />
product. The slopes of these regression lines, as well as the<br />
95% confidence intervals and r 2 values are also shown in<br />
Table 3 (columns I to L), and they provide an overall estimate<br />
of the trend for the deterioration of the MQ1 results for each<br />
product. A general linear deterioration was observed for all<br />
groups (see example plots in Fig 3), which shows that the deterioration<br />
rate is not consistent over time. Furthermore, for<br />
all the products, the overall trend (column I) only occasionally<br />
corresponds to the trend of the intermediate segments<br />
(columns A, C, E, and G in Table 3).<br />
Finally, to better understand how well the data from the<br />
first year can be used to predict the trend in the performance<br />
of each product over a period of 3 years, the trends of T1 -<br />
T4 were calculated and used to derive a percent deviation<br />
estimate relative to the regressed overall trend (the difference<br />
divided by the slope of the overall trend as %, shown in<br />
Table 3, column M). Note that for some of the products (Opti-<br />
Bond FL, AQ Bond, Prompt L Pop 2000, Adper Prompt L Pop,<br />
and Xeno III) a reasonable (≤ 10%) prediction was found,<br />
while for others, deviations of 20%, 30% or even 40% exist.<br />
DISCUSSION<br />
Effectiveness of adhesive systems can be generally judged<br />
by the marginal adaptation of composite resin restorations<br />
at the interface with the tooth substrate. Marginal adaptation<br />
is affected by many different parameters. These might<br />
be greatly influenced by the inherent properties of the<br />
restorative material, such as shrinkage and shrinkage<br />
stress, 24 the chemistry of the adhesive system used, the size<br />
234 The Journal of Adhesive Dentistry