
Create successful ePaper yourself
Turn your PDF publications into a flip-book with our unique Google optimized e-Paper software.
Blunck/Zaslansky<br />
composites were used. The composite resin was inserted in<br />
two increments (initially placed at the cervical margin), and<br />
each increment was light cured (Astralis 10 light-curing unit,<br />
Ivoclar Vivadent; Ellwangen, Germany) for 40 s. After finishing<br />
and polishing (Sof-Lex Pop-on Nr. 1981 SF/F/M/C 3M<br />
ESPE; St Paul, MN, USA), the teeth were returned to water<br />
storage for 21 days, followed by 2000 cycles of thermocycling<br />
(TC) between +5 and +55°C.<br />
Prior to and after TC, impressions were taken with a<br />
polyvinylsiloxane material (Silagum light body, DMG; Hamburg,<br />
Germany) and replicas of the restoration and surrounding<br />
tooth structures were produced. These were cast<br />
with an epoxy resin following precise manufacturer guidelines<br />
(Stycast 1266 Part A + B; Emerson and Cumming; Westerlo-Oevel,<br />
Belgium). Once fully cured, each replica was sputter-gold<br />
coated (SCD 030, Balzers Union; Balzers, Liechtenstein)<br />
in preparation for inspection by SEM. Similar impression<br />
and TC procedures were repeated after 1 year of water<br />
storage, and for 11 products also after 3 years.<br />
The effectiveness of each bonding system was assessed<br />
by evaluating the margins of the restorations at the<br />
dentin/composite and enamel/composite interface. Measurements<br />
were performed using a dedicated SEM (AMRAY<br />
1810, Amray; Bedford, MA, USA) and all replicas were viewed<br />
at a magnification of 200X, and classified according to the<br />
state of the margin in different areas in order to numerically<br />
quantify the marginal qualities, as detailed in Table 2. By<br />
using this method, each segment of the tooth/restoration interface<br />
was imaged and ranked according to defined quality<br />
criteria. These were then converted into percentage of the<br />
total margin length, in dentin and enamel independently.<br />
Statistical evaluation was performed using an SPSS statistical<br />
software package (SPSS Software; München, Germany).<br />
Within each sample group, significant differences<br />
were determined using the nonparametric Wilcoxon test. For<br />
comparison between the different treatment groups, the<br />
nonparametric Kruskal-Wallis test was used followed by Bonferroni<br />
adjustment. The statistics were calculated for the parameter<br />
margin quality 1 (MQ1 = “excellent” or “continuous”<br />
margin). Origin 7.0 SR0 (Originlab; Northampton, MA, USA)<br />
was used for the weighted regression and Microsoft Excel<br />
(2000) was used to determine the slopes between MQ1<br />
rankings at different stages of the experiment.<br />
RESULTS<br />
The results of the 14 test groups were compared with those<br />
of the 3 reference multi-bottle adhesives OptiBond FL, Syntac,<br />
and Clearfil SE Bond. Figure 1 is a box-and-whiskers plot<br />
of the marginal quality MQ1results determined for the enamel<br />
margins, depicting the median, 25 and 75 percentiles.<br />
The main result seen here is that after 1 year of water storage<br />
(Fig 1a) and following a second TC, a reduction (significant<br />
at p < 0.05) in the amounts of “continuous margins”<br />
(MQ1) is seen for G-Bond, AQ-Bond, Hybrid Bond, and Oneup<br />
Bond F Plus. No significant difference was found between<br />
any other of the groups and the reference adhesives. After<br />
3 years of water storage and a third TC, only AQ Bond had a<br />
substantially lower MQ1 score (p < 0.05).<br />
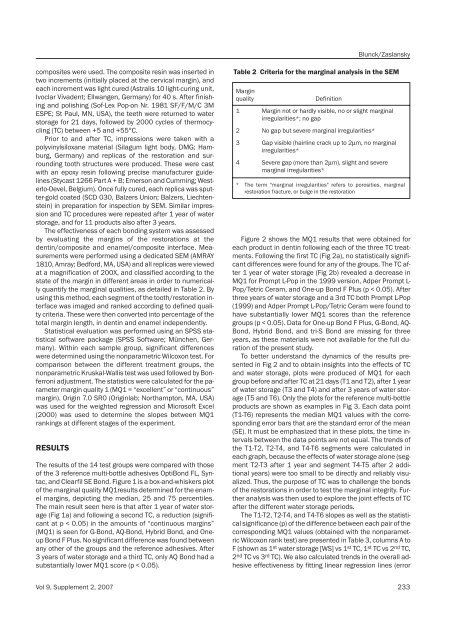
Table 2 Criteria for the marginal analysis in the SEM<br />
Margin<br />
quality<br />
Definition<br />
1 Margin not or hardly visible, no or slight marginal<br />
irregularities*; no gap<br />
2 No gap but severe marginal irregularities*<br />
3 Gap visible (hairline crack up to 2μm, no marginal<br />
irregularities*<br />
4 Severe gap (more than 2μm), slight and severe<br />
marginal irregularities*<br />
* The term "marginal irregularities" refers to porosities, marginal<br />
restoration fracture, or bulge in the restoration<br />
Figure 2 shows the MQ1 results that were obtained for<br />
each product in dentin following each of the three TC treatments.<br />
Following the first TC (Fig 2a), no statistically significant<br />
differences were found for any of the groups. The TC after<br />
1 year of water storage (Fig 2b) revealed a decrease in<br />
MQ1 for Prompt L-Pop in the 1999 version, Adper Prompt L-<br />
Pop/Tetric Ceram, and One-up Bond F Plus (p < 0.05). After<br />
three years of water storage and a 3rd TC both Prompt L-Pop<br />
(1999) and Adper Prompt L-Pop/Tetric Ceram were found to<br />
have substantially lower MQ1 scores than the reference<br />
groups (p < 0.05). Data for One-up Bond F Plus, G-Bond, AQ-<br />
Bond, Hybrid Bond, and tri-S Bond are missing for three<br />
years, as these materials were not available for the full duration<br />
of the present study.<br />
To better understand the dynamics of the results presented<br />
in Fig 2 and to obtain insights into the effects of TC<br />
and water storage, plots were produced of MQ1 for each<br />
group before and after TC at 21 days (T1 and T2), after 1 year<br />
of water storage (T3 and T4) and after 3 years of water storage<br />
(T5 and T6). Only the plots for the reference multi-bottle<br />
products are shown as examples in Fig 3. Each data point<br />
(T1-T6) represents the median MQ1 values with the corresponding<br />
error bars that are the standard error of the mean<br />
(SE). It must be emphasized that in these plots, the time intervals<br />
between the data points are not equal. The trends of<br />
the T1-T2, T2-T4, and T4-T6 segments were calculated in<br />
each graph, because the effects of water storage alone (segment<br />
T2-T3 after 1 year and segment T4-T5 after 2 additional<br />
years) were too small to be directly and reliably visualized.<br />
Thus, the purpose of TC was to challenge the bonds<br />
of the restorations in order to test the marginal integrity. Further<br />
analysis was then used to explore the joint effects of TC<br />
after the different water storage periods.<br />
The T1-T2, T2-T4, and T4-T6 slopes as well as the statistical<br />
significance (p) of the difference between each pair of the<br />
corresponding MQ1 values (obtained with the nonparametric<br />
Wilcoxon rank test) are presented in Table 3, columns A to<br />
F (shown as 1 st water storage [WS] vs 1 st TC, 1 st TC vs 2 nd TC,<br />
2 nd TC vs 3 rd TC). We also calculated trends in the overall adhesive<br />
effectiveness by fitting linear regression lines (error<br />
Vol 9, Supplement 2, 2007 233