CLIMATOLOGY And It's APPLICATION - RTC, Regional Training ...
CLIMATOLOGY And It's APPLICATION - RTC, Regional Training ...
CLIMATOLOGY And It's APPLICATION - RTC, Regional Training ...

You also want an ePaper? Increase the reach of your titles
YUMPU automatically turns print PDFs into web optimized ePapers that Google loves.
<strong>CLIMATOLOGY</strong><br />
<strong>And</strong> It’s <strong>APPLICATION</strong><br />
Mesut DEMIRCAN<br />
Geodesy & Photogrammetry Engineer<br />
Department of Agricultural Meteorology<br />
and Climatological Observations<br />
Climatology Division
DEFINITION OF CLIMATE AND <strong>CLIMATOLOGY</strong><br />
Climate<br />
Climate (from Ancient Greek klima, meaning inclination, or is referring to the<br />
supposed slope of the earth and approximating our concept of latitude) is<br />
commonly defined as the weather averaged over a long period of time. In other<br />
words, climate is the average weather conditions experienced in a particular place<br />
over a long period.<br />
Worldwide climate classifications
Climate is defined as the collective state of the atmosphere for a given place<br />
over a specified interval of time. There are three parts to this definition.<br />
The first deals with the state of the atmosphere. The collective state is<br />
classified based on some set of statistics. The most common statistic is the mean, or<br />
average. Climate descriptions are made from observations of the atmosphere and<br />
are described in terms of averages (or norms) and extremes of a variety of weather<br />
parameters, including temperature, precipitation, pressure and winds.<br />
The second part of the climate definition deals with a location. It could be a<br />
climate the size of a cave, vilage, city, country, continent or the world. In weather<br />
and climate studies we are most interested in micro-scale, regional, and global<br />
climates. The climate of a given place should be defined in terms of your purpose.<br />
Time is the final aspect of the definition of climate. A time span is crucial to<br />
the description of a climate. Weather and climate both vary with time. Weather<br />
changes from day to day. Climate changes over much longer periods of time.<br />
Variations in climate are related to shifts in the energy budget and resulting changes<br />
in atmospheric circulation patterns.
Climatology (from Ancient Greek klima, “region, zone” and -logos or -logia, a<br />
discourse or study) is the study of climate, scientifically defined as weather<br />
conditions averaged over a period of time, and is a branch of the atmospheric<br />
sciences.<br />
Climatology is the study of climate, its variations, and its impact on a variety of<br />
activities including (but far from limited to) those that affect human health, safety<br />
and welfare. Climate, in a narrow sense, can be defined as the average weather. In a<br />
wider sense, it is the state of the climate system. Climate can be described in terms<br />
of statistical descriptions of the central tendencies and variability of relevant<br />
elements such as temperature, rainfall, and windiness, or through combinations of<br />
elements, such as weather types, that are typical to a location, region or the world<br />
for any time period. Climate is not limited by national boundaries.
Aim’s of climatology, is the object to climatology to make us familiar with the<br />
average condition of the atmosphere in different part of the earth’s surface, as well<br />
as to inform us concerning any departures from these conditions which may occur at<br />
the same place during long intervals of time. Brevity demands that in the description<br />
of the climate of any place, only those weather conditions which are of most<br />
frequent occurrence, i.e., the mean conditions, shall be used to characterize it. To<br />
give in detail the whole history of the weather phenomena of the district is obviously<br />
out of the question. Nevertheless, if we are to present a correct picture, and if the<br />
information furnished is to be of practical value, some account should also be given<br />
of the extent to which, in individual cases, there may be departures from the average<br />
conditions.
There are three principal approaches to the study of climatology:<br />
The physical climatology approach seeks to explain the differences in climate<br />
in light of the physical processes influencing climate and the processes producing<br />
the various kinds of physical climates, such as marine, desert, and mountain.<br />
Physical climatology deals with explanations of climate rather than with<br />
presentations.<br />
Descriptive climatology typically orients itself in terms of geographic regions;<br />
it is often referred to as regional climatology. A description of the various types of<br />
climates is made on the basis of analyzed statistics from a particular area. A further<br />
attempt is made to describe the interaction of weather and climatic elements upon<br />
the people and the areas under consideration. Descriptive climatology is presented<br />
by verbal and graphic description without going into causes and theory.<br />
Dynamic climatology attempts to relate characteristics of the general<br />
circulation of the entire atmosphere to the climate. Dynamic climatology is used by<br />
the theoretical meteorologist and addresses dynamic and thermodynamic effects.
CLIMATOLOGICAL DIVISION<br />
Spatial Scale of Climatology: It’s goal in the orderly arrangement and<br />
explanation of spatial patterns. It includes the identification of significant<br />
climate characteristics and the classification of climate types, thus providing a<br />
link between the physical bases of climate and the investigation of problems in<br />
applied climatology.<br />
Microclimatology: Microclimatologic all studies often measure smallscale<br />
contrasts, such as between hilltop and valley or between city and<br />
surrounding country. For example, microclimate (topoclimate) is related to<br />
the climate of a site e.g. a climate station or the climate of a locality e.g. a<br />
valley or hillside.<br />
Mesoclimatology: Mesoclimatology embraces a rather indistinct middle<br />
ground between macroclimatology and microclimatology. For example,<br />
mesoclimate is related to the climate of a region e.g. southern Oregon.<br />
Macroclimatology: Macroclimatology is the study of the large-scale<br />
climate of a large area or country. For example, macroclimate is related to<br />
the climate of a large area e.g. a continent or the climate of the planet.
CLIMATOLOGICAL DIVISION<br />
Temporal Scale of Climatology:<br />
A temporal scale is an interval of time. It can range from minutes and hours<br />
to decades to centuries and longer. The characteristics of an element over an hour<br />
are important, for example, in agricultural operations such as pesticide control and<br />
in monitoring energy usage for heating and cooling. The characteristics of an<br />
element over a day might determine, for example, the human activities that can be<br />
safely pursued. The climate over months or years can determine, for example, the<br />
crops that can be grown or the availability of drinking water. Longer time scales of<br />
decades and centuries are important for studies of climate variation caused by<br />
natural phenomena such as atmospheric and oceanic circulation changes and by the<br />
activities of humans.
As with the different scales of weather, a discussion of climate must also<br />
specify the size of the area under discussion. The different climate scales, global,<br />
regional, and microscale, are indicated in figure. Climate varies from location to<br />
location and with time to time.
CLIMATOLOGICAL<br />
DIVISION<br />
Applied Climatology: Applied climatology aims to make the maximum use of<br />
meteorological and climatological knowledge and information for solving<br />
practical social, economic and environmental problems. Climatological services<br />
have been designed for a variety of public, commercial and industrial users.<br />
Further, assessments of the impact of climate variability and climate change on<br />
human activities, as well as the impact of human activities on climate, are major<br />
factors in local, national and global economic development, social programmes,<br />
and resource management.<br />
Applied Climatology explores the relation of climate to other<br />
phenomena and considers its potential effects on human welfare and even<br />
confronting the possibility of modifying climate to meet human needs. Thus<br />
applied climatology emphasizes relation, collaboration and interdependence of<br />
many sciences and utility of climatic data and information. New combinations of<br />
climatology and other sciences include such as Paleoclimatology,<br />
Hydroclimatology, Agroclimatology, Bioclimatology, Medical climatology,<br />
Building climatology and Urban climatology, etc.
Paleoclimatology<br />
Determining past climates is like solving a mystery. We must search<br />
for evidence that identifies the meteorological character of a given time period.<br />
The data must offer a consistent story while obeying physical laws. Fossils, tree<br />
rings, ocean sediments, and air bubbles trapped in glaciers all provide clues to<br />
the mystery. This combined evidence indicates that today's climate is<br />
fundamentally different than that of a million years ago. But, knowing that<br />
climate has varied does not explain the cause of these differences
The Climate System<br />
The climate system consists of the atmosphere, hydrosphere, cryosphere, surface<br />
lithosphere, and biosphere.
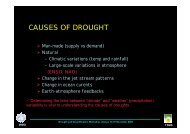
The five basic climate controls are:<br />
Latitude -determines solar energy input<br />
Elevation -influences temperature and precipitation<br />
Topography -Mountain barriers up wind can affect precipitation of a region<br />
as well as temperature. Topography also affects the distribution of cloud<br />
patterns and thus solar energy reaching the surface.<br />
Large bodies of water -thermal stability of water moderates the temperature<br />
of regions<br />
Atmospheric circulation - Large-scale circulation patterns exert a systematic<br />
impact on the climate of a region. These controls produce variations in<br />
temperature and precipitation
Atmospheric circulation patterns<br />
Energy from the Sun heats the entire Earth, but this heat is unevenly<br />
distributed across the Earth's surface. Equatorial and tropical regions receive far<br />
more solar energy than the midlatitudes and the polar regions.<br />
The tropics receive more heat radiation than they emit, while the polar<br />
regions emit more heat radiation than they receive. If no heat was transferred from<br />
the tropics to the polar regions, the tropics would get hotter and hotter while the<br />
poles would get colder and colder. This latitudinal heat imbalance drives the<br />
circulation of the atmosphere and oceans. Around 60% of the heat energy is<br />
redistributed around the planet by the atmospheric circulation and around 40% is<br />
redistributed by the ocean currents.
Atmospheric Circulation<br />
One way to transfer heat from the equator to the poles would be to have a single<br />
circulation cell where air moved from the tropics to the poles and<br />
back. This single-cell circulation model was first proposed by Hadley in the<br />
1700’s.<br />
Air circulation around the globe would be<br />
simple (and the weather boring) if the Earth did<br />
not rotate and the rotation was not tilted<br />
relative to the Sun.<br />
Hypothetical circulation for a nonrotating<br />
Earth.
Since the Earth rotates, its axis is tilted and there is more land in the Northern<br />
Hemisphere than in the Southern Hemisphere, the actual global air circulation<br />
pattern is much more complicated. Instead of a single-cell circulation, the<br />
global model consists of three circulation cells in each hemisphere. These three cells<br />
are known as the tropical cell (also called the Hadley cell), the midlatitude cell and<br />
the polar cell.
1. Tropical cell (Hadley cell) - Low latitude air moves towards the Equator and heats<br />
up. As it heats it rises vertically and moves polewards in the upper atmosphere.<br />
This forms a convection cell that dominates tropical and sub-tropical climates.<br />
2. Midlatitude cell (Ferrel cell) - A mid-latitude mean atmospheric circulation cell for<br />
weather named by Ferrel in the 19th century. In this cell the air flows polewards<br />
and towards the east near the surface and equatorward and in a westerly<br />
direction at higher levels.<br />
3. Polar cell - Here air rises, spreads out and travels toward the poles. Once over the<br />
poles, the air sinks forming the polar highs. At the surface, the air spreads out<br />
from the polar highs. Surface winds in the polar cell are easterly (polar<br />
easterlies).<br />
Although still oversimplified, this three cell model can describe the main features of<br />
atmospheric circulation.
Main wind belts: Because the Coriolis force acts to the<br />
right of the flow (in the Northern Hemisphere), the flow<br />
around the 3-cells is deflected. This gives rise to the<br />
three main wind belts in each hemisphere at the surface:<br />
The easterly trade winds in the tropics, The prevailing<br />
westerlies, The polar easterlies<br />
Doldrums, ITCZ: The doldrums are the region near the<br />
equator where the trade winds from each hemisphere<br />
meet. This is also where you find the intertropical<br />
convergence zone (ITCZ). It is characterized by hot,<br />
humid weather with light winds. Major tropical rain<br />
forests are found in this zone. The ITCZ migrates north<br />
in July and south in January.<br />
Horse latitudes: The horse latitudes are the region<br />
between the trade winds and the prevailing<br />
westerlies. In this region the winds are often light or<br />
calm, and were so-named because ships would often<br />
have to throw their horses overboard due to lack of feed<br />
and water.<br />
Polar font: The polar front lies between the polar<br />
easterlies and the prevailing westerlies.<br />
Surface Features of the Global<br />
Atmospheric Circulation System
Pressure belts: The three-cell circulation model has the following pressure belts associated<br />
with it :<br />
Equatorial low – A region of low pressure associated with the rising air in the<br />
ITCZ. Warm air heated at the equator rises up into the atmosphere leaving a low pressure<br />
area underneath. As the air rises, clouds and rain form.<br />
Subtropical high – A region of high pressure associated with sinking air in the horse<br />
latitudes. Air cools and descends in the subtropics creating areas of high pressure with<br />
associated clear skies and low rainfall. The descending air is warm and dry and deserts form<br />
in these regions.<br />
Subpolar low – A region of low pressure associated with the polar front.<br />
Polar high – A high pressure region associated with the cold, dense air of the polar regions.<br />
In reality, the winds are not steady and the pressure belts are not continuous.<br />
"Ideal" Zonal Pressure<br />
Belts<br />
An imaginary uniform<br />
Earth with idealised<br />
zonal (continuous)<br />
pressure belts.<br />
Actual Zonal Pressure<br />
Belts<br />
Large landmasses<br />
disrupt the zonal<br />
pattern breaking up<br />
the pressure zones<br />
into semipermanent<br />
high and low pressure<br />
belts.
There are three main reasons for this:<br />
The surface of the Earth is not uniform or smooth. There is uneven heating due to<br />
land/water contrasts.<br />
The wind flow itself can become unstable and generate “eddies.”<br />
The sun doesn’t remain over the equator, but moves from 23.5 o N to 23.5 o S and<br />
back over the course of a year.
Global climate is the largest spatial scale. We are concerned with the global<br />
scale when we refer to the climate of the globe, its hemispheres, and<br />
differences between land and oceans. Energy input from the sun is largely<br />
responsible for our global climate. The solar gain is defined by the orbit of<br />
Earth around the sun and determines things like the length of seasons. The<br />
distribution of land and ocean is another import influence on the climatic<br />
characteristics of the Earth. Contrasting the climate of the Northern<br />
Hemisphere, which is approximately 39% land, with the Southern Hemisphere,<br />
which only has 19% land, demonstrates this. The yearly average temperature<br />
of the Northern Hemisphere is approximately 15.2°C, while that of the<br />
Southern Hemisphere is 13.3°C.<br />
The presence of the water reduces the annual average temperature. The land<br />
reduces the winter average temperature while increasing the average<br />
temperature during summer. As a result, the annual amplitude of the seasonal<br />
temperature is nearly twice as great for the Northern Hemisphere. The<br />
Northern Hemisphere has a large variation in the monthly mean temperature.<br />
The land absorbs and loses heat faster than the water. Over land, the heat is<br />
distributed over a thin layer, while conduction, convection and currents mix<br />
the energy over a fairly thick layer of water. Soil, and the air near it, therefore<br />
follows radiation gains more closely than water. For this reason, continental<br />
climates have a wider temperature variation
Instead, there are semi-permanent high- and low-pressure systems. They are semipermanent<br />
because they vary in strength or position throughout the year.<br />
Wintertime ;<br />
Polar highs develop over Siberia and Canada<br />
The Pacific High, Azores High (parts of the subtropical high pressure system) Aleutian<br />
Low and Icelandic Low form<br />
Summertime ;<br />
The Azores high migrates westward and intensifies to become the Bermuda High<br />
The Pacific high also moves westward and intensifies<br />
Polar highs are replaced by low pressure<br />
A low pressure region forms over southern Asia
The Monthly Average Temperature<br />
The Monthly Average Precipitation<br />
Winter Summer Year Annual<br />
Range<br />
NH 8.1C 22.4C 15.2C 14.3C<br />
SH 9.7C 17.0C 13.3C 7.3C<br />
Differe<br />
nce<br />
-1.6C 5.4C 1.9C 7.0C
<strong>Regional</strong> climates are occurs by controls in follow;<br />
Latitude -determines solar energy input<br />
Elevation -influences temperature and precipitation<br />
Topography -Mountain barriers up wind can affect precipitation of a region<br />
as well as temperature. Topography also affects the distribution of cloud<br />
patterns and thus solar energy reaching the surface.<br />
Large bodies of water - thermal stability of water moderates the temperature<br />
of regions<br />
Atmospheric circulation
Large mountains influence regional climates. For example Turkey’s diverse<br />
regions have different climates because of irregular topography. Taurus<br />
Mountains is close to the coast and rain clouds cannot penetrate to the interior<br />
part of the country. Rain clouds drop most of their water on the coastal area.<br />
As rain clouds pass over the mountains and reach central Anatolia they have<br />
no significant capability to produce of rain<br />
The Mountain influence<br />
on Turkey precipitation<br />
A big difference is<br />
observed when the total<br />
rainfall between<br />
coastal stations and inland<br />
stations, are compared
Vegetation<br />
Vegetation also affects regional climate an observation made obvious when<br />
comparing the wind speed within a forest with the wind speed at the same<br />
height over an open field. Friction reduces the wind speed in the forest, so<br />
open areas have greater winds. The relative humidity is usually greater in a<br />
forest than in the surrounding open country. Forests depress the summer<br />
temperatures by 1 to 2 C (2-4F) below the annual mean in their vicinity. This<br />
temperature difference is driven by heat budget differences; less solar energy<br />
reaches the forest floor than the open field.
World vegetation
Characteristics and uses of climate observations<br />
Climate observations are important because they help satisfy important social,<br />
economic and environmental needs. They are an integral part of reducing the risk of<br />
loss of life and damage to property.<br />
Climate observations are<br />
sourced from the numerous<br />
meteorological and related<br />
observational networks and<br />
systems that underpin<br />
applications such as<br />
weather forecasting, air<br />
pollution modelling and<br />
environmental impact<br />
assessments.
However, climate observations differ in a number of important respects.<br />
Climate observations need to account for the full range of elements that describe<br />
the climate system – not just those that describe the atmosphere. Extensive<br />
observations of the ocean and terrestrial-based systems are required.<br />
An observation at any point in time needs a reference climate against which it can<br />
be evaluated, i.e. a reference climatological period must be selected. In this regard,<br />
the observations from a station that only exists for a short period (i.e. from days to a<br />
few years) or which relocates very frequently will generally be of less value than<br />
those observations from a station whose records have been maintained to established<br />
standards over many years. Thus, in order to derive a satisfactory climatological<br />
average (or normal) for a particular climate element, a sufficient period record of<br />
homogeneous, continuous and good quality observations for that element is<br />
required.<br />
A climate observation should be associated – either directly or indirectly - with a<br />
set of metadata that will provide users with information, often implicitly, on how the<br />
observation should be interpreted and used. Other differences can be inferred from<br />
the sections that follow. So, while climate observations serve multiple purposes<br />
beyond specific climate needs, we must ensure that they retain, and acquire,<br />
particular characteristics that serve a range of climate needs.
Ten climate monitoring principles<br />
1. The impact of new systems or changes to existing systems should be assessed<br />
prior to implementation. Relevant changes are those affecting instruments,<br />
observing practices, observation locations, sampling rates, etc (which are made<br />
due to developing technologies, cost saving, etc).<br />
2. A suitable period of overlap for new and old observing systems is required.<br />
Parallel observation programs between existing observation systems and their<br />
replacements (or between new and old meteorological sites in the event of a<br />
relocation) should be part of any strategy to preserve the continuity and<br />
homogeneity of the climate record.
3. The details and history of local conditions, instruments, operating procedures,<br />
data processing algorithms and other factors pertinent to interpreting data<br />
(metadata) should be documented and treated with the same care as the data<br />
themselves. Good quality metadata are now critical to meteorological services,<br />
particularly for climate operations and research. There is a need for ready<br />
access to metadata (i.e. preferably in electronic form) for: data interpretation;<br />
quality control; network selection; network/system performance monitoring;<br />
client expectations; international obligations (e.g. for GCOS Surface<br />
Networks); and identification and adjustment of climate records for nonclimatic<br />
discontinuities.<br />
Modern databases are providing efficient access to important station metadata, including photographs, site plans and other<br />
useful documents. (Source: Central Institute of Meteorology and Geodynamics ZAMG, Austria)
4. The quality and homogeneity of data should be regularly assessed as a part of routine<br />
operations. Meteorological services should endeavour to develop a Data Management<br />
policy with strategies that involve a strong focus on data quality, and including laboratory<br />
and testing facilities, quality assurance processes, real-time monitoring and correction,<br />
quality control procedures and data archiving.<br />
5. Consideration of the needs for<br />
environmental and climate‐monitoring<br />
products and assessments should be<br />
integrated into national, regional and<br />
global observing priorities. Climatologists<br />
need to identify the observational<br />
priorities for their countries based on the<br />
capabilities of existing networks and<br />
systems to satisfy a range of climate<br />
needs. As well as quality requirements,<br />
climatologists should ensure that networks<br />
provide adequate spatial and temporal<br />
sampling.
6. Operation of historically‐uninterrupted stations and observing systems should be<br />
maintained. This principle is another that is fundamental to the production of<br />
homogeneous and continuous climate records. Countries have been encouraged<br />
to identify stations in a number of special networks established for long-term<br />
climate monitoring , which will help satisfy this goal.
7. High priority for additional observations should be focused on data‐poor areas,<br />
poorly‐observed parameters, areas sensitive to change, and key measurements<br />
with inadequate temporal resolution. National, regional and global network<br />
adequacy assessments are pertinent here. The development of improved<br />
observational technologies should focus on those observations and regions for<br />
which capturing quality observations have proven problematic (e.g. precipitation<br />
in cold climates).<br />
8. Long‐term requirements should be specified to network designers, operators and<br />
instrument engineers at the outset of system design and implementation.<br />
Sustainable climate monitoring can only be achieved through a shared<br />
understanding, and considerable liaison, between observation network and<br />
system managers, data managers and climatologists. The latter will need to<br />
represent the very broad needs of end-users. There are close parallels here with<br />
the first principle identified, particularly regarding the need for a change<br />
management program.
9. The conversion of research observing systems to long‐term operations in a<br />
carefully‐planned manner should be promoted. The needs of climate imply a<br />
long-term commitment to observing systems is required. For those systems that<br />
have potential for climate monitoring, there needs to be a clear transition plan<br />
(from research to operations) developed.<br />
Processes involved in data rescue.<br />
Old and new side by side. Comparison data being<br />
collected at Helsinki to ensure continuity and<br />
homogeneity of climate records collected from the<br />
former manual station, which operated from 1844.<br />
(Source: Finnish Meteorological Institute, Finland)
10. Data management systems that facilitate access, use and interpretation of data<br />
and products should be included as essential elements of climate monitoring<br />
systems. They include the quality control systems, metadata and various<br />
feedbacks between data users and observation system and network managers<br />
that help preserve the integrity of the climate data. A robust and secure climate<br />
database is the cornerstone to the development and delivery of good quality<br />
products and services. Organizations should strive to develop a data<br />
management policy that secures data on paper-based records as well as those<br />
collected by more direct means.
“PEACE AT HOME,<br />
PEACE IN THE WORLD”<br />
ATATURK<br />
THANKS YOUR ATTENTION<br />
Mesut DEMIRCAN<br />
Geodesy & Photogrammetry Engineer<br />
Department of Agricultural Meteorology and Climatological Observations<br />
Climatology Division<br />
mdemircan@dmi.gov.tr