Budget Message / Highlights - Metropolitan Water Reclamation ...
Budget Message / Highlights - Metropolitan Water Reclamation ... Budget Message / Highlights - Metropolitan Water Reclamation ...
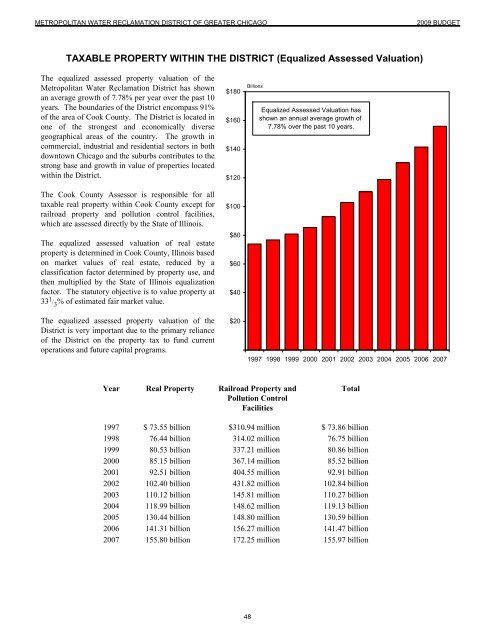
METROPOLITAN WATER RECLAMATION DISTRICT OF GREATER CHICAGO 2009 BUDGET TAXABLE PROPERTY WITHIN THE DISTRICT (Equalized Assessed Valuation) The equalized assessed property valuation of the Metropolitan Water Reclamation District has shown an average growth of 7.78% per year over the past 10 years. The boundaries of the District encompass 91% of the area of Cook County. The District is located in one of the strongest and economically diverse geographical areas of the country. The growth in commercial, industrial and residential sectors in both downtown Chicago and the suburbs contributes to the strong base and growth in value of properties located within the District. The Cook County Assessor is responsible for all taxable real property within Cook County except for railroad property and pollution control facilities, which are assessed directly by the State of Illinois. The equalized assessed valuation of real estate property is determined in Cook County, Illinois based on market values of real estate, reduced by a classification factor determined by property use, and then multiplied by the State of Illinois equalization factor. The statutory objective is to value property at 33 1 / 3 % of estimated fair market value. The equalized assessed property valuation of the District is very important due to the primary reliance of the District on the property tax to fund current operations and future capital programs. $180 $160 $140 $120 $100 $80 $60 $40 $20 Billions Equalized Assessed Valuation has shown an annual average growth of 7.78% over the past 10 years. 1997 1998 1999 2000 2001 2002 2003 2004 2005 2006 2007 Year Real Property Railroad Property and Pollution Control Facilities Total 1997 $ 73.55 billion $310.94 million $ 73.86 billion 1998 76.44 billion 314.02 million 76.75 billion 1999 80.53 billion 337.21 million 80.86 billion 2000 85.15 billion 367.14 million 85.52 billion 2001 92.51 billion 404.55 million 92.91 billion 2002 102.40 billion 431.82 million 102.84 billion 2003 110.12 billion 145.81 million 110.27 billion 2004 118.99 billion 148.62 million 119.13 billion 2005 130.44 billion 148.80 million 130.59 billion 2006 141.31 billion 156.27 million 141.47 billion 2007 155.80 billion 172.25 million 155.97 billion 48 48
METROPOLITAN WATER RECLAMATION DISTRICT OF GREATER CHICAGO 2009 BUDGET M illion $ 1,750 1,650 1,550 1,450 1,350 1,250 1,150 1,050 950 850 750 650 550 450 350 250 150 50 -50 M illion $ 500 $964 387 577 Appropriations and Expenditures, 2000 - 2009 $976 $1,008 344 632 285 723 Expenditures $919 302 $882 277 $969 330 617 605 639 $1,039 Unexpended Appropriations 276 Tax Levies, All Funds, 2000 - 2009 $1,023 266 763 758 $1,428 762 711 $1,631 * Adjusted ** Estimated 2000 2001 2002 2003 2004 2005 2006 2007 2008* 2009** 450 400 350 $355 $373 $382 $398 $413 $411 $401 $409 $426 $412 300 250 200 150 100 50 * Adjusted ** Estimated 0 2000 2001 2002 2003 2004 2005 2006 2007 2008* 2009** Cents / $100 EAV Tax Rates, Actual, All Funds, 2000 - 2009 60 50 40 41.9¢ 41.5¢ 40.1¢ 37.1¢ 36.1¢ 34.7¢ 31.5¢ 30 26.2¢ 27.3¢ 26.5¢ 20 10 0 * Adjusted ** Estimated using 2007 EAV 2000 2001 2002 2003 2003 2005 2006 2007 2008* 2009** 49 49
- Page 9 and 10: METROPOLITAN WATER RECLAMATION DIST
- Page 11 and 12: SECTION I BUDGET FOREWORD BUDGET FO
- Page 13 and 14: METROPOLITAN WATER RECLAMATION DIST
- Page 15 and 16: METROPOLITAN WATER RECLAMATION DIST
- Page 17 and 18: METROPOLITAN WATER RECLAMATION DIST
- Page 19 and 20: METROPOLITAN WATER RECLAMATION DIST
- Page 21 and 22: METROPOLITAN WATER RECLAMATION DIST
- Page 23 and 24: METROPOLITAN WATER RECLAMATION DIST
- Page 25 and 26: METROPOLITAN WATER RECLAMATION DIST
- Page 27 and 28: METROPOLITAN WATER RECLAMATION DIST
- Page 29 and 30: METROPOLITAN WATER RECLAMATION DIST
- Page 31 and 32: METROPOLITAN WATER RECLAMATION DIST
- Page 33 and 34: METROPOLITAN WATER RECLAMATION DIST
- Page 35 and 36: METROPOLITAN WATER RECLAMATION DIST
- Page 37 and 38: METROPOLITAN WATER RECLAMATION DIST
- Page 39 and 40: METROPOLITAN WATER RECLAMATION DIST
- Page 41 and 42: METROPOLITAN WATER RECLAMATION DIST
- Page 43 and 44: METROPOLITAN WATER RECLAMATION DIST
- Page 45 and 46: METROPOLITAN WATER RECLAMATION DIST
- Page 47 and 48: METROPOLITAN WATER RECLAMATION DIST
- Page 49 and 50: METROPOLITAN WATER RECLAMATION DIST
- Page 51 and 52: METROPOLITAN WATER RECLAMATION DIST
- Page 53 and 54: METROPOLITAN WATER RECLAMATION DIST
- Page 55 and 56: METROPOLITAN WATER RECLAMATION DIST
- Page 57 and 58: METROPOLITAN WATER RECLAMATION DIST
- Page 59: METROPOLITAN WATER RECLAMATION DIST
- Page 63 and 64: METROPOLITAN WATER RECLAMATION DIST
- Page 65 and 66: METROPOLITAN WATER RECLAMATION DIST
- Page 67 and 68: METROPOLITAN WATER RECLAMATION DIST
- Page 69 and 70: METROPOLITAN WATER RECLAMATION DIST
- Page 71 and 72: METROPOLITAN WATER RECLAMATION DIST
- Page 73 and 74: METROPOLITAN WATER RECLAMATION DIST
- Page 75 and 76: METROPOLITAN WATER RECLAMATION DIST
- Page 77 and 78: Mr. Richard Lanyon October 21, 2008
- Page 79 and 80: Five-Year Financial Forecast, 2009-
- Page 81 and 82: Five-Year Financial Forecast, 2009-
- Page 83 and 84: METROPOLITAN WATER RECLAMATION DIST
- Page 85 and 86: METROPOLITAN WATER RECLAMATION DIST
- Page 87 and 88: METROPOLITAN WATER RECLAMATION DIST
- Page 89 and 90: SECTION III FINANCIAL STATEMENTS BY
- Page 91 and 92: METROPOLITAN WATER RECLAMATION DIST
- Page 93 and 94: METROPOLITAN WATER RECLAMATION DIST
- Page 95 and 96: METROPOLITAN WATER RECLAMATION DIST
- Page 97 and 98: METROPOLITAN WATER RECLAMATION DIST
- Page 99 and 100: METROPOLITAN WATER RECLAMATION DIST
- Page 101 and 102: METROPOLITAN WATER RECLAMATION DIST
- Page 103 and 104: METROPOLITAN WATER RECLAMATION DIST
- Page 105 and 106: METROPOLITAN WATER RECLAMATION DIST
- Page 107 and 108: METROPOLITAN WATER RECLAMATION DIST
- Page 109 and 110: METROPOLITAN WATER RECLAMATION DIST
METROPOLITAN WATER RECLAMATION DISTRICT OF GREATER CHICAGO<br />
2009 BUDGET<br />
TAXABLE PROPERTY WITHIN THE DISTRICT (Equalized Assessed Valuation)<br />
The equalized assessed property valuation of the<br />
<strong>Metropolitan</strong> <strong>Water</strong> <strong>Reclamation</strong> District has shown<br />
an average growth of 7.78% per year over the past 10<br />
years. The boundaries of the District encompass 91%<br />
of the area of Cook County. The District is located in<br />
one of the strongest and economically diverse<br />
geographical areas of the country. The growth in<br />
commercial, industrial and residential sectors in both<br />
downtown Chicago and the suburbs contributes to the<br />
strong base and growth in value of properties located<br />
within the District.<br />
The Cook County Assessor is responsible for all<br />
taxable real property within Cook County except for<br />
railroad property and pollution control facilities,<br />
which are assessed directly by the State of Illinois.<br />
The equalized assessed valuation of real estate<br />
property is determined in Cook County, Illinois based<br />
on market values of real estate, reduced by a<br />
classification factor determined by property use, and<br />
then multiplied by the State of Illinois equalization<br />
factor. The statutory objective is to value property at<br />
33 1 / 3 % of estimated fair market value.<br />
The equalized assessed property valuation of the<br />
District is very important due to the primary reliance<br />
of the District on the property tax to fund current<br />
operations and future capital programs.<br />
$180<br />
$160<br />
$140<br />
$120<br />
$100<br />
$80<br />
$60<br />
$40<br />
$20<br />
Billions<br />
Equalized Assessed Valuation has<br />
shown an annual average growth of<br />
7.78% over the past 10 years.<br />
1997 1998 1999 2000 2001 2002 2003 2004 2005 2006 2007<br />
Year Real Property Railroad Property and<br />
Pollution Control<br />
Facilities<br />
Total<br />
1997 $ 73.55 billion $310.94 million $ 73.86 billion<br />
1998 76.44 billion 314.02 million 76.75 billion<br />
1999 80.53 billion 337.21 million 80.86 billion<br />
2000 85.15 billion 367.14 million 85.52 billion<br />
2001 92.51 billion 404.55 million 92.91 billion<br />
2002 102.40 billion 431.82 million 102.84 billion<br />
2003 110.12 billion 145.81 million 110.27 billion<br />
2004 118.99 billion 148.62 million 119.13 billion<br />
2005 130.44 billion 148.80 million 130.59 billion<br />
2006 141.31 billion 156.27 million 141.47 billion<br />
2007 155.80 billion 172.25 million 155.97 billion<br />
48<br />
48


