National Electric Transmission Congestion Study - W2agz.com
National Electric Transmission Congestion Study - W2agz.com
National Electric Transmission Congestion Study - W2agz.com
You also want an ePaper? Increase the reach of your titles
YUMPU automatically turns print PDFs into web optimized ePapers that Google loves.
5.2. <strong>Congestion</strong> Areas in the<br />
Eastern Interconnection<br />
Metropolitan New York –<br />
Mid-Atlantic Critical <strong>Congestion</strong><br />
Area<br />
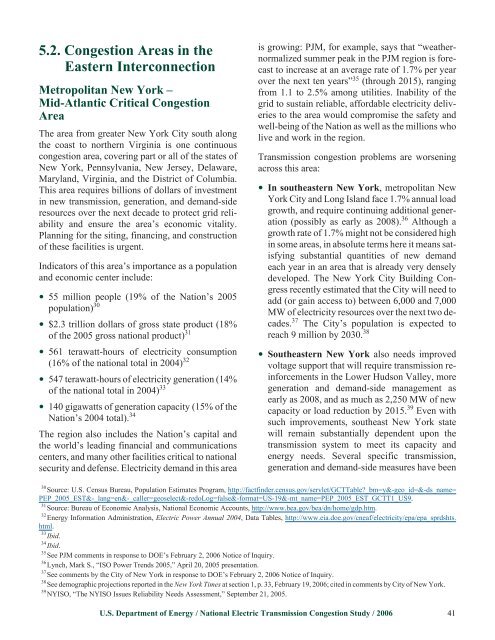
The area from greater New York City south along<br />
the coast to northern Virginia is one continuous<br />
congestion area, covering part or all of the states of<br />
New York, Pennsylvania, New Jersey, Delaware,<br />
Maryland, Virginia, and the District of Columbia.<br />
This area requires billions of dollars of investment<br />
in new transmission, generation, and demand-side<br />
resources over the next decade to protect grid reliability<br />
and ensure the area’s economic vitality.<br />
Planning for the siting, financing, and construction<br />
of these facilities is urgent.<br />
Indicators of this area’s importance as a population<br />
and economic center include:<br />
• 55 million people (19% of the Nation’s 2005<br />
population) 30<br />
• $2.3 trillion dollars of gross state product (18%<br />
of the 2005 gross national product) 31<br />
• 561 terawatt-hours of electricity consumption<br />
(16% of the national total in 2004) 32<br />
• 547 terawatt-hours of electricity generation (14%<br />
of the national total in 2004) 33<br />
• 140 gigawatts of generation capacity (15% of the<br />
Nation’s 2004 total). 34<br />
The region also includes the Nation’s capital and<br />
the world’s leading financial and <strong>com</strong>munications<br />
centers, and many other facilities critical to national<br />
security and defense. <strong>Electric</strong>ity demand in this area<br />
is growing: PJM, for example, says that “weathernormalized<br />
summer peak in the PJM region is forecast<br />
to increase at an average rate of 1.7% per year<br />
over the next ten years” 35 (through 2015), ranging<br />
from 1.1 to 2.5% among utilities. Inability of the<br />
grid to sustain reliable, affordable electricity deliveries<br />
to the area would <strong>com</strong>promise the safety and<br />
well-being of the Nation as well as the millions who<br />
live and work in the region.<br />
<strong>Transmission</strong> congestion problems are worsening<br />
across this area:<br />
• In southeastern New York, metropolitan New<br />
York City and Long Island face 1.7% annual load<br />
growth, and require continuing additional generation<br />
(possibly as early as 2008). 36 Although a<br />
growth rate of 1.7% might not be considered high<br />
in some areas, in absolute terms here it means satisfying<br />
substantial quantities of new demand<br />
each year in an area that is already very densely<br />
developed. The New York City Building Congress<br />
recently estimated that the City will need to<br />
add (or gain access to) between 6,000 and 7,000<br />
MW of electricity resources over the next two decades.<br />
37 The City’s population is expected to<br />
reach 9 million by 2030. 38<br />
• Southeastern New York also needs improved<br />
voltage support that will require transmission reinforcements<br />
in the Lower Hudson Valley, more<br />
generation and demand-side management as<br />
early as 2008, and as much as 2,250 MW of new<br />
capacity or load reduction by 2015. 39 Even with<br />
such improvements, southeast New York state<br />
will remain substantially dependent upon the<br />
transmission system to meet its capacity and<br />
energy needs. Several specific transmission,<br />
generation and demand-side measures have been<br />
30 Source: U.S. Census Bureau, Population Estimates Program, http://factfinder.census.gov/servlet/GCTTable_bm=y&-geo_id=&-ds_name=<br />
PEP_2005_EST&-_lang=en&-_caller=geoselect&-redoLog=false&-format=US-19&-mt_name=PEP_2005_EST_GCTT1_US9.<br />
31 Source: Bureau of Economic Analysis, <strong>National</strong> Economic Accounts, http://www.bea.gov/bea/dn/home/gdp.htm.<br />
32 Energy Information Administration, <strong>Electric</strong> Power Annual 2004, Data Tables, http://www.eia.doe.gov/cneaf/electricity/epa/epa_sprdshts.<br />
html.<br />
33 Ibid.<br />
34 Ibid.<br />
35 See PJM <strong>com</strong>ments in response to DOE’s February 2, 2006 Notice of Inquiry.<br />
36 Lynch, Mark S., “ISO Power Trends 2005,” April 20, 2005 presentation.<br />
37 See <strong>com</strong>ments by the City of New York in response to DOE’s February 2, 2006 Notice of Inquiry.<br />
38 See demographic projections reported in the New York Times at section 1, p. 33, February 19, 2006; cited in <strong>com</strong>ments by City of New York.<br />
39 NYISO, “The NYISO Issues Reliability Needs Assessment,” September 21, 2005.<br />
U.S. Department of Energy / <strong>National</strong> <strong>Electric</strong> <strong>Transmission</strong> <strong>Congestion</strong> <strong>Study</strong> / 2006 41


