Hong Kong Construction Industry Performance Report for 2011
Hong Kong Construction Industry Performance Report for 2011
Hong Kong Construction Industry Performance Report for 2011

Create successful ePaper yourself
Turn your PDF publications into a flip-book with our unique Google optimized e-Paper software.
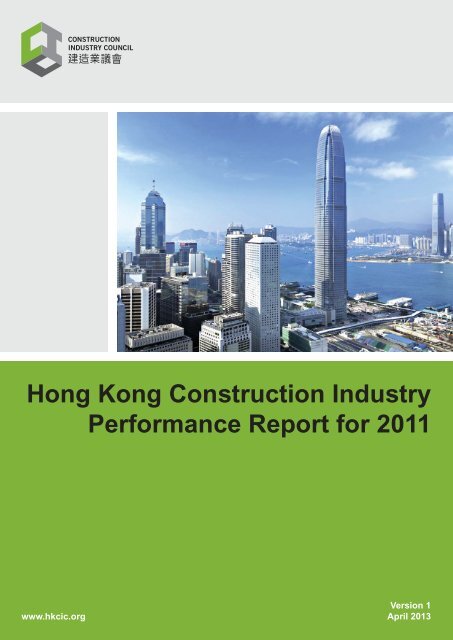
<strong>Hong</strong> <strong>Kong</strong> <strong>Construction</strong> <strong>Industry</strong><br />
<strong>Per<strong>for</strong>mance</strong> <strong>Report</strong> <strong>for</strong> <strong>2011</strong><br />
www.hkcic.org<br />
Version 1<br />
April 2013
Disclaimer<br />
This publication is prepared by the <strong>Construction</strong> <strong>Industry</strong> Council (CIC) in<br />
collaboration with Rider Levett Bucknall Limited (RLB) to report findings on<br />
specific subjects <strong>for</strong> reference by the industry and is not intended to constitute<br />
any professional advice on these or any other subjects. Whilst reasonable<br />
ef<strong>for</strong>ts have been made to ensure the accuracy of the in<strong>for</strong>mation contained in<br />
this publication, the CIC nevertheless would encourage readers to seek<br />
appropriate independent advice from their professional advisers where<br />
possible and readers should not treat or rely on this publication as a substitute<br />
<strong>for</strong> such professional advice <strong>for</strong> taking any relevant actions.<br />
Enquiries<br />
Enquiries on this publication may be made to the CIC Secretariat at:<br />
CIC Headquarters<br />
15/F, Allied Kajima Building<br />
138 Gloucester Road, Wanchai<br />
<strong>Hong</strong> <strong>Kong</strong><br />
Tel: (852) 2100 9000<br />
Fax: (852) 2100 9090<br />
Email: enquiry@hkcic.org<br />
Website: www.hkcic.org<br />
© 2013 All rights reserved by CIC. Requests to use any part of this document<br />
should firstly be made to the CIC. This <strong>Report</strong> has been translated into<br />
Chinese. If there is any inconsistency or ambiguity between the English<br />
version and the Chinese version, the English version shall prevail.
TABLE OF CONTENTS<br />
Executive Summary…………………………………………...……………………... 1<br />
1. Background……………………………………...……………………………… 3<br />
2. Introduction of Key <strong>Per<strong>for</strong>mance</strong> Indicators (KPIs)…………….………………. 4<br />
3. Productivity KPIs……………………………………………………………..…. 8<br />
4. Health & Safety KPIs…………………………………………………………..... 22<br />
5. Manpower KPIs……..………………………………………………………..….. 32<br />
Annex A – Data Sources……………………………………………………………... A1<br />
Annex B – Terms and Definitions………………………………………………….... B1
EXECUTIVE SUMMARY<br />
This is the first construction industry per<strong>for</strong>mance report published by the<br />
<strong>Construction</strong> <strong>Industry</strong> Council (CIC). The in<strong>for</strong>mation in this report, verified by<br />
Rider Levett Bucknall Limited, provides an overview of the per<strong>for</strong>mance of the <strong>Hong</strong><br />
<strong>Kong</strong> <strong>Construction</strong> <strong>Industry</strong> in terms of productivity, health & safety and manpower<br />
over the last 11 years (2001 ~ <strong>2011</strong>).<br />
PRODUCTIVITY<br />
Tender price indices rose between 2004 and 2008. Following a fall in the fourth<br />
quarter of 2008, tender price indices went up again in the third quarter of 2009. Both<br />
the percentage of gross value of construction works to Gross Domestic Product and<br />
the percentage contribution of construction activities to Gross Domestic Product at<br />
basic prices have been increasing since 2008 after a continuous decreasing trend from<br />
2002. The recent increase was mainly due to the increase in the number of new<br />
projects in the public sector. The gross value of construction works per capita has<br />
been increasing since 2009, largely due to the increase in gross value of the public<br />
sector construction works per capita. Correspondingly, the number of manual<br />
workers employed per HK$1,000,000 gross value of construction works has been<br />
decreasing over the same period.<br />
HEALTH AND SAFETY<br />
A generally decreasing trend of industrial accident rate / number was recorded in the<br />
last 11 years whilst there was an improving per<strong>for</strong>mance in all categories or sectors in<br />
this aspect, improvement in fatal accident rate was not obvious. There was a general<br />
trend of improvement in terms of summonses under the Factory and <strong>Industry</strong><br />
Undertaking Ordinance and Occupational Safety & Health Ordinance. In general, the<br />
public sector demonstrated a better per<strong>for</strong>mance than the private sector in this area.<br />
HK <strong>Construction</strong> <strong>Industry</strong> <strong>Per<strong>for</strong>mance</strong> <strong>Report</strong> <strong>for</strong> <strong>2011</strong><br />
1
MANPOWER<br />
The salaries of craft and related workers/elementary occupations were lower than the<br />
<strong>Hong</strong> <strong>Kong</strong> median monthly earnings and also the industry median, while the<br />
managers and administrators / professionals / associate professionals had a higher<br />
median salary than the <strong>Hong</strong> <strong>Kong</strong> median monthly earnings as well as the industry<br />
median. The salary differences between different groups of employees remained<br />
largely unchanged in the last 4 years. The median salary in the construction industry<br />
was close to the <strong>Hong</strong> <strong>Kong</strong> median salary.<br />
Just over 30% of the currently registered workers are under the age of 40. The<br />
number of registered workers in this age group has been decreasing steadily over the<br />
last 4 years although the number of registered workers with mandatory basic safety<br />
training course (green card) in the same age group has remained largely unchanged.<br />
There has been an improvement trend since 2007 in the retention rate of graduates <strong>for</strong><br />
the basic craft courses and <strong>Construction</strong> Supervisor / Technician Programme provided<br />
by the <strong>Construction</strong> <strong>Industry</strong> Council Training Academy.<br />
HK <strong>Construction</strong> <strong>Industry</strong> <strong>Per<strong>for</strong>mance</strong> <strong>Report</strong> <strong>for</strong> <strong>2011</strong><br />
2
1. BACKGROUND<br />
Section 5 of the <strong>Construction</strong> <strong>Industry</strong> Council Ordinance (Cap. 587) governs the<br />
functions of the <strong>Construction</strong> <strong>Industry</strong> Council. Sub-section 5(k) provides:<br />
“(k) To assess improvements made by the construction industry through the<br />
compilation of per<strong>for</strong>mance indicators.”<br />
Initiated and being steered by the Committee on Environment and Technology<br />
established under the <strong>Construction</strong> <strong>Industry</strong> Council, the CIC Secretariat has reviewed<br />
the local and overseas practices of the construction industry per<strong>for</strong>mance<br />
benchmarking and developed a set of Key <strong>Per<strong>for</strong>mance</strong> Indicators (KPIs) <strong>for</strong> the<br />
<strong>Hong</strong> <strong>Kong</strong> construction industry.<br />
After several rounds of consultation with various Committees (including the<br />
Committee on <strong>Construction</strong> Site Safety, Committee on Sub-contracting, Committee<br />
on Manpower Training and Development and Committee on Procurement) and the<br />
Council, the KPIs <strong>for</strong> the <strong>Hong</strong> <strong>Kong</strong> construction industry have been established and<br />
approved based on the following criteria:<br />
(a)<br />
(b)<br />
(c)<br />
(d)<br />
(e)<br />
(f)<br />
(g)<br />
KPIs should be relevant and important to the construction industry;<br />
KPIs should be able to improve external accountability and<br />
verification;<br />
KPIs must be quantifiable;<br />
Supply of data <strong>for</strong> deriving the KPIs should be recurrent instead of<br />
one-off;<br />
KPIs should focus on those closely related to the industry per<strong>for</strong>mance;<br />
KPIs should reflect the future development of the industry;<br />
KPIs should be subdivided into new works, RMAA works, civil works,<br />
building works, private sector works and public sector works.<br />
HK <strong>Construction</strong> <strong>Industry</strong> <strong>Per<strong>for</strong>mance</strong> <strong>Report</strong> <strong>for</strong> <strong>2011</strong><br />
3
2. INTRODUCTION OF KEY PERFORMANCE INDICATORS<br />
(KPIs)<br />
The KPIs <strong>for</strong> the <strong>Hong</strong> <strong>Kong</strong> <strong>Construction</strong> <strong>Industry</strong> are classified into 5 areas and<br />
presented in 4 categories and 2 sectors as listed in Table 1. Descriptions of the KPIs<br />
are provided in Table 2.<br />
Table 1 – Classification of KPIs<br />
5 Areas 4 Categories 2 Sectors<br />
• Productivity (7 KPIs)<br />
• Health & Safety (3 KPIs)<br />
• Environment (3 KPIs)<br />
• Manpower (3 KPIs)<br />
• Dispute Resolution (3 KPIs)<br />
• Whole <strong>Industry</strong><br />
• Civil Engineering Works<br />
• New Building Works<br />
• RMAA Works<br />
• Public<br />
• Private<br />
During the data collection exercise <strong>for</strong> the first stage KPIs, further division of the<br />
KPIs has been found necessary due to some deviation of the available data coverage<br />
from the original intention. Such further division of the KPIs and their descriptions<br />
are provided in Table 3.<br />
The KPIs will be launched by stages based on availability of data and the programme<br />
<strong>for</strong> new data collection.<br />
The per<strong>for</strong>mance of the <strong>Hong</strong> <strong>Kong</strong> <strong>Construction</strong> <strong>Industry</strong> in terms of the first stage<br />
KPIs (P3 ~ P7, HS1~HS3, M1~M3) over the last 11 years (2001 ~ <strong>2011</strong>) is presented<br />
in this report.<br />
The data used <strong>for</strong> the computation of KPIs has been verified by Rider<br />
Levett Bucknall Limited.<br />
HK <strong>Construction</strong> <strong>Industry</strong> <strong>Per<strong>for</strong>mance</strong> <strong>Report</strong> <strong>for</strong> <strong>2011</strong><br />
4
Table 2 – <strong>Construction</strong> <strong>Industry</strong> KPIs<br />
KPIs Definition Purpose Whole<br />
<strong>Industry</strong><br />
Civil Works<br />
New Building<br />
Works<br />
RMAA<br />
Works<br />
Public<br />
Sector<br />
Private<br />
Sector<br />
P1 (On site) Man-days per<br />
HK$1,000,000 gross value of<br />
construction works<br />
P2 (On site) Man-days per gross floor<br />
area<br />
P3 <strong>Construction</strong> cost Indices Indication of cost trend of construction<br />
works<br />
P4<br />
P4a<br />
P5<br />
P6<br />
P7<br />
HS1<br />
HS2<br />
HS3<br />
Percentage of gross value of<br />
construction works to GDP<br />
Percentage contribution of<br />
construction activities to GDP at<br />
basic prices<br />
Gross value of construction works<br />
per capita<br />
Number of manual workers<br />
engaged per HK$1,000,000 gross<br />
value of construction works at<br />
construction sites<br />
Number of manual workers<br />
engaged per 1,000 sq. m. gross<br />
floor area<br />
Industrial accident number / rate<br />
(reportable industrial accidents per<br />
1,000 manual workers)<br />
Fatal accident number / rate (fatal<br />
accidents per 100,000 manual<br />
workers)<br />
Number of summonses convicted<br />
per HK$100,000,000 gross value of<br />
construction works<br />
Indication of productivity <br />
Indication of productivity <br />
Measurement of the economic<br />
significance of the construction industry<br />
Measurement of the economic<br />
significance of the construction industry<br />
P3.1, P3.2 & P3.3<br />
<br />
P3.2& 3.3<br />
<br />
P3.1 <br />
(Building<br />
works only)<br />
P4.1 P4.2 P4.3 P4.4 P4.5 P4.6 <br />
<br />
Indication of productivity P5.1 P5.2 P5.3 P5.4 P5.5 P5.6 <br />
Indication of productivity P6.1 <br />
(except<br />
RMAA<br />
Works)<br />
P6.2 P6.3 P6.4 P6.5 <br />
Indication of productivity <br />
Measurement of safety per<strong>for</strong>mance HS1.1 <br />
(Number)<br />
Measurement of safety per<strong>for</strong>mance HS2.1 <br />
(Number)<br />
Indication of degree and effectiveness<br />
of legal en<strong>for</strong>cement<br />
HS1.2 <br />
(Rate)<br />
HS2.2 <br />
(Rate)<br />
HS1.3 <br />
(Number)<br />
HS2.3 <br />
(Number)<br />
HS1.4 <br />
(Rate)<br />
HS2.4 <br />
(Rate)<br />
HS1.5 <br />
(Rate)<br />
HS2.5 <br />
(Rate)<br />
HS3.1 HS3.2 HS3.3 HS3.4 HS3.5 <br />
HK <strong>Construction</strong> <strong>Industry</strong> <strong>Per<strong>for</strong>mance</strong> <strong>Report</strong> <strong>for</strong> <strong>2011</strong><br />
5
KPIs Definition Purpose Whole<br />
<strong>Industry</strong><br />
Civil Works<br />
New Building<br />
Works<br />
RMAA<br />
Works<br />
Public<br />
Sector<br />
Private<br />
Sector<br />
E1<br />
Energy use per HK$1,000,000 gross<br />
value of construction works<br />
Indication of energy consumption in<br />
construction works<br />
<br />
E2 Energy use per gross floor area Indication of energy consumption in<br />
building construction works<br />
E3 <strong>Construction</strong> waste (tonnes) to Indication of D&C waste generated from<br />
landfill per HK$1,000,000 gross construction works<br />
value of construction works<br />
M1 Workers’ wage index Indication of the trend of workers’<br />
wages<br />
M2<br />
M3<br />
DR1<br />
DR2<br />
DR3<br />
Workers’ aging index<br />
(% of registered workers under and<br />
above the age of 40)<br />
Retention rate of graduates (basic<br />
craft courses and construction supervisor /<br />
technician programme provided by the<br />
<strong>Construction</strong> <strong>Industry</strong> Council Training<br />
Academy)<br />
(% of graduates remaining in the<br />
industry after 12 months from<br />
works)<br />
No. of court cases per<br />
HK$1,000,000 gross value of<br />
construction works<br />
No. of construction arbitration<br />
cases per HK$1,000,000 gross value<br />
of construction works<br />
No. of labour disputes per<br />
HK$1,000,000 gross value of<br />
Indication of the aging mix of the<br />
workers<br />
Indication of the retention rate of<br />
graduates<br />
Indication of the trend of contractual<br />
dispute resolution through litigation<br />
Indication of the use of alternative<br />
dispute resolution in construction<br />
contracts<br />
Indication of the trend of labour<br />
disputes<br />
construction works<br />
Legend:<br />
1. - to be provided. – KPI not applicable, not necessary or data not available.<br />
2. Data of the proposed KPI would be launched and released by stages. The following shading indicated the timing of data release:<br />
Early 2013 Mid 2013 Early 2014<br />
3. The need <strong>for</strong> further division of the future stage KPIs will be subject to review when data become available.<br />
<br />
<br />
<br />
<br />
<br />
<br />
<br />
<br />
HK <strong>Construction</strong> <strong>Industry</strong> <strong>Per<strong>for</strong>mance</strong> <strong>Report</strong> <strong>for</strong> <strong>2011</strong><br />
6
Table 3 – Further Division of First Stage KPIs<br />
Key <strong>Per<strong>for</strong>mance</strong> Indicators<br />
P3 <strong>Construction</strong> Cost Indices<br />
P3.1 Builder's Works Tender Price Index (RLB) (4Q 1968=100)<br />
P3.2 Building Works Tender Price Index (ArchSD) (1Q 1970 = 100)<br />
P3.3 Building Services Tender Price Index (ArchSD) (new base schedule 2007)<br />
P4 Percentage of Gross Value of <strong>Construction</strong> Works to GDP<br />
P4.1 Whole <strong>Industry</strong><br />
P4.2 Civil Works (Structures & Facilities)<br />
P4.3 New Building Works (Buildings)<br />
P4.4 RMAA Works<br />
P4.5 Public Sector <strong>Construction</strong> Site<br />
P4.6 Private Sector <strong>Construction</strong> Site<br />
P4a Percentage Contribution of <strong>Construction</strong> Activities to GDP at Basic Prices<br />
P5 Gross value of <strong>Construction</strong> Works per Capita<br />
P5.1 Whole <strong>Industry</strong><br />
P5.2 Civil Works (Structures & Facilities)<br />
P5.3 New Building Works (Buildings)<br />
P5.4 RMAA Works<br />
P5.5 Public Sector <strong>Construction</strong> Site<br />
P5.6 Private Sector <strong>Construction</strong> Site<br />
P6 Number of Manual Workers Engaged per HK$1,000,000 Gross Value of <strong>Construction</strong> Works<br />
(at <strong>Construction</strong> Sites)<br />
P6.1 Whole <strong>Industry</strong> (except RMAA Works)<br />
P6.2 Civil Works (at Civil Engineering Sites)<br />
P6.3 New Building Works (at Building Sites)<br />
P6.4 Public Sector <strong>Construction</strong> Site<br />
P6.5 Private Sector <strong>Construction</strong> Site<br />
P7 Number of Manual Workers Engaged per 1,000 sq. m. Gross Floor Area<br />
New Private Building Works (at Private sector)<br />
HS1 Industrial Accident Number / Rate (<strong>Report</strong>able Industrial Accidents per 1,000 Manual Workers)<br />
HS1.1 Whole <strong>Industry</strong> (Number)<br />
HS1.2 New Works (Rate)<br />
HS1.3 RMAA Works (Number)<br />
HS1.4 Public Sector Sites (Rate)<br />
HS1.5 Private Sector Sites (Rate)<br />
HS2 Fatal Accident Number / Rate (Fatal Accidents per 100,000 Manual Workers)<br />
HS2.1 Whole <strong>Industry</strong> (Number)<br />
HS2.2 New Works (Rate)<br />
HS2.3 RMAA Works (Number)<br />
HS 2.4 Public Sector Sites (Rate)<br />
HS 2.5 Private Sector Sites (Rate)<br />
HS3 Number of Summonses Convicted per HK$100,000,000 Gross Value Of <strong>Construction</strong> Works<br />
HS3.1 Whole <strong>Industry</strong><br />
HS3.2 New Works<br />
HS3.3 RMAA Works<br />
HS3.4 Public Sector<br />
HS3.5 Private Sector<br />
M1 Workers' Wage Index<br />
<strong>Hong</strong> <strong>Kong</strong> <strong>Construction</strong> <strong>Industry</strong> - Employed Persons' Median Wage<br />
M2 Workers' Aging Index - % of Registered Workers Under and Above the Age of 40<br />
M2.1 Whole <strong>Industry</strong><br />
M2.2 Registered workers with Mandatory Basic Safety Training Course (Green Card)<br />
M3 Retention Rate of Graduates (Basic Craft Courses And <strong>Construction</strong> Supervisor / Technician Programme Provided By<br />
<strong>Construction</strong> <strong>Industry</strong> Council Training Academy)<br />
Retention Rate of Graduates (after 12 Months from Works)<br />
HK <strong>Construction</strong> <strong>Industry</strong> <strong>Per<strong>for</strong>mance</strong> <strong>Report</strong> <strong>for</strong> <strong>2011</strong><br />
7
3. PRODUCTIVITY KPIs<br />
HK <strong>Construction</strong> <strong>Industry</strong> <strong>Per<strong>for</strong>mance</strong> <strong>Report</strong> <strong>for</strong> <strong>2011</strong><br />
8
PRODUCTIVITY KPIs<br />
P3 <strong>Construction</strong> Cost Indices<br />
P3.1 – Builder’s Works Tender Price Index (RLB) (4Q1968=100)<br />
Category: Buildings<br />
Sector: Private<br />
The quarterly report as published by<br />
Rider Levett Bucknall (RLB) shows<br />
that the tender price index <strong>for</strong><br />
builder’s works in the private sector<br />
increased steadily between 2004 and<br />
2008. Following a fall in the fourth<br />
quarter of 2008, the tender price<br />
index went up again in the third<br />
quarter of 2009. The index in the<br />
fourth quarter of <strong>2011</strong> was up by<br />
9.5% over the fourth quarter of 2010.<br />
P3.1 - Builder's Works Tender Price Index (RLB)<br />
Year 2001 2002 2003 2004 2005 2006 2007 2008 2009 2010 <strong>2011</strong><br />
Quarter<br />
1Q 1400 1270 1205 1255 1260 1300 1440 1680 1630 1670 1840<br />
2Q 1390 1240 1230 1265 1270 1310 1475 1810 1605 1730 1870<br />
3Q 1360 1210 1195 1230 1275 1360 1535 1865 1620 1750 1925<br />
4Q 1290 1185 1210 1220 1280 1410 1595 1750 1655 1785 1955<br />
Source: Rider Levett Bucknall Limited<br />
P3.2 – Builder’s Works Tender Price Index (ArchSD) (1Q1970=100)<br />
Category: Buildings (excluding<br />
building services)<br />
Sector: Public (undertaken by<br />
Architectural Services Department)<br />
The public builder’s works tender<br />
price index increased between 2005<br />
and 2008. Following a fall in the<br />
fourth quarter of 2008, the tender<br />
price index recovered in the third<br />
quarter of 2009. The index in the<br />
fourth quarter of <strong>2011</strong> was up by 11.2<br />
% over the year be<strong>for</strong>e.<br />
Year 2001 2002 2003 2004 2005 2006 2007 2008 2009 2010 <strong>2011</strong><br />
Quarter<br />
1Q 862 687 720 685 711 714 821 1118 1074 1134 1273<br />
2Q 842 742 723 712 716 730 859 1305 983 1161 1320<br />
3Q 807 692 722 704 718 751 906 1401 1111 1249 1369<br />
4Q 721 733 681 701 697 789 998 1262 1107 1266 1408<br />
Source: Architectural Services Department<br />
P3.2 - Builder's Works Tender Price Index (ArchSD)<br />
HK <strong>Construction</strong> <strong>Industry</strong> <strong>Per<strong>for</strong>mance</strong> <strong>Report</strong> <strong>for</strong> <strong>2011</strong><br />
9
PRODUCTIVITY KPIs<br />
P3 <strong>Construction</strong> Cost Indices<br />
P3.3 – Building Services Tender Price Index (ArchSD) (new base schedule 2007)<br />
Category: Buildings (Building<br />
Services)<br />
Sector: Public (undertaken by<br />
Architectural Services Department)<br />
The public building services tender<br />
price index showed a drop in the<br />
fourth quarter of 2008. It remained<br />
steady in 2009 and started to rise in<br />
2010. The index in the fourth<br />
quarter of <strong>2011</strong> was up by 18.2%<br />
compared to the year be<strong>for</strong>e.<br />
Note: The index numbers be<strong>for</strong>e 2008 have<br />
not been included as the method <strong>for</strong><br />
calculating the index numbers has changed<br />
since 2008.<br />
P3.3 - Building Services Tender Price Index (ArchSD)<br />
Year<br />
Quarter<br />
2008 2009 2010 <strong>2011</strong><br />
1Q 148 128 130 149<br />
2Q 163 134 135 162<br />
3Q 170 129 143 187<br />
4Q 145 133 148 175<br />
Source: Architectural Services Department<br />
HK <strong>Construction</strong> <strong>Industry</strong> <strong>Per<strong>for</strong>mance</strong> <strong>Report</strong> <strong>for</strong> <strong>2011</strong><br />
10
PRODUCTIVITY KPIs<br />
P4 Percentage of Gross Value of <strong>Construction</strong> Works to GDP<br />
P4.1 – Whole <strong>Industry</strong><br />
Category: Whole <strong>Industry</strong><br />
Sector: N/A<br />
The percentage of gross value of<br />
construction works to GDP had<br />
been decreasing continuously since<br />
2002 and started to increase in<br />
2008. The percentage was 6.6 %<br />
in <strong>2011</strong>. The percentage of gross<br />
value of construction works in the<br />
private sector has remained fairly<br />
steady since 2005. The increase in<br />
the percentage since 2008 has been<br />
mainly from the public sector.<br />
Source: Census and Statistics Department<br />
Note 1 –<br />
Note 2 –<br />
Note 3 –<br />
Note 4 –<br />
Percentage of Gross Value of <strong>Construction</strong> Works to GDP<br />
= Gross value of construction works (whole <strong>Industry</strong> / respective categories or sectors) (in nominal terms)<br />
GDP (overall; at current market prices)<br />
Gross value of construction works (Whole <strong>Industry</strong>) = Gross value of construction works (at construction sites) + Gross value<br />
of construction works (at locations other than sites = RMAA Works).<br />
Gross value of construction works (at construction sites) can be calculated by using the <strong>for</strong>mulas below:<br />
a) Gross value of construction works (Civil Works (Structure & Facilities)) + Gross value of construction works (New<br />
Building Works (Buildings)) or;<br />
b) Gross value of construction works (Public sector construction sites) + Gross value of construction works (Private sector<br />
construction sites)<br />
The GDP of recent years may be further revised in a later publication.<br />
HK <strong>Construction</strong> <strong>Industry</strong> <strong>Per<strong>for</strong>mance</strong> <strong>Report</strong> <strong>for</strong> <strong>2011</strong><br />
11
PRODUCTIVITY KPIs<br />
P4 Percentage of Gross Value of <strong>Construction</strong> Works to GDP<br />
P4.2 – Civil Works (Structures & Facilities)<br />
Category: Civil Works (Structures<br />
& Facilities)<br />
Sector: N/A<br />
Output of Civil Works (Structures<br />
& Facilities) has shown an<br />
increasing trend since 2008. In<br />
<strong>2011</strong>, the percentage increased by<br />
34.4%, compared to the year be<strong>for</strong>e.<br />
Source: Census and Statistics Department<br />
P4.3 – New Building Works (Buildings)<br />
Category: New Buildings Works<br />
(Buildings)<br />
Sector: N/A<br />
The decreasing trend <strong>for</strong> New<br />
Building Works stopped in 2006.<br />
The percentage remained at around<br />
2% in recent years.<br />
P4.4 – RMAA Works<br />
Category: RMAA Works<br />
(<strong>Construction</strong> works at locations<br />
other than sites)<br />
Sector: N/A<br />
Output of RMAA Works showed a<br />
gradual increasing trend between<br />
2002 and 2006, which levelled off<br />
in recent years.<br />
Source: Census and Statistics Department<br />
Source: Census and Statistics Department<br />
HK <strong>Construction</strong> <strong>Industry</strong> <strong>Per<strong>for</strong>mance</strong> <strong>Report</strong> <strong>for</strong> <strong>2011</strong><br />
12
PRODUCTIVITY KPIs<br />
P4 Percentage of Gross Value of <strong>Construction</strong> Works to GDP<br />
P4.5 – Public Sector <strong>Construction</strong> Sites<br />
Category: N/A<br />
Sector: Public (construction sites)<br />
Public works output has shown a<br />
rapid increasing trend since 2009.<br />
In <strong>2011</strong>, the percentage increased<br />
by 23.8%, compared to 2010.<br />
Source: Census and Statistics Department<br />
P4.6 – Private Sector <strong>Construction</strong> Sites<br />
Category: N/A<br />
Sector: Private (construction sites)<br />
The percentage of gross value of<br />
construction works in private<br />
sectors has remained steady at<br />
around 2% since 2005.<br />
Source: Census and Statistics Department<br />
HK <strong>Construction</strong> <strong>Industry</strong> <strong>Per<strong>for</strong>mance</strong> <strong>Report</strong> <strong>for</strong> <strong>2011</strong><br />
13
PRODUCTIVITY KPIs<br />
P4a Percentage Contribution of <strong>Construction</strong> Activities to GDP at Basic Prices<br />
Category: Whole <strong>Industry</strong><br />
Sector: N/A<br />
The overall contribution of<br />
construction activities to GDP at<br />
basic prices had been decreasing<br />
since 2002 until 2007 and started to<br />
rise in 2008. The overall<br />
contribution of construction<br />
activities to GDP at basic prices<br />
was 3.4% in <strong>2011</strong>.<br />
Source: Census and Statistics Department<br />
Note 1 –<br />
Note 2 –<br />
Note 3 –<br />
Note 4 –<br />
GDP of construction activities = Gross value of construction works (Whole <strong>Industry</strong>) – Intermediate consumption<br />
The intermediate consumption of the construction industry comprises the expenses on consumption of building materials and<br />
supplies on sites and sundry supplies in business operation, rentals, expenses on repair and maintenance and other services<br />
such as transportation, technical consultancy, insurance, etc. Consumption of materials and supplies is obtained by adjusting<br />
the value of purchases by changes in inventories net of price appreciation. Payments to labour-only sub-contractors are<br />
included in compensation of employees.<br />
GDP at basic prices excludes taxes products and statistical discrepancy.<br />
Percentage contribution of construction activities to GPD at basic prices of recent years may be further revised in a later<br />
publication.<br />
HK <strong>Construction</strong> <strong>Industry</strong> <strong>Per<strong>for</strong>mance</strong> <strong>Report</strong> <strong>for</strong> <strong>2011</strong><br />
14
PRODUCTIVITY KPIs<br />
P5 Gross Value of <strong>Construction</strong> Works per capita<br />
P5.1 – Whole <strong>Industry</strong><br />
Category: Whole <strong>Industry</strong><br />
Sector: N/A<br />
The gross value of construction<br />
works per capita demonstrated a<br />
decreasing trend between 2001 and<br />
2006 except the RMAA Works (i.e.<br />
repair, maintenance, alteration and<br />
addition works) which showed a<br />
gradual increase. During 2009 to<br />
<strong>2011</strong>, the output of Civil Works was<br />
the major driver to the increase of<br />
gross value of construction works<br />
per capita. The gross value of<br />
construction works per capita at<br />
Public <strong>Construction</strong> Sites also<br />
showed a rapid increase between<br />
2008 and <strong>2011</strong>, which rose from<br />
HK$2,100 in 2008 to HK$4,985 in<br />
<strong>2011</strong>.<br />
Source: Census and Statistics Department<br />
Note 1 –<br />
Note 2 –<br />
Note 3 –<br />
Gross Value of <strong>Construction</strong> Works per capita<br />
= Gross value of construction works (Whole <strong>Industry</strong> / Respective categories or sectors) (at constant (2000) market prices)<br />
Capita (overall)<br />
Gross value of construction works (Whole <strong>Industry</strong>) = Gross value of construction works (at construction sites) + Gross<br />
value of construction works (at locations other than sites = RMAA Works).<br />
Gross value of construction works (at construction sites) can be calculated by using the <strong>for</strong>mulas below:<br />
a) Gross value of construction works (Civil Works (Structure & Facilities)) + Gross value of construction works (New<br />
Building Works (Buildings)) or;<br />
b) Gross value of construction works (Public sector construction sites) + Gross value of construction works (Private<br />
sector construction sites)<br />
HK <strong>Construction</strong> <strong>Industry</strong> <strong>Per<strong>for</strong>mance</strong> <strong>Report</strong> <strong>for</strong> <strong>2011</strong><br />
15
PRODUCTIVITY KPIs<br />
P5 Gross Value of <strong>Construction</strong> Works per capita<br />
P5.2 – Civil Works (Structures & Facilities)<br />
Category: Civil Works (Structures<br />
& Facilities)<br />
Sector: N/A<br />
The decreasing trend in this<br />
category stopped in 2007 and the<br />
gross value of civil works per capita<br />
had rebounded since 2008 and<br />
increased rapidly in 2010. In <strong>2011</strong>,<br />
the output increased by 38.4%,<br />
compared to that in 2010.<br />
Source: Census and Statistics Department<br />
P5.3 – New Building Works (Buildings)<br />
Category: New Building Works<br />
(Buildings)<br />
Sector: N/A<br />
The decreasing trend in this category<br />
stopped in 2006 and the gross value<br />
of new building works per capita<br />
remained steady in recent years.<br />
Source: Census and Statistics Department<br />
P5.4 – RMAA Works<br />
Category: RMAA Works<br />
Sector: N/A<br />
The gross value of RMAA works per<br />
capita showed an increasing trend<br />
between 2001 and 2006. There has<br />
been a gradual decrease since 2007.<br />
Source: Census and Statistics Department<br />
HK <strong>Construction</strong> <strong>Industry</strong> <strong>Per<strong>for</strong>mance</strong> <strong>Report</strong> <strong>for</strong> <strong>2011</strong><br />
16
PRODUCTIVITY KPIs<br />
P5 Gross Value of <strong>Construction</strong> Works per capita<br />
P5.5 – Public Sector <strong>Construction</strong> Sites<br />
Category: N/A<br />
Sector: Public (<strong>Construction</strong><br />
Sites)<br />
Public works output has shown a<br />
rapid increasing trend since 2009.<br />
In <strong>2011</strong>, the output per capita was<br />
up by 27.5%, compared to the<br />
year be<strong>for</strong>e.<br />
Source: Census and Statistics Department<br />
P5.6 – Private Sector <strong>Construction</strong> Sites<br />
Category: N/A<br />
Sector: Private (<strong>Construction</strong><br />
Sites)<br />
Private works output has been<br />
fluctuating over the past 11 years.<br />
It remained at around HK$4,000<br />
in 2010 and <strong>2011</strong>.<br />
Source: Census and Statistics Department<br />
HK <strong>Construction</strong> <strong>Industry</strong> <strong>Per<strong>for</strong>mance</strong> <strong>Report</strong> <strong>for</strong> <strong>2011</strong><br />
17
PRODUCTIVITY KPIs<br />
P6 Number of Manual Workers Engaged per HK$1,000,000 Gross Value of<br />
<strong>Construction</strong> Works (at <strong>Construction</strong> Sites)<br />
P6.1 – Whole <strong>Industry</strong> (except RMAA Works)<br />
Category: Whole <strong>Industry</strong><br />
Sector: N/A<br />
The number of manual workers<br />
engaged per HK$1,000,000 gross<br />
value of construction works (at<br />
construction sites) has shown a<br />
decreasing trend since 2006. The<br />
numbers of manual workers in civil<br />
engineering works sites and public<br />
sector construction sites decreased<br />
significantly in recent years.<br />
There was a decrease in number of<br />
manual workers per HK$1,000,000<br />
gross value of construction works in<br />
the private sector in <strong>2011</strong> compared<br />
to the year be<strong>for</strong>e.<br />
Source: Census and Statistics Department<br />
Note 1 – Number of manual workers engaged per HK$1,000,000 gross value of construction works (at construction sites)<br />
= Average number of manual workers engaged <strong>for</strong> each year at construction sites (Whole <strong>Industry</strong> (except RMAA works) / Respective categories or sectors)<br />
HK$1,000,000 Gross value of construction works (at construction sites) (Whole <strong>Industry</strong> (except RMAA works) / Respective categories or sectors) at constant (2000) market prices)<br />
Note 2 –<br />
Number of manual workers be<strong>for</strong>e 2003 excludes E&M workers and those workers work at the sites under the charge of the Electrical<br />
and Mechanical Services Department and the Environmental Protection Department but the data includes those workers after 2003.<br />
Note 3 – Number of manual workers excludes the workers work <strong>for</strong> RMAA works. For sites under the charge of Government departments,<br />
manual workers in some 40 selected major occupations at the skilled and semi-skilled levels are covered in the administrative returns<br />
furnished by the respective Government departments.<br />
Note 4 –<br />
No of manual workers engaged at construction sites (Whole <strong>Industry</strong>) can be calculated by the <strong>for</strong>mulas below:<br />
a) No of manual workers engaged at construction sites (Civil Works (at Civil Engineering sites) + No of manual workers engaged at<br />
construction sites (New Building Works (at Building sites)) or;<br />
b) No of manual workers engaged at construction sites (Public sector construction site) + No of manual workers engaged at<br />
construction sites (Private sector construction site).<br />
HK <strong>Construction</strong> <strong>Industry</strong> <strong>Per<strong>for</strong>mance</strong> <strong>Report</strong> <strong>for</strong> <strong>2011</strong><br />
18
PRODUCTIVITY KPIs<br />
P6 Number of Manual Workers Engaged per HK$1,000,000 Gross Value of<br />
<strong>Construction</strong> Works (at <strong>Construction</strong> Sites)<br />
P6.2 – Civil Works (at Civil Engineering Sites)<br />
Category: Civil Engineering<br />
(<strong>Construction</strong> Sites)<br />
Sector: N/A<br />
The number of manual workers<br />
engaged <strong>for</strong> HK$1,000,000 gross<br />
value of civil engineering<br />
construction works has shown a<br />
decreasing trend since 2008.<br />
Source: Census and Statistics Department<br />
P6.3 – New Building Works (at Building Sites)<br />
Category: Building (<strong>Construction</strong><br />
Sites)<br />
Sector: N/A<br />
The number of manual workers<br />
engaged <strong>for</strong> HK$1,000,000 gross<br />
value of new building works has<br />
shown an increasing trend in recent<br />
years.<br />
Source: Census and Statistics Department<br />
HK <strong>Construction</strong> <strong>Industry</strong> <strong>Per<strong>for</strong>mance</strong> <strong>Report</strong> <strong>for</strong> <strong>2011</strong><br />
19
PRODUCTIVITY KPIs<br />
P6 Number of Manual Workers Engaged Per HK$1,000,000 Gross Value of<br />
<strong>Construction</strong> Works (at <strong>Construction</strong> Sites)<br />
P6.4 – Public Sector <strong>Construction</strong> Sites<br />
Category: N/A<br />
Sector: Public (<strong>Construction</strong> Sites)<br />
The number of manual workers per<br />
HK$1,000,000 gross value of public<br />
works has shown a decreasing trend<br />
since 2009.<br />
Source: Census and Statistics Department<br />
P6.5 – Private Sector <strong>Construction</strong> Sites<br />
Category: N/A<br />
Sector: Private (<strong>Construction</strong> Sites)<br />
The number of manual workers per<br />
HK$1,000,000 gross value of<br />
private works has shown an<br />
increasing trend in recent years.<br />
Source: Census and Statistics Department<br />
HK <strong>Construction</strong> <strong>Industry</strong> <strong>Per<strong>for</strong>mance</strong> <strong>Report</strong> <strong>for</strong> <strong>2011</strong><br />
20
PRODUCTIVITY KPIs<br />
P7 Number of Manual Workers Engaged per 1,000 sq. m. Gross Floor Area<br />
Category: New Building Works (at<br />
private sector construction sites)<br />
Sector: Private (<strong>Construction</strong> sites)<br />
In general, the number of manual<br />
workers engaged per 1,000 sq. m.<br />
gross floor area showed an<br />
increasing trend. In <strong>2011</strong>,<br />
however, the number decreased<br />
significantly by 18.2%, compared to<br />
the year be<strong>for</strong>e.<br />
Source: Census and Statistics Department<br />
Note 1 –<br />
Note 2 –<br />
Note 3 –<br />
Note 4 –<br />
Number of manual workers engaged per 1,000 sq. m. gross floor area<br />
= Average number of manual workers engaged <strong>for</strong> each year at construction sites (Private sector construction site)<br />
Gross floor area (completed and under construction) in a year / 1,000 sq. m.<br />
Number of manual workers be<strong>for</strong>e 2003 excludes E&M workers and those workers work at the sites under the charge of the<br />
Electrical and Mechanical Services Department and the Environmental Protection Department but the data includes those workers<br />
after 2003.<br />
Number of manual workers excludes the workers work <strong>for</strong> RMAA works. For sites under the charge of Government departments,<br />
manual workers in some 40 selected major occupations at the skilled and semi-skilled levels are covered in the administrative<br />
returns furnished by the respective Government departments.<br />
Gross floor area in a year =gross floor area completed at the end of the year + gross floor area under construction in the year<br />
HK <strong>Construction</strong> <strong>Industry</strong> <strong>Per<strong>for</strong>mance</strong> <strong>Report</strong> <strong>for</strong> <strong>2011</strong><br />
21
4. HEALTH & SAFETY KPIs<br />
HK <strong>Construction</strong> <strong>Industry</strong> <strong>Per<strong>for</strong>mance</strong> <strong>Report</strong> <strong>for</strong> <strong>2011</strong><br />
22
HEALTH & SAFETY KPIs<br />
HS1 Industrial Accident Number / Rate (<strong>Report</strong>able Industrial Accidents per 1,000<br />
Manual Workers)<br />
HS1.1 Whole <strong>Industry</strong> (Number)<br />
Category: Whole <strong>Industry</strong><br />
Sector: N/A<br />
The industrial accident number <strong>for</strong><br />
the Whole <strong>Industry</strong> showed a rapid<br />
decrease from 2001 to 2004. This<br />
rapid decreasing trend also<br />
happened in the industrial accident<br />
rates <strong>for</strong> New Works and Private<br />
Sector Sites. For RMAA Works,<br />
the industrial accident number<br />
remained steady in the past few<br />
years. The industrial accident rate<br />
<strong>for</strong> Public Sector Sites has also been<br />
kept at a comparatively low rate<br />
over the past 11 years. In general,<br />
the public sector demonstrated a<br />
better per<strong>for</strong>mance than the private<br />
sector.<br />
Source: Census and Statistics Department and Labour Department<br />
Source: Census and Statistics Department and Labour Department<br />
Note 1 – Industrial accidents rate = Number of industrial accidents (Respective categories / sectors<br />
Average number of manual workers engaged <strong>for</strong> each year at construction sites (Respective categories / sectors) / 1000<br />
Note 2 –<br />
Note 3 –<br />
Note 4 –<br />
Note 5 –<br />
Note 6 –<br />
Number of reportable industrial accidents (Whole <strong>Industry</strong>) = <strong>Report</strong>able industrial accidents (New Works includes both Civil and<br />
Building Works) + <strong>Report</strong>able industrial accidents number (RMAA Works)<br />
<strong>Report</strong>able industrial accidents (New Works includes both Civil and Building Works) = <strong>Report</strong>able industrial accidents (Public Sector<br />
Sites) + <strong>Report</strong>able industrial accidents (Private Sector Sites).<br />
Number of manual workers be<strong>for</strong>e 2003 excludes E&M workers and those workers work at the sites under the charge of the Electrical<br />
and Mechanical Services Department and the Environmental Protection Department but the data includes those workers after 2003.<br />
Number of manual workers excludes the workers work <strong>for</strong> RMAA works. For sites under the charge of Government departments,<br />
manual workers in some 40 selected major occupations at the skilled and semi-skilled levels are covered in the administrative returns<br />
furnished by the respective Government departments.<br />
The industrial accident rates <strong>for</strong> Whole <strong>Industry</strong> and RMAA Works are not available due to the exclusion of workers <strong>for</strong> RMAA<br />
Works in the overall number of manual workers as mentioned in Note 5 above. Hence, only the total number of industrial accidents<br />
is presented <strong>for</strong> these two categories.<br />
HK <strong>Construction</strong> <strong>Industry</strong> <strong>Per<strong>for</strong>mance</strong> <strong>Report</strong> <strong>for</strong> <strong>2011</strong><br />
23
HEALTH & SAFETY KPIs<br />
HS1 Industrial Accident Number / Rate (<strong>Report</strong>able Industrial Accidents per 1,000<br />
Manual Workers)<br />
HS1.2 – New Works (Rate)<br />
Category: New Works (both Civil<br />
and Buildings)<br />
Sector: N/A<br />
The safety per<strong>for</strong>mance improved<br />
rapidly from 2001 to 2004 and has<br />
generally kept on improving in<br />
subsequent years.<br />
Source: Census and Statistics Department and Labour Department<br />
HS1.3 – RMAA Works (Number)<br />
Category: RMAA Works<br />
Sector: N/A<br />
The safety per<strong>for</strong>mance improved<br />
rapidly from 2001 to 2003, and has<br />
fluctuated over the recent years.<br />
Source: Census and Statistics Department and Labour Department<br />
HK <strong>Construction</strong> <strong>Industry</strong> <strong>Per<strong>for</strong>mance</strong> <strong>Report</strong> <strong>for</strong> <strong>2011</strong><br />
24
HEALTH & SAFETY KPIs<br />
HS1 Industrial Accident Number / Rate (<strong>Report</strong>able Industrial Accidents per 1,000<br />
Manual Workers)<br />
HS1.4 – Public Sector Sites (Rate)<br />
Category: N/A<br />
Sector: Public Sector Sites<br />
The safety per<strong>for</strong>mance has been<br />
improving since 2001 but the rate<br />
has recently rebounded mildly in<br />
<strong>2011</strong>.<br />
Source: Census and Statistics Department and Labour Department<br />
HS1.5 – Private Sector Sites (Rate)<br />
Category: N/A<br />
Sector: Private Sector Sites<br />
The safety per<strong>for</strong>mance improved<br />
rapidly from 2001 to 2003, and has<br />
kept on improving until 2009.<br />
Source: Census and Statistics Department and Labour Department<br />
HK <strong>Construction</strong> <strong>Industry</strong> <strong>Per<strong>for</strong>mance</strong> <strong>Report</strong> <strong>for</strong> <strong>2011</strong><br />
25
HEALTH & SAFETY KPIs<br />
HS2 Fatal Accident Number / Rate (Fatal Accidents per 100,000 Manual Workers)<br />
HS2.1 Whole <strong>Industry</strong> (Number)<br />
Category: Whole <strong>Industry</strong><br />
Sector: N/A<br />
The fatal accident rate and number<br />
fluctuated over the past 11 years.<br />
The number of fatal accidents <strong>for</strong><br />
the Whole <strong>Industry</strong> was below 30 in<br />
each year. The fatal accident<br />
number <strong>for</strong> Private Sector Sites<br />
fluctuated between 0 to 21 in the<br />
past 11 years, whilst the number <strong>for</strong><br />
the Public Sector Sites maintained<br />
below 10.<br />
HS2a - Number of fatal accidents<br />
Category<br />
Year 2001 2002 2003 2004 2005 2006 2007 2008 2009 2010 <strong>2011</strong><br />
New Works 24 14 17 11 13 7 13 12 13 3 15<br />
Public Sector Site 3 6 9 3 5 7 3 1 4 0 7<br />
Private Sector Site 21 8 8 8 8 0 10 11 9 3 8<br />
Source: Census and Statistics Department and Labour Department<br />
HS2b - Number of fatal accidents<br />
Year 2001 2002 2003 2004 2005 2006 2007 2008 2009 2010 <strong>2011</strong><br />
Category<br />
Whole <strong>Industry</strong> 28 24 25 17 25 16 19 20 19 9 23<br />
RMAA Works 4 10 8 6 12 9 6 8 6 6 8<br />
Source: Census and Statistics Department and Labour Department<br />
Note 1 – Fatal accidents rate = Number of fatal accidents (Respective categories / sectors) ___<br />
Average number of manual workers engaged <strong>for</strong> each year at construction sites (Respective categories / sectors) / 100,000<br />
Note 2 –<br />
Note 3 –<br />
Note 4 –<br />
Note 5 –<br />
Note 6 –<br />
Number of fatal accidents (Whole <strong>Industry</strong>) =Fatal accidents (New Works includes both Civil and Building Works) + Fatal accidents<br />
number (RMAA Works)<br />
Fatal accidents (New Works includes both Civil and Building Works) = Fatal accidents (Private Sector Sites) + Fatal accidents<br />
(Public Sector Sites)<br />
Number of manual workers be<strong>for</strong>e 2003 excludes E&M workers and those workers work at the sites under the charge of the<br />
Electrical and Mechanical Services Department and the Environmental Protection Department but the data includes those workers<br />
after 2003.<br />
Number of manual workers excludes the workers work <strong>for</strong> RMAA works. For sites under the charge of Government departments,<br />
manual workers in some 40 selected major occupations at the skilled and semi-skilled levels are covered in the administrative<br />
returns furnished by the respective Government departments.<br />
The fatal accident rates <strong>for</strong> Whole <strong>Industry</strong> and RMAA Works are not available due to the exclusion of workers <strong>for</strong> RMAA Works in<br />
the overall number of manual workers as mentioned in Note 5 above. Hence, only the total number of industrial accidents is<br />
presented <strong>for</strong> these two categories.<br />
HK <strong>Construction</strong> <strong>Industry</strong> <strong>Per<strong>for</strong>mance</strong> <strong>Report</strong> <strong>for</strong> <strong>2011</strong><br />
26
HEALTH & SAFETY KPIs<br />
HS2 Fatal Accident Number / Rate (Fatal Accidents per 100,000 Manual Workers)<br />
HS2.2 – New Works (Rate)<br />
Category: New Works (both Civil<br />
and Buildings)<br />
Sector: N/A<br />
<strong>Per<strong>for</strong>mance</strong> fluctuated in the last 11<br />
years, but showed a significant<br />
improvement in 2010.<br />
Source: Census and Statistics Department and Labour Department<br />
HS2.3 – RMAA Works (Number)<br />
Category: RMAA Works<br />
Sector: N/A<br />
<strong>Per<strong>for</strong>mance</strong> fluctuated over the<br />
past 11 years. The highest number<br />
of fatal accidents was 12 in 2005,<br />
whilst the lowest number was 4 in<br />
2001.s.<br />
Source: Census and Statistics Department and Labour Department<br />
HK <strong>Construction</strong> <strong>Industry</strong> <strong>Per<strong>for</strong>mance</strong> <strong>Report</strong> <strong>for</strong> <strong>2011</strong><br />
27
HEALTH & SAFETY KPIs<br />
HS2 Fatal Accident Number / Rate (Fatal Accidents per 100,000 Manual Workers)<br />
HS2.4 – Public Sector Sites (Rate)<br />
Category: N/A<br />
Sector: Public Sector Sites<br />
<strong>Per<strong>for</strong>mance</strong> fluctuated over the past<br />
11 years. The fatal accident rate<br />
<strong>for</strong> Public Sector Sites fluctuated<br />
from 0 to 34.5.<br />
Source: Census and Statistics Department and Labour Department<br />
HS2.5 – Private Sector Sites (Rate)<br />
Category: N/A<br />
Sector: Private Sector Sites<br />
There was a great improvement<br />
between 2001 and 2002 but the<br />
per<strong>for</strong>mance has been fluctuating<br />
since 2003.<br />
Source: Census and Statistics Department and Labour Department<br />
HK <strong>Construction</strong> <strong>Industry</strong> <strong>Per<strong>for</strong>mance</strong> <strong>Report</strong> <strong>for</strong> <strong>2011</strong><br />
28
HEALTH & SAFETY KPIs<br />
HS3 Number of Summonses Convicted per HK$100,000,000 Gross Value of<br />
<strong>Construction</strong> Works<br />
HS3.1 Whole <strong>Industry</strong><br />
Category: Whole <strong>Industry</strong><br />
Sector: N/A<br />
Overall per<strong>for</strong>mance demonstrated<br />
an improving trend except RMAA<br />
works. <strong>Per<strong>for</strong>mance</strong> in the public<br />
sector was generally better than that<br />
in the private sector in the last few<br />
years. The rate <strong>for</strong> Public Sector<br />
was kept below 0.5 over the past 7<br />
years.<br />
Source: Census and Statistics Department and Labour Department<br />
Source: Census and Statistics Department and Labour Department<br />
Note 1 –<br />
Note 2 –<br />
Note 3 –<br />
Note 4 –<br />
Note 5 –<br />
Note 6 –<br />
Note 7 –<br />
Note 8 –<br />
Number of summonses convicted per HK$100,000,000 gross value of construction works<br />
= Number of summonses convicted (Whole <strong>Industry</strong> / Respective categories or sectors)<br />
Gross value of construction works (Whole <strong>Industry</strong> / Respective categories or sectors) (at constant (2000) market prices) / 100,000,000<br />
Number of summonses convicted (Whole <strong>Industry</strong>) can be calculated by the <strong>for</strong>mulas below:<br />
a) Number of summonses convicted (New Works includes both Civil and Building Works) + Number of summonses convicted (RMAA<br />
Works), or;<br />
b) Number of summonses convicted (Private Sector) + Number of summonses convicted (Public Sector)<br />
Gross value of construction works (Whole <strong>Industry</strong>) = Gross value of construction works (at construction sites) + Gross value of<br />
construction works (at locations other than sites = RMAA Works).<br />
Gross value of construction works (at construction sites) can be calculated by using the <strong>for</strong>mulas below:<br />
a) Gross value of construction works (Civil Works (Structure & Facilities)) + Gross value of construction works (New Building Works<br />
(Buildings)) or;<br />
b) Gross value of construction works (Public sector construction sites) + Gross value of construction works (Private sector construction<br />
sites)<br />
Number of summonses convicted per HK$100,000,000 gross value of construction works (Whole <strong>Industry</strong>), Number of summonses<br />
convicted per HK$100,000,000 gross value of construction works (New Works) and Number of summonses convicted per HK$100,000,000<br />
gross value of construction works (RMAA Works) are calculated by the number of summonses convicted divided by the HK$100,000,000<br />
gross value of construction works in respective work type x 100,000,000.<br />
Number of summonses convicted per HK$100,000,000 gross value of construction works (Public sector) and Number of summonses<br />
convicted per HK$100,000,000 gross value of construction works (Private sector) are calculated by the number of summonses convicted<br />
divided by the gross value of construction works (Whole industry) instead of the respective sector due to the different in the coverage <strong>for</strong><br />
RMAA Works.<br />
Based on notes 5 & 6 above, index group of those <strong>for</strong> Whole <strong>Industry</strong>, New Works and RMAA Works cannot be compared directly with the<br />
index group <strong>for</strong> Public Sector and Private Sector.<br />
Data <strong>for</strong> 2001 to 2004 is not available.<br />
HK <strong>Construction</strong> <strong>Industry</strong> <strong>Per<strong>for</strong>mance</strong> <strong>Report</strong> <strong>for</strong> <strong>2011</strong><br />
29
HEALTH & SAFETY KPIs<br />
HS3 Number of Summonses Convicted per HK$100,000,000 Gross Value of<br />
<strong>Construction</strong> Works<br />
HS3.2 – New Works<br />
Category: New Works (both Civil<br />
and Buildings)<br />
Sector: N/A<br />
There has been an improving trend<br />
since 2008 <strong>for</strong> New Works. The<br />
rate dropped by 40% in <strong>2011</strong><br />
compared with the year be<strong>for</strong>e.<br />
Source: Census and Statistics Department and Labour Department<br />
HS3.3 – RMAA Works<br />
Category: RMAA Works<br />
Sector: N/A<br />
<strong>Per<strong>for</strong>mance</strong> has been fluctuating in<br />
recent years. The rate increased<br />
again in <strong>2011</strong>, by 20% compared<br />
with the year be<strong>for</strong>e.<br />
Source: Census and Statistics Department and Labour Department<br />
HK <strong>Construction</strong> <strong>Industry</strong> <strong>Per<strong>for</strong>mance</strong> <strong>Report</strong> <strong>for</strong> <strong>2011</strong><br />
30
HEALTH & SAFETY KPIs<br />
HS3 Number of Summonses Convicted per HK$100,000,000 Gross Value of<br />
<strong>Construction</strong> Works<br />
HS3.4 – Public Sector<br />
Category: N/A<br />
Sector: Public Sector<br />
Significant improvement was noted<br />
in recent years. The rate <strong>for</strong> Public<br />
Sector was kept below 0.4 over the<br />
past few years.<br />
Source: Census and Statistics Department and Labour Department<br />
HS3.5 – Private Sector<br />
Category: N/A<br />
Sector: Private Sector<br />
The rate <strong>for</strong> Private Sector increased<br />
from 2005 to 2007. <strong>Per<strong>for</strong>mance</strong><br />
has been improving in recent years.<br />
The rate dropped by 30% in total<br />
between 2007 to <strong>2011</strong>.<br />
Source: Census and Statistics Department and Labour Department<br />
HK <strong>Construction</strong> <strong>Industry</strong> <strong>Per<strong>for</strong>mance</strong> <strong>Report</strong> <strong>for</strong> <strong>2011</strong><br />
31
5. MANPOWER KPIs<br />
HK <strong>Construction</strong> <strong>Industry</strong> <strong>Per<strong>for</strong>mance</strong> <strong>Report</strong> <strong>for</strong> <strong>2011</strong><br />
32
MANPOWER KPIs<br />
M1 Workers’ Wage Index<br />
Category: Whole <strong>Industry</strong> (Employed Persons' Median Wage)<br />
Sector: N/A<br />
The salaries of craft and related workers/elementary occupations were lower than the <strong>Hong</strong> <strong>Kong</strong><br />
median monthly earnings and also the industry median monthly earning, whilst the managers and<br />
administrators/professionals/associate professionals had a higher salary than the <strong>Hong</strong> <strong>Kong</strong> median<br />
monthly earnings and also the industry median. The salary differences between different groups of<br />
employees remained largely unchanged over the last 4 years.<br />
2008 2009 2010 <strong>2011</strong><br />
Q1 Q2 Q3 Q4 Q1 Q2 Q3 Q4 Q1 Q2 Q3 Q4 Q1 Q2 Q3 Q4<br />
<strong>Hong</strong> <strong>Kong</strong> Median monthly earnings 11,000 10,500 10,500 10,525 10,600 10,500 10,500 10,500 11,000 10,500 11,000 11,000 11,000 11,000 11,500 12,000<br />
<strong>Construction</strong> <strong>Industry</strong><br />
Managers and administrators/ Professionals/Associate<br />
professionals<br />
20,000 20,000 20,000 20,000<br />
Craft and related workers/ Elementary occupations<br />
9,000 9,000 9,500 10,500<br />
Others (Service workers and shop sales workers/ Plant<br />
and machine operators and assemblers)<br />
10,000 10,000 10,300 11,000<br />
<strong>Construction</strong> <strong>Industry</strong> Overall<br />
10,000 10,300 10,500 11,000<br />
Source: Census and Statistics Department<br />
Note 1 –<br />
Note 2 –<br />
Note 3 –<br />
As confirmed by Census and Statistics Department, Median monthly employment earnings in the report are nominal values<br />
not subject to any adjustment<br />
Median monthly employment earnings in construction industry by occupation <strong>for</strong> 2008 to <strong>2011</strong> are provided by Census and<br />
Statistics Department.<br />
Data <strong>for</strong> years 2001 to 2007 are not available.<br />
HK <strong>Construction</strong> <strong>Industry</strong> <strong>Per<strong>for</strong>mance</strong> <strong>Report</strong> <strong>for</strong> <strong>2011</strong><br />
33
MANPOWER KPIs<br />
M2 Workers' Aging Index - % of Registered Workers Under and Above the Age of 40<br />
M2.1 – Whole <strong>Industry</strong><br />
Category: Whole <strong>Industry</strong><br />
Sector: N/A<br />
The workers’ aging index aims to<br />
keep track of the aging situation <strong>for</strong><br />
the purpose of manpower planning.<br />
It is revealed that just over 30% of<br />
the current registered workers are<br />
under the age of 40.<br />
Source: <strong>Construction</strong> Workers Registration Authority<br />
M2.2 – Registered Workers with Mandatory Basic Safety Training Course (Green Card)<br />
Category: Whole <strong>Industry</strong><br />
Sector: N/A<br />
It is revealed that just around 35% of<br />
the registered workers with<br />
mandatory basic safety training<br />
course (green card) are under the age<br />
of 40. This number has remained<br />
largely unchanged over the last 4<br />
years<br />
Source: <strong>Construction</strong> Workers Registration Authority<br />
Note 1 – The data was provided by <strong>Construction</strong> Workers Registration Authority.<br />
Note 2 – Data <strong>for</strong> each year was counted from 1 January to 31 December<br />
Note 3 – Data <strong>for</strong> year 2001 to 2007 is not available.<br />
HK <strong>Construction</strong> <strong>Industry</strong> <strong>Per<strong>for</strong>mance</strong> <strong>Report</strong> <strong>for</strong> <strong>2011</strong><br />
34
MANPOWER KPIs<br />
M3 Retention Rate of Graduates (Basic craft courses and <strong>Construction</strong> Supervisor / Technician<br />
Programme provided by <strong>Construction</strong> <strong>Industry</strong> Council Training Academy)<br />
Category: Whole <strong>Industry</strong><br />
Sector: N/A<br />
The response rate fluctuated over the past years. The graduates’ retention rate had been decreasing<br />
since 2000 until 2005. The graduates’ retention rate showed a significant improvement since 2007.<br />
The retention rate was 85.6% in <strong>2011</strong>.<br />
Source: <strong>Construction</strong> <strong>Industry</strong> Council Training Academy<br />
Note 1 –<br />
Note 2 –<br />
Note 3 –<br />
Note 4 –<br />
Note 5 –<br />
.<br />
The data was obtained from the <strong>Construction</strong> <strong>Industry</strong> Council Training Academy.<br />
Retention rate of graduates after 12 months of graduation was calculated based on results of graduate survey on basic craft courses<br />
and <strong>Construction</strong> Supervisor / Technician Programme provided by the <strong>Construction</strong> <strong>Industry</strong> Council Training Academy. However,<br />
it is understood that the graduates should also cover the adult short courses. Retention rate of graduates of short courses after 3<br />
months of graduation may be provided in future <strong>for</strong> further reference.<br />
The response rate means the number of survey returned and the retention rate was calculated based on the retuned survey but not the<br />
number of all the graduates.<br />
Year represents the year of graduation of the workers<br />
Data <strong>for</strong> years 2002 to 2004, 2006 and 2010 is not available<br />
HK <strong>Construction</strong> <strong>Industry</strong> <strong>Per<strong>for</strong>mance</strong> <strong>Report</strong> <strong>for</strong> <strong>2011</strong><br />
35
Annex A – Data Sources<br />
Annex A – Data Sources<br />
Data<br />
<strong>Construction</strong><br />
Cost Indices<br />
Relevant<br />
KPIs<br />
Data Sources Category / Sector Remarks<br />
P3 P3.1 Rider Levett Bucknall – Quarterly<br />
Measures tender price movements of Adopt data from 1Q2001 to 4Q<strong>2011</strong><br />
publication –<br />
Builder’s Works in Private Sector<br />
<strong>Hong</strong> <strong>Kong</strong> <strong>Report</strong> – Quarterly <strong>Construction</strong><br />
Cost Update (December 2012)<br />
http://rlb.com/index.php/hong-kong-and-chi<br />
na/research<br />
P3.2 Architectural Services Department –<br />
Quarterly update –<br />
Building Works Tender Price Index (BWTPI)<br />
http://www.archsd.gov.hk/en/reports/buildin<br />
g-works-tender-price-index.aspx<br />
Indication of the level of tender prices<br />
<strong>for</strong> new building works (excluding<br />
building services works)<br />
undertaken by Architectural<br />
Services Department<br />
Adopt data from 1Q2001 to 4Q<strong>2011</strong><br />
P3.3 Architectural Services Department –<br />
Quarterly update – Quarterly update –<br />
Building Services Tender Price Index<br />
(BSTPI)<br />
http://www.archsd.gov.hk/en/reports/the-buil<br />
ding-services-tender-price-index.aspx<br />
Indication of the level of tender prices<br />
<strong>for</strong> major building services<br />
installations in new building works<br />
undertaken by Architectural<br />
Services Department<br />
Adopt data from 1Q2008 to 4Q<strong>2011</strong><br />
based on the new base schedule 2007<br />
BSTPI based on old base schedule 1998<br />
has not been included<br />
Gross<br />
Domestic<br />
Product<br />
(GDP)<br />
P4<br />
(includes<br />
P4.1 to<br />
P4.6)<br />
Census and Statistics Department – quarterly<br />
publication –<br />
Gross Domestic Product (Quarterly)<br />
(4Q2012 <strong>Report</strong>)<br />
<strong>Hong</strong> <strong>Kong</strong> Annual Situation<br />
(Table 1, GDP, at current market<br />
prices)<br />
Adopt GDP (HK$ Million; at current<br />
market price) from 2002 to <strong>2011</strong><br />
http://www.censtatd.gov.hk/products_and_services/p<br />
roducts/publications/statistical_report/national_inco<br />
me_and_bop/index_cd_B1030001_dt_detail.jsp<br />
A1
Annex A – Data Sources<br />
Data<br />
Gross value<br />
of<br />
construction<br />
works<br />
Relevant<br />
KPIs<br />
P4, P5,<br />
P6<br />
P4.1/<br />
P5.1 /<br />
P6.1<br />
Data Sources Category / Sector Remarks<br />
Census and Statistics Department –<br />
quarterly publication –<br />
<strong>Report</strong> on the Quarterly Survey of<br />
<strong>Construction</strong> Output<br />
(3Q2004 <strong>Report</strong> to 3Q2012 <strong>Report</strong>)<br />
http://www.censtatd.gov.hk/products_and_s<br />
ervices/products/publications/statistical_rep<br />
ort/commerce_and_industry/index_cd_B10<br />
90002_dt_detail.jsp<br />
P4.1<br />
(Table 1A – Gross value of<br />
construction works in nominal terms<br />
per<strong>for</strong>med by contractors analysed by<br />
broad trade group – Overall total of<br />
Main Contractor)<br />
P5.1<br />
(Table 1B – Gross value of<br />
construction works at constant<br />
(2000) market prices per<strong>for</strong>med by<br />
main contractors analysed by broad<br />
trade group – Overall total<br />
P6.1<br />
(Table 1B – Gross value of<br />
construction works at constant<br />
(2000) market prices per<strong>for</strong>med by<br />
main contractors analysed by broad<br />
trade group – <strong>Construction</strong> Works<br />
at construction sites)<br />
<strong>Construction</strong> <strong>Industry</strong> Annual Situation<br />
and adopt data (HK$ Million) from 2001<br />
to <strong>2011</strong><br />
In<strong>for</strong>mation collected through survey<br />
<strong>for</strong>ms<br />
The survey covers all construction<br />
establishments engaged in all new<br />
architectural and civil engineering works,<br />
as well as demolition, repair and<br />
maintenance works at existing structures<br />
Statistics provide prompt indications of<br />
current output levels and trends in the<br />
construction industry “Overall total” is<br />
defined as “Whole <strong>Industry</strong>”<br />
“<strong>Construction</strong> Works at construction<br />
sites” excludes construction works at<br />
locations other than sites (named RMAA<br />
Works)<br />
P4.2/<br />
P5.2/<br />
P6.2<br />
Same report as P4.1/5.1/6.1 P4.2<br />
(Table 2A – Gross value of<br />
construction works in nominal terms<br />
per<strong>for</strong>med by main contractors at<br />
construction sites analysed by broad<br />
end-use group – Structures &<br />
facilities)<br />
P5.2 and P6.2<br />
(Table 2B – Gross value of<br />
construction works at constant<br />
(2000) market prices per<strong>for</strong>med by<br />
main contractors at construction sites<br />
analysed by broad end-use<br />
group –Structures & facilities)<br />
<strong>Construction</strong> <strong>Industry</strong> Annual Situation<br />
and adopt data (HK$ Million) from 2001<br />
to <strong>2011</strong><br />
“Structures & facilities” is defined as<br />
“Civil Works”<br />
A2
Annex A – Data Sources<br />
Data<br />
Relevant<br />
KPIs<br />
P4.3/<br />
P5.3/<br />
P6.3<br />
Data Sources Category / Sector Remarks<br />
Same report as P4.1/5.1/6.1 P4.3<br />
(Table 2A – Gross value of<br />
construction works in nominal terms<br />
per<strong>for</strong>med by main contractors at<br />
construction sites analysed by broad<br />
end-use group – Buildings)<br />
<strong>Construction</strong> <strong>Industry</strong> Annual Situation<br />
and adopt data (HK$ Million) from 2001<br />
to <strong>2011</strong><br />
“Buildings” is defined as “New Building<br />
Works”<br />
P5.3 and P6.3<br />
(Table 2B – Gross value of<br />
construction works at constant<br />
(2000) market prices per<strong>for</strong>med by<br />
main contractors at construction sites<br />
analysed by broad end-use<br />
group –Buildings)<br />
P4.4/<br />
P5.4<br />
Same report as P4.1/5.1/6.1 P4.4<br />
(Table 1A – Gross value of<br />
construction works in nominal terms<br />
per<strong>for</strong>med by contractors analysed by<br />
broad trade group – <strong>Construction</strong><br />
works at locations other than sites)<br />
P5.4<br />
(Table 1B – Gross value of<br />
construction works at constant<br />
(2000) market prices per<strong>for</strong>med by<br />
main contractors analysed by broad<br />
trade group – <strong>Construction</strong> works at<br />
locations other than sites)<br />
<strong>Construction</strong> <strong>Industry</strong> Annual Situation<br />
and adopt data (HK$ Million) from 2001<br />
to <strong>2011</strong><br />
<strong>Construction</strong> works at locations other<br />
than sites include:- General trades –<br />
decoration, repair and maintenance,<br />
and construction works at minor work<br />
locations such as site investigation,<br />
demolition, and structural alternation<br />
and addition works<br />
- Special trades – carpentry, electrical<br />
equipment, ventilation, gas and water<br />
fitting installation and maintenance,<br />
etc.<br />
“<strong>Construction</strong> works at locations other<br />
than sites” is defined as “RMAA Works”<br />
which means repair, maintenance,<br />
alteration and additions...<br />
A3
Annex A – Data Sources<br />
Data<br />
Relevant<br />
KPIs<br />
P4.5/<br />
P5.5/<br />
P6.4<br />
Data Sources Category / Sector Remarks<br />
Same report as 4.1/5.1/6.1 P4.5<br />
(Table 1A – Gross value of<br />
construction works in nominal terms<br />
per<strong>for</strong>med by contractors analysed by<br />
broad trade group – Public sector<br />
construction sites)<br />
P5.5 and P6.4<br />
(Table 1B – Gross value of<br />
construction works at constant<br />
(2000) market prices per<strong>for</strong>med by<br />
main contractors analysed by broad<br />
trade group – Public sector<br />
construction sites)<br />
<strong>Construction</strong> <strong>Industry</strong> Annual Situation<br />
and adopt data (HK$ Million) from 2001<br />
to <strong>2011</strong><br />
Includes projects commissioned by the<br />
Government of the <strong>Hong</strong> <strong>Kong</strong> Special<br />
Administrative Region, MTR Corporation<br />
Limited and Airport Authority. Projects<br />
under the Home Ownership Scheme,<br />
which are commissioned by the Housing<br />
Authority, are also included.<br />
P4.6/<br />
P5.6/<br />
P6.5<br />
Same report as 4.1/5.1/6.1 P4.6<br />
(Table 1A – Gross value of<br />
construction works in nominal terms<br />
per<strong>for</strong>med by contractors analysed by<br />
broad trade group – Private sector<br />
construction sites)<br />
P5.6 and P6.5<br />
(Table 1B – Gross value of<br />
construction works at constant<br />
(2000) market prices per<strong>for</strong>med by<br />
main contractors analysed by broad<br />
trade group – Private sector<br />
construction sites)<br />
<strong>Construction</strong> <strong>Industry</strong> Annual Situation<br />
and adopt data (HK$ Million) from 2001<br />
to <strong>2011</strong><br />
Include projects commissioned by<br />
private developers. Projects under the<br />
Private Sector Participation Scheme are<br />
also included<br />
Percentage<br />
contribution<br />
of<br />
construction<br />
activities to<br />
GDP at basic<br />
prices<br />
P4a Same report as P4 <strong>Hong</strong> <strong>Kong</strong> Annual Situation<br />
Table 11 - GDP by major economic<br />
activity at current prices –<br />
Percentage contribution to GDP at<br />
basic prices (%) - <strong>Construction</strong><br />
Adopt % contribution of construction<br />
activities to GDP prices from 2001 to<br />
<strong>2011</strong><br />
A4
Data<br />
Capita<br />
(Mid-year<br />
Population)<br />
Relevant<br />
KPIs<br />
P5<br />
Data Sources Category / Sector Remarks<br />
Census and Statistics Department – Annual Press<br />
Release – Mid-year Population <strong>for</strong> 2012 [dated<br />
13.08.2012]<br />
http://www.censtatd.gov.hk/press_release/pressRele<br />
aseDetail.jspcharsetID=1&pressRID=2994<br />
<strong>Hong</strong> <strong>Kong</strong> Annual Situation<br />
Annex A – Data Sources<br />
Based on the population benchmark<br />
from the results of the <strong>2011</strong> Population<br />
Census, the population figures <strong>for</strong><br />
end-2006 to mid-<strong>2011</strong> have been revised<br />
No of Manual<br />
Workers<br />
P6,<br />
P7,<br />
HS1.2,<br />
1.4-1.5<br />
HS2.2,<br />
2.4-2.5<br />
P6.1 Census and Statistics Department –<br />
Quarterly publication-<br />
Quarterly <strong>Report</strong> of Employment and<br />
Vacancies at <strong>Construction</strong> Sites<br />
(2001 to <strong>2011</strong> reports)<br />
http://www.censtatd.gov.hk/products_and_s<br />
ervices/products/publications/statistical_rep<br />
ort/labour/index_cd_B1050004_dt_detail.jsp<br />
(Table 1 – Number of construction<br />
sites, manual workers engaged,<br />
vacancies and job opportunities<br />
in public and private sector sites<br />
analysed by type of site –All sites –<br />
Total)<br />
P6.2 Same report as 6.1 (Table 1 – Number of construction<br />
sites, manual workers engaged,<br />
vacancies and job opportunities<br />
in public and private sector sites<br />
analysed by type of site –All sites –<br />
Civil engineering sites)<br />
P6.3 Same report as 6.1 (Table 1 –– Number of construction<br />
sites, manual workers engaged,<br />
vacancies and job opportunities<br />
in public and private sector sites<br />
analysed by type of site – All sites –<br />
Building sites)<br />
P6.4 Same report as 6.1 (Table 1 – Number of construction<br />
sites, manual workers engaged,<br />
vacancies and job opportunities<br />
in public and private sector sites<br />
analysed by type of site – Public<br />
sector sites – Total)<br />
Average the data <strong>for</strong> every March, June,<br />
September and December in each year<br />
Survey coverage:<br />
- All sites = Civil engineering sites +<br />
Building sites OR Public sector sites<br />
+ Private sector sites<br />
- Civil engineering site – railways,<br />
roads, water works, drainage,<br />
reclamation and excavation works<br />
- Building site – residential buildings,<br />
commercial buildings and general<br />
superstructure erection<br />
- Private sector sites where the<br />
contracting party is a private<br />
company and registered with the<br />
Buildings Department;<br />
- Public sector sites - site under the<br />
control of Government departments<br />
or under the control of Airport<br />
Authority (AA) and the MTR<br />
Corporation Limited (MTR) (except<br />
superstructures registered with<br />
Buildings Department on MTR sites)<br />
Exclusion<br />
- <strong>Construction</strong> projects <strong>for</strong> small<br />
houses in the New Territories, and<br />
minor alternations, repairs,<br />
maintenance and interior<br />
A5
Data<br />
Relevant<br />
KPIs<br />
Data Sources Category / Sector Remarks<br />
P6.5 Same report as 6.1 (Table 1 – Number of construction<br />
sites, manual workers engaged,<br />
vacancies and job opportunities<br />
in public and private sector sites<br />
analysed by type of site – Private<br />
sector sites – Total)<br />
P7 Same report as 6.1 (Table 1 – Number of construction<br />
sites, manual workers engaged,<br />
vacancies and job opportunities<br />
in public and private sector sites<br />
analysed by type of site – Total)<br />
Annex A – Data Sources<br />
decoration of existing buildings<br />
are NOT included. Term<br />
maintenance contracts and term<br />
contractors <strong>for</strong> maintenance works<br />
or repair are also EXCLUDED.<br />
- Number of manual worker be<strong>for</strong>e<br />
2003 excludes E&M workers and<br />
those workers work at the sites<br />
under the charge of the Electrical<br />
and Mechanical Services<br />
Department and the Environmental<br />
Protection Department but the data<br />
includes those workers after 2003<br />
Gross floor<br />
area (new<br />
building<br />
projects)<br />
P7<br />
Census and Statistics Department – Annual<br />
publication – Key Statistics on Business<br />
<strong>Per<strong>for</strong>mance</strong> and Operating Characteristics of the<br />
Building, <strong>Construction</strong> and Real Estate Sectors<br />
(2001 to <strong>2011</strong> reports)<br />
http://www.censtatd.gov.hk/products_and_services/p<br />
roducts/publications/statistical_report/commerce_an<br />
d_industry/index_cd_B1080011_dt_latest.jsp<br />
<strong>Hong</strong> <strong>Kong</strong> Annual Situation<br />
(Table 4.4 – Land Area and Gross<br />
Floor Area of Real Estate Projects by<br />
Status of Project at end of the year –<br />
Total Gross floor area of buildings<br />
when completed)<br />
Adopt data from 2001 to <strong>2011</strong><br />
A6
Data<br />
No. of<br />
reportable<br />
industrial<br />
accidents<br />
Relevant<br />
KPIs<br />
HS1<br />
Data Sources Category / Sector Remarks<br />
Labour Department – data obtained through email<br />
enquiry (dated 1/11/<strong>2011</strong> <strong>for</strong> 2010 data, 19/4/<strong>2011</strong><br />
<strong>for</strong> 2000-2009 data, 8/11/2012 <strong>for</strong> <strong>2011</strong> data)<br />
<br />
Annex A – Data Sources<br />
New Works – refers to those<br />
construction sites where new<br />
development or redevelopment works<br />
are being carried out. This includes but<br />
not limited to, building, piling, demolition,<br />
site <strong>for</strong>mation and civil engineering<br />
works.<br />
RMAA Works – means repair,<br />
maintenance, alteration & addition and<br />
refers to those minor works such as<br />
construction projects <strong>for</strong> village type<br />
houses in the N.T., minor alternations,<br />
repairs maintenance and interior<br />
decoration of existing buildings.<br />
No. of fatal<br />
accidents<br />
HS2<br />
Labour Department – data obtained through email<br />
enquiry (dated 1/11/<strong>2011</strong> <strong>for</strong> 2010 data, 19/4/<strong>2011</strong><br />
<strong>for</strong> 2000-2009 data, 8/11/2012 <strong>for</strong> <strong>2011</strong> data)<br />
<br />
Ditto<br />
No. of<br />
summonses<br />
convicted<br />
HS3<br />
Labour Department – data obtained through email<br />
enquiry (dated 26/10/<strong>2011</strong> <strong>for</strong> 2000-2010 data,<br />
30/10/2012 <strong>for</strong> <strong>2011</strong> data)<br />
<br />
Ditto<br />
A7
Data<br />
Workers’<br />
wages Index<br />
Relevant<br />
KPIs<br />
M1<br />
Data Sources Category / Sector Remarks<br />
1) Census and Statistics Department – Quarterly<br />
publication – Quarterly <strong>Report</strong> on General<br />
Household Survey (2008 to <strong>2011</strong> reports)<br />
and<br />
2) Median monthly employment earnings in<br />
construction industry by occupation as provided by<br />
C&SD through email enquiry (dated 20/11/2012 <strong>for</strong><br />
<strong>2011</strong> data and 28/2/2013 <strong>for</strong> 2008 to 2010 data)<br />
http://www.censtatd.gov.hk/products_and_services/p<br />
roducts/publications/statistical_report/labour/index_c<br />
d_B1050001_dt_detail.jsp<br />
(Section 4 – Summary Statistics –<br />
Median monthly employment<br />
earnings (HK$))<br />
Table 1 : Number of employees and<br />
median monthly employment<br />
earnings in construction industry by<br />
occupation – Overall HK$<br />
Annex A – Data Sources<br />
As confirmed by C&SD, Median monthly<br />
employment earnings in the report are<br />
nominal values not subject to any<br />
adjustment. It includes Chinese New<br />
Year bonus/double pay.<br />
<strong>Construction</strong> – including building<br />
construction, civil engineering,<br />
demolition and site preparation, building<br />
services installation and maintenance;<br />
and decoration and repair.<br />
Registered<br />
Workers<br />
under and<br />
above 40<br />
M2<br />
<strong>Construction</strong> Workers Registration Authority – data<br />
obtained through email enquiry (dated 1/11/<strong>2011</strong> <strong>for</strong><br />
2007 to 2010 data and 19/10/2012 <strong>for</strong> <strong>2011</strong> data)<br />
<br />
<br />
Total<br />
number of<br />
Registered<br />
workers<br />
M2 Ditto <br />
Graduates<br />
retained in<br />
the industry<br />
after 12<br />
months<br />
working<br />
M3<br />
<strong>Construction</strong> <strong>Industry</strong> Council Training<br />
Academy –Trainees Recruitment & Placement<br />
Department – data obtained through email enquiry<br />
(dated 27/2/2013 <strong>for</strong> 2000 to <strong>2011</strong> data)<br />
<br />
<br />
No. of<br />
construction<br />
graduate<br />
M3 Ditto <br />
A8
Annex B – Terms and Definitions<br />
Annex B – Terms and Definitions<br />
Civil Works<br />
Following the <strong>Report</strong> on the Quarterly Survey of <strong>Construction</strong> Output, civil works refer to construction works per<strong>for</strong>med by<br />
main contractors at construction sites by end-use group nature named “Structures and facilities” which include transport, other<br />
utilities & plant, environment and sports & recreation.<br />
Following the definition under the <strong>Report</strong> on the Quarterly <strong>Report</strong> of Employment and Vacancies at <strong>Construction</strong> Sites,<br />
civil engineering works include railways, roads, highways, bridges, airport, port works, water works, drainage, reclamation,<br />
excavation works, site <strong>for</strong>mation, rest gardens, open spaces, sport grounds, other urban services facilities, service stations<br />
and plant and other related construction project.<br />
New Building Works<br />
Following the <strong>Report</strong> on the Quarterly Survey of <strong>Construction</strong> Output, new building works refer to the construction works<br />
per<strong>for</strong>med by main contractors at construction sites by end-use group nature named “Buildings” which include residential,<br />
commercial, industrial & storage and service.<br />
Following the definition under the <strong>Report</strong> on the Quarterly <strong>Report</strong> of Employment and Vacancies at <strong>Construction</strong> Sites,<br />
building works include residential buildings, commercial buildings, industrial buildings and general superstructure erection<br />
depending on its nature of works or the end-use of the construction project.<br />
RMAA works<br />
Following the <strong>Report</strong> on the Quarterly Survey of <strong>Construction</strong> Output, RMAA works refers to the construction works at<br />
locations other than sites, including general trades and special trades.<br />
General trades include decoration, repair and maintenance and construction works at minor work locations such as site<br />
investigation, demolition, and structural alternation and addition works.<br />
Special trades include carpentry, electrical equipment, ventilation, gas and water fitting installation and maintenance etc.<br />
Labour Department defines RMAA works as those repair, maintenance, alteration & addition works and also refer to those<br />
minor works such as construction projects <strong>for</strong> village type houses in the N.T., minor alterations, repairs, maintenance and<br />
interior decoration of existing buildings.<br />
New Works<br />
<strong>Construction</strong> Site<br />
Labour Department defines New Works as those construction sites where new development or re-development works are<br />
being carried out. This included, without limited to, building, piling, demolition, site <strong>for</strong>mation and civil engineering works.<br />
It refers to a demarcated locality where one or more stages of construction work are being carried on.<br />
B1
Public Sector<br />
Annex B – Terms and Definitions<br />
Following the <strong>Report</strong> on the Quarterly Survey of <strong>Construction</strong> Output, public sector construction works includes project<br />
commissioned by the Government of the <strong>Hong</strong> <strong>Kong</strong> Special Administrative Region, MTR Corporation Limited and Airport<br />
Authority. Projects under the Home Ownership Scheme, which are commissioned by Housing Authority, are also included.<br />
Following the <strong>Report</strong> on the Quarterly <strong>Report</strong> of Employment and Vacancies at <strong>Construction</strong> Sites, public sector sites<br />
refer to those under the control of Government departments, the Airport Authority and the MTR.<br />
Private Sector<br />
Following the <strong>Report</strong> on the Quarterly Survey of <strong>Construction</strong> Output, private sector construction works includes projects<br />
commissioned by private developers. Project under the Private Sector Participation Scheme are also included.<br />
The private sector data in Table 3 includes those construction works carried out at locations other than sites, i.e. decoration,<br />
repair and maintenance, works at minor works location, etc.<br />
Following the <strong>Report</strong> on the Quarterly <strong>Report</strong> of Employment and Vacancies at <strong>Construction</strong> Sites, private sector sites<br />
refer to those registered with the Buildings Department, including superstructure on sites above the MTR Stations.<br />
Intermediate<br />
consumption<br />
Public Sector Site<br />
(H&S indicators)<br />
Private Sector Site<br />
(H&S indicators)<br />
Manual Workers<br />
The intermediate consumption of the construction industry comprise the expenses on consumption of building materials and<br />
supplies on sites and sundry supplies in business operation, rentals, expenses on repair and maintenance and other services<br />
such as transportation, technical consultancy, insurance, etc. Consumption of materials and supplies is obtained by adjusting<br />
the value of purchases by changes in inventories net of price appreciation. Payments to labour-only sub-contractors are<br />
included in compensation of employees.<br />
Public sector sites include sites under the Development Bureau, Housing Authority, other government departments, MTR<br />
Corporation Limited and Airport Authority.<br />
Private sector sites refer to sites other than public sector sites (Development Bureau, Housing Authority, other government<br />
departments, MTR Corporation Limited and Airport Authority).<br />
Following the <strong>Report</strong> on the Quarterly <strong>Report</strong> of Employment and Vacancies at <strong>Construction</strong> Sites, manual workers at<br />
construction site are people either directly employed by the main contractor, or being called upon by sub-contractors or<br />
gangers to work in the construction site on the survey reference date. They include skilled, semi-skilled and general workers.<br />
Professional and administrative personnel such as architects, engineers, surveyors, contract managers, site agents, clerks of<br />
works, technicians, site <strong>for</strong>emen and general clerical staff are EXCLUDED. Number of manual workers also excludes the<br />
workers work <strong>for</strong> RMAA works. For sites under the charge of Government departments, manual workers in some 40<br />
selected major occupations at the skilled and semi-skilled levels are covered in the administrative returns furnished by the<br />
respective Government departments.<br />
B2