Preprint - Harvard-Smithsonian Center for Astrophysics
Preprint - Harvard-Smithsonian Center for Astrophysics
Preprint - Harvard-Smithsonian Center for Astrophysics

You also want an ePaper? Increase the reach of your titles
YUMPU automatically turns print PDFs into web optimized ePapers that Google loves.
Astronomy & <strong>Astrophysics</strong> manuscript no. 10368 c○ ESO 2009<br />
April 2, 2009<br />
Tracing the young massive high-eccentricity binary system<br />
θ 1 Orionis C through periastron passage ⋆<br />
S. Kraus 1 , G. Weigelt 1 , Y. Y. Balega 2 , J. A. Docobo 3 , K.-H. Hofmann 1 , T. Preibisch 4 , D. Schertl 1 , V. S. Tamazian 3 ,<br />
T. Driebe 1 , K. Ohnaka 1 , R. Petrov 5 , M. Schöller 6 , and M. Smith 7<br />
1 Max-Planck-Institut für Radioastronomie, Auf dem Hügel 69, 53121 Bonn, Germany<br />
2 Special Astrophysical Observatory, Russian Academy of Sciences, Nizhnij Arkhyz, Zelenchuk region, Karachai-Cherkesia, 357147, Russia<br />
3 Astronomical Observatory R. M. Aller, University of Santiago de Compostela, Galicia, Spain<br />
4 Universitäts-Sternwarte München, Scheinerstr. 1, 81679 München, Germany<br />
5 Laboratoire Universitaire d’Astrophysique de Nice, UMR 6525 Université de Nice/CNRS, Parc Valrose, 06108 Nice Cedex 2, France<br />
6 European Southern Observatory, Karl-Schwarzschild-Str. 2, 85748 Garching, Germany<br />
7 Centre <strong>for</strong> <strong>Astrophysics</strong> & Planetary Science, University of Kent, Canterbury CT2 7NH, UK<br />
Received 2008-06-11; accepted 2009-01-27<br />
ABSTRACT<br />
Context. The nearby high-mass star binary system θ 1 Ori C is the brightest and most massive of the Trapezium OB stars at the core of the<br />
Orion Nebula Cluster, and it represents a perfect laboratory to determine the fundamental parameters of young hot stars and to constrain the<br />
distance of the Orion Trapezium Cluster.<br />
Aims. By tracing the orbital motion of the θ 1 Ori C components, we aim to refine the dynamical orbit of this important binary system.<br />
Methods. Between January 2007 and March 2008, we observed θ 1 Ori C with VLTI/AMBER near-infrared (H- and K-band) long-baseline<br />
interferometry, as well as with bispectrum speckle interferometry with the ESO 3.6 m and the BTA 6 m telescopes (B ′ - and V ′ -band).<br />
Combining AMBER data taken with three different 3-telescope array configurations, we reconstructed the first VLTI/AMBER closure-phase<br />
aperture synthesis image, showing the θ 1 Ori C system with a resolution of ∼ 2 mas. To extract the astrometric data from our spectrally<br />
dispersed AMBER data, we employed a new algorithm, which fits the wavelength-differential visibility and closure phase modulations along<br />
the H- and K-band and is insensitive to calibration errors induced, <strong>for</strong> instance, by changing atmospheric conditions.<br />
Results. Our new astrometric measurements show that the companion has nearly completed one orbital revolution since its discovery in 1997.<br />
The derived orbital elements imply a short-period (P ≈ 11.3 yr) and high-eccentricity orbit (e ≈ 0.6) with periastron passage around 2002.6.<br />
The new orbit is consistent with recently published radial velocity measurements, from which we can also derive the first direct constraints on<br />
the mass ratio of the binary components. We employ various methods to derive the system mass (M system = 44 ± 7 M⊙) and the dynamical<br />
distance (d = 410 ± 20 pc), which is in remarkably good agreement with recently published trigonometric parallax measurements obtained<br />
with radio interferometry.<br />
Key words. stars: <strong>for</strong>mation – stars: fundamental parameters – stars: individual: θ 1 Ori C – binaries: close – techniques: interferometric<br />
1. Introduction<br />
The Orion Nebula (M42) is one of the closest (d ∼ 400 − 450<br />
pc) and most prominent star-<strong>for</strong>ming regions (see O’Dell 2001<br />
<strong>for</strong> a review). It contains a massive cluster of very young<br />
(∼ 1×10 6 yr) stars (cf. Herbig & Terndrup 1986; McCaughrean<br />
& Stauffer 1994; Hillenbrand 1997), which is known as the<br />
Orion Nebula Cluster (ONC). Due to its relatively close dis-<br />
Send offprint requests to: skraus@mpifr-bonn.mpg.de<br />
⋆ Based on observations made with ESO telescopes at the La<br />
Silla Paranal Observatory under the OT and VISA-MPG GTO programme<br />
IDs 078.C-0360(A), 080.C-0541(A,B,C,D), 080.D-0225(B),<br />
and 080.C-0388(A).<br />
tance and its favorable celestial location (which makes it accessible<br />
to observatories on the northern and southern hemispheres),<br />
the ONC is probably the best investigated young cluster<br />
in the whole sky and has been observed at virtually every<br />
wavelength. It is a perfect laboratory <strong>for</strong> observations of young<br />
stellar objects over the full mass range, from very low-mass<br />
brown dwarfs to massive O-type stars.<br />
The brightest star in the cluster is the massive O7–O5.5<br />
type 1 star θ 1 Ori C, which is known to be a close visual bi-<br />
1 Simón-Díaz et al. (2006) determined the stellar effective temperature<br />
of θ 1 Ori C to be T eff = 39 000 ± 1 000 K with log g = 4.1 dex.<br />
In recent stellar atmosphere models (Martins et al. 2005), this corresponds<br />
to a spectral type of O5.5–O6, while the same parameters
2 Kraus et al.: Tracing the high-eccentricity binary θ 1 Ori C through periastron passage<br />
nary system. After the initial discovery of the companion at a<br />
separation ρ of 0. ′′ 033 (33 mas, corresponding to about 15 AU)<br />
with near-infrared (NIR) bispectrum speckle interferometry by<br />
Weigelt et al. (1999), Schertl et al. (2003) have presented further<br />
observations and reported the first detection of orbital motion.<br />
Kraus et al. (2007) presented the first speckle observations<br />
at visual wavelengths, the first NIR long-baseline interferometric<br />
observations of θ 1 Ori C using the IOTA interferometer,<br />
and produced an aperture-synthesis image of the system.<br />
They also per<strong>for</strong>med a joint analysis of all existing interferometric<br />
measurements that covered a period of more than 9 years<br />
and clearly revealed orbital motion. After reaching a maximum<br />
value of 42 mas in 1999, the separation of the system steadily<br />
decreased to 13 mas in 2005. Detailed modeling of these data<br />
yielded a preliminary orbit solution with a high eccentricity<br />
(e ∼ 0.91) and a period of 10.9 yrs. According to this solution,<br />
the periastron passage should have occurred around July<br />
2007 with a closest separation of less than 2 AU. Patience et al.<br />
(2008) recently presented additional interferometric observations<br />
of θ 1 Ori C obtained with NPOI at visual wavelengths.<br />
Extending the orbital coverage by about 1.2 yrs, they measured<br />
a companion position which deviates ∼ 4 mas from the position<br />
predicted by the orbital solution of Kraus et al. (2007) and<br />
concluded that the orbit has a considerably lower eccentricity<br />
(e ∼ 0.16) and a longer period (∼ 26 yrs). This shows a clear<br />
need <strong>for</strong> further interferometric observations that will clarify<br />
this apparent discrepancy. A reliable and accurate orbit solution<br />
will also provide unique constraints to the basic stellar parameters<br />
and, most importantly, will yield the masses of the stars<br />
and the distance.<br />
The orbital motion of the companion might also be responsible<br />
<strong>for</strong> the radial velocity variations reported by Stahl et al.<br />
(1996, 2008) and others. Due to the incomplete coverage and<br />
the significant scatter in the derived velocities, it is not yet possible<br />
to derive the orbital elements of the spectroscopic orbit<br />
(Stahl et al. 2008).<br />
In spite of its importance and the huge number of studies,<br />
the distance to the ONC is, even after decades of investigation,<br />
still not well known and an issue of ongoing discussion.<br />
The “canonical” value of 450 pc (Herbig & Terndrup 1986;<br />
Genzel & Stutzki 1989) that was widely used during the last<br />
two decades was recently challenged by some studies finding<br />
significantly smaller values. Numerous new distance determinations<br />
(e.g. Stassun et al. 2006; Jeffries 2007; Mayne<br />
& Naylor 2008), also including the first direct trigonometric<br />
parallax measurements on radio sources in the ONC by Hirota<br />
et al. (2007, 437 ± 19 pc), Sandstrom et al. (2007, 389 +24<br />
−21 pc),<br />
and Menten et al. (2007, 414 ± 7 pc), yielded distances mainly<br />
in the range between 390 pc and 440 pc. The ∼ 13% difference<br />
in these distance estimates, which to some extent might<br />
also include an intrinsic distance spread of the studied stars,<br />
leads to an ∼ 30% uncertainty in the derived stellar luminosities<br />
and correspondingly affects any age and mass estimates <strong>for</strong> the<br />
stars. This is a serious limitation to the usefulness of the exceptionally<br />
well-studied young stellar population; e.g., <strong>for</strong> the calicorrespond<br />
to a later spectral type of O7.5–O8 using earlier models<br />
(e.g. Vacca et al. 1996).<br />
Table 2. AMBER calibrator stars and their characteristics, including<br />
uni<strong>for</strong>m disk (UD) diameters.<br />
Star V H K Spectral Adopted UD diameter<br />
Type<br />
[mas]<br />
HD 33833 5.9 3.9 3.8 G7III 0.83 ± 0.06 a<br />
HD 37128 1.7 2.4 2.3 B0I 0.86 ± 0.16 b<br />
HD 41547 5.9 5.1 5.0 F4V 0.41 ± 0.03 a<br />
HD 43023 5.8 3.7 3.5 G8III 0.98 ± 0.07 a<br />
HD 50281 6.6 4.3 4.1 K3V 0.77 ± 0.10 c<br />
Notes – a UD diameter computed with ASPRO<br />
(http://www.jmmc.fr/aspro page.htm).<br />
b UD diameter taken from Mozurkewich et al. (1991).<br />
c UD diameter taken from getCal tool<br />
(http://mscweb.ipac.caltech.edu/gcWeb/).<br />
bration of pre-main-sequence evolutionary models or in the investigation<br />
of the spatial relationship between the young stellar<br />
groups in the wider region of the Orion association. There<strong>for</strong>e,<br />
trigonometric parallax measurements of stars in the core of<br />
the Trapezium OB star cluster (e.g. on GMR 12=θ 1 Ori A2, <strong>for</strong><br />
which Menten et al. 2007 measured 418 ± 9 pc) are highly desirable.<br />
An alternative way to obtain such distance estimates<br />
is through astrometric measurements on close binary systems<br />
such as θ 1 Ori C, yielding the dynamical parallax of the system.<br />
2. Observations and data reduction<br />
2.1. Bispectrum speckle interferometry<br />
Bispectrum speckle interferometry is a powerful technique<br />
to overcome atmospheric perturbations and to reach the<br />
diffraction-limited resolution of ground-based telescopes at visual<br />
wavelengths. After monitoring the orbital evolution of the<br />
system between 1997 and 2004 at wavelengths between 2.1 µm<br />
and 545 nm (ρ = 43 . . . 24 mas; Weigelt et al. 1999; Schertl<br />
et al. 2003; Kraus et al. 2007) using the Russian Big Telescope<br />
Alt-azimuthal (BTA) 6.0 m telescope, θ 1 Ori C became unresolvable<br />
with 6 m-class telescopes in 2006. In November 2007<br />
(ρ = 20 mas) and January 2008, the system could again be resolved<br />
with the BTA 6 m telescope using a V ′ medium-band<br />
filters (λ c = 550 nm, ∆λ = 20 nm). For these observations, a<br />
1280×1024 pixel CCD with a multi-alkali S25 intensifier photocathode<br />
was used.<br />
In January 2008, additional speckle measurements using V ′<br />
(λ c = 550 nm, ∆λ = 30 nm) and B ′ (λ c = 440 nm, ∆λ = 16 nm)<br />
medium-band filters were obtained with the ESO 3.6 m telescope.<br />
The speckle observations were carried out in the course<br />
of ESO open-time programme 080.C-0388(A) using our visitor<br />
speckle camera, which employs a Marconi/EEV electronmultiplying<br />
CCD. For the speckle observations, we recorded<br />
interferograms of θ 1 Ori C and of nearby unresolved stars in order<br />
to compensate <strong>for</strong> the atmospheric speckle transfer function.<br />
The calibrator stars, the number of recorded interferograms<br />
and the detector integration times (DITs) are listed in<br />
Table 1. The modulus of the Fourier trans<strong>for</strong>m of the ob-
Kraus et al.: Tracing the high-eccentricity binary θ 1 Ori C through periastron passage 3<br />
Table 1. Observation log <strong>for</strong> our new bispectrum speckle and long-baseline interferometric observations.<br />
Instrument Date UT Telescope Spectral DIT No. Interferograms Calibrator(s)<br />
[UT] Triplet Mode Target/Calibrator<br />
BTA 6 m/Speckle 2007 Nov 25 550 nm/20 nm 20 ms 1940/1940 θ 1 Ori D<br />
ESO 3.6 m/Speckle 2008 Jan 10 440 nm/16 nm 10 ms 18000/10000 36 Ori<br />
ESO 3.6 m/Speckle 2008 Jan 10 550 nm/30 nm 10 ms 10000/6000 36 Ori<br />
BTA 6 m/Speckle 2008 Jan 26 550 nm/20 nm 20 ms 1500/2000 θ 1 Ori D<br />
VLTI/AMBER 2007 Jan 08 04:36, 06:32 UT1-UT3-UT4 LR-K 26 ms 12000/10000 HD 41547<br />
VLTI/AMBER 2007 Dec 03 07:19 A0-D0-H0 LR-HK 26 ms 5000/10000 HD 33833<br />
VLTI/AMBER 2007 Dec 03 07:34, 08:44 A0-D0-H0 LR-HK 50 ms 7500/7500 HD 33833<br />
VLTI/AMBER 2007 Dec 03 07:48, 08:54 A0-D0-H0 LR-HK 100 ms 2000/750 HD 33833<br />
VLTI/AMBER 2007 Dec 05 06:05 A0-K0-G1 LR-HK 26 ms 5000/5000 HD 33833<br />
VLTI/AMBER 2007 Dec 05 05:49, 07:28 A0-K0-G1 LR-HK 50 ms 10000/15000 HD 33833<br />
VLTI/AMBER 2007 Dec 05 06:17, 07:46 A0-K0-G1 LR-HK 100 ms 3500/2500 HD 33833<br />
VLTI/AMBER 2008 Feb 22 03:44 A0-D0-H0 LR-HK 50 ms 5000/10000 HD 37128, HD 50281<br />
VLTI/AMBER 2008 Feb 22 04:21 A0-D0-H0 LR-HK 100 ms 2500/3500 HD 37128, HD 50281<br />
VLTI/AMBER 2008 Feb 24 03:11 A0-K0-G1 LR-HK 50 ms 10000/5000 HD 37128<br />
VLTI/AMBER 2008 Feb 24 02:37 A0-K0-G1 LR-HK 100 ms 6000/4000 HD 37128<br />
VLTI/AMBER 2008 Mar 03 02:31 D0-H0-G1 LR-HK 50 ms 5000/5000 HD 43023<br />
VLTI/AMBER 2008 Mar 03 02:52 D0-H0-G1 LR-HK 100 ms 1500/1500 HD 43023<br />
ject (visibility) was obtained with the speckle interferometry<br />
method (Labeyrie 1970). For image reconstruction we used<br />
the bispectrum speckle interferometry method (Weigelt 1977,<br />
Weigelt & Wirnitzer 1983, Lohmann et al. 1983, Hofmann &<br />
Weigelt 1986).<br />
Besides providing an independent astrometric measurement,<br />
our bispectrum speckle interferometric measurement<br />
is of special importance as it allows us to solve the 180 ◦ -<br />
ambiguity, which is inherent to long-baseline interferometric<br />
investigations which do not include the closure phase (e.g.<br />
Patience et al. 2008) or <strong>for</strong> which the instrumental closure<br />
phase sign has not yet been calibrated (as <strong>for</strong> VLTI/AMBER).<br />
Solving this ambiguity is essential <strong>for</strong> deriving the orbit of<br />
the system. There<strong>for</strong>e, we paid special attention while deriving<br />
the field orientation of our speckle images, using calibration<br />
measurements which were taken with the same instrument<br />
setup during the same night as the θ 1 Ori C observations on<br />
θ 1 Ori A, θ 1 Ori B and the well-studied multi-component object<br />
η Carinae. For the January 2008 observations, a position angle<br />
calibration with an accuracy of ∼ 0.3 ◦ was done using K ′ -band<br />
observations covering the Trapezium stars θ 1 Ori A, B, and E,<br />
followed by the V ′ and B ′ observations of θ 1 Ori B, which is<br />
a binary system with a separation of ∼1 ′′ , where the fainter<br />
component is a close binary with a separtion of ∼0. ′′ 15. This<br />
allows us to unambiguously determine that in January 2008,<br />
the fainter component (C2) was located to the southwest of the<br />
primary star (Fig. 1 and A.1). Per<strong>for</strong>ming a detailed re-analysis<br />
on all Speckle data taken by our group between 1997 and 2005,<br />
we found a 180 ◦ -calibration problem which affected the position<br />
angle of the Speckle measurements at epochs 2003.8,<br />
2003.9254, 2003.928, and 2004.8216, as published in Kraus<br />
et al. 2007. Since these Speckle measurements were used <strong>for</strong><br />
the calibration of the IOTA and NPOI long-baseline interferometric<br />
observations by Kraus et al. (2007) and Patience et al.<br />
(2008), a revision of the preliminary orbital solutions presented<br />
in these papers is required (as presented in Sect. 5.1). In Tab. 3,<br />
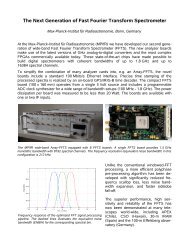
Fig. 2. uv-plane coverage obtained at four epochs on θ 1 Ori C with<br />
VLTI/AMBER. The radial extension of the uv-tracks reflects the spectral<br />
coverage of our AMBER interferometric data, covering either the<br />
K-band (LR-K mode, 2007 Jan 08) or the H- and K-band (LR-HK<br />
mode, 2007 Dec 03-05, 2008 Feb 22-24, 2008 Mar 03).<br />
we list all available astrometric data, taking the quadrant correction<br />
into account.<br />
2.2. VLTI/AMBER spectro-interferometry<br />
AMBER is the NIR interferometric beam-combiner instrument<br />
(Petrov et al. 2007) of the Very Large Telescope Interferometer<br />
(VLTI), which is located on Cerro Paranal/Chile and operated<br />
by ESO. For the beam combination, either three 8.2 m unit telescopes<br />
(UTs) or three of the allocatable 1.8 m auxiliary tele-
4 Kraus et al.: Tracing the high-eccentricity binary θ 1 Ori C through periastron passage<br />
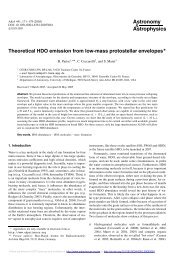
1997.8, BTA 6 m, H-band 1999.7, BTA 6 m, J-band 2000.8, BTA 6 m, V ′ -band<br />
2003.9, BTA 6 m, V ′ -band 2004.8, BTA 6 m, V ′ -band 2005.9, IOTA/IONIC3, H-band<br />
2007.9, VLTI/AMBER, K-band 2007.9, ESO 3.6 m, B ′ -band 2008.1, BTA 6 m, V ′ -band<br />
Fig. 1. Selection of interferometric images of the θ 1 Ori C system obtained by our group between 1997 and 2008, revealing the orbital motion<br />
of the companion. The images were reconstructed either from H-, J-, V ′ -, or B ′ -band speckle interferograms recorded at the BTA 6 m or the<br />
ESO 3.6 m telescopes, or from H-band Michelson interferograms recorded with the IOTA 3-telescope interferometer (see Kraus et al. 2007<br />
<strong>for</strong> details). For epoch 2007.9, we show the aperture synthesis image which we reconstructed from VLTI/AMBER data using the procedure<br />
described in Sect. 4. For each image, 10% intensity level contours are shown. In the speckle images, the fitted component positions are marked<br />
with an asterisk.<br />
scopes (ATs) can be used. One outstanding feature of AMBER<br />
is its spectral capability, allowing one to observe several spectral<br />
bands with low spectral resolution simultaneously (LR-<br />
JHK mode, R = λ/∆λ = 35, covering the J-band around<br />
1.2 µm, the H-band around 1.6 µm, and the K-band around<br />
2.2 µm). The wide wavelength coverage offered by this spectral<br />
mode allows us to fit the binary separation vector with a high<br />
accuracy and observing efficiency (as discussed in Sect. 3).<br />
The VLTI/AMBER data was recorded in the course of three<br />
ESO programmes, yielding the uv-plane coverage shown in<br />
Fig. 2. For each science observation, we also recorded interferograms<br />
<strong>for</strong> at least one interferometric calibrator star (see<br />
Tab. 2 <strong>for</strong> the characteristics of our calibrator stars), which allows<br />
us to calibrate the visibilities and the closure phases <strong>for</strong><br />
instrumental as well as atmospheric effects.
Kraus et al.: Tracing the high-eccentricity binary θ 1 Ori C through periastron passage 5<br />
For AMBER data reduction, we employed the amdlib2-<br />
data reduction software 2 (release 2.1), which is based on the<br />
P2VM algorithm (Tatulli et al. 2007). For the LR-HK data, we<br />
applied the data selection criteria outlined in Kraus et al. (2008)<br />
in order to remove frames which were either degraded by atmospheric<br />
effects or were recorded significantly offset from zero<br />
optical path delay.<br />
For the accuracy achievable with our binary model fits,<br />
the absolute calibration of the wavelength scale is of special<br />
importance. There<strong>for</strong>e, we carefully refined the wavelength<br />
calibration using the telluric gaps between the observed<br />
spectral bands. Using this procedure (which is described<br />
in Appendix A), we reach a calibration accuracy of about<br />
0.03 µm, which is still the dominating limiting factor on the<br />
total achievable astrometric accuracy (∼ 2%).<br />
While the target/calibrator observations from January 2007<br />
were taken under good and stable atmospheric conditions,<br />
some of the observations in December 2007 and February 2008<br />
suffer from strongly variable seeing conditions and short atmospheric<br />
coherence times. It is known that short coherence times<br />
can result in a decrease of the measured fringe contrast, which<br />
might not be completely calibrated out using calibrator measurements.<br />
This effect can impose errors on the absolute calibration,<br />
which are expected to increase with longer DIT and towards<br />
shorter wavelengths. To illustrate this effect, in Fig. 4 we<br />
plot the calibrated visibilities measured during our December<br />
2007 observation campaign and compare them to the cosine<br />
visibility modulation of a binary source. In particular, in the<br />
H-band the resulting calibration errors can be on the order of<br />
20%.<br />
However, since all spectral channels of an AMBER interferogram<br />
are recorded at the same time, the wavelengthdifferential<br />
observables (in particular, the differential visibility<br />
δV(λ)) are practically insensitive to this degradation.<br />
There<strong>for</strong>e, in Sect. 3 we employ a fitting algorithm in which<br />
we fit only differential visibilities and closure phases in order<br />
to determine the θ 1 Ori C binary separation vector.<br />
A fundamental problem one encounters when interpreting<br />
VLTI/AMBER 3-telescope data concerns the lack of a calibration<br />
measurement <strong>for</strong> the closure phase sign, resulting in a 180 ◦<br />
uncertainty on the position angle of binary star observations.<br />
Since our θ 1 Ori C VLTI/AMBER observations from December<br />
2007 and February 2008 bracket the bispectrum speckle measurement<br />
from January 2008, our data set allows us to unambigously<br />
define the closure phase sign <strong>for</strong> these observations,<br />
providing a direct calibration of the 180 ◦ uncertainty <strong>for</strong><br />
VLTI/AMBER <strong>for</strong> the first time.<br />
3. Modeling<br />
In order to derive the binary separation ρ and position angle 3<br />
Θ from the speckle data, we used the same algorithm as in our<br />
earlier studies on this system (Weigelt et al. 1999; Schertl et al.<br />
2 The amdlib2 software package is available from the website<br />
http://www.jmmc.fr/data processing amber.htm<br />
3 Following convention, we measure the position angle (PA) East of<br />
North.<br />
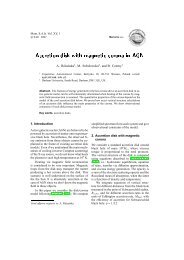
Fig. 4. AMBER visibilities measured on 2007 Dec 03 and<br />
2007 Dec 05 plotted versus projected distance in the uv-plane (where<br />
the projection was perpendicular to the fitted binary separation vector<br />
Θ = 241.2 ◦ , i.e. x = u cos(Θ + 90 ◦ ) − v sin(Θ + 90 ◦ )). The solid<br />
red line shows the theoretical cosine visibility profile <strong>for</strong> a binary star<br />
with separation 19.07 mas and intensity ratio 0.30. As indicated by<br />
the strong visibility offsets, which particularly occur at high spatial<br />
frequencies, the absolute calibration is sometimes rather poor, reflecting<br />
the changing atmospheric conditions during these nights. It can<br />
also be seen that this calibration bias is particularly important <strong>for</strong> long<br />
DITs (50 ms, 100 ms), while it is nearly negligible <strong>for</strong> short DITs<br />
(26 ms, grey & black points). As expected, the spectral dependence of<br />
the visibility is not affected by these calibration uncertainties.<br />
2003; Kraus et al. 2007), fitting a cosine function directly to<br />
the 2-D speckle visibilities. For illustration, in the Appendix<br />
(Fig. A.1) we show power spectra and Fourier spectra determined<br />
from three independent data sets obtained during our<br />
observing run with the ESO 3.6 m telescope and compare them<br />
with the model power and Fourier spectra corresponding to a<br />
binary star.<br />
For the modeling of the AMBER data, we employed an<br />
optimized algorithm which fits closure phases (CP) and differential<br />
visibilities δV. Each AMBER LR-HK measurement<br />
records 16 K-band plus 11 H-band spectral channels in the<br />
wavelength range from 1.51 to 2.55 µm, covering about 40%<br />
of the object Fourier spectrum in radial direction (see uv-plane<br />
tracks in Fig. 2). Strongly resolved objects (such as binaries<br />
with a separation of ρ ∆λ/B, where ∆λ is the recorded spectral<br />
window and B ′ is the projected baseline length) can already<br />
show significant visibility modulation over this range of spatial<br />
frequencies (see illustration in Fig. 3). For instance, our θ 1 Ori C<br />
AMBER measurements from December 2007 probe spatial frequencies<br />
out to the eighth lobe of the cosine binary visibility<br />
modulation (Fig. 4) and the wavelength-differential visibilities<br />
recorded in a single AMBER H-/K-band measurement sample<br />
up to 3 visibility cycles. This wavelength-differential visibility<br />
modulation already provides all in<strong>for</strong>mation required to determine<br />
the binary separation and orientation. In this way, the<br />
absolute calibration of the visibility, which is subject to many<br />
adverse atmospheric effects, becomes dispensable.<br />
To determine the differential visibilities δV as used in our<br />
fitting algorithm, we first follow the standard data reduction<br />
and calibration procedure in order to correct <strong>for</strong> wavelength-
6 Kraus et al.: Tracing the high-eccentricity binary θ 1 Ori C through periastron passage<br />
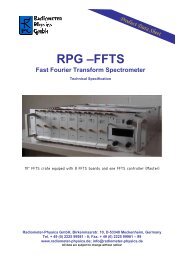
Fig. 3. Illustration of the basic principle of fitting binary parameters using wavelength-differential interferometric observables. Left: The<br />
VLTI/AMBER 3-telescope interferometer measures the interferometric observables in various spectral channels from 1.4 to 2.4 µm (as indicated<br />
by the color of the dots) and towards three different position angles, probing different regions in the two-dimensional Fourier spectrum<br />
of the source brightness distribution. The figure shows the visibility spectrum <strong>for</strong> a binary with ρ = 19.07 mas and Θ = 241.2 ◦ (as inferred<br />
<strong>for</strong> θ 1 Ori C on 2007 Dec 03) and the uv-sampling obtained with one of our AMBER observations on the same date. Middle and Right: The<br />
visibilities and phases show a wavelength-differential modulation which is independent of the absolute calibration (see Sect. 3) and which can<br />
be fitted to analytical models.<br />
dependent instrumental effects (using a calibrator measurement<br />
taken during the same night). Then, we remove the absolute<br />
calibration by subtracting the average visibility of the considered<br />
spectral window<br />
δV(λ) = V(λ) − 〈V(λ)〉 band , (1)<br />
yielding the differential visibility δV, which we compute separately<br />
<strong>for</strong> each spectral band (H and K-band).<br />
A similar approach is applied to the model visibilities<br />
V model (λ) (which we compute using equations 7, 11, and 12<br />
from Kraus et al. 2005):<br />
δV model (λ) = a (V model (λ) − b) , (2)<br />
where a and b are adjusted to minimize the residuals between<br />
the model visibilities and the measured wavelength-differential<br />
visibilities δV(λ) be<strong>for</strong>e a Levenberg-Marquardt least-square<br />
fitting algorithm is used to determine the best-fit model parameters.<br />
The measured closure phases are fit simultaneously with<br />
the differential visibilities, weighting each data point according<br />
to the determined error bars (see equations 8–10 in Kraus<br />
et al. 2005). Parameters in our binary star model are the binary<br />
separation ρ, the position angle Θ, the intensity ratio F C2 /F C1 ,<br />
and the uni<strong>for</strong>m disk diameter of the components. Since our<br />
earlier speckle measurements indicated that F C2 /F C1 is practically<br />
constant in the NIR wavelength range (see Kraus et al.<br />
2007), we assume that the intensity ratio does not vary over<br />
the H- and K-bands. For the model fitting, we fix the apparent<br />
diameters of the two stars to 0.22 mas <strong>for</strong> the primary star (corresponding<br />
to 10.6 R⊙ at a distance of 450 pc) and 0.15 mas <strong>for</strong><br />
the companion (7.2 R⊙, using the spectral type determined by<br />
Kraus et al. 2007 and the stellar evolutionary models of Martins<br />
et al. 2005). Our AMBER LR measurements and best-fit models<br />
are shown in Fig. 5 and 6. The derived astrometric data are<br />
given in Tab. 3.<br />
4. VLTI/AMBER aperture synthesis imaging<br />
Currently, the most commonly applied procedure to extract scientific<br />
in<strong>for</strong>mation from optical interferometric data is model<br />
fitting, which requires the selection of an appropriate (geometrical<br />
or astrophysically motivated) model, whose parameters<br />
are then adjusted to fit the interferometric observables. Since<br />
this model fitting approach requires a priori knowledge about<br />
the source structure, it might, in some cases, not be applicable<br />
or might lead to biased results. There<strong>for</strong>e, it is highly desirable<br />
that optical interferometers such as VLTI/AMBER have the capability<br />
of recovering the source brightness distribution free of<br />
any assumptions. The aim of this section is to apply state-ofthe-art<br />
aperture synthesis imaging techniques <strong>for</strong> the first time<br />
to real VLTI/AMBER data in order to independently confirm<br />
the scientific results obtained <strong>for</strong> θ 1 Ori C in the last section,<br />
and, simultaneously, to demonstrate the imaging capabilities of<br />
VLTI/AMBER on a relatively well-studied astrophysical target<br />
with limited intrinsic complexity.
Kraus et al.: Tracing the high-eccentricity binary θ 1 Ori C through periastron passage 7<br />
Fig. 5. Differential visibilities and closure phases measured with VLTI/AMBER in January 2007 (left), February 2008 (middle), and March 2008<br />
(right) on θ 1 Ori C. The solid lines show the best-fit model corresponding to the binary parameters given in Tab. 3.<br />
In order to obtain the uv-coverage required <strong>for</strong> aperture synthesis<br />
imaging, we combined the θ 1 Ori C AMBER data sets<br />
taken between December 2007 and March 2008 on three different<br />
3-telescope array configurations and at several hour angles.<br />
Assuming that the source morphology does not change significantly<br />
over the K-band (which seems well justified based on<br />
our earlier measurements of the wavelength-dependent binary<br />
flux ratio; Kraus et al. 2007), we make use of AMBER’s spectral<br />
coverage, yielding radial tracks in the uv-plane (Fig. 7, left).<br />
Since the K-band visibilities provide a more reliable absolute<br />
calibration (see Sect. 2.2), we did not use the H-band data <strong>for</strong><br />
image reconstruction and rejected also one measurement taken<br />
under particularly poor and variable conditions (2007 Dec 05,<br />
UT 07:46). In order to correct <strong>for</strong> the binary orbital motion<br />
over the 3-month period (∆ρ = 2.2 mas, ∆Θ = 6.6 ◦ ), we<br />
apply a rotation-compensating coordinate trans<strong>for</strong>mation of<br />
the uv-plane (see Kraus et al. 2005 <strong>for</strong> a description of this<br />
procedure) using the astrometric data given in Tab. 3. Then,<br />
we employed our Building Block Mapping software, which<br />
is based on the algorithm described by Hofmann & Weigelt<br />
(1993). Starting from an initial single δ-function, this algorithm<br />
adds components to a model image in order to minimize<br />
the deviations between the measured bispectrum and the<br />
bispectrum of the model image. Finally, the image is convolved<br />
with a clean beam of ∼ 1.5 × 3 mas, reflecting the<br />
elongation of the sampled uv-plane. The resulting K-band aperture<br />
synthesis image (Fig. 1 and Fig. 7, right) yields a direct,<br />
model-independent representation of our VLTI/AMBER interferometric<br />
data. Measuring the companion position in the reconstructed<br />
image (ρ = 19.3 mas, Θ = 241 ◦ , epoch 2007.9),<br />
we find good agreement with the results obtained with our<br />
model fitting approach using wavelength-differential observables<br />
(Sect. 3). The noise features within the image show an<br />
intensity amplitude below 2% of the peak brightness in the image.
8 Kraus et al.: Tracing the high-eccentricity binary θ 1 Ori C through periastron passage<br />
Fig. 6. Similar to Fig. 5, showing the AMBER data and best-fit model <strong>for</strong> our observations from December 2007<br />
.<br />
5. Results<br />
5.1. Dynamical orbit of the θ 1 Ori C binary system<br />
Since our new astrometric data extend the orbital coverage <strong>for</strong><br />
the θ 1 Ori C system by about 12 months and solves the calibration<br />
problem described in Sect. 2.1, we can significantly improve<br />
the orbital solution of the system. To derive a refined<br />
orbital solution, we applied two independent orbit fitting approaches.<br />
First, we used the method presented by Docobo (1985),<br />
which generates a family of Keplerian orbits, whose apparent<br />
orbits pass through three base points. These base points might<br />
be selected from the actual astrometric measurements or represent<br />
observationally favored areas in the (ρ, Θ, t) parameter<br />
space. From the generated class of possible solutions, the orbit<br />
which best agrees with the measured separations and PAs is<br />
selected. We use the error bars of the individual measurements<br />
as weight. The orbital elements <strong>for</strong> the determined best-fit orbit<br />
solution are given in Tab. 4.<br />
In addition, we implemented a grid search algorithm which<br />
scans the parameter space of the dynamical elements eccentricity<br />
e, period P, and time of periastron passage T 0 . As described<br />
by Hilditch (2001), at each grid point, the geometrical<br />
orbital elements a, i, Ω, and ω can be determined by fitting<br />
the Thiele-Innes constants to the observational data. We<br />
scanned the parameter space between P = 9 . . . 16 yrs (in increments<br />
of 0.001 yrs), e = 0.0 . . . 1.0 (in increments of 0.005),<br />
and T 0 = 2000.0 . . .2010.0 (in increments of 0.001 yrs) and<br />
determined the least-square distance between the N measured<br />
positions (ρ i , Θ i ) and the corresponding orbit positions (ρ ′ i , Θ′ i )<br />
<strong>for</strong> each orbit solution:<br />
χ 2 r = 1 ⎡<br />
∑ (<br />
ρi − ρ ′ ) 2 (<br />
i Θi − Θ ′ ) 2<br />
i<br />
N<br />
⎢⎣ +<br />
σ ρi σ<br />
⎤⎥⎦ (3)<br />
Θi<br />
i=1...N<br />
Using the χ 2 r value determined at each grid point, we built a<br />
χ 2 r (P, e, T 0 ) data cube, which we projected to determine the local<br />
minimum and the associated uncertainty <strong>for</strong> each parameter.<br />
Fig. 9 shows the determined χ 2 r minima curves, from which<br />
we determine the best-fit orbital elements given in Tab. 4. Given
Kraus et al.: Tracing the high-eccentricity binary θ 1 Ori C through periastron passage 9<br />
Table 3. Astrometric measurements <strong>for</strong> the θ 1 Ori C binary system.<br />
Telescope Date Filter Flux ratio Θ ρ Ref.<br />
F C2 /F C1 [ ◦ ] [mas]<br />
BTA 6 m/Speckle 1997.784 H 0.26 ± 0.02 226.0 ± 3 33 ± 2 a<br />
BTA 6 m/Speckle 1998.838 K ′ 0.32 ± 0.03 222.0 ± 5 37 ± 4 a<br />
BTA 6 m/Speckle 1999.737 J 0.31 ± 0.02 214.0 ± 2 43 ± 1 b<br />
BTA 6 m/Speckle 1999.8189 G ′ 0.35 ± 0.04 213.5 ± 2 42 ± 1 c<br />
BTA 6 m/Speckle 2000.8734 V ′ 0.35 ± 0.03 210.0 ± 2 40 ± 1 c<br />
BTA 6 m/Speckle 2001.184 J 0.29 ± 0.02 208.0 ± 2 38 ± 1 b<br />
BTA 6 m/Speckle 2003.8 J 0.30 ± 0.02 19.3 ± 2 29 ± 2 c<br />
BTA 6 m/Speckle 2003.9254 V ′ – 19.0 ± 2 29 ± 2 c<br />
BTA 6 m/Speckle 2003.928 V ′ – 19.1 ± 2 29 ± 2 c<br />
BTA 6 m/Speckle 2004.8216 V ′ 0.34 ± 0.04 10.5 ± 4 24 ± 4 c<br />
IOTA 2005.92055 H 0.28 ± 0.03 342.74 ± 2 13.55 ± 0.5 c<br />
NPOI 2006.1486 V – 332.3 ± 3.5 11.80 ± 1.11 d<br />
VLTI/AMBER 2007.0192 K 0.31 ± 0.03 274.9 ± 1 11.04 ± 0.5 –<br />
NPOI 2007.1425 V – 268.1 ± 5.2 11.94 ± 0.31 d<br />
NPOI 2007.1507 V – 272.9 ± 8.8 12.13 ± 1.58 d<br />
NPOI 2007.1753 V – 266.6 ± 2.1 12.17 ± 0.37 d<br />
NPOI 2007.2055 V – 265.6 ± 1.9 12.28 ± 0.41 d<br />
NPOI 2007.2137 V – 263.0 ± 2.3 12.14 ± 0.43 d<br />
BTA 6 m/Speckle 2007.9014 V ′ 0.29 ± 0.02 238.0 ± 2 19.8 ± 2 –<br />
VLTI/AMBER 2007.9233 H+K 0.24 ± 0.07 241.2 ± 1 19.07 ± 0.5 –<br />
ESO 3.6 m/Speckle 2008.0274 B ′ 0.29 ± 0.02 237.0 ± 3 19.7 ± 3 –<br />
ESO 3.6 m/Speckle 2008.0274 V ′ 0.31 ± 0.02 236.5 ± 3 19.6 ± 3 –<br />
BTA 6 m/Speckle 2008.0712 V ′ 0.31 ± 0.02 236.2 ± 2 20.1 ± 2 –<br />
VLTI/AMBER 2008.1479 H+K 0.23 ± 0.09 234.6 ± 1 21.17 ± 0.5 –<br />
VLTI/AMBER 2008.1726 H+K 0.26 ± 0.06 236.4 ± 1 21.27 ± 0.5 –<br />
Notes – The position angles given in col. 5 are measured East of North and were corrected <strong>for</strong> the 180 ◦ -calibration problem described in<br />
Sect. 2.1.<br />
References – (a) Weigelt et al. 1999, (b) Schertl et al. 2003, (c) Kraus et al. 2007, (d) Patience et al. 2008.<br />
Fig. 7. Combining AMBER data obtained on three telescope configurations (Left: uv-coverage), we reconstructed an aperture synthesis image<br />
of the θ 1 Ori C system with an effective resolution of ∼ 2 mas (Right). For a detailed description, we refer to Sect. 4.<br />
that the orbital coverage has been substantially improved since<br />
our 2007 study, we do not have to impose a priori constraints<br />
on the distance/system mass in order to eliminate unphysical<br />
orbit solutions. In Fig. 8c we compare the orbital solutions determined<br />
with the Docobo (1985) algorithm and with the grid<br />
search algorithm to the available astrometric data.<br />
5.2. Constraining the binary mass ratio<br />
Besides the 15.424-day period which is associated with the<br />
wind from the primary, long-term radial velocity variations<br />
were also found (Vitrichenko 2002; Stahl et al. 2008). Using<br />
a large data set covering more than 15 yrs of spectroscopic observations<br />
(plus three archival measurements, which extend the<br />
coverage to more than 64 yrs), (Stahl et al. 2008) showed that
10 Kraus et al.: Tracing the high-eccentricity binary θ 1 Ori C through periastron passage<br />
a) Orbital period P b) Eccentricity e c) Periastron passage T 0<br />
Fig. 9. Minimum χ 2 r curves as function of the dynamical orbital parameters P, e, T 0 . These curves were used to determine the best-fit orbit<br />
solution and to evaluate the uncertainties on the individual parameters (see Tab. 4).<br />
dDEC [mas]<br />
40<br />
30<br />
20<br />
10<br />
0<br />
-10<br />
-20<br />
-30<br />
-40<br />
New orbit solution (Docobo Algorithm)<br />
New orbit solution (Grid Search Algorithm)<br />
Data<br />
2003.9 (Sp6)<br />
10<br />
2004.8 (Sp6)<br />
✸<br />
0<br />
2005.9 (IOTA)<br />
2006.1 (NPOI)<br />
(Sp6) 2001.2<br />
(Sp6) 2000.8<br />
-10<br />
dRA [mas]<br />
2007.0 (VLTI)<br />
2007.1 (NPOI)<br />
2007.2 (NPOI)<br />
2007.9 (Sp6)<br />
2007.9 (VLTI)<br />
2008.0 (Sp3.6)<br />
2008.1 (Sp6)<br />
2008.2 (VLTI)<br />
-20<br />
1997.8 (Sp6)<br />
1998.8 (Sp6)<br />
1999.8 (Sp6)<br />
Fig. 8. Comparison of our new orbit solutions with the available astrometric<br />
data. Each position measurement is connected to the orbit prediction<br />
with an O–C vector (arrows). Furthermore, we show the lines<br />
of nodes in grey. The plots are centered on the primary star. North is<br />
up and east is to the left.<br />
these variations are consistent with the orbital motion of a higheccentricity<br />
binary system. Although the strong scatter within<br />
the radial velocity measurements prevents us from solving <strong>for</strong><br />
the precise spectroscopic orbit, the combination of these data<br />
with our new orbital solution can be used to provide a first<br />
direct constraint on the mass ratio of the components in the<br />
θ 1 Ori C system.<br />
-30<br />
-40<br />
Table 4. Orbital elements as determined with the algorithm from<br />
Docobo (1985) and our grid search algorithm (described in Sect. 5.1).<br />
Docobo Grid search<br />
Parameter algorithm algorithm<br />
P [yrs] 11.05 ± 0.03 11.26 ± 0.5<br />
T 0 2002.87 ± 0.40 2002.57 ± 0.5<br />
e 0.534 ± 0.050 0.592 ± 0.07<br />
a [mas] 40.00 ± 3.00 43.61 ± 3<br />
i [ ◦ ] 100.7 ± 1.0 99.0 ± 2.6<br />
Ω [ ◦ ] 25.3 ± 1.5 26.5 ± 1.7<br />
ω [ ◦ ] 290.9 ± 2.5 285.8 ± 8.5<br />
χ 2 r 1.84 0.56<br />
a 3 /P 2 [mas 3 /yrs 2 ] 524 ± 130 645 ± 200<br />
M C1 /M C2 0.21 ± 0.05 0.23 ± 0.05<br />
M C1 + M C2 [M⊙] 49 ± 4 47 ± 4<br />
d dyn [pc] 456 ± 13 416 ± 12<br />
Notes – Besides the orbital elements, we give the mass ratio<br />
(Sect. 5.2), dynamical distance, and system mass (Sect. 5.3), derived<br />
from both set of orbit elements. The dynamical distance and system<br />
mass was determined using the method from Baize & Romani (1946,<br />
method c in Sect. 5.3) and three different MLRs. When assuming another<br />
distance d ′ , the dynamical system mass M C1 + M C2 must be<br />
scaled by a factor (d ′ /d dyn ) 3 . The mass ratio M C1 /M C2 was also computed<br />
<strong>for</strong> the distance d dyn , but can be converted to any other distance<br />
using equation 5.<br />
In Fig. 10 we plot the available radial velocity data as a<br />
function of orbital phase using the orbital period P and time<br />
<strong>for</strong> periastron passage T 0 determined independently from our<br />
interferometric measurements (Sect. 5.1). Using the method<br />
from Pourbaix (1998), we compute the radial velocity variations<br />
corresponding to our full set of orbital elements (Tab. 4)<br />
and per<strong>for</strong>m a least-square fit between the measured (v i ) and the<br />
predicted (v ′ i<br />
) radial velocities in order to determine the massratio<br />
between the binary components. As least-square measure<br />
<strong>for</strong> N measurements, we use<br />
χ 2 r = 1 ∑ (<br />
vi − v ′ i − V ) 2<br />
0<br />
, (4)<br />
N σ vi<br />
i=1...N<br />
where V 0 is the velocity of the center of mass of the system,<br />
which is given by V 0 := 〈v i 〉 − 〈v ′ i<br />
〉. Since the radial velocities<br />
were extracted from various spectral lines (C IV, He II, and O III)
Kraus et al.: Tracing the high-eccentricity binary θ 1 Ori C through periastron passage 11<br />
Fig. 10. The radial velocities measured towards θ 1 Ori C plotted as<br />
function of orbital phase (assuming the orbital elements determined<br />
with our grid search algorithm; see Tab. 4). Besides the extensive data<br />
set by Stahl et al. (2008), we included the radial velocities measured<br />
by Struve & Titus (1944), Conti (1972), and Morrell & Levato (1991).<br />
The red line shows the radial velocities corresponding to our orbital<br />
solution with a system velocity V 0 = 23.6 km s −1 (blue dashed line)<br />
and the mass ratio q(414 pc) = 0.23 as determined from our leastsquare<br />
fit (Sect. 5.2).<br />
Fig. 12. Minimum χ 2 r curve as a function of a 3 /P 2 = (M system ) · π 3 ,<br />
through which the dynamical orbital parameters can be related to the<br />
mass sum and the dynamical parallax. For illustration, we give the<br />
dynamical distance in the upper axis assuming a total system mass of<br />
45 M⊙.<br />
Fig. 11. χ 2 r curve <strong>for</strong> our fit of the binary mass ratio to the available<br />
radial velocity data (assuming a distance of 414 pc). We assume the<br />
orbital elements (Tab. 4) derived from our interferometric measurements.<br />
and it is known that these lines can show, with respect to each<br />
other, systematic velocity offsets on the order of 2 − 3 km s −1<br />
(Stahl et al. 2008), we used 3 km s −1 as minimum velocity error<br />
σ vi in order to avoid overweighting individual measurements.<br />
By varying the mass-ratio between the components, we find<br />
q(d) := M (<br />
) −1<br />
C1<br />
= 5.27 +1.17 d<br />
−0.75<br />
M C2 414 pc − 1 , (5)<br />
i.e. q(450 pc) = 0.21±0.04 or q(414 pc) = 0.23±0.05, which is<br />
slightly lower than the value we derived earlier by modeling the<br />
wavelength-dependent binary flux ratio of the θ 1 Ori C system<br />
(q = 0.45 ± 0.15, Kraus et al. 2007).<br />
For the radial velocity of the center of mass, we determine<br />
23.6 km s −1 , which is in good agreement with the heliocentric<br />
velocity of the Orion Molecular Cloud (∼ 28 km s −1 ,<br />
O’Dell 2001). This might indicate that the relative motion of<br />
Fig. 13. The derived a 3 /P 2 value puts some direct constraints on the<br />
system mass M system := M C1 + M C2 and the dynamical distance. As<br />
described in Sect. 5.3, we employ three alternative methods to obtain<br />
constraints, which help to disentangle the system mass and the distance<br />
(method a: dashed green-shaded area, method b: orange curve,<br />
method c: blue data points). The black-shaded area marks the a 3 /P 2 -<br />
constraints determined with our orbit grid search algorithm. With the<br />
red ellipse, we visually mark the area of best agreement between all<br />
constraints.<br />
the θ 1 Ori C system with respect to the parental cloud is smaller<br />
than previously assumed (O’Dell 2001; Stahl et al. 2008).<br />
5.3. Dynamical masses and parallaxes<br />
Kepler’s third law (M system · π 3 = a 3 /P 2 ) relates a and P with<br />
the product of the system mass M system := M C1 + M C2 and the<br />
cube of the parallax π. There<strong>for</strong>e, our astrometric measurement
12 Kraus et al.: Tracing the high-eccentricity binary θ 1 Ori C through periastron passage<br />
of a 3 /P 2 directly constrains certain areas in the (π, M system ) parameter<br />
space, as shown by the shaded area in Fig. 13. Since the<br />
elements of the spectroscopic orbit are currently only weakly<br />
constrained, it is not possible to directly separate the system<br />
mass and the dynamical parallax. However, several independent<br />
methods exist to disentangle these important parameters<br />
using additional in<strong>for</strong>mation, such as the flux ratio of the components,<br />
their mass ratio, and/or their stellar parameters.<br />
The stellar parameters of θ 1 Ori C1 have already been studied<br />
extensively with spectroscopy, placing the effective temperature<br />
between 37 000 and 40 000 K (e.g. Rubin et al. 1991;<br />
Baldwin et al. 1991; Simón-Díaz et al. 2006; Polyakov &<br />
Tsivilev 2007). In particular, Simón-Díaz et al. (2006) included<br />
non-LTE and line-blanketing effects (T eff,C1 = 39 000±1000 K)<br />
<strong>for</strong> their detailed spectroscopic modeling, which makes their<br />
results compatible with the O-star stellar parameter calibration<br />
by Martins et al. (2005).<br />
Since each of the above-mentioned stellar or observational<br />
parameters is associated with certain assumptions and uncertainties,<br />
it seems advisable to take a number of alternative approaches<br />
<strong>for</strong> deriving the underlying physical parameters in<br />
order to yield some insight into the associated uncertainties.<br />
There<strong>for</strong>e, we follow three alternative approaches:<br />
a) Based on the effective temperature determination of the primary<br />
and the binary flux ratio, one can give a reasonable<br />
mass range <strong>for</strong> each component and, thus, the system mass<br />
(green-shaded area in Fig. 13).<br />
b) One can estimate the mass of the primary from the stellar<br />
temperature and then derive the companion mass using the<br />
mass ratio constraints obtained from the radial velocities<br />
(Sect. 5.2), yielding the orange curve in Fig. 13.<br />
c) Baize & Romani (1946) presented a method which solves<br />
<strong>for</strong> the system mass and the dynamical parallax using a<br />
mass-luminosity relation (MLR), the bolometric corrections<br />
of the components and their extinction-corrected apparent<br />
magnitudes. To evaluate the influence of the MLRs<br />
on the result, we used three different MLRs; namely, from<br />
Baize & Romani (1946), Heintz (1978), and Demircan &<br />
Kahraman (1991) (corresponding to the three blue data<br />
points in Fig. 13).<br />
For methods a) and b), we employ the stellar calibration<br />
by Martins et al. (2005), while <strong>for</strong> method c), three earlier<br />
calibrations are used. In method a) and b), the stellar temperature<br />
of the primary component is fixed to the value by<br />
Simón-Díaz et al. (2006, T eff,C1 = 39 000 ± 1000 K), while<br />
in c) we scan a slightly wider range of temperature values<br />
(T eff,C1 = 37 000 . . .40 000 K, T eff,C2 = 30 000 . . .33 000 K,<br />
using the bolometric correction by Bessell et al. 1998). Method<br />
a) requires the V ′ -band flux ratio (F C2 /F C1 = 0.31 ± 0.02)<br />
and c) the extinction-corrected magnitude of the total system<br />
(V = 5.12 ± 0.1, A V = 1.74 ± 0.1, Hillenbrand 1997).<br />
Evidently, each method is associated with considerable uncertainties,<br />
which makes it very desirable <strong>for</strong> future observations<br />
to improve not only the astrometric orbit, but to derive<br />
the accurate spectroscopic orbit of the system as well.<br />
Nevertheless, within their large uncertainties, the methods employed<br />
cover a common area in parameter space, corresponding<br />
to a system mass of M system = 44 ± 7 M⊙ and a dynamical distance<br />
of d = 410 ± 20 pc, as marked with the red ellipse in<br />
Fig. 13. Methods a) and b) yield systematically lower system<br />
masses than method c), reflecting the recent correction in the<br />
mass calibration scale in stellar evolutionary models (Martins<br />
et al. 2005). Assuming a distance of 414 pc, as determined by<br />
Menten et al. (2007), would yield a system mass of 46 M⊙.<br />
5.4. Possible implications on the dynamical history of<br />
the θ 1 Ori C system<br />
With an eccentricity of ∼ 0.6, the orbit of θ 1 Ori C is located<br />
on the upper end of the eccentricity distribution of low- as well<br />
as high-mass binary stars (Mathieu 1994; Mason et al. 1998),<br />
perhaps providing important in<strong>for</strong>mation about the dynamical<br />
history of the system. Tan (2004, 2008) proposed that the<br />
Becklin-Neugebauer (BN) object, which is located 45 ′′ northwest<br />
of the Trapezium stars, might be a runaway B star ejected<br />
from the θ 1 Ori C multiple system approximately 4 000 yrs ago.<br />
This scenario is based on proper motion measurements, which<br />
show that BN and θ 1 Ori C recoil roughly in opposite directions.<br />
Three-body interaction is a crucial part of this interpretation,<br />
and the high eccentricity of the θ 1 Ori C orbit which we derive<br />
<strong>for</strong> this system might be a direct consequence of this dynamical<br />
interaction event. However, another study (Rodríguez et al.<br />
2005) also aimed to identify the multiple system from which<br />
BN was ejected and identified Source I as the likely progenitor<br />
system. Later, Gómez et al. (2005, 2008) added further evidence<br />
to this interpretation by identifying Source n as a potential<br />
third member of the decayed system. There<strong>for</strong>e, it is still<br />
unclear whether this scenario can explain the measured properties<br />
of the θ 1 Ori C orbit.<br />
As an alternative explanation <strong>for</strong> the high eccentricity of<br />
the θ 1 Ori C system, Zinnecker & Yorke (2007) pointed out that<br />
such systems are predicted by star <strong>for</strong>mation scenarios which<br />
include sub-Keplerian rotating disks or filament fragmentation<br />
(Kratter & Matzner 2006).<br />
6. Conclusions<br />
We have presented new bispectrum speckle (V ′ -/B ′ -band) and<br />
VLTI/AMBER (H-/K-band) interferometric observations of<br />
the Orion Trapezium star θ 1 Ori C covering several epochs over<br />
a time period of about 14 months.<br />
From our long-baseline interferometric data, we have reconstructed<br />
the first model-independent VLTI/AMBER aperture<br />
synthesis image, depicting the θ 1 Ori C system at a resolution<br />
of ∼ 2 mas and demonstrating the imaging capabilities of<br />
this unique facility. In order to extract accurate astrometric in<strong>for</strong>mation<br />
<strong>for</strong> all epochs, we have followed a new modeling approach<br />
which is based on wavelength-differential observables<br />
and which demonstrates the benefits of spectro-interferometry<br />
in terms of observing efficiency and robustness to poor observing<br />
conditions. Furthermore, our ESO 3.6 m and the BTA 6 m<br />
speckle observations allow us to solve 180 ◦ -ambiguity and to<br />
calibrate the closure phase sign of our VLTI/AMBER observa-
Kraus et al.: Tracing the high-eccentricity binary θ 1 Ori C through periastron passage 13<br />
Fig. A.2. To obtain a spectrum which is corrected <strong>for</strong> instrumental<br />
effects <strong>for</strong> the spectral calibration, we subtract from the RAW spectrum<br />
the SKY spectrum and then divide by the P2VM spectrum<br />
(blue dashed curve). The resulting instrument-corrected spectrum (red<br />
curve) is compared with an atmospheric transmission spectrum (green<br />
curve: R = 4000; black curve: R = 35).<br />
tions, providing a potential reference <strong>for</strong> other AMBER observations<br />
using closure phase in<strong>for</strong>mation 4 .<br />
Our new θ 1 Ori C astrometric data shows that since its discovery<br />
in 1997, the θ 1 Ori C companion has nearly completed<br />
one orbital revolution and that the system has a high eccentricity<br />
(e ∼ 0.6). Solving <strong>for</strong> the orbital elements, we determine a<br />
period of ∼11.3 yrs, a semi-major axis of 44 mas, and a periastron<br />
passage around 2002.6. According to our orbital solutions,<br />
the physical separation between the components decreases to<br />
∼ 7 AU (2.8 mas) during periastron passage, which might be<br />
too large to result in detectable signatures of wind-wind interaction<br />
between the stellar winds.<br />
Using additional in<strong>for</strong>mation about the stellar parameters<br />
and various stellar models, we estimate the total system mass to<br />
be 44±7 M⊙ and the dynamical distance to be d = 410±20 pc.<br />
In the coming years, the uncertainties on these parameters<br />
could be considerably reduced with new spectroscopic and astrometric<br />
observations of this important binary system.<br />
Acknowledgements. We would like to thank the referee,<br />
M. McCaughrean, <strong>for</strong> helpful comments which improved this<br />
paper. Furthermore, we acknowledge helpful discussions with<br />
E. Vitrichenko, F. Millour and members of the AMBER consortium.<br />
Appendix A: Spectral calibration of AMBER-LR<br />
data<br />
Employing wavelength-differential visibilities and phases <strong>for</strong><br />
model fitting requires a precise knowledge of the central wavelength<br />
of the recorded spectral channels. There<strong>for</strong>e, we per<strong>for</strong>med<br />
a re-calibration of the wavelength axes of our data sets<br />
using atmospheric absorption features and found deviations of<br />
4 Since our data set might be useful <strong>for</strong> VLTI/AMBER<br />
users as reference data <strong>for</strong> the calibration of the closure<br />
phase sign, we provide our data on the following website:<br />
http://www.mpifr.de/staff/skraus/files/amber.htm<br />
up to ∼ 0.1 µm compared to the standard wavelength table applied<br />
to the data on Paranal.<br />
In the recorded J-/H-/K-band object raw spectra, the telluric<br />
features are not pronounced enough to be used <strong>for</strong> the<br />
calibration, which is mainly due to absorption by internal optical<br />
components. There<strong>for</strong>e, besides the raw spectrum of the<br />
object exposures, we also extracted the spectrum from the sky<br />
and the P2VM calibration exposures. The P2VM calibration<br />
files (P2VM=Pixel-to-Visibility-Matrix; see Tatulli et al. 2007)<br />
are recorded at the beginning of each observation block using a<br />
lamp located in AMBER’s Calibration and Alignment Unit and<br />
provide a measure of the instrumental transmission. By subtracting<br />
the sky spectrum from the object spectrum and then<br />
dividing by the P2VM spectrum, we yield a spectrum which<br />
is corrected <strong>for</strong> most instrumental effects and shows the telluric<br />
absorption features much more clearly (see Fig. A.2, red<br />
curve). These corrected spectra were compared with standard<br />
atmospheric transmission spectra provided by the Gemini observatory<br />
5 (see Fig. A.2, green curve). We manually align the<br />
spectra using the pronounced gaps between the J-/H- and H-<br />
/K-band and find best agreement assuming a linear dispersion<br />
law λ(i) ∝ 0.0328 · i, where i is the number of the spectral<br />
channel on the detector.<br />
The remaining wavelength calibration uncertainty of about<br />
1 spectral channel (corresponding to about 0.03 µm) is the<br />
dominant limiting factor on the achievable astrometric accuracy<br />
(∼ 2%). There<strong>for</strong>e, <strong>for</strong> future observations, it seems highly<br />
desirable to implement an AMBER on-site spectral calibration<br />
device (e.g. NIR lasers with well-known frequencies), fascilitating<br />
an absolute spectral calibration in the standard instrument<br />
calibration procedure, pushing AMBER to its full astrometric<br />
accuracy.<br />
References<br />
Baize, P. & Romani, L. 1946, Annales d’Astrophysique, 9, 13<br />
Baldwin, J. A., Ferland, G. J., Martin, P. G., et al. 1991, ApJ,<br />
374, 580<br />
Bessell, M. S., Castelli, F., & Plez, B. 1998, A&A, 333, 231<br />
Conti, P. S. 1972, ApJ, 174, L79+<br />
Demircan, O. & Kahraman, G. 1991, Ap&SS, 181, 313<br />
Docobo, J. A. 1985, Celestial Mechanics, 36, 143<br />
Genzel, R. & Stutzki, J. 1989, ARA&A, 27, 41<br />
Gómez, L., Rodriguez, L. F., Loinard, L., et al. 2008, ArXiv<br />
e-prints, 805<br />
Gómez, L., Rodríguez, L. F., Loinard, L., et al. 2005, ApJ, 635,<br />
1166<br />
Heintz, W. D. 1978, Geophysics and <strong>Astrophysics</strong><br />
Monographs, 15<br />
Herbig, G. H. & Terndrup, D. M. 1986, ApJ, 307, 609<br />
Hilditch, R. W. 2001, An Introduction to Close Binary Stars<br />
(An Introduction to Close Binary Stars, by R. W. Hilditch,<br />
pp. 392. ISBN 0521241065. Cambridge, UK: Cambridge<br />
University Press, March 2001.)<br />
5 These ATRAN transmission spectra can be found on the website<br />
http://www.gemini.edu/sciops/telescopes-andsites/observing-condition-constraints/<br />
transmission-spectra.
14 Kraus et al.: Tracing the high-eccentricity binary θ 1 Ori C through periastron passage<br />
Fig. A.1. Left: Three two-dimensional average power spectra (top row) and Fourier phase spectra<br />
(middle row) derived from B’-band speckle data recorded on 2008 Jan 10 with the ESO 3.6 m<br />
telescope. Right: Comparing this data to model power spectra (top row) and Fourier spectra<br />
(middle row) <strong>for</strong> a binary with separation ρ = 19.7 mas and PA Θ = 237 ◦ shows that the<br />
fainter component is located southwest of the primary star (the bispectrum speckle image reconstructed<br />
from the model visibilities and phases are shown to the bottom right). Together with<br />
the calibration data sets mentioned in Sect. 2.1, this data set unambigously defines the current<br />
orientation of the θ 1 Ori C binary system and shows that the system has nearly completed one<br />
orbital revolution since its discovery in 1997.<br />
Hillenbrand, L. A. 1997, AJ, 113, 1733<br />
Hirota, T., Bushimata, T., Choi, Y. K., et al. 2007, PASJ, 59,<br />
897<br />
Hofmann, K.-H. & Weigelt, G. 1986, A&A, 167, L15+<br />
Hofmann, K.-H. & Weigelt, G. 1993, A&A, 278, 328<br />
Jeffries, R. D. 2007, MNRAS, 376, 1109<br />
Kratter, K. M. & Matzner, C. D. 2006, MNRAS, 373, 1563<br />
Kraus, S., Balega, Y. Y., Berger, J.-P., et al. 2007, A&A, 466,<br />
649<br />
Kraus, S., Preibisch, T., & Ohnaka, K. 2008, ApJ, 676, 490<br />
Kraus, S., Schloerb, F. P., Traub, W. A., et al. 2005, AJ, 130,<br />
246<br />
Labeyrie, A. 1970, A&A, 6, 85<br />
Lohmann, A. W., Weigelt, G., & Wirnitzer, B. 1983,<br />
Appl. Opt., 22, 4028<br />
Martins, F., Schaerer, D., & Hillier, D. J. 2005, A&A, 436,<br />
1049<br />
Mason, B. D., Gies, D. R., Hartkopf, W. I., et al. 1998, AJ, 115,<br />
821<br />
Mathieu, R. D. 1994, ARA&A, 32, 465<br />
Mayne, N. J. & Naylor, T. 2008, MNRAS, 326<br />
McCaughrean, M. J. & Stauffer, J. R. 1994, AJ, 108, 1382<br />
Menten, K. M., Reid, M. J., Forbrich, J., & Brunthaler, A. 2007,<br />
A&A, 474, 515<br />
Morrell, N. & Levato, H. 1991, ApJS, 75, 965<br />
Mozurkewich, D., Johnston, K. J., Simon, R. S., et al. 1991,<br />
AJ, 101, 2207<br />
O’Dell, C. R. 2001, ARA&A, 39, 99<br />
Patience, J., Zavala, R. T., Prato, L., et al. 2008, ApJ, 674, L97<br />
Petrov, R. G., Malbet, F., Weigelt, G., et al. 2007, A&A, 464, 1<br />
Polyakov, A. M. & Tsivilev, A. P. 2007, Astronomy Letters,<br />
33, 34<br />
Pourbaix, D. 1998, A&AS, 131, 377<br />
Rodríguez, L. F., Poveda, A., Lizano, S., & Allen, C. 2005,<br />
ApJ, 627, L65<br />
Rubin, R. H., Simpson, J. P., Haas, M. R., & Erickson, E. F.<br />
1991, ApJ, 374, 564<br />
Sandstrom, K. M., Peek, J. E. G., Bower, G. C., Bolatto, A. D.,<br />
& Plambeck, R. L. 2007, ApJ, 667, 1161<br />
Schertl, D., Balega, Y. Y., Preibisch, T., & Weigelt, G. 2003,<br />
A&A, 402, 267<br />
Simón-Díaz, S., Herrero, A., Esteban, C., & Najarro, F. 2006,<br />
A&A, 448, 351<br />
Stahl, O., Kaufer, A., Rivinius, T., et al. 1996, A&A, 312, 539<br />
Stahl, O., Wade, G., Petit, V., Stober, B., & Schanne, L. 2008,<br />
A&A, 487, 323
Kraus et al.: Tracing the high-eccentricity binary θ 1 Ori C through periastron passage 15<br />
Stassun, K. G., van den Berg, M., Feigelson, E., & Flaccomio,<br />
E. 2006, ApJ, 649, 914<br />
Struve, O. & Titus, J. 1944, ApJ, 99, 84<br />
Tan, J. C. 2004, ApJ, 607, L47<br />
Tan, J. C. 2008, ArXiv e-prints, 807<br />
Tatulli, E., Millour, F., Chelli, A., et al. 2007, A&A, 464, 29<br />
Vacca, W. D., Garmany, C. D., & Shull, J. M. 1996, ApJ, 460,<br />
914<br />
Vitrichenko, É. A. 2002, Astronomy Letters, 28, 324<br />
Weigelt, G., Balega, Y., Preibisch, T., et al. 1999, A&A, 347,<br />
L15<br />
Weigelt, G. & Wirnitzer, B. 1983, Optics Letters, 8, 389<br />
Weigelt, G. P. 1977, Optics Communications, 21, 55<br />
Zinnecker, H. & Yorke, H. W. 2007, ARA&A, 45, 481<br />
List of Objects<br />
‘θ 1 Ori C’ on page 1<br />
‘HD 33833’ on page 2<br />
‘HD 37128’ on page 2<br />
‘HD 41547’ on page 2<br />
‘HD 43023’ on page 2<br />
‘HD 50281’ on page 2<br />
‘36 Ori’ on page 3<br />
‘θ 1 Ori A’ on page 3<br />
‘θ 1 Ori B’ on page 3<br />
‘η Carinae’ on page 3<br />
‘Becklin-Neugebauer’ on page 12<br />
‘Source I’ on page 12<br />
‘Source n’ on page 12