ISDA Margin Survey 2013
ISDA Margin Survey 2013
ISDA Margin Survey 2013

Create successful ePaper yourself
Turn your PDF publications into a flip-book with our unique Google optimized e-Paper software.
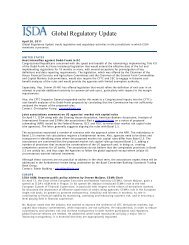
Chart 2.1: Growth in value of reported and estimated collateral (USD billions) as at December 31, 2012<br />
7<br />
Chart 2.2 below displays data on aggregate counterparty credit exposure collected by the Bank for International<br />
Settlements (BIS). The data reflects the net mark-to-market value of counterparty exposures, taking into<br />
account the benefits of close-out netting, but before taking into account the effect of collateral in reducing risk<br />
exposure. As the chart shows, aggregate counterparty exposure peaked at US $5,005 trillion in December of<br />
2008 but has now fallen to US $3,668 trillion in December 2012.<br />
When comparing the recent figures from Charts 2.1 and 2.2 it is interesting to note an 8 percent decline in<br />
counterparty credit exposure in 2012 but an 8 percent increase of reported collateral in circulation. This<br />
suggests that more exposure is being collateralized.<br />
When compared over a greater length of time, the data underlying these two charts reveals a trend toward a<br />
steady increase in collateral in circulation. Over the period from 2002 through 2012 the amount of reported<br />
collateral in circulation has grown at a 17 percent compounded annual growth rate while gross credit exposure,<br />
as measured by the BIS, has grown at a 10 percent compounded annual rate.<br />
<strong>ISDA</strong> <strong>Margin</strong> <strong>Survey</strong> <strong>2013</strong> June <strong>2013</strong>