ISDA Margin Survey 2013
ISDA Margin Survey 2013
ISDA Margin Survey 2013

Create successful ePaper yourself
Turn your PDF publications into a flip-book with our unique Google optimized e-Paper software.
9<br />
The low interest rate environment means that cash is, often, the cheapest-to-deliver form of collateral<br />
under most collateral agreements.<br />
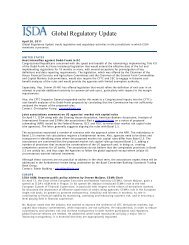
Table 2.1: Value of collateral received and delivered by respondents against non-cleared OTC transactions<br />
USD millions<br />
Cash<br />
Government<br />
Securities<br />
Collateral Received Percentage Collateral Delivered Percentage<br />
Type of Collateral <strong>2013</strong> 2012 <strong>2013</strong> 2012 <strong>2013</strong> 2012 <strong>2013</strong> 2012<br />
USD 419,710 436,018 29.5% 33.0% 357,792 357,219 28.8% 31.3%<br />
EUR 627,725 537,450 44.2% 40.8% 537,440 438,191 43.2% 38.4%<br />
GBP 34,073 23,871 2.4% 1.8% 40,379 29,316 3.2% 2.6%<br />
JPY 34,736 27,222 2.4% 2.1% 26,322 25,267 2.1% 2.2%<br />
Other 14,357 14,988 1.0% 1.1% 16,670 11,722 1.3% 1.1%<br />
Subtotal 1,130,602 1,039,549 79.5% 78.8% 978,603 861,715 78.7% 75.6%<br />
United States 54,673 60,926 3.8% 4.6% 78,724 78,974 6.3% 6.9%<br />
European Union 31,471 30,733 2.2% 2.3% 92,410 109,677 7.4% 9.6%<br />
United Kingdom 21,286 13,459 1.5% 1.1% 20,861 22,736 1.7% 2.0%<br />
Japan 37,293 33,064 2.6% 2.5% 30,056 22,738 2.4% 2.0%<br />
Other 19,841 13,869 1.4% 1.1% 7,338 7,237 0.6% 0.7%<br />
Subtotal 164,563 152,051 11.6% 11.6% 229,389 241,362 18.4% 21.2%<br />
Others<br />
Government agency securities<br />
/ GSEs<br />
31,223 28,607 2.2% 2.2% 15,356 12,861 1.2% 1.1%<br />
Supranational Bonds 1,044 1,090 0.1% 0.1% 2,112 2,139 0.2% 0.2%<br />
US Municipal Bonds 4,225 1,789 0.3% 0.1% 29 0 0.0% 0.0%<br />
Covered Bonds 3,187 914 0.2% 0.1% 2,277 2,097 0.2% 0.2%<br />
Corporate Bonds 34,904 40,711 2.5% 3.1% 8,437 13,090 0.7% 1.1%<br />
Letters of Credit 6,138 9,125 0.4% 0.7% 728 0 0.1% 0.0%<br />
Equities 31,809 24,815 2.2% 1.8% 4,748 902 0.4% 0.1%<br />
Metals and Other<br />
Commodities<br />
34 148 0.0% 0.0% 0 0 0.0% 0.0%<br />
Other 13,976 19,661 1.0% 1.5% 2,505 5,997 0.2% 0.5%<br />
Subtotal 126,541 126,860 8.9% 9.6% 36,193 37,086 2.9% 3.2%<br />
Total Collateral 1,421,706 1,318,460 1,244,185 1,140,163<br />
<strong>2013</strong> 2012<br />
Grand Total (Received and<br />
Delivered) 2,665,890 2,458,623<br />
Note: Collateral Received differs from Collateral Delivered because <strong>Survey</strong> results are not based on the responses of all firms engaged in<br />
collateralized derivatives transactions.<br />
2.3. TREATMENT OF COLLATERAL DELIVERED FOR NON-CLEARED OTC TRANSACTIONS<br />
The <strong>2013</strong> <strong>Survey</strong> contains several questions regarding the treatment of collateral received and delivered to meet<br />
exposures from non-cleared OTC transactions. The first of these questions asked whether respondents had<br />
made arrangements to segregate collateral posted as Independent Amounts (“IA”) and what types of<br />
arrangements were made to secure that collateral. The second asked whether respondents rehypothecate or<br />
<strong>ISDA</strong> <strong>Margin</strong> <strong>Survey</strong> <strong>2013</strong> June <strong>2013</strong>