SIFTER public - batod
SIFTER public - batod
SIFTER public - batod

Create successful ePaper yourself
Turn your PDF publications into a flip-book with our unique Google optimized e-Paper software.
Holistic Assessment Annual Conference - BATOD South Conference 10 th November 2006<br />
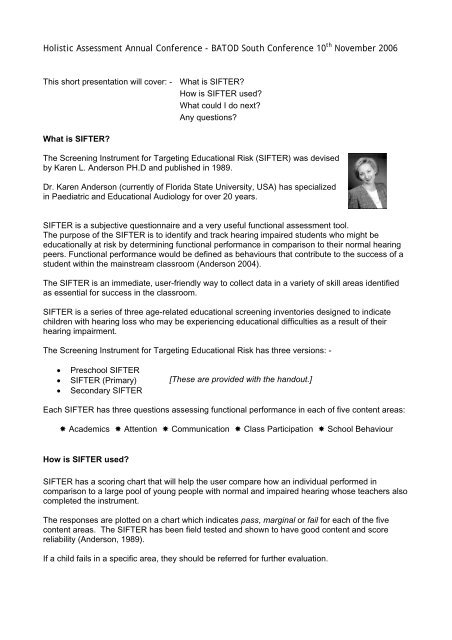
This short presentation will cover: - What is <strong>SIFTER</strong><br />
How is <strong>SIFTER</strong> used<br />
What could I do next<br />
Any questions<br />
What is <strong>SIFTER</strong><br />
The Screening Instrument for Targeting Educational Risk (<strong>SIFTER</strong>) was devised<br />
by Karen L. Anderson PH.D and published in 1989.<br />
Dr. Karen Anderson (currently of Florida State University, USA) has specialized<br />
in Paediatric and Educational Audiology for over 20 years.<br />
<strong>SIFTER</strong> is a subjective questionnaire and a very useful functional assessment tool.<br />
The purpose of the <strong>SIFTER</strong> is to identify and track hearing impaired students who might be<br />
educationally at risk by determining functional performance in comparison to their normal hearing<br />
peers. Functional performance would be defined as behaviours that contribute to the success of a<br />
student within the mainstream classroom (Anderson 2004).<br />
The <strong>SIFTER</strong> is an immediate, user-friendly way to collect data in a variety of skill areas identified<br />
as essential for success in the classroom.<br />
<strong>SIFTER</strong> is a series of three age-related educational screening inventories designed to indicate<br />
children with hearing loss who may be experiencing educational difficulties as a result of their<br />
hearing impairment.<br />
The Screening Instrument for Targeting Educational Risk has three versions: -<br />
• Preschool <strong>SIFTER</strong><br />
• <strong>SIFTER</strong> (Primary)<br />
• Secondary <strong>SIFTER</strong><br />
[These are provided with the handout.]<br />
Each <strong>SIFTER</strong> has three questions assessing functional performance in each of five content areas:<br />
Academics Attention Communication Class Participation School Behaviour<br />
How is <strong>SIFTER</strong> used<br />
<strong>SIFTER</strong> has a scoring chart that will help the user compare how an individual performed in<br />
comparison to a large pool of young people with normal and impaired hearing whose teachers also<br />
completed the instrument.<br />
The responses are plotted on a chart which indicates pass, marginal or fail for each of the five<br />
content areas. The <strong>SIFTER</strong> has been field tested and shown to have good content and score<br />
reliability (Anderson, 1989).<br />
If a child fails in a specific area, they should be referred for further evaluation.
Scoring Example: The Secondary Sifter<br />
In this example the data has been collected and statistical values have been shown.<br />
Screening Instrument for Targeting Educational Risk in Secondary Students<br />
Copyright 2004 KL Anderson Ph.D. Reproduction permission granted.<br />
Minimum and maximum values<br />
Sam XXXXX 01/11/91<br />
are marked, the average value<br />
is highlighted.<br />
Average total = 5 Above Average Below<br />
How does the student's general foundation skills (i.e., reading level) compare<br />
1<br />
to the difficulty of work expected in class<br />
5 4 3 2 1<br />
How does the student's ability to summarize and draw conclusions about<br />
2<br />
information presented in class compare to his/her class peers<br />
5 4 3 2 1<br />
How does the student's demonstration of academic skill growth compare to<br />
3<br />
class peers/expectations<br />
5 4 3 2 1<br />
Average total = 6 Always Often Rarely<br />
When called upon and asked a question, how often does the student appear<br />
1 to have been attending to teacher instruction (he/she appears to understand 5 4 3 2 1<br />
the basis of the question)<br />
How successful is the student at avoiding distraction by noises, visual<br />
2<br />
distractions, personal items, or activities unrelated to class instruction<br />
5 4 3 2 1<br />
How does the student's attention to detail compare to class peers/expectations<br />
3<br />
(avoiding careless mistakes)<br />
5 4 3 2 1<br />
Average total = 6 Above Average Below<br />
How well does the student communicate his/her needs to the teacher in<br />
1<br />
comparison to class peers/expectations<br />
5 4 3 2 1<br />
How does the student's word usage skills compare to class peers/expectations<br />
2<br />
(i.e., written, verbal, signed vocabulary)<br />
5 4 3 2 1<br />
3<br />
What is your estimate of the student's ability to assimilate teacher instruction<br />
(presented verbally or visually) in comparison to class peers/expectations<br />
5 4 3 2 1<br />
Average total = 5 Above Average Below<br />
In comparison to class peers, what is the student's present level of meaningful<br />
1<br />
contribution to classroom discussions<br />
5 4 3 2 1<br />
To what level does the student demonstrate recognition that participation is<br />
2<br />
an integral part of the learning process<br />
5 4 3 2 1<br />
During cooperative group activities, how often does the student interact with<br />
3<br />
others to achieve the goals of group work<br />
5 4 3 2 1<br />
Average total = 9 Above Average Below<br />
How often does the student demonstrate respectful behaviour toward others<br />
1<br />
in class (peers and teacher)<br />
5 4 3 2 1<br />
How often does the student follow classroom rules compared to class<br />
2<br />
peers/expectations<br />
5 4 3 2 1<br />
3 To what level does the student appear to be accepted by his/her peers 5 4 3 2 1<br />
Academic Skills Attention Communication<br />
Class Participation Behaviour<br />
Sam has not passed the first four content areas and has a marginal score in the last section.<br />
Subsequent audiometry revealed deterioration in his conductive hearing loss.<br />
Sam was referred to ENT and his teachers made aware of his circumstances.
The <strong>SIFTER</strong> has proved very valuable for evaluating ‘before and after’ scenarios to demonstrate<br />
the benefits of the introduction of support such as<br />
• Hearing aid<br />
• Cochlear implant<br />
• FM radio aid system<br />
• Soundfield system<br />
“Although originally intended as a tool to help identify students at risk for listening problems, it has<br />
proven to be useful in establishing efficacy of interventions in the classroom. When used in a pretest/post-test<br />
experimental design, any change in student performance as a result of classroom<br />
acoustic intervention can be documented.” Tharpe et al (2003)<br />
<strong>SIFTER</strong> has been used in a number of peer-reviewed academic studies<br />
• Dancer et al. (1995) ~ unilateral hearing loss<br />
• Bess et al. (1998) ~ minimal sensorineural hearing loss<br />
• Tharpe et al. (2003) ~ FM systems<br />
• Crandell et al. (2004) ~ room acoustics<br />
• Most (2004) ~ effects of degree and type of hearing loss<br />
There is a <strong>SIFTER</strong> ‘User’s Manual’ (Anderson 2004) that provides background information on the<br />
process used to develop the scale, the data obtained via field testing, and the scoring grid<br />
development process.<br />
“<strong>SIFTER</strong> should only be used as a guide to teacher’s or teams and should not be used as the only<br />
criteria for when a child should be referred for additional services, or receive specialized support,<br />
modifications, or hearing technology…It should be used as only one piece of information among a<br />
variety of opinions, experiences, and collateral information that are relied upon when the functional<br />
status of a student with hearing loss is considered.” (Anderson 2004)<br />
What could I do next<br />
Anderson developed an extension of the <strong>SIFTER</strong>, called the Listening Inventories for Education<br />
(LIFE) which was adapted for UK use as an Indivdual Hearing Profile (IHP) by the Educational<br />
Audiologist David Canning (LIFE-UK IHP 1998). LIFE-UK IHP retains a teacher self-report<br />
questionnaire, but also adds a self-report questionnaire that is completed by the student.<br />
Copies of the <strong>SIFTER</strong> versions, a user manual, and the LIFE-UK IHP may be downloaded from<br />
David Canning (the Ear Institute, School of Audiology, University College London) at the website<br />
http://www.hear2learn.com/<br />
Any questions<br />
We would be happy to answer any queries; the Audiology Committee can be contacted at<br />
audiology@<strong>batod</strong>.org.uk<br />
Many thanks, Stuart Whyte BATOD Audiology Chair.
References<br />
Anderson K (1989) Screening Instrument For Targeting Educational Risk (<strong>SIFTER</strong>) in Children with<br />
Identified Hearing Loss. Tampa, FL: Educational Audiology Association.<br />
Anderson K, Matkin N (1996) Preschool Screening Instrument for Targeting Educational Risk<br />
(<strong>SIFTER</strong>) in Children age 3-Kindergarten. Tampa, FL: Educational Audiology Association.<br />
Anderson (2004) Secondary <strong>SIFTER</strong> User’s Manual. Tampa, FL: Educational Audiology<br />
Association.<br />
Bess FH, Dodd-Murphy J, Parker RA (1998) Children with Minimal Sensorineural Hearing Loss:<br />
Prevalence, Educational Performance, and Functional Status. Ear & Hearing 19(5):339-354.<br />
Crandell CC, Kreisman BM, Smaldino JJ, Kreisman NV (2004) Room Acoustics Intervention<br />
Efficacy Measures. Seminars in Hearing. Classroom Acoustics. 25(2):201-206. Thieme, New York.<br />
Dancer J, Burl NT, Waters S (1995) Effects of unilateral hearing loss on teacher responses to the<br />
<strong>SIFTER</strong>, Screening Instrument for Targeting Educational Risk. American Annals of the Deaf<br />
140(3):291-4. Gallaudet University Press, Washington.<br />
Most T (2004) The effects of degree and type of hearing loss on children's performance in class<br />
Deafness & Education International 6(3):154-166. Whurr, London.<br />
Tharpe AM, Ricketts T, Sladen DP (2003). FM Systems for Children with Minimal to Mild Hearing<br />
Loss. ACCESS: Achieving Clear Communication Employing Sound Solutions, Phonak<br />
Proceedings 2003. http://www.phonak.com/professional/informationpool/proceedings.htm
PRESCHOOL S.I.F.T.E.R.<br />
Screening Instrument for Targeting Educational Risk<br />
in Preschool Children (age 3-Kindergarten)<br />
by Karen L. Anderson, Ed.S. & Noel Matkin, Ph.D.<br />
Child Teacher Age<br />
Date Completed ____/____/____ School District<br />
The above child is suspect for hearing problems which may affect his/her ability to listen, pay attention, develop language, follow<br />
teacher instruction and learn normally. This rating scale has been designed to sift out children who are at risk for educational delay<br />
and who may need further evaluation. Based on your knowledge of this child, circle the number that best represents his/her<br />
behavior. If the child is a member of a class that has students with special needs, comparisons should be made to normal learning<br />
classmates or normal developmental milestones. Please share additional comments about the child on the reverse side of this form.<br />
1. How well does the child understand basic concepts when compared to<br />
classmates (e.g., colors, shapes, etc.)<br />
2. How often is the child able to follow two-part directions<br />
3. How well does the child participate in group activities when compared to<br />
classmates (e.g., calendar, sharing)<br />
4. How distractible is the child in comparison to his/her classmates during large<br />
group activities<br />
5. What is the child's attention span in comparison to classmates<br />
6. How well does the child pay attention during a small group activity or story<br />
time<br />
7. How does the child's vocabulary and word usage skills compare to classmates<br />
8. How proficient is the child at relating an event when compared to classmates<br />
9. How does the child's overall speech intelligibility compare to classmates (i.e.,<br />
production of speech sounds)<br />
10. How often does the child answer questions appropriately (verbal or<br />
signed)<br />
11. How often does the child share information during group discussions<br />
12. How often does the child participate with classmates in group activities or<br />
group play<br />
13. Does the child play in socially acceptable ways (i.e., turn taking, sharing)<br />
14. How proficient is the child at using verbal language or sign language to<br />
communicate effectively with classmates (e.g., asking to play with another<br />
child's toy)<br />
15. How often does the child become frustrated, sometimes to the point of<br />
losing emotional control<br />
Copyright ©1996 by Karen Anderson & Noel Matkin<br />
ABOVE AVERAGE BELOW<br />
5 4 3 2 1<br />
ALWAYS FREQUENTLY SELDOM<br />
5 4 3 2 1<br />
ABOVE AVERAGE BELOW<br />
5 4 3 2 1<br />
SELDOM OCCASIONALFREQUENT<br />
5 4 3 2 1<br />
LONGER AVERAGE SHORTER<br />
5 4 3 2 1<br />
ABOVE AVERAGE BELOW<br />
5 4 3 2 1<br />
ABOVE AVERAGE BELOW<br />
5 4 3 2 1<br />
ABOVE AVERAGE BELOW<br />
5 4 3 2 1<br />
ABOVE AVERAGE BELOW<br />
5 4 3 2 1<br />
ALMOST<br />
ALWAYS FREQUENTLY SELDOM<br />
5 4 3 2 1<br />
ALMOST<br />
ALWAYS FREQUENTLY SELDOM<br />
5 4 3 2 1<br />
ALMOST<br />
ALWAYS FREQUENTLY SELDOM<br />
5 4 3 2 1<br />
ALMOST<br />
ALWAYS FREQUENTLY SELDOM<br />
5 4 3 2 1<br />
ABOVE AVERAGE BELOW<br />
5 4 3 2 1<br />
NEVER SELDOM FREQUENTLY<br />
5 4 3 2 1<br />
Author permission is granted for reproduction.<br />
PRE-ACADEMICS ATTENTION<br />
COMMUNICATION<br />
CLASS<br />
PARTICIPATION<br />
SOCIAL BEHAVIOR
EXPRESSIVE COMMUNICATION<br />
SOCIALLY APPROPRIATE BEHAVIOR<br />
TEACHER COMMENTS: (frequent absences, health problems, other problems or handicaps in addition to hearing)<br />
The Preschool S.I.F.T.E.R. is a SCREENING TOOL ONLY. The primary goal of the Preschool S.I.F.T.E.R. is<br />
to identify those children who are at-risk for developmental or educational problems due to hearing problems and who merit further<br />
observation and investigation. Analysis has revealed that two factors, expressive communication and socially appropriate<br />
behavior, discriminate children who are normal from those who are at-risk. The greater the degree of hearing problem, the greater<br />
the impact on these two factors and the higher the validity of this screening measure. If a child is found to be at-risk then the<br />
examiner is encouraged to calculate the total score in each of the five content areas. Analysis of the content area score may assist<br />
in developing a profile of the child's strengths and special needs. The profile may prove beneficial in determining appropriate areas<br />
for evaluation and developing an individual program for the child.<br />
SCORING<br />
There are two steps to the scoring process. First, enter scores for each of the indicated questions in the spaces provided and sum<br />
the total of the 6 questions for the expressive communication factor and then the 4 questions for the socially appropriate behavior<br />
factor. If the child's scores fall into the At-Risk category for either or both of these factors, then sum the 3 questions in each content<br />
area to develop a profile of the child's strengths and potential areas of need.<br />
Enter circled response<br />
from reverse side<br />
for each indicated<br />
question<br />
1<br />
2<br />
3<br />
4<br />
5<br />
6<br />
7<br />
8<br />
9<br />
10<br />
11<br />
12<br />
13<br />
14<br />
15<br />
Total Score Total Score<br />
6 questions 4 questions<br />
EXPRESSIVE<br />
COMMUNICATION<br />
(check one)<br />
PASS (14 - 30)<br />
score range<br />
AT-RISK (6 -13)<br />
score range<br />
SOCIALLY APPROPRIATE<br />
BEHAVIOR<br />
(check one)<br />
PASS (12 - 20)<br />
score range<br />
AT-RISK (4 -11)<br />
score range<br />
SKILLS PROFILE<br />
CONTENT TOTAL PASS AT-RISK SCREENING<br />
AREA SCORE RANGE RANGE RESULTS<br />
(enter)<br />
(circle)<br />
PREACADEMICS 7 - 15 3 - 6 Pass At-Risk<br />
ATTENTION 9 - 15 3 - 8 Pass At-Risk<br />
COMMUNICATION 9 - 15 3 - 8 Pass At-Risk<br />
CLASS PARTICIPATION 7 - 15 3 - 6 Pass At-Risk<br />
SOCIAL BEHAVIOR 9 - 15 3 - 8 Pass At-Risk<br />
Sum the responses to the 3 questions in each content area from the reverse side.<br />
Enter the total score for each content area in the Total Score column above.
S.I.F.T.E.R.<br />
SCREENING INSTRUMENT FOR TARGETING EDUCATIONAL RISK<br />
by Karen L. Anderson, Ed.S., CCC-A<br />
STUDENT ____________________________________ TEACHER ____________________ GRADE __________<br />
DATE COMPLETED _____________ SCHOOL ________________________________ DISTRICT ____________<br />
The above child is suspect for hearing problems which may or may not be affecting his/her school performance.<br />
This rating scale has been designed to sift out students who are educationally at risk possibly as a result of hearing problems.<br />
Based on your knowledge from observations of this student, circle the number best representing his/her behavior.<br />
After answering the questions, please record any comments about the student in the space provided on the reverse side.<br />
1. What is your estimate of the student's class standing in<br />
comparison of that of his/her classmates<br />
2. How does the student's achievement compare to your estimation<br />
of her/her potential<br />
3. What is the student's reading level, reading ability group or<br />
reading readiness group in the classroom (e.g., a student with<br />
average reading ability performs in the middle group)<br />
UPPER MIDDLE LOWER<br />
5 4 3 2 1<br />
EQUAL LOWER MUCH LOWER<br />
5 4 3 2 1<br />
UPPER MIDDLE LOWER<br />
5 4 3 2 1<br />
ACADEMICS<br />
4. How distractible is the student in comparison to his/her<br />
classmates<br />
5. What is the student's attention span in comparison to that of his/<br />
her classmates<br />
6. How often does the student hesitate or become confused when<br />
responding to oral directions (e.g., "Turn to page . . .")<br />
NOT VERY AVERAGE VERY<br />
5 4 3 2 1<br />
LONGER AVERAGE SHORTER<br />
5 4 3 2 1<br />
NEVER OCCASIONALLY FREQUENTLY<br />
5 4 3 2 1<br />
ATTENTION<br />
7. How does the student's comprehension compare to the average<br />
understanding ability of her/her classmates<br />
8. How does the student's vocabulary and word usage skills<br />
compare with those of other student s in his/her age group<br />
9. How proficient is the student at telling a story or relating<br />
happenings from home when compared to classmates<br />
ABOVE AVERAGE BELOW<br />
5 4 3 2 1<br />
ABOVE AVERAGE BELOW<br />
5 4 3 2 1<br />
ABOVE AVERAGE BELOW<br />
5 4 3 2 1<br />
COMMUNICATION<br />
10. How often does the student volunteer information to class<br />
discussions or in answer to teacher questions<br />
11. With what frequency does the student complete his/her class<br />
and homework assignments within the time allocated<br />
12. After instruction, does the student have difficulty starting to<br />
work (looks at other students working or asks for help)<br />
FREQUENTLY OCCASIONALLY NEVER<br />
5 4 3 2 1<br />
ALWAYS USUALLY SELDOM<br />
5 4 3 2 1<br />
NEVER OCCASIONALLY FREQUENTLY<br />
5 4 3 2 1<br />
CLASS<br />
PARTICIPATION<br />
13. Does the student demonstrate any behaviors that seem<br />
unusual or inappropriate when compared to other students<br />
14. Does the student become frustrated easily, sometimes to the<br />
point of losing emotional control<br />
15. In general, how would you rank the student's relationship<br />
with peers (ability to get along with others)<br />
Copyright ©1989 by Karen Anderson<br />
NEVER OCCASIONALLY FREQUENTLY<br />
5 4 3 2 1<br />
NEVER OCCASIONALLY FREQUENTLY<br />
5 4 3 2 1<br />
GOOD AVERAGE POOR<br />
5 4 3 2 1<br />
Author permission is granted for reproduction.<br />
SCHOOL<br />
BEHAVIOR
TEACHER COMMENTS<br />
Has this child repeated a grade, had frequent absences or experienced health problems<br />
(including ear infections and colds) Has the student received, or is he/she now receiving,<br />
special services Does the child have any other health problems that may be pertinent to his/<br />
her educational functioning<br />
The S.I.F.T.E.R. is a SCREENING TOOL ONLY<br />
Any student failing this screening in a content area as determined on the scoring grid below should be<br />
considered for further assessment, depending on his/her individual needs as per school district criteria. For<br />
example, failing in the Academics area suggests an educational assessment, in the Communication area a<br />
speech-language assessment, and in the School Behavior area an assessment by a psychologist or a social<br />
worker. Failing in the Attention and/or Class Participation area in combination with other areas may suggest<br />
an evaluation by an educational audiologist. Children placed in the marginal area are at risk for failing and<br />
should be monitored or considered for assessment depending upon additional information.<br />
SCORING<br />
Sum the responses to the three questions in each content area and record in the appropriate box on the reverse<br />
side and under Total Score below. Place an X on the number that corresponds most closely with the content<br />
area score (e.g., if a teacher circled 3, 4 and 2 for the questions in the Academics area, an X would be placed<br />
on the number 9 across from the Academics content area). Connect the X's to make a profile.<br />
CONTENT AREA TOTAL PASS MARGINAL FAIL<br />
SCORE<br />
ACADEMICS 15 14 13 12 11 10 9 8 7 6 5 4 3<br />
ATTENTION 15 14 13 12 11 10 9 8 7 6 5 4 3<br />
COMMUNICATION 15 14 13 12 11 10 9 8 7 6 5 4 3<br />
CLASS<br />
PARTICIPATION 15 14 13 12 11 10 9 8 7 6 5 4 3<br />
SOCIAL BEHAVIOR 15 14 13 12 11 10 9 8 7 6 5 4 3
Secondary S.I.F.T.E.R.<br />
Screening Instrument For Targeting Educational Risk in Secondary Students<br />
By Karen L. Anderson, Ph.D.<br />
This scale has been designed to screen for educational risk in secondary students that have hearing loss.<br />
The effects of hearing impairment are frequently invisible. Regular monitoring of performance can assist<br />
in determining if a student is successfully accessing verbal instruction in the typical classroom. Based on<br />
your observations and familiarity with this student, circle the number that best represents his or her behavior.<br />
Student’s Name<br />
Grade<br />
Class Teacher Date<br />
School<br />
Student typically uses amplification Yes No Type<br />
1. How does the student’s general foundation skills (i.e., reading<br />
level) compare to the difficulty of work expected in class<br />
2. How does the student’s ability to summarize and draw<br />
conclusions about information presented in class compare to<br />
his/her class peers<br />
3. How does the student’s demonstration of academic skill growth<br />
compare to class peers/expectations<br />
1. When called upon and asked a question, how often does the<br />
student appear to have been attending to teacher instruction<br />
(he/she appears to understand the basis of the question)<br />
2. How successful is the student at avoiding distraction by noises,<br />
visual distractions, personal items, or activities unrelated to class<br />
instruction<br />
3. How does the student’s attention to detail compare to class<br />
peers/expectations (avoiding careless mistakes)<br />
1. How well does the student communicate his/her needs to the<br />
teacher in comparison to class peers/expectations<br />
2. How does the student’s word usage skills compare to class<br />
peers/expectations (i.e., written, verbal, signed vocabulary)<br />
3. What is your estimate of the student’s ability to assimilate<br />
teacher instruction (presented verbally or visually) in<br />
comparison to class peers/expectations<br />
Above Average Below<br />
5 4 3 2 1<br />
Above Average Below<br />
5 4 3 2 1<br />
Above Average Below<br />
5 4 3 2 1<br />
Always Often Rarely<br />
5 4 3 2 1<br />
Always Often Rarely<br />
5 4 3 2 1<br />
Above Average Below<br />
5 4 3 2 1<br />
Above Average Below<br />
5 4 3 2 1<br />
Above Average Below<br />
5 4 3 2 1<br />
Above Average Below<br />
5 4 3 2 1<br />
Academics Attention Communication<br />
1. In comparison to class peers, what is the student’s present level<br />
of meaningful contribution to classroom discussions<br />
2. To what level does the student demonstrate a recognition that<br />
participation is an integral part of the learning process<br />
3. During cooperative group activities, how often does the student<br />
interact with others to achieve the goals of group work<br />
Above Average Below<br />
5 4 3 2 1<br />
Above Average Below<br />
5 4 3 2 1<br />
Always Often Rarely<br />
5 4 3 2 1<br />
Class<br />
Participation<br />
1. How often does the student demonstrate respectful behavior<br />
toward others in class (peers and teacher)<br />
2. How often does the student follow classroom rules compared to<br />
class peers/expectations<br />
3. To what level does the student appear to be accepted by his/her<br />
peers<br />
Always Frequently Occasionally<br />
5 4 3 2 1<br />
Always Frequently Occasionally<br />
5 4 3 2 1<br />
Popular Average Isolated<br />
5 4 3 2 1<br />
School<br />
Behavior<br />
Copyright ©2004 by Karen L. Anderson, Ph.D.<br />
Author permission is granted for reproduction.
TEACHER COMMENTS<br />
Has the student had frequent absences or experienced health problems Does the student receive special<br />
services Does the student have any problems that may be pertinent to his/her educational performance<br />
THE SECONDARY <strong>SIFTER</strong> IS A SCREENING TOOL ONLY<br />
Students scoring in the failing range have scored in a manner consistent with students that scored at greater than<br />
one standard deviation below the mean compared to a group of 97 secondary students (40 with normal hearing,<br />
57 with hearing impairment). Students scoring in the marginal range have scored similar to test group students<br />
scoring below the mean and –1 standard deviation. Scores falling within both PASS and MARGINAL range<br />
occur within the broad range of normal performance as compared to the test group. Students scoring in the pass<br />
range have scored in a manner consistent to those in the test group who were at or above the group mean. Any<br />
student failing this screening in a content area as determined on the scoring grid below should be considered for<br />
educational accommodations or services specific to improving the student’s access to instruction and success in<br />
the regular classroom.<br />
SCORING<br />
Sum the responses to the three questions in each content area, and record in the appropriate box under Total<br />
Score below. Place an X on the number that corresponds most closely with each content area score (e.g., if a<br />
teacher circled a 3, 4, and 2 for the questions in the Academics area, an X would be placed on the number 9<br />
across from the Academics content area). Connect the X’s to make a profile.<br />
CONTENT AREA<br />
TOTAL<br />
SCORE<br />
PASS MARGINAL FAIL<br />
ACADEMICS 15 14 13 12 11 10 9 8 7 6 5 4 3 2 1<br />
ATTENTION 15 14 13 12 11 10 9 8 7 6 5 4 3 2 1<br />
COMMUNICATION 15 14 13 12 11 10 9 8 7 6 5 4 3 2 1<br />
CLASS PARTICIPATION 15 14 13 12 11 10 9 8 7 6 5 4 3 2 1<br />
SCHOOL BEHAVIOR 15 14 13 12 11 10 9 8 7 6 5 4 3 2 1<br />
+1 SD Mean -1 SD -2 SD