mtwara region socio-economic profile - Tanzania Online Gateway
mtwara region socio-economic profile - Tanzania Online Gateway
mtwara region socio-economic profile - Tanzania Online Gateway

Create successful ePaper yourself
Turn your PDF publications into a flip-book with our unique Google optimized e-Paper software.
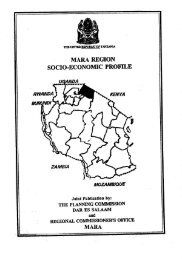
THE UNITED REPUBLIC OF TANZANIA<br />
MTWARA REGION<br />
SOCIO-ECONOMIC PROFILE<br />
UGANDA<br />
RWANDA<br />
BURUNDI<br />
KENYA<br />
MTWARA<br />
REGION<br />
ZAMBIA<br />
MSUMBIJI<br />
Joint Publication by:<br />
THE PLANNING COMMISSION<br />
DAR ES SALAAM<br />
and<br />
REGIONAL COMMISSIONER'S OFFICE<br />
MTWARA
TABLE OF CONTENTS<br />
Page<br />
FOREWORD.....................................................................................................................V<br />
SECTION I<br />
LAND, PEOPLE AND CLIMATE<br />
1.1 Geographical Location:............................................................................................. 1<br />
1.2 Land Area:................................................................................................................... 1<br />
1.3 Administrative Units:................................................................................................ 1<br />
1.4 Ethnicity:..................................................................................................................... 4<br />
1.5 Population Size, Growth and Distribution:............................................................. 4<br />
1.6 Population sex, households and Age Groups:.................................................... 15<br />
1.7 Urban/Rural Population Distribution:................................................................... 24<br />
1.8 Migration and Employment.................................................................................... 27<br />
1.9 Climate and Soils:..................................................................................................... 30<br />
1.10 Topography and Drainage:.................................................................................. 31<br />
1.11 Agro-Ecological Zones:........................................................................................ 31<br />
SECTION II<br />
REGIONAL ECONOMY<br />
2.1 INTRODUCTION:............................................................................................................ 34<br />
2.2 REGIONAL GDP AND PER CAPITA GDP: ................................................................... 35<br />
2.3 PRODUCTIVE SECTORS............................................................................................. 43<br />
2. 3.1 Agriculture ............................................................................................................ 43<br />
2.3.2 Livestock:............................................................................................................... 61<br />
2.3.3 Forestry:................................................................................................................. 65<br />
2.3.4 Fishery:................................................................................................................... 69<br />
2.3.5 Wildlife:.................................................................................................................. 73<br />
2.3.6 Beekeeping:............................................................................................................ 74<br />
2.3.7 Mining:................................................................................................................... 77<br />
2.3.8 Industries:.............................................................................................................. 78<br />
i
SECTION III<br />
SOCIAL SERVICES<br />
3.1 EDUCATION: ................................................................................................................ 79<br />
3.1.1 Pre-School Education:.......................................................................................... 79<br />
3.1.2 Primary School Education:................................................................................... 81<br />
1.2.2 Primary School Dropouts:.................................................................................... 87<br />
1.2.3 Primary School Teachers:.................................................................................... 91<br />
2.4 Primary education Infrastructure:.......................................................................... 92<br />
3.1.2.5 Comparative Status of Primary Education in Mtwara Region:.................... 95<br />
3.1.2.6 Special Primary Schools .................................................................................... 98<br />
3.1.3. Adult Education................................................................................................... 99<br />
3.1.4 Secondary School Education:........................................................................... 105<br />
3.2 HEALTH....................................................................................................................... 112<br />
3.2.1 Introduction......................................................................................................... 112<br />
3.2.2 Morbidity and Mortality.................................................................................... 113<br />
3.2.3 Health Facilities ................................................................................................... 118<br />
2.4 Child Immunization:............................................................................................... 125<br />
3.2.5 Child Nutrition:.................................................................................................... 127<br />
3.2.6 Infant and Under five Mortality:....................................................................... 131<br />
3.2.7 Maternal Mortality:............................................................................................. 135<br />
3.2.8 AIDS: .................................................................................................................... 140<br />
3.2.9 Life Expectancy ................................................................................................... 142<br />
3.2.10 Other Health Issues .......................................................................................... 143<br />
3.3 WATER SUPPLY ........................................................................................................ 146<br />
3.3.1 Introduction......................................................................................................... 146<br />
3.3.2 Rural Water Supplies.......................................................................................... 146<br />
3.3.3 Urban Water Supplies ........................................................................................ 148<br />
3.3.4 Sanitation ............................................................................................................. 151<br />
ii
SECTION IV<br />
ECONOMIC INFRASTRUCTURE<br />
4.1 Introduction............................................................................................................ 154<br />
4.2 Roads....................................................................................................................... 154<br />
ROAD NETWORK - MTWARA REGION............................................................... 156<br />
4.3. Air Services............................................................................................................ 159<br />
4.4. Marine Services..................................................................................................... 163<br />
4.5 Telecommunication Network................................................................................ 164<br />
4.6 Energy...................................................................................................................... 164<br />
4.6.1 Electricity:............................................................................................................. 164<br />
4.6.2 Fuelwood.............................................................................................................. 167<br />
4.6.3 Other forms of Energy........................................................................................ 167<br />
4.7 Land development ................................................................................................. 167<br />
SECTION V<br />
OTHER DEVELOPMENT ISSUES<br />
5.1 WOMEN IN DEVELOPMENT:..................................................................................... 169<br />
5.1.1 Women at Household Level:............................................................................. 169<br />
5.1.2 Women leadership at above household level: ............................................... 170<br />
5.1.3 Gender Issues and the Alleviation of Poverty:.............................................. 172<br />
5.2 Environmental Conservation:............................................................................... 175<br />
5.3 Tourism:................................................................................................................... 178<br />
SECTION VI<br />
POTENTIAL INVESTMENT AREAS<br />
6.1 Agriculture:............................................................................................................. 179<br />
6.2 Livestock:................................................................................................................ 180<br />
6.3 Forestry:.................................................................................................................. 182<br />
6.4 Beekeeping:............................................................................................................. 182<br />
6.5 Mining:.................................................................................................................... 182<br />
6.6 Industrial Development:........................................................................................ 183<br />
6.7 Transport:................................................................................................................ 183<br />
6.8 Energy:..................................................................................................................... 184<br />
6.9 Health:...................................................................................................................... 185<br />
iii
6.10 Education:............................................................................................................. 186<br />
6.11 Water Supply:....................................................................................................... 186<br />
6.12 Environmental Protection:.................................................................................. 187<br />
6.13 Women Development:......................................................................................... 188<br />
6.14 Tourism and Wildlife:.......................................................................................... 188<br />
ANNEX A<br />
Mtwara Region in a Nutshell...................................................................................... 189<br />
ANNEX B<br />
Mtwara/Mikindani District Summary (1996) ............................................................ 201<br />
ANNEX C<br />
Mtwara Rural District Summary (1996) ..................................................................... 206<br />
ANNEX D<br />
Newala District Summary ............................................................................................ 212<br />
ANNEX E<br />
Masasi District Summary ............................................................................................ 218<br />
ANNEX H<br />
GENERAL INFORMATION ABOUT TANZANIA .................................................... 224<br />
Area Of Mainland ........................................................................................................ 224<br />
<strong>Tanzania</strong> Mainland Area By Regions (Sq Km)........................................................ 224<br />
Population..................................................................................................................... 225<br />
Life Expectancy For <strong>Tanzania</strong> - By Regions, 1967, 1978, 1988, 1996: ................. 225<br />
Land Use....................................................................................................................... 226<br />
Arable Land:................................................................................................................. 226<br />
Lakes .............................................................................................................................. 226<br />
Mountain Summits (Metres Above Sea Level)....................................................... 226<br />
Climate ........................................................................................................................... 227<br />
Rainfall........................................................................................................................... 227<br />
Social Services.............................................................................................................. 228<br />
Health Facilities ............................................................................................................ 228<br />
National Parks............................................................................................................... 229<br />
iv
FOREWORD<br />
1. As we approach the 21st Century the problems facing rural<br />
areas in developing countries like <strong>Tanzania</strong> are numerous and<br />
formidable. Social and Economic services are deteriorating<br />
and proving to be unsustainable; school enrollment rates are<br />
declining; food situation is precarious; infant and maternal<br />
mortality rates continue to be high; unemployment is on the<br />
rise triggering off mass migration of youth from the rural areas<br />
into already overcrowded urban centres; in Mtwara Region, for<br />
example, land pressure is escalating and deforestation is going<br />
on at an alarming rate.<br />
2. This situation has arisen because of many factors including ill -<br />
prepared rural development programmes and weak monitoring<br />
and supervision of the implementation of development<br />
programmes and sectoral strategies. The observed<br />
shortcomings in the policy formulation, project identification,<br />
design, and implementation in the developing countries is in<br />
turn attributed to lack of reliable and adequate data and<br />
information on the rural development process.<br />
3. The publication of Regional Socio-<strong>economic</strong> Profiles series by<br />
the Planning Commission in collaboration with Regional<br />
Commissioner's offices should be viewed as a fruitful attempt<br />
towards finding solutions to the existing problem of data and<br />
information gap.<br />
4. The Regional Profile series cover a wide range of data and<br />
information on geography, population, social <strong>economic</strong><br />
parameters, social services, <strong>economic</strong> infrastructure and<br />
productive sectors. The publications so far have proved to be<br />
v
of high demand and a vital source of information to many<br />
policy makers, planners, researchers, donors and functional<br />
managers.<br />
The Planning Commission has found it a worthwhile effort to<br />
extend the exercise to cover even more <strong>region</strong>s. Readers are<br />
invited to make suggestions and constructive criticisms which<br />
can assist in improving the quality and effectiveness of future<br />
Profiles.<br />
5. I would like to take this opportunity to acknowledge with<br />
thanks once again the financial support of the Royal<br />
Norwegian Embassy which facilitated the preparation of the<br />
Mtwara Region Socio-Economic Profile. I would also like to<br />
thank both the Planning Commission and Mtwara Regional<br />
Planning Staff who put a lot of effort into ensuring the<br />
successful completion of this task.<br />
Nassoro W. Malocho (MP)<br />
MINISTER OF STATE<br />
PLANNING AND PARASTATAL SECTOR REFORM<br />
December, 1997<br />
vi
SECTION I<br />
LAND, PEOPLE AND CLIMATE<br />
1.1 Geographical Location:<br />
Mtwara <strong>region</strong> is one of 20 <strong>region</strong>s of <strong>Tanzania</strong> Mainland. It is<br />
the southernmost <strong>region</strong>. It lies between longitudes 38 o and 40 o<br />
30" east of Greenwich. It is also situated between latitudes 10 o<br />
05" and 11 o 25" south of the Equator.<br />
It borders Lindi <strong>region</strong> to the north, the Indian Ocean to the east<br />
and separated by the Ruvuma river from Mozambique in the<br />
south. To the west it borders Ruvuma <strong>region</strong>.<br />
1.2 Land Area:<br />
The <strong>region</strong> occupies 16,720 sq. kms or 1.9% of <strong>Tanzania</strong><br />
Mainland land area of 885,987 sq. kms. It is the second smallest<br />
<strong>region</strong> after Kilimanjaro. The <strong>region</strong> is divided between districts<br />
as in Table I - 1.<br />
1.3 Administrative Units:<br />
Mtwara <strong>region</strong> is administratively subdivided into 5 districts, 21<br />
divisions, 98 wards and 554 villages as shown in Table I - 1. The<br />
smallest of the districts is logically the urban district of<br />
Mtwara/Mikindani at 163 sq. kms. and the largest is Masasi at<br />
8,940 sq. kms which is 55 times the size of the urban district.<br />
1
Masasi district has also got the largest number of divisions, wards<br />
and villages.<br />
2
Originally Mtwara Region included Lindi until 1971 when Lindi<br />
was created to form a separate <strong>region</strong>.<br />
TABLE I - 1: AREA AND ADMINISTRATIVE STRUCTURE OF<br />
MTWARA REGION, 1996:<br />
District<br />
Area<br />
(Km 2 )<br />
Number of<br />
Divisions<br />
Number of<br />
Wards<br />
Number of<br />
Villages<br />
Mtwara/Mikindani<br />
(U)<br />
163 2 13 6<br />
Mtwara Rural 3,597 6 17 101<br />
Newala 2,126 3 16 130<br />
Tandahimba 1,894 3 22 103<br />
Masasi 8,940 7 30 214<br />
Total 16,720 21 98 554<br />
Source: Regional Commissioner's Office, Mtwara, 1997.<br />
3
Fig. 1: Distribution of area (Sq. Km) by<br />
district, Mtwara <strong>region</strong><br />
Mtwara/Mikind<br />
ani (U)<br />
1%<br />
Mtwara Rural<br />
22%<br />
Masasi<br />
53%<br />
Newala<br />
13%<br />
Tandahimba<br />
11%<br />
1.4 Ethnicity:<br />
The 1948 and 1967 censuses indicated that the majority of the<br />
indigenous people of the <strong>region</strong> were of Bantu origin. The most<br />
dominant groups are the Makonde of Newala, Tandahimba,<br />
Masasi and Mtwara rural. They made 60% of the population.<br />
This group is followed by the Makua of Masasi and Mtwara rural.<br />
The Yao, the third group, are found in Masasi.<br />
1.5 Population Size, Growth and Distribution:<br />
The history of Mtwara <strong>region</strong> population size is recorded by the<br />
1967, 1978 and 1988 population censuses as in Table I-2<br />
including the densities of the population per sq. km.<br />
TABLE I - 2: POPULATION OF MTWARA REGION 1967, 1978 AND<br />
1988:<br />
4
Year 1967 1978 1988<br />
Population 621,293 771,818 875,977<br />
Population<br />
Density<br />
37 46 53<br />
Source:<br />
Data compiled from 1988 Population Census.<br />
5
Fig. 2 (a): Population of Mtwara <strong>region</strong> 1967, 1978 and 1988<br />
1,000,000<br />
800,000<br />
600,000<br />
400,000<br />
200,000<br />
0<br />
1967 1978 1988<br />
Fig. 2 (b): Population density of Mtwara <strong>region</strong> 1967, 1978 and 1988<br />
60<br />
50<br />
40<br />
30<br />
20<br />
10<br />
0<br />
1967 1978 1988<br />
Mtwara <strong>region</strong>'s population increased by more than 40% between<br />
1967 and 1988.<br />
However, in order to get the proper perspective, the <strong>region</strong>s<br />
population and density has to be matched against other <strong>region</strong>s in<br />
<strong>Tanzania</strong> mainland. From Table I-3 the picture emerges that<br />
Mtwara <strong>region</strong> though having only 1.9% of Mainland land area<br />
carries 4% of its population. This can be explained by a higher<br />
than average population density. Mtwara has a density of 53.2<br />
6
people per sq. km. while the mainland average is a mere 25.3<br />
people per sq. km.<br />
TABLE I-3: POPULATION DISTRIBUTION BY REGION AND<br />
DENSITY, TANZANIA MAINLAND, 1988:<br />
Region<br />
Land Area Sq.<br />
Km.<br />
Populatio<br />
n<br />
Population<br />
Density per Sq.<br />
Km.<br />
Population as a<br />
% of Mainland<br />
Mtwara 16,710 875,977 53.2 4.0<br />
Lindi 67,000 646,345 9.6 2.9<br />
Shinyanga 50,760 1,763,960 34.9 7.9<br />
Mwanza 20,095 1,878,271 93.5 8.4<br />
Dodoma 41,311 1,235,277 30.0 5.5<br />
Arusha 82,098 1,352,225 16.5 6.0<br />
Kilimanjaro 13,309 1,108,699 83.7 4.9<br />
Tanga 26,677 1,280,262 48.1 5.7<br />
Morogoro 70,799 1,222,737 17.0 5.4<br />
Coast/DSM 33,800 1,998,865 59.1 8.9<br />
Ruvuma 66,477 783,327 12.0 3.5<br />
Iringa 56,850 1,193,074 21.3 5.3<br />
Mbeya 60,350 1,476,261 24.0 6.6<br />
Singida 49,341 791,814 16.0 3.5<br />
Tabora 76,151 1,036,293 14.0 4.6<br />
Rukwa 68,635 704,050 10.1 3.1<br />
Kigoma 37,040 853,263 23.1 3.8<br />
Mara 21,760 952,616 43.7 4.2<br />
Kagera 28,456 1,313,639 46.6 5.8<br />
Total Mainland 887,619 22,466,95<br />
5<br />
25.3 100.0<br />
7
Source:<br />
1988 Population Census.<br />
Fig. 3 (a) Distribution of land area (Sq. Km)<br />
of Mtwara <strong>region</strong> to the total Mainland<br />
Mtwara<br />
2%<br />
Total<br />
Mainland<br />
98%<br />
Fig. 3 (b) Distribution of population of Mtwara<br />
<strong>region</strong> to the total Mainland, 1988<br />
Mtwara<br />
4%<br />
Total<br />
Mainland<br />
96%<br />
8
Fig. 3 (c) Distribution of population density for Mtwara<br />
<strong>region</strong> to the total Mainland, 1988<br />
Average<br />
Mainland<br />
32%<br />
Mtwara<br />
68%<br />
Compared to its neighbouring <strong>region</strong>s of Lindi, Ruvuma,<br />
Morogoro and Coast (excluding DSM) Mtwara is the most<br />
densely populated <strong>region</strong>.<br />
TABLE I-4:<br />
Region<br />
POPULATION AND POPULATION GROWTH BY<br />
REGIONS, 1978 AND 1988:<br />
Population<br />
Annual Growth Rates<br />
1978 1988 1967/78 1978/88<br />
Mtwara 771,818 875,977 2.0 1.4<br />
Dar-es-Salaam 843,090 1,360,850 7.8 4.7<br />
Rukwa 451,897 704,050 4.5 4.2<br />
Tabora 817,907 1,042,622 4.4 2.4<br />
Kagera 1,009,767 1,313,639 3.9 2.7<br />
Arusha 926,223 1,352,225 3.8 3.7<br />
Shinyanga 1,323,535 1,763,960 3.5 2.9<br />
Mbeya 1,079,864 1,476,261 3.3 3.1<br />
Ruvuma 561,575 779,868 3.2 3.3<br />
10
Dodoma 972,005 1,235,277 2.9 2.4<br />
Kilimanjaro 902,437 1,106,068 2.9 2.1<br />
Morogoro 939,264 1,279,931 2.9 2.6<br />
Kigoma 648,941 853,263 2.9 2.7<br />
Mwanza 1,443,379 1,876,776 2.8 2.6<br />
Tanga 1,037,767 1,280,262 2.7 2.1<br />
Iringa 925,044 1,193,074 2.7 2.7<br />
Singida 613,949 793,887 2.7 2.5<br />
Mara 723,827 952,616 2.6 2.9<br />
Lindi 527,624 642,364 2.1 2.0<br />
Coast 516,586 639,182 1.7 2.1<br />
Total Mainland 17,036,499 22,466,955 3.2 2.8<br />
Source:<br />
1988 Population Census, National Profile.<br />
Fig. 4:<br />
Annual population growth rates 1967/78 and 1978/88 of Mtwara<br />
<strong>region</strong> to the total Mainland<br />
3.5<br />
3<br />
2.5<br />
2<br />
1.5<br />
1<br />
0.5<br />
0<br />
1967/78 Mtwara<br />
1978/88<br />
11<br />
Total Mainland<br />
A perusal of Table I-4 reveals that during 1967/78 Mtwara <strong>region</strong><br />
had the least but one annual population growth rate. During the<br />
subsequent ten years 1978/88 the <strong>region</strong> showed the least growth
of any <strong>region</strong> and also that the rate had gone down compared to<br />
the previous ten years.<br />
12
TABLE I-5:<br />
ANNUAL POPULATION GROWTH<br />
RATES BY DISTRICT, 1967/78 AND 1978/88<br />
District 1967/78 1978/88<br />
Mtwara/Mikindani<br />
Mtwara Rural<br />
and<br />
2.2 2.4<br />
Newala & Tandahimba 1.1 1.0<br />
Masasi 2.2 1.9<br />
Total 2.0 1.4<br />
Source: 1988 Population Census - Mtwara Regional Profile.<br />
Fig. 5: Annual population growth rates by district, 1967/78 and 1978/88, Mtwara<br />
<strong>region</strong><br />
2.5<br />
2<br />
1.5<br />
1<br />
0.5<br />
0<br />
Mtwara / Mikindani<br />
and Mtwara Rural<br />
Newala &<br />
Tandahimba<br />
Masasi<br />
1967/78<br />
1978/88<br />
According to Table I-5 all districts show a decline in annual<br />
population growth rate except for Mtwara<br />
Rural/Mtwara/Mikindani. The exception can be explained by the<br />
fact that the annual growth rate in urban areas of the <strong>region</strong> went up<br />
13
etween 1978 and 1988 quite markedly. Newala/Tandahimba<br />
district is possibly one of few districts in the country which have an<br />
annual population growth rate of as low as 1.0.<br />
TABLE I-6:<br />
POPULATION DENSITY AND DISTRIBUTION BY DISTRICT,<br />
MTWARA REGION, 1988, 1996 AND 2000 A.D:<br />
District<br />
Land<br />
Area<br />
1988 1996 2000<br />
Km 2<br />
Actual<br />
Populati<br />
on<br />
Annual<br />
Growth<br />
Rate %<br />
Population<br />
Density per<br />
Km 2<br />
Population<br />
Estimate<br />
Population<br />
Density<br />
per Km 2<br />
Population<br />
Estimate<br />
Population<br />
Density<br />
per Km 2<br />
Mtwara/Mik<br />
indani<br />
Mtwara<br />
Rural<br />
163 75,857 4.0 465.4 103,815 636.9 121.449 745.1<br />
3,597 168,189 1.6 46.8 190,962 53.1 203,480 56.6<br />
Newala 2,126 301,247* 1.0 74.9* 149,555 70.3 155,615 73.2<br />
Tandahimb<br />
a<br />
1,894 - 1.0 - 176,555 93.3 183,824 97.1<br />
Masasi 8,940 330,684 1.9 37.0 384,421 43.0 414,480 46.4<br />
Total 16,720 875,977 1.4 52.4 1,005,405 60.1 1,078,84<br />
5<br />
64.5<br />
Source:<br />
Data compiled from 1988 Population Census<br />
* Includes Tandahimba district<br />
Note: Annual growth rates estimates except for Masasi.<br />
Table 1-6 reveals that Masasi is the most populous district<br />
accounting for almost 40% of the <strong>region</strong>'s population. The<br />
Mtwara/Mikindani urban district is now the smallest in terms of<br />
people but its share of the total <strong>region</strong>al population is increasing.<br />
It was 8.6% in 1988 but it is expected to be 11% by 2000 A.D.<br />
14
Mtwara Rural, Newala and Tindahimba districts in 1996<br />
accounted for 19% 15% and 18% respectively.<br />
1.6 Population sex, households and Age Groups:<br />
Distribution of the 1988 population census between the sexes<br />
gives a <strong>region</strong>al average sex ratio of 91.9. This means for every<br />
100 females there are 91.9 males. There are a lot more women<br />
compared to men than is average for mainland <strong>Tanzania</strong>. Newala<br />
district displayed the biggest dispacity in a number between the<br />
sexes in the <strong>region</strong>. It had a sex ratio of 85.5 or approximately 46<br />
males for every 54 females. See Table 1-7.<br />
The situation with respect to 1978 census is that the <strong>region</strong>al<br />
average sex ratio since then had remained essentially the same<br />
except for a slight shift. The 1978 sex ration was 93.5. This<br />
means that by 1988 the imbalance in numbers between the sexes<br />
was even greater than it was in 1978.<br />
The urban district of Mtwara/Mikindani showed more men than<br />
women in both cases. In 1978 the sex ratio was 102.8. The sex<br />
ratio of 103.8 in 1988 shows that the gap is widening. See Table<br />
I-7 and I-8. There are 198,848 households in Mtwara <strong>region</strong><br />
making an average household size of 4.4. Mtwara Rural and<br />
Newala districts had the highest size at 4.5. Mtwara Urban and<br />
Masasi districts had the lowest at 4.3. See Table 1.9.<br />
15
TABLE I-7:<br />
POPULATION DISTRIBUTION BY SEX AND<br />
DISTRICT, 1988:<br />
District Male Female Total Sex Ratio<br />
Mtwara/Mikindani Urban 38,916 37,491 76,407 103.8<br />
Mtwara Rural 80,853 88,459 169,312 91.4<br />
Newala 141,857 165,858 307,715 85.5<br />
Masasi 162,160 173,288 335,448 93.6<br />
Total 423,786 465,096 888,882 91.9<br />
Source:<br />
1988 Population Census.<br />
Fig. 6: Population distribution by district and sex, Mtwara <strong>region</strong> 1988<br />
180,000<br />
160,000<br />
140,000<br />
120,000<br />
100,000<br />
80,000<br />
60,000<br />
40,000<br />
20,000<br />
0<br />
Mtwara/<br />
Mikindani<br />
Urban<br />
Mtwara<br />
Rural<br />
Newala<br />
Masasi<br />
Male<br />
Female<br />
16
TABLE I-8:<br />
POPULATION DISTRIBUTION BY SEX AND<br />
DISTRICT, 1978:<br />
District Male Female Total Sex Ratio<br />
Mtwara/Mikindani Urban 24,584 23,907 48,491 102.8<br />
Mtwara Rural 70,090 73,943 144,033 94.8<br />
Newala 145,599 161,786 307,385 90.0<br />
Masasi 132,769 139,140 271,909 95.4<br />
Total 373,042 398,776 771,818 93.5<br />
Source:<br />
1988 Population Census, Regional Profile Mtwara.<br />
Fig. 7: Population distribution by district and sex, Mtwara <strong>region</strong> 1978<br />
180,000<br />
160,000<br />
140,000<br />
120,000<br />
100,000<br />
80,000<br />
60,000<br />
40,000<br />
20,000<br />
0<br />
Mtwara/Mi<br />
kindani<br />
Urban<br />
Mtwara<br />
Rural<br />
Newala<br />
Masasi<br />
Male<br />
Female<br />
17
TABLE I-9:<br />
District<br />
Mtwara/Mikindani<br />
Urban<br />
POPULATION HOUSEHOLD SIZE BY DISTRICT,<br />
MTWARA REGION, 1988:<br />
Total<br />
Population<br />
Number of<br />
Households<br />
Average Household<br />
Size<br />
75,857 17,814 4.3<br />
Mtwara Rural 168,189 37,519 4.5<br />
Newala 301,247 66,496 4.5<br />
Masasi 330,684 77,019 4.3<br />
Total 875,977 198,848 4.4<br />
Source:<br />
1988 Population Census, Mtwara Regional Profile.<br />
TABLE I-10:<br />
District<br />
POPULATION HOUSEHOLD SIZE BY DISTRICT AND BY<br />
RURAL/URBAN ORIENTATION, MTWARA REGION, 1988:<br />
Population Number of Households Average Household Size<br />
Rural Urban Rural Urban Rural Urban<br />
Mtwara/Mikindani Urban 9,405 66,452 2,109 15,705 4.5 4.2<br />
Mtwara Rural 161,576 6,613 35,977 1,542 4.5 4.3<br />
Newala 275,599 25,648 60,666 5,830 4.5 4.4<br />
Masasi 304,273 26,411 70,730 6,289 4.3 4.2<br />
Total 750,883 125,124 169,482 29,366 4.4 4.3<br />
Source:<br />
1988 Population Census, Mtwara Region Profile.<br />
18
Fig. 8: Rural and Urban population orientation by district, Mtwara <strong>region</strong>, 1988<br />
350,000<br />
300,000<br />
250,000<br />
200,000<br />
150,000<br />
100,000<br />
50,000<br />
0<br />
Mtwara/<br />
Mikindani<br />
Urban<br />
Mtwara<br />
Rural<br />
Newala<br />
Masasi<br />
Rural<br />
Urban<br />
Table 1.10 reveals the trend in household size between urban and<br />
rural areas. In every case urban sizes are smaller than rural<br />
household sizes.<br />
TABLE I-11:<br />
POPULATION AGE GROUPS BY DISTRICT, MTWARA<br />
REGION, 1988:<br />
District<br />
Age Groups<br />
0 - 4 5 - 14 15 - 44 45 - 64 65+<br />
Dependenc<br />
y Ratio<br />
Mtwara/Mikindani Urban 10,483 19,007 37,566 7,390 2,115 70.30<br />
Mtwara Rural 24,144 43,087 71,469 22,182 8,373 80.73<br />
Newala 39,881 82,481 127,408 41,258 16,483 82.32<br />
Masasi 52,055 88,769 135,005 41,480 16,626 89.21<br />
Total 126,561 233,347 371,451 112,303 43,577 83.41<br />
Source:<br />
1988 Population Census, Regional Profile, Mtwara.<br />
19
Fig. 9 (a): Population age groups in Mtwara/Mikindani Urban, 1988<br />
40,000<br />
35,000<br />
30,000<br />
25,000<br />
20,000<br />
15,000<br />
10,000<br />
5,000<br />
0<br />
0 - 4 5 - 14 15 - 44 45 - 64 65+<br />
Fig. 9 (b): Population age groups in Mtwara Rural district, 1988<br />
80,000<br />
70,000<br />
60,000<br />
50,000<br />
40,000<br />
30,000<br />
20,000<br />
10,000<br />
0<br />
0 - 4 5 - 14 15 - 44 45 - 64 65+<br />
20
Fig. 9 (c): Population age groups in Newala district, 1988<br />
140,000<br />
120,000<br />
100,000<br />
80,000<br />
60,000<br />
40,000<br />
20,000<br />
0<br />
0 - 4 5 - 14 15 - 44 45 - 64 65+<br />
Fig. 9 (d): Population age groups in Masasi district, 1988<br />
140,000<br />
120,000<br />
100,000<br />
80,000<br />
60,000<br />
40,000<br />
20,000<br />
0<br />
0 - 4 5 - 14 15 - 44 45 - 64 65+<br />
The distribution of various age groups in the <strong>region</strong>'s population is<br />
shown in Table I-11 and I-12 for 1988 and 1978 respectively.<br />
The dependency ratio has decreased from 86.26 in 1978 to<br />
83.41 in 1988. This <strong>economic</strong>ally is a healthy sign. For some<br />
inexplicable reason Masasi district's dependence ratio increased<br />
dramatically from 53.31 in 1978 to 89.21 in 1988. The<br />
proportion of people 65 years of age and over in the population<br />
21
increased from 4.7% to 4.9% between the two censuses. The<br />
national average is 4.3% for 1988. The proportion of the 0 - 14<br />
age group was 41.6% in 1978 and 40.6% in 1988. This is very<br />
good when compared to the national average of 45.7% for 1988.<br />
Population control policies<br />
TABLE 1-12: POPULATION AGE GROUPS BY DISTRICT,<br />
MTWARA REGION, 1978:<br />
District<br />
Total<br />
Population<br />
Age Groups<br />
Depe<br />
nden<br />
ce<br />
Rati<br />
o<br />
0 - 4 5 - 14 15 - 44 45 - 64 65+<br />
Mtwara/Mikindani<br />
Urban<br />
48,491 7,824 11,406 24,309 4,068 884 70.8<br />
8<br />
Mtwara Rural 144,033 23,438 35,239 60,621 18,360 6,375 82.3<br />
6<br />
Newala 307,385 46,777 80,129 129,085 35,333 16,061 86.9<br />
5<br />
Masasi 271,909 45,345 71,076 107,774 34,811 12,903 53.3<br />
1<br />
Total 771,818 123,38 197,850 321,789 92,592 36,222 86.2<br />
6<br />
Source:<br />
1988 Population Census, Regional Profile, Mtwara.<br />
are being effective. This is also consistent with the low population growth<br />
rate which declined further from 2.0% to 1.4% between 1978 and 1988.<br />
22
Fig. 10 (a): Population age groups in Mtwara/Mikindani Urban, 1978<br />
25,000<br />
20,000<br />
15,000<br />
10,000<br />
5,000<br />
0<br />
0 - 4 5 - 14 15 - 44 45 - 64 65+<br />
Fig. 10 (b): Population age groups in Mtwara Rural district, 1978<br />
70,000<br />
60,000<br />
50,000<br />
40,000<br />
30,000<br />
20,000<br />
10,000<br />
0<br />
0 - 4 5 - 14 15 - 44 45 - 64 65+<br />
23
Fig. 10 (c): Population age groups in Newala district, 1978<br />
140,000<br />
120,000<br />
100,000<br />
80,000<br />
60,000<br />
40,000<br />
20,000<br />
0<br />
0 - 4 5 - 14 15 - 44 45 - 64 65+<br />
Fig. 10 (d): Population age groups in Masasi district, 1978<br />
140,000<br />
120,000<br />
100,000<br />
80,000<br />
60,000<br />
40,000<br />
20,000<br />
0<br />
0 - 4 5 - 14 15 - 44 45 - 64 65+<br />
1.7 Urban/Rural Population Distribution:<br />
In Mainland <strong>Tanzania</strong> 18.3% of the population were living in<br />
urban areas in 1988. In Mtwara 14.3% of the <strong>region</strong>'s population<br />
lived in urban areas. It was 12.0% in 1978 and 3.3% in 1967 for<br />
Mtwara. In 1978 the urban settlements were Mtwara/Mikindani,<br />
24
Newala, Masasi, Mahuta and Bondeni. The 1967, 1978 and<br />
1988 statistics show that slowly the <strong>region</strong> is getting urbanized.<br />
From Tables I-13 and I-14 the <strong>region</strong>al average trend is clear.<br />
The <strong>region</strong> moved from 12% urbanization in 1978 to 14.4%<br />
urbanization in 1988. The position with respect to the districts of<br />
Mtwara Urban and Newala need some explaining. The departure<br />
shown by these districts from the norm may have been due to the<br />
re-demarcation of administrative boundaries.<br />
TABLE I-13:<br />
District<br />
DISTRIBUTION OF RURAL AND URBAN POPULATION BY<br />
DISTRICT, MTWARA REGION, 1978 AND 1988:<br />
Urban Rural Total<br />
1978 1988 1978 1988 1978 1988<br />
Mtwara/Mikindani<br />
Urban<br />
48,491 66,452 NIL 9,405 48,491 75,857<br />
Mtwara Rural NIL 6,613 144,033 161,576 144,033 168,189<br />
Newala 30,735 25,648 276,650 275,599 307,385 301,247<br />
Masasi 13,129 26,411 258,780 304,273 271,909 330,684<br />
Total 92,355 125,12<br />
4<br />
679,463 750,883 771,818 875,977<br />
Source:<br />
1978 Population Census Vol.IV<br />
1988 Population Census, Regional Profile, Mtwara.<br />
25
Fig. 11 (a) Distribution of rural and urban population by district, Mtwara <strong>region</strong>,<br />
1978<br />
300,000<br />
250,000<br />
200,000<br />
150,000<br />
100,000<br />
50,000<br />
0<br />
Mtwara/<br />
Mikindani<br />
Urban<br />
Mtwara<br />
Rural<br />
Newala<br />
Masasi<br />
Urban 1978 Rural 1978<br />
Fig. 11 (b) Distribution of rural and urban population by district, Mtwara <strong>region</strong>,<br />
1988<br />
350,000<br />
300,000<br />
250,000<br />
200,000<br />
150,000<br />
100,000<br />
50,000<br />
0<br />
Mtwara/<br />
Mikindani<br />
Urban<br />
Mtwara<br />
Rural<br />
Newala<br />
Masasi<br />
Urban 1988 Rural 1988<br />
26
TABLE I-14: URBAN POPULATION DISTRIBUTION AND<br />
PROPORTION OF TOTAL REGIONAL<br />
POPULATION, BY DISTRICT 1978 AND 1988:<br />
District<br />
Urban<br />
Population<br />
1978 1988<br />
% of Total<br />
Population<br />
Urban<br />
Population<br />
% of<br />
Total<br />
Populatio<br />
n<br />
Mtwara/Mikin<br />
dani Urban<br />
48, 491 100 66,452 87.6<br />
Mtwara Rural Nil 0 6,613 3.9<br />
Newala 30,735 10.0 25,648 8.5<br />
Masasi 13,129 4.8 26,411 8.0<br />
Total 92,355 12.0 125,124 14.3<br />
Source:<br />
1978 Population Census Vol IV<br />
1988 Population Census, Regional Profile, Mtwara<br />
1.8 Migration and Employment<br />
Table 1-15 shows the migration status of the <strong>region</strong> in 1988.<br />
Lifetime in migration stood at 46,299 while out migration was as<br />
much as 144,988. This gives a net lifetime migration of -98,689.<br />
The negative net lifetime migration figure means that the <strong>region</strong> was<br />
losing people to other parts of the country. Mtwara <strong>region</strong> is in the<br />
same situation as its fellow southern neighbours Lindi and Ruvuma<br />
<strong>region</strong>s.<br />
27
TABLE 1-15: LIFETIME MIGRATION BY REGION,<br />
TANZANIA MAINLAND, 1988:<br />
Region<br />
Lifetime in<br />
Migration<br />
Lifetime<br />
Out<br />
Migration<br />
Net lifetime<br />
Migration<br />
Gross<br />
Migration<br />
Mtwara 46,299 144,988 -98,689 191,287<br />
Lindi 95,200 145,031 -49,831 240,231<br />
Arusha 218,429 76,703 141,724 295,130<br />
K'njaro 93,040 217,423 -124,383 310,463<br />
Tanga 98,747 150,915 -52,168 249,662<br />
Morogoro 172,393 141,956 30,437 314.349<br />
Coast 103,804 207,716 -103,912 311.520<br />
Dar es Salaam 651,246 150,625 500,621 801,871<br />
Dodoma 89,900 190,985 -101,085 280,885<br />
Ruvuma 66,442 81,661 -15,219 148,103<br />
Iringa 49,282 169,480 -120,198 218,762<br />
Mbeya 160,377 113,378 46,999 273,755<br />
Singida 86,651 150,531 -63,880 237,182<br />
Tabora 241,729 175,359 66,370 417,088<br />
Rukwa 87,599 49,294 38,305 136,893<br />
Kigoma 26,795 129,718 -102,923 150,513<br />
Shinyanga 288,210 281,447 6,763 569,657<br />
Kagera 103,713 109,693 -5,980 213,406<br />
Mwanza 270,142 303,646 -33,504 573,788<br />
Mara 75,987 115,865 -39,878 191,852<br />
Total 3,025,983 3,106,414 -80,431 6,132,397<br />
28
Source: 1988 Population Census National <strong>profile</strong>.<br />
The southern zone as a whole and Mtwara in particular is<br />
unattractive to the new generation who move out in search of<br />
greener pastures elsewhere in <strong>Tanzania</strong>. They are <strong>economic</strong><br />
"refugees". To stem this outflow means a lot of work in making<br />
the <strong>region</strong> and the zone <strong>economic</strong>ally attractive to young people.<br />
Drastic improvement in road connections with the north will open<br />
up the <strong>region</strong> to markets in the north. It can also provide access<br />
to the <strong>region</strong> for industrial goods and supporting <strong>economic</strong> and<br />
social services inputs from the more developed parts of the<br />
country. The <strong>region</strong> had the potential to make it attractive to<br />
coming generations of young people so that they do not need to<br />
go beyond its borders to seek a secure <strong>economic</strong> future.<br />
Current efforts at providing employment to youths include<br />
indirectly the opening up of a thriving gemstone mining industry<br />
where any one can participate as a small scale miner. The<br />
establishment of 459 women groups as part of the gender issue<br />
exercise, boosts employment among women. Similarly, the<br />
existence of youth groups dedicated to income generation is<br />
another relevant effort which has the potential for great expansion.<br />
So far 38 groups and 15 individual youths have taken advantage<br />
of loans of up to TShs 7.5 million. The distribution of these youth<br />
groups is Newala 30, Masasi 28, Mtwara/Mikindani 14 and<br />
Mtwara Rural 22.<br />
Future strategy could include the expansion of women and youth<br />
groups, expansion of small scale gemstone mining and the<br />
development of the tourist industry. But in the long run the<br />
29
agricultural, forestry (including beekeeping) and the fishing<br />
industries have got to be developed to the extent that they attract<br />
new generations. The industry sector is another long term<br />
possibility.<br />
1.9 Climate and Soils:<br />
Prevailing winds are critical in determining climate for this <strong>region</strong><br />
which borders on the Indian Ocean. During the period<br />
November/December to April/May the dominant winds are from<br />
the north-east. They bring a hot humid rainy season to the <strong>region</strong>,<br />
when they blow from south-east the <strong>region</strong> is dry, cooler and less<br />
humid.<br />
The rainy season of November/December to April/May is single<br />
peaked, the peak being reached in January but occasionally in<br />
February or March. The amount of total annual precipitation<br />
tends to vary with altitude. Mtwara district rains vary from 935<br />
mm to 116 mm in the hills and the plateau. It is 893 mm at<br />
Masasi Mission and 1001 mm at Newala. It also varies from<br />
1133 mm at Mtopwa to 832 mm at Lukwika Mission.<br />
Likewise temperatures vary from 27 0 as the highest monthly mean<br />
at Mtwara on the coast in December to 23 0 C in July. Relative<br />
humidity goes from 87% in March to 79% in October in Mtwara.<br />
Temperatures and humidity are lower inland.<br />
Geology determines soils. The <strong>region</strong> has two geological zones<br />
and hence two geologically determined soils types. The first zone<br />
is geologically the coastal sedimentary formation extending some<br />
30
125 kms from the Indian Ocean to the edge of the Makonde<br />
Plateau of Newala. This zone produces deep, well drained, sandy<br />
soils of low fertility and low moisture holding capacity. They are<br />
produced from sandstones. Some areas give rise to marine heavy<br />
clay soils or vertisols. Further, coastal limestones produce red,<br />
well drained, heavy textured soils.<br />
The second zone geologically extend west of the coastal<br />
sediments. It is a zone of pre-cambrian basement rocks<br />
consisting of gneisses and granulites. Soils from this basement are<br />
variable. They are deep, well drained, red clays to the north of<br />
Masasi town. These are the best soils in the <strong>region</strong> since they suit<br />
best the upland crops of the <strong>region</strong>. South of Masasi course<br />
grained sandy soils occur frequently.<br />
1.10 Topography and Drainage:<br />
Topography wise the <strong>region</strong> is divided into two halves. The<br />
coastal plain with its complexity of landforms. Secondly the<br />
basement plain dominated by the Makonde Plateau at 300mm to<br />
400mm. It is generally low level with isolated rocky hills and<br />
steep river sides.<br />
The western half lying beyond the Makonde Plateau drains to the<br />
south through the tributaries of the Ruvuma river. The Maombi<br />
and Mbuo rivers drain most of the Makonde Plateau.<br />
1.11 Agro-Ecological Zones:<br />
31
Mtwara <strong>region</strong> has four agro-ecological zones according to<br />
climate, landform, agriculture and soil / vegetation characteristics.<br />
Zone I:<br />
South half of Mtwara Rural and South - East of<br />
Newala:<br />
Monomodal rainfall with annual precipitation<br />
exceeding 1000 mm and 6 months of growing<br />
season (November - April). Low altitude.<br />
Isohyperthermic temperatures. Soils of low<br />
fertility.<br />
Zone II:<br />
North half of Mtwara Rural:<br />
Monomodal rainfall averaging 600mm to 1000<br />
mm in six months (November - April) Mid<br />
altitude. Isohyperthermic temperatures. Soils of<br />
low fertility with medium moisture retaining<br />
capacity.<br />
Zone III:<br />
The Whole of Masasi (Except Northern Part)<br />
North and West Parts of Newala:<br />
Monomodal rainfall averaging 600 mm to 1000<br />
mm in 5 months growing season (December -<br />
April). Low altitude. Isohyperthermic<br />
temperatures. Soils of low fertility.<br />
Zone IV:<br />
The South East of Mtwara Rural:<br />
32
Bimodal rainfall pattern with annual precipitation<br />
of over 600 mm. The growing season last 7<br />
months. (November - May) Soils of high fertility<br />
and of alluvial origin. Low altitude.<br />
33
SECTION II<br />
REGIONAL ECONOMY:<br />
2.1 Introduction:<br />
Present day Mtwara <strong>region</strong> came into being in 1971 as a result of<br />
the division of Mtwara and Lindi as a single <strong>region</strong> into two<br />
separate <strong>region</strong>s. The <strong>region</strong> is located at the extreme southern<br />
end of the republic. Inspite of this remoteness and its <strong>economic</strong><br />
background, the <strong>region</strong> has made some <strong>economic</strong> progress.<br />
Mtwara like the rest of <strong>Tanzania</strong> is predominately agricultural.<br />
The main occupation of the inhabitants of the <strong>region</strong> is farming.<br />
About 92 percent of the population is engaged in agriculture, apart<br />
from other rural activities like fishing, beekeeping and small scale<br />
industries. Approximately 85 percent of the <strong>region</strong>'s total area is<br />
arable land. However less than 20 percent of this is under<br />
cultivation. The average farm size per rural household (169,482<br />
households - 1988 Census) which averages 4.4 persons is<br />
estimated at 1.5 ha.<br />
Farm mechanization and oxenization are still far from realisation.<br />
The hand hoe is the common farming tool in the <strong>region</strong>. Major<br />
food crops include cassava, millet and sorghum. Only recently<br />
has maize gained popularity. Cashewnuts is the predominant cash<br />
crop in the <strong>region</strong>. Others are groundnuts and simsim. Livestock<br />
keeping is not traditional among the <strong>region</strong>'s population, hence<br />
contribution of this sector to the <strong>region</strong>'s economy is insignificant.<br />
Prospects for the mining industry in the <strong>region</strong> are great. Various<br />
34
minerals have been identified and exploited on a small scale.<br />
Since 1995 sapphire, christalbella, alexandrite, tourmaline and<br />
rhodolite have been mined in Masasi district.<br />
2.2 Regional GDP and Per Capita GDP:<br />
The <strong>region</strong>'s economy from the point of view of GDP earnings<br />
between the years 1980 and 1994 portrays a gradual but<br />
significant increase (Table II - 1). GDP earnings increased from<br />
T.shs. 1.099 billion in 1980 to T.shs. 62.491 billion in 1994. The<br />
year 1988 registered an exceptionally high increase of over 87<br />
percent in GDP earnings compared to that of the previous year. It<br />
is said that the increase in GDP in the year under mention was<br />
mainly caused by increased production in agricultural, fishing and<br />
mineral sectors. From that year the <strong>region</strong>'s economy was<br />
stimulated and continued to show remarkable increases in GDP<br />
earnings. These earnings came from various production activities<br />
and services. It is noted that the <strong>region</strong>'s average contribution to<br />
the Nation's GDP between 1980 and 1990 had been 3 percent<br />
but increased to 4 percent from 1991 to 1994 (Table II-1).<br />
Mtwara <strong>region</strong> ranks 14th in GDP contribution to the Nation's<br />
economy among the Mainland <strong>region</strong>s as by 1994 (Table II-2).<br />
It is further observed in Table II-1 that Mtwara <strong>region</strong>'s per<br />
Capita GDP at current prices trend over 15 years (1980 - 1994)<br />
indicates increased per capita earnings from T.shs. 1,385 in 1980<br />
to T.shs. 59,533 in 1994. However, when these per capita<br />
annual earnings are considered in terms of the U.S.A. dollar the<br />
picture changes. It is only during the first six years of the 1980s<br />
that the people in Mtwara had comparatively satisfactory<br />
35
purchasing power. The sudden fall of the value of the T.shilling in<br />
1986 and onwards meant the population in the <strong>region</strong> actually<br />
earned 50 - 60 percent less in terms of US dollar than they did in<br />
1982.<br />
TABLE II-I<br />
1980-1994<br />
Year<br />
THE GDP AND PER CAPITA GDP OF MTWARA REGION AT<br />
CURRENT PRICES AND PERCENTAGE CHANGE<br />
G.D.P. at<br />
current<br />
prices TShs<br />
million<br />
%<br />
chang<br />
e<br />
TShs<br />
Per Capita GDP %<br />
chang<br />
e<br />
Excha<br />
nge<br />
rate<br />
U.S.A<br />
.<br />
Dollars<br />
% Ave<br />
contributi<br />
on to<br />
National<br />
GDP<br />
1980 1,099 - 1,385 8.22 168 - 3<br />
1981 1,354 23.20 1,683 8.35 202 20.24 3<br />
1982 1,734 28.06 2,125 9.52 223 10.40 3<br />
1983 1,873 8.02 2,264 12.44 182 -<br />
18.39<br />
1984 2,254 20.34 2,687 18.16 148 -<br />
18.68<br />
3<br />
3<br />
1985 2,890 28.22 3,397 16.50 206 39.19 3<br />
1986 3,886 34.46 4,505 51.70 87 -<br />
57.77<br />
1987 5,198 33.76 5,943 83.70 71 -<br />
18.40<br />
3<br />
3<br />
1988 9,763 87.82 11,002 125.0<br />
0<br />
1989 15,342 57.14 16,812 192.0<br />
0<br />
88 23.94 3<br />
88 0.00 3<br />
36
1990 22,975 49.75 24,481 197.0<br />
0<br />
1991 29,330 27.66 30,390 234.0<br />
0<br />
124 40.91 3<br />
130 4.84 4<br />
1992 37,913 29.26 38,190 335.0<br />
0<br />
1993 49,786 31.32 48,776 480.0<br />
0<br />
114 -<br />
12.31<br />
102 -<br />
10.53<br />
4<br />
4<br />
1994 62,491 25.52 59,533 553.0<br />
0<br />
Ave 16,525.9 16,878.<br />
2<br />
108 5.88 4<br />
136.1 3.27<br />
Source:<br />
Planning Commission, Based on National Accounts of <strong>Tanzania</strong> 1976-1994, 11th Edition August<br />
1995.<br />
Fig. 12 (a): The GDP at current prices (million T.Shs), Mtwara <strong>region</strong> 1980-1994<br />
37
70,000<br />
60,000<br />
50,000<br />
40,000<br />
30,000<br />
20,000<br />
10,000<br />
0<br />
Fig. 12 (b): Per Capita GDP at current prices of Mtwara <strong>region</strong> 1980-1994<br />
60,000<br />
50,000<br />
40,000<br />
30,000<br />
20,000<br />
10,000<br />
0<br />
38
TABLE II:2<br />
Region<br />
AVERAGE ANNUAL REGIONAL GDP CONTRIBUTION<br />
BY PERCENTAGE TO THE NATIONAL GDP 1980-1994<br />
Average Annual<br />
GDP contribution %<br />
GDP contribution<br />
Ranking<br />
Mtwara 3.27 14<br />
Dar es Salaam 20.33 1<br />
Arusha 7.80 2<br />
Mwanza 7.67 3<br />
Mbeya 6,00 4<br />
Shinyanga 5.80 5<br />
Iringa 5.53 6<br />
Tanga 5.52 7<br />
Morogoro 4.67 8<br />
Kagera 4.60 9<br />
Kilimanjaro 3.67 10<br />
Mara 3.47 11<br />
Tabora 3.40 12<br />
Ruvuma 3.33 13<br />
Rukwa 3.13 15<br />
Dodoma 3.07 16<br />
Singida 2.87 17<br />
Kigoma 2.53 18<br />
Lindi 2.00 19<br />
Coast 1.00 20<br />
Total 100.00<br />
39
Source:<br />
Planning Commission Based on National Accounts of <strong>Tanzania</strong> 1976-1994 11th Edition, August<br />
1995.<br />
It is of interest to compare Mtwara <strong>region</strong>'s GDP and per capita<br />
GDP against its neighbouring <strong>region</strong>s of Lindi, Ruvuma, Morogoro<br />
and Coast. These <strong>region</strong>s besides being neighbouring also have<br />
more or less similar agricultural based economies. Table II-3<br />
shows the GDP and Per Capita GDP of each of these neighboring<br />
<strong>region</strong>s between 1980 and 1994. Morogoro <strong>region</strong> shows very<br />
outstanding positive generation of both GDP and Per Capital<br />
GDP during the entire period of 10 years under consideration.<br />
Major contributors to Morogoro <strong>region</strong>s economy are the sugar<br />
estates of Kilombero and Mtibwa. Mtwara <strong>region</strong> ranks second in<br />
<strong>economic</strong> development among these five <strong>region</strong>s. Mtwara's major<br />
contributors is the cashewnut crop which accounts for over 25<br />
percent of the <strong>region</strong>'s economy. Forty percent of the nation's<br />
output of cashewnut comes from Mtwara <strong>region</strong>.<br />
Ruvuma ranks third. Maize is Ruvuma's main <strong>economic</strong> earner<br />
followed by coffee and tobacco. Lindi and Coast <strong>region</strong>s rank<br />
fourth and fifth respectively. Economic bases of these two <strong>region</strong>s<br />
are weak in having no major cash crop sufficiently developed to<br />
have an impact.<br />
Morogoro <strong>region</strong> has other <strong>economic</strong> advantages in that during<br />
the period under discussion it had many operating factories.<br />
Output products and employment generation contributed<br />
enormously to the <strong>economic</strong> growth of the <strong>region</strong>. Mtwara on the<br />
other hand holds the position of the most important<br />
communication centre or transport mode for the whole southern<br />
zone, by having the Port of Mtwara.<br />
40
TABLE II-3<br />
Mtwara<br />
COMPARATIVE GDPs AND PER CAPITA GDPs<br />
FOR MTWARA, RUVUMA, LINDI, MOROGORO<br />
AND COAST AT CURRENT PRICES 1985-1994<br />
Lindi<br />
Ruvuma<br />
Morogoro<br />
Coast<br />
Year<br />
Regioon<br />
Region<br />
Region<br />
Region<br />
Region<br />
GDP<br />
(TShsml.)<br />
Per<br />
capita<br />
GDP<br />
Tshs<br />
GDP<br />
(Tshs<br />
ml.)<br />
Per<br />
capita<br />
GDP<br />
Tshs<br />
GDP<br />
(Tshs<br />
Ml.)<br />
Per<br />
capita<br />
GDP<br />
Tshs<br />
GDP<br />
(Tshs<br />
ml.)<br />
Per<br />
capita<br />
GDP<br />
Tshs<br />
GDP<br />
(Tshs<br />
mil)<br />
Per<br />
capita<br />
GDP<br />
Tshs<br />
1985 2890 3397 1416 2336 3329 4691 4436 3946 1037 1735<br />
1986 3886 4505 1295 2095 3886 5296 5182 4493 1295 2124<br />
1987 5198 5943 7076 11222 9163 12077 6788 5737 1675 2689<br />
1988 9763 11002 13204 20471 17210 22023 11977 9550 3128 4914<br />
1989 15,342 16812 21103 31815 27412 34109 18669 14476 5014 7661<br />
1990 22,975 24481 11153 16350 18063 21856 35881 27054 6637 9860<br />
1991 29,330 30390 13860 19756 22909 26954 44974 32974 8372 12095<br />
1992 37,913 38190 17962 24897 29567 33828 54969 39189 10504 14756<br />
1993 49,786 48776 23299 31404 38638 42985 67846 47034 13312 18183<br />
1994 62,491 59533 29253 38340 48565 52537 88073 59370 17033 22624<br />
Compiled Data: Based on National Accounting of <strong>Tanzania</strong> 1976-1994 11th Edition, August<br />
1995.<br />
41
Fig.13 (a): Comparative GDPs (TShs. mill) Mtwara, Ruvuma, Lindi,<br />
Morogoro and Coast <strong>region</strong>s at current prices 1985-1994<br />
90000<br />
80000<br />
70000<br />
60000<br />
50000<br />
40000<br />
30000<br />
20000<br />
10000<br />
0<br />
1985<br />
1986<br />
1987<br />
1988<br />
1989<br />
1990<br />
1991<br />
1992<br />
1993<br />
1994<br />
Mtwara Lindi Ruvuma Morogoro Coast<br />
Fig.13 (b): Comparative Per Capita GDPs (TShs.) Mtwara, Ruvuma, Lindi,<br />
Morogoro and Coast <strong>region</strong>s at current prices 1985-1994<br />
60000<br />
50000<br />
40000<br />
30000<br />
20000<br />
10000<br />
0<br />
1985<br />
1986<br />
1987<br />
1988<br />
1989<br />
1990<br />
1991<br />
1992<br />
1993<br />
1994<br />
Mtwara Lindi Ruvuma Morogoro Coast<br />
42
2.3 PRODUCTIVE SECTORS<br />
2. 3.1 AGRICULTURE<br />
Agriculture is the predominant <strong>economic</strong> sector in Mtwara <strong>region</strong> .<br />
About 90 per cent of the agricultural output is by small holder<br />
farmers. The main food crops being cassava, sorghum, millet and<br />
with increasing importance maize and paddy. Cashewnut is the<br />
most important cash crop. Sesame and groundnuts also<br />
contribute to the cash income of the peasant farmer. Coconut is<br />
important along the Coast. All these crops are produced over<br />
cultivated land of about 270,300 hectares. The total arable land is<br />
599,500 Ha. (Rolling Plan and Forward Budget 1967/98-<br />
1999/2000) This implies that about 55 percent of the arable land<br />
is not yet exploited.<br />
It is known that about two decades or so ago the <strong>region</strong> had<br />
chronic problem of food deficiency. Considerable food stuff had<br />
to be imported into the <strong>region</strong>. It is for this reason that food<br />
production strategies aimed at increasing food production at the<br />
district levels were formulated with the sole objective of achieving<br />
food sufficiency at the household level throughout the <strong>region</strong>.<br />
These district programmes were:-<br />
ONJAMA of Masasi district aimed at eradicating food deficiency<br />
in the district. TUTUMANE a programme aimed at boosting up<br />
crop production in NewaLa district and KUCHAKUMI was to<br />
create food sufficiency in Mtwara rural district while KIWAMI<br />
was launched to increase food production in Mtwara urban<br />
district. All these programmes succeeded in their objective<br />
43
through mobilisation of households for increased food production.<br />
Not only did food production in these districts increase but there<br />
were reports of decreased severe malnutrition among children<br />
under 5 years.<br />
Food Crops:<br />
Major food crops produced in the <strong>region</strong> include cassava,<br />
sorghum, millet, paddy and maize. Leguminous crops grown<br />
extensively as protein sources are peigon peas, cowpeas,<br />
bambaranuts and groundnuts. However, maize and paddy are<br />
grown in limited areas and quantity. Although a large number of<br />
the population prefer rice and maize as their main food crops, the<br />
<strong>region</strong>al authorities emphasise production of cassava and sorghum<br />
due to their tolerance to drought conditions which sometimes<br />
prevails in the <strong>region</strong>. Table II-4 highlights the general trend of<br />
food production between 1990-1997.<br />
TABLE II-4: MTWARA REGION FOOD CROPS PRODUCTION<br />
IN TONES BY DISTRICTS<br />
Crops 1990/9<br />
1<br />
1991/9<br />
2<br />
1992/9<br />
3<br />
1993/9<br />
4<br />
1994/9<br />
5<br />
1995/9<br />
6<br />
1996/9<br />
7<br />
Cassava 107,00<br />
0<br />
101,41<br />
0<br />
129,41<br />
5<br />
177,31<br />
0<br />
230,14<br />
0<br />
332,70<br />
4<br />
404,46<br />
3<br />
Sorghum 46,290 11,610 90,203 14,000 27,040 52,091 63,823<br />
Maize 28,830 19,650 74,671 15,120 58,130 90,343 106,44<br />
4<br />
Paddy 11,180 15,300 43,592 17,440 33,620 53,612 24,716<br />
Cow/pigeon<br />
peas<br />
20,380 65,880 22,750 34,000 21,210 17,260 30,252<br />
44
Source: Regional Agricultural Development Office, Mtwara 1997<br />
45
Fig. 14: Mtwara Region Food Crops Production in Tones by Districts, 1990/91 -<br />
1996/97<br />
450,000<br />
400,000<br />
350,000<br />
300,000<br />
250,000<br />
Cassava<br />
Sorghum<br />
Maize<br />
Paddy<br />
Cow/pigeon peas<br />
200,000<br />
150,000<br />
100,000<br />
50,000<br />
0<br />
1990/91 1991/92 1992/93 1993/94 1994/95 1995/96 1996/97<br />
Cassava:<br />
Production figures in Table II-4 clearly indicates how the cassava<br />
crop performs in the <strong>region</strong>. Production has increased steadily<br />
from the 1990/91 growing season to 1996/97. This increase in<br />
production is 278 per cent over the period of 7 years. Cassava<br />
constituted about 50 percent of total major food production in<br />
1990/91 and 64 percent in 1996/97. In times of surplus<br />
production of other favoured food crops such as maize surplus,<br />
cassava experience difficulties of getting an attractive market<br />
price. This marketing problem has been experienced by peasant<br />
farmers in the last three growing season. This is partly due to the<br />
introduction of free market system and because of falling prices on<br />
the world market. A proposition of establishing cassava starch<br />
processing plants in the <strong>region</strong> could be of worthwhile<br />
consideration in widening the market for surplus cassava.<br />
46
Sorghum:<br />
Sorghum a drought resistant crop capable of being grown all over<br />
the <strong>region</strong> including areas of marginal rainfall. It takes second<br />
position in importance as a food crop. Inspite of its drought<br />
resistance advantage the crop is not popular with peasants.<br />
Production data of sorghum during the years 1990-1997 indicated<br />
in Table II-4 shows an ups and downs growth pattern. A record<br />
production was experienced back in 1992/93 when about 90,203<br />
tones were realised in the <strong>region</strong>. A year later 1993/94<br />
production of the crop went down to 14,000 tones. This was<br />
close to its lowest level of 11,610 tons in 1991/92. From there<br />
on there has been a remarkable increase in production. it is clear<br />
that combined efforts of increased production of cassava and<br />
sorghum could be the permanent solution to the food crised in the<br />
<strong>region</strong> that tends to reoccur every now and then.<br />
This crop should continue to be campaigned for production as a<br />
hedge food crop in time of failures of other food crops for drought<br />
reasons or insect infestation as in the case of cassava mealy bug.<br />
Maize:<br />
Maize has recently gamed popularity as a food grain in Mtwara<br />
<strong>region</strong>. In table II-4 one observes fluctuating maize production in<br />
the seven years (1990-1997). Maize popularity among the<br />
peasants farmers is gaining momentum. This is in contrast to<br />
sorghum which is declining. It is during the years 1991/92 and<br />
1993/94 only that maize contributed less than 10 percent of total<br />
food crops. During the remaining years shown in Table II-4 maize<br />
47
contributed between 13.5% in 1990/91 and 17% in 1996/97. It<br />
is a common phenomenon that maize has an ever demanding<br />
market in and outside the <strong>region</strong>. However, farmers should be<br />
well advised to blend their maize crop production with cassava<br />
and sorghum for the reasons given earlier.<br />
Paddy:<br />
The conditions in Mtwara <strong>region</strong> are good for paddy production.<br />
The crop can be grown in the fertile river valleys partly flooded<br />
during the rainy season. The crop is increasingly becoming an<br />
important food crop in the <strong>region</strong>. It ranks fourth after cassava,<br />
sorghum and maize. Table II-4 shows a fluctuating production<br />
trend for paddy, between 1990/91 and 1996/97. Paddy<br />
production contributed 10% and 12% of food production in<br />
1992/93 and 1995/96 growing seasons respectively. In other<br />
years paddy contributed between 4% and 9%. It will be through<br />
the development of small scale irrigation that production of paddy<br />
will be speeded up. Therefore the <strong>region</strong> should embark on the<br />
development of potential river valleys for irrigation.<br />
Cow/Pigeon Peas:<br />
Cow peas and pigeon peas are the main pulses of Mtwara <strong>region</strong>.<br />
They are primarily grown for home consumption. Table II-4<br />
shows fluctuating production between 1990/91 and 1996/97.<br />
Generally these pulses have contributed less than 10 percent of<br />
total main food crops. It is only during the year 1991/92 that they<br />
contributed about 30 percent. However, there is a need to<br />
increase production of these pulses for the sake of a balanced<br />
48
diet. Adequate production of pulses which could encourage the<br />
positive trend of reduced severe malnutrition among the under<br />
fives in the <strong>region</strong>.<br />
Food Adequacy:<br />
Mtwara <strong>region</strong> experiences a serious problem of a high number of<br />
under weight babies at birth. Sources from the Ministry of Health<br />
had reported in 1995 that in the <strong>region</strong> out of 23,127 new born<br />
babies weighed, 850 babies had severe under weight (i.e. 60%<br />
below normal) and 4,138 babies were moderately under weight<br />
i.e. between 60% and 80% of normal. The total of 4,988 under<br />
weight babies at birth is equivalent to 22 per cent. This data is a<br />
direct reflection on the nutrition status of the mothers. Proper<br />
nutrition for expectants leads to normal weights of babies at birth.<br />
These mothers lacked adequate protein. It is common<br />
knowledge that Mtwara <strong>region</strong> has a very small livestock<br />
population of 15,046 cattle 84,864 goats and 14,519 sheep<br />
(Livestock Population Census 1984).<br />
Taking Singida <strong>region</strong> for comparison with Mtwara <strong>region</strong> in<br />
respect of children under nutrition at birth, the following interesting<br />
information is revealed.<br />
Parameters<br />
49<br />
Mtwara<br />
Regions<br />
Singida<br />
Population (Projection 1996) 1,005,405 962,000<br />
Livestock Units (1996 Est.) 52,500 1,592,826<br />
Livestock Units per 1000 people 52 1,656<br />
% Babies Severely under weight 3.7 1.2<br />
% Babies Moderately Under weight 17.9 4.1
% Total Under weights 22.0 5.3<br />
Source: Compiled Data: Health Statistics Abstract, 1997.<br />
The above table shows that 22% of children born in Mtwara<br />
<strong>region</strong> are under weight compared to only 5.3 for Singida <strong>region</strong>.<br />
The national average is 9 percent. This is enough evidence to<br />
show that there is no protein adequacy in Mtwara <strong>region</strong>.<br />
Requirements surpass availability. It is important that extra protein<br />
production of either form must be stepped up in the <strong>region</strong>. Since<br />
livestock keeping in the <strong>region</strong> is unaffordable by the majority and<br />
it is not a tradition among the population, the only alternative in the<br />
short run is to encourage production of more pulses than at<br />
present.<br />
Cash Crops:<br />
Major cash crops grown in Mtwara <strong>region</strong> are cashewnuts,<br />
groundnuts and sesame. Table II-5 shows general production<br />
trends of these major cash crops in the <strong>region</strong> between the years<br />
1990/91 and 1995/96.<br />
TABLE II-5: PRODUCTION OF MAJOR CASH CROPS 1990/91<br />
- 1995/96 MTWARA REGION (TONS)<br />
Crop 1990/91 1991/92 1992/93 1993/94 1994/95 1995/96<br />
Cashewnuts 15,209 21,286 17,943 21,834 27,463 49,106<br />
Groundnuts 6,150 21,790 41,220 13,010 12,040 17,771<br />
Sesame 4,020 2,940 7,380 1,860 3,920 10,965<br />
Others (Soya and<br />
Sunflower)<br />
5,270 230 1,948 - 170 95<br />
Total 30,649 46,246 68,491 36,704 43,593 77,937<br />
50
Source: Regional Agricultural Development Office, Mtwara, 1997.<br />
51
Fig. 15: Production of major cash crops 1990/91 - 1995/96 Mtwara <strong>region</strong> (tons)<br />
50,000<br />
45,000<br />
40,000<br />
35,000<br />
30,000<br />
25,000<br />
20,000<br />
15,000<br />
10,000<br />
5,000<br />
0<br />
1990/91 1991/92 1992/93 1993/94 1994/95 1995/96<br />
Cashewnuts Groundnuts Sesame Others (Soya and Sunflower)<br />
Cashewnut:<br />
According to 1992 statistics of export crops, cashewnut<br />
accounted for 11 percent of agricultural commodities exported by<br />
the country. Leading crops were Cotton, Coffee, Tobacco, Tea<br />
and Sisal.<br />
52
Cashew export for 1981 - 1991 were as follows: (Values in<br />
Million U.S. Dollars).<br />
Years: 1981 1982 1983 1984 1985 1986 1987 1988 1989 1990 1991<br />
Million<br />
U.S.A<br />
$<br />
60.4<br />
8<br />
25.5<br />
5<br />
12.9<br />
8<br />
28.8<br />
2<br />
13.4<br />
3<br />
15.7<br />
7<br />
13.9<br />
6<br />
19.4<br />
8<br />
13.7<br />
0<br />
12.2<br />
7<br />
16.7<br />
0<br />
Cashewnut is not only one of the sources of foreign exchange<br />
earnings for the country but it is also a regular source of income<br />
for producers of the crop, all of whom are smallholders.<br />
Cashewnut production in <strong>Tanzania</strong> is primarily produced for<br />
export purposes. A negligible amount of the crop is consumed<br />
domestically.<br />
TABLE II-6: MTWARA REGION CASHEWNUT PRODUCTION<br />
IN TONS BY DISTRICT 1990/91 - 1995/96:<br />
Distric<br />
t<br />
1990/9<br />
1<br />
1991/9<br />
2<br />
1992/9<br />
3<br />
1993/9<br />
4<br />
1994/9<br />
5<br />
1995/9<br />
6<br />
Total %<br />
Newala 8,220 11,764 7,033 10,901 13,754 27,749 79,421 52<br />
Masasi 4,409 5,538 5,960 7,894 10,722 10,319 44,842 29<br />
Mtwara 2,580 3,984 4,950 3,039 2,987 11,038 28,578 19<br />
Total 15,209 21,286 17,943 21,834 27,463 49,106 152,84<br />
1<br />
100<br />
Source: Regional Agricultural Development Office, Mtwara 1997.<br />
53
Fig. 16: Mtwara <strong>region</strong> cashewnut production in tons per district 1990/91 -<br />
1995/96<br />
30,000<br />
25,000<br />
20,000<br />
15,000<br />
10,000<br />
5,000<br />
0<br />
1990/91 1991/92 1992/93 1993/94 1994/95 1995/96<br />
Newala Masasi Mtwara<br />
Table II-5 reveals that cashewnuts is the major cash crop in the<br />
<strong>region</strong>. It constituted an average of 50.9 percent of the total<br />
volume of cash crops raised during 1990/91 to 1995/96.<br />
1992/93 was exceptional in that cashewnut constituted only 26%<br />
of total tonnage of cash crops in the <strong>region</strong>. Groundnuts in the<br />
same year recorded a very impressive figure of 41,220 tons<br />
equivalent to 60 percent of total cash crops grown. Groundnuts<br />
accounted for at least 20 percent of total tonnage of cash crops<br />
between 1990/91 - 1995/96. Sesame, Soya and Sunflower are<br />
also of <strong>economic</strong> importance in the <strong>region</strong>.<br />
It is officially recognised that Mtwara <strong>region</strong> is the main cashewnut<br />
producer in the country. About 50 percent of national production<br />
comes from this <strong>region</strong>. Within the <strong>region</strong> over 50 percent of the<br />
54
cashewnut crop comes from Newala district. Masasi ranks<br />
second with 29% contribution and Mtwara district the least with<br />
an average contribution of 19 percent (Table II-6).<br />
In general production of cashewnut in the <strong>region</strong> has been<br />
increasing since the growing season of 1990/91. A slight drop<br />
was noted in 1992/93.<br />
The increase in the <strong>region</strong>'s production from 8,220 tons in<br />
1990/91 to 27,749 tons in the 1995/96 season is the result of a<br />
sustained and vigorous cashewnut tree improvement campaign.<br />
The campaign focused on judicial use of sulphur as a fungicide<br />
combined with vigorous agricultural husbandry interventions which<br />
rainforced the benefits from sulphur spraying. The Cashewnut<br />
Improvement Programme (CIP) which started in 1990 and ended<br />
in 1996 played a major role in the revival of the cashewnut<br />
industry in the <strong>region</strong>. The programme packages comprised of<br />
cashew research efforts, distribution of improved seed and<br />
seedlings, marketing and availability of cashew inputs, in particular<br />
sulphur and relevant appliances. In this case, annual sulphur<br />
supply increased from 229 tons in 1989/90 to 1382 tons in<br />
1994/95. Distribution of 10 tons of improved seed and 240,038<br />
improved grafted seedlings to farmers between 1992 and 1996<br />
greatly influenced increase of cashewnut output. The <strong>region</strong><br />
however, has still a lot of work ahead to bring up production of<br />
the crop near to or to the levels reached in the early seventies<br />
when marketed/production of 60,000 tons of the crop were<br />
recorded (See Table II-7).<br />
55
Cashewnut had been on decline since 1974/75 to reach low level<br />
of 7,200 tons in 1985/86. This decline is 88 percent fall in<br />
production against that of 1973/74. Cashewnut production<br />
showed positive growth from 1991/92 to 1995/96 at national<br />
level and in Mtwara <strong>region</strong>.<br />
TABLE II-7: MTWARA REGIONAL CASHEWNUT PRODUCTION AS<br />
COMPARED WITH TANZANIA MAINLAND<br />
RODUCTION 1973/74 - 1995/96<br />
Year<br />
<strong>Tanzania</strong><br />
Production (Tons)<br />
Mtwara Region<br />
1973/74 145,000 60,000 41<br />
1974/75 118,947 48,000 40<br />
1975/76 83,734 35,000 42<br />
1976/77 97,652 38,000 39<br />
1977/78 68,383 35,000 51<br />
1978/79 57,006 23,000 40<br />
1979/80 41,510 14,926 36<br />
1980/81 60,942 29,043 48<br />
1981/82 44,539 19,508 44<br />
1982/83 32,352 15,352 47<br />
1983/84 47,960 18,601 39<br />
1984/85 32,815 13,745 42<br />
1985/86 16,548 7,200 44<br />
%<br />
56
1986/87 24,256 12,823 53<br />
1987/88 24,275 12,423 51<br />
1988/89 19,275 11,007 57<br />
1989/90 19,935 8,500 43<br />
1990/91 28,470 14,800 52<br />
1991/92 41,238 22,100 54<br />
1992/93 39,323 17,943 46<br />
1993/94 46,598 23,000 49<br />
1994/95 63,403 27,536 43<br />
1995/96 81,729 49,107 60<br />
Source: Mtwara Regional Commissioner’s Office (1996)<br />
Fig. 17: Mtwara Regional cashewnut production as compared with<br />
<strong>Tanzania</strong> Mainland poduction 1973/74 - 1995/96<br />
160,000<br />
140,000<br />
120,000<br />
<strong>Tanzania</strong> Mainland<br />
Mtwara Region<br />
100,000<br />
80,000<br />
60,000<br />
40,000<br />
20,000<br />
0<br />
1973/74<br />
1975/76<br />
1977/78<br />
1979/80<br />
1981/82<br />
1983/84<br />
1985/86<br />
1987/88<br />
1989/90<br />
1991/92<br />
1993/94<br />
1995/96<br />
57
The same picture of general cashewnut production decline<br />
nationally is observed from Table II-7. Since Mtwara <strong>region</strong> had<br />
been contributing more to national production than any other<br />
single <strong>region</strong>, its poor performance in the years between 1974/75<br />
to 1989/90 directly affected the Mainland's total production.<br />
Poor performance of the cashewnut industry from 1974/75<br />
onward has been explained to be due to three major causes.<br />
These factors combined together to make cashew an unattractive<br />
and unprofitable crop for most farmers. The reasons were:<br />
(i)<br />
(ii)<br />
(iii)<br />
The dramatic spread of Powdery Mildew (Odium<br />
anacardi) which significantly reduced production.<br />
Decline in producer prices as percentage of export parity<br />
price from 70% in the early seventies to 30% in 1987.<br />
The policy of villagization whereby farmers' homes were<br />
reallocated into villages far away from their farms.<br />
TABLE II-8: CASHEWNUT PRODUCTION (TONS) BY MAJOR<br />
PRODUCING REGIONS IN TANZANIA MAINLAND 1991/92 -<br />
1995/96:<br />
Region 1991/9<br />
2<br />
1992/9<br />
3<br />
1993/9<br />
4<br />
1994/9<br />
5<br />
1995/9<br />
6<br />
Total<br />
As % of<br />
Total<br />
Mtwara 22,100 17,943 23,000 27,536 49,107 139,68<br />
6<br />
51.1<br />
Lindi 5,913 7,435 5,944 9,063 11,585 39,940 14.6<br />
Coast 4,163 2,333 7,468 12,200 6,855 33,019 12.1<br />
Tanga 2,246 2,122 2,148 500 978 7,994 2.9<br />
Ruvuma 2,854 5,165 4,981 6,640 7,997 27,637 10.1<br />
D’Salaam 3,840 4,131 3,576 5,864 1,591 19,002 7.0<br />
58
Others 97 194 652 1,000 3,613 6,156 2.2<br />
Total 41,213 39,323 47,769 62,803 81,726 272,83<br />
4<br />
100.0<br />
Source: Ministry of Agriculture, 1997.<br />
Fig. 18: Cashewnut production (tons) by major producing <strong>region</strong>s in <strong>Tanzania</strong><br />
Mainland 1991/92 - 1995/96:<br />
50,000<br />
45,000<br />
40,000<br />
35,000<br />
30,000<br />
25,000<br />
20,000<br />
15,000<br />
10,000<br />
5,000<br />
0<br />
Mtwara Lindi Coast Tanga Ruvuma D’Salaam Others<br />
1991/92 1992/93 1993/94<br />
1994/95 1995/96<br />
The table above tries to compare Mtwara <strong>region</strong> with other major<br />
cashewnut producing <strong>region</strong>s in the country. It is by far the<br />
biggest producer, accounting for 51.1 percent of all cashewnut<br />
produced in the country between 1991/92 to 1995/96. Lindi<br />
59
egion ranks second with 14.6 percent contribution, followed by<br />
Coast, Ruvuma, Dar-es-Salaam and Tanga <strong>region</strong>s in that<br />
descending order.<br />
60
Irrigation:<br />
Irrigation farming in Mtwara <strong>region</strong> is feasible and would greatly<br />
make up for the loss on agricultural production caused by<br />
seasonal and impredictable rainfall. Currently very little<br />
development on irrigation has been undertaken though there exists<br />
several potential irrigable valleys. These are of the Ruvuma river<br />
in Mtwara, Newala and Masasi districts, Mbangala and Mtesei in<br />
Masasi, Mambi in Mtwara and Newala districts and Mbuo in<br />
Mtwara. Lack of capital, appropriate technology and will, stunts<br />
development of the irrigation option.<br />
2.3.2 LIVESTOCK:<br />
The standard of livestock keeping in Mtwara <strong>region</strong> is very low.<br />
For that reason the <strong>region</strong> experiences great deficiency of animal<br />
pterion of livestock origin. The livestock population status<br />
estimated in 1985 is presented in table II-9.<br />
TABLE II-9: ESTIMATED LIVESTOCK POPULATION IN<br />
MTWARA REGION BY DISTRICT 1985:<br />
District Cattle Goats Sheep Pigs Poultry<br />
Mtwara 2,820 14,919 3,382 151 105,965<br />
Newala 2,621 67,947 2,346 186 1,205,353<br />
Masasi 9,022 4,598 7,746 4,252 1,315,722<br />
Total 14,463 88,464 13,470 4,589 2,627,040<br />
Source: Regional Livestock Department records Mtwara <strong>region</strong>, 1985.<br />
61
Fig. 19 (a): Estimated livestock population in Mtwara district, 1985<br />
120,000<br />
100,000<br />
80,000<br />
60,000<br />
40,000<br />
20,000<br />
0<br />
Cattle Goats Sheep Pigs Poultry<br />
Fig. 19 (b): Estimated livestock population in Newala district, 1985<br />
1,400,000<br />
1,200,000<br />
1,000,000<br />
800,000<br />
600,000<br />
400,000<br />
200,000<br />
0<br />
Cattle Goats Sheep Pigs Poultry<br />
62
Fig. 19 (c): Estimated livestock population in Masasi district, 1985<br />
1400000<br />
1200000<br />
1315722<br />
1000000<br />
800000<br />
600000<br />
400000<br />
200000<br />
0 9022 4598 7746 4252<br />
Cattle Goats Sheep Pigs Poultry<br />
General trend of livestock population from 1972 to 1994 is<br />
highlighted in Table II-10.<br />
TABLE II-10: LIVESTOCK POPULATION IN MTWARA<br />
REGION FROM 1972 - 1994 (Estimate)<br />
Year Cattle Goats and Sheep Pigs Poultry<br />
1972 9,540 54,130 1,520 230,600<br />
1985 14,463 88,464 4,589 2,627,040<br />
1994 19,700 164,000 6,000 3,200,000<br />
Source: Compiled Data: Regional Livestock Development Office, Mtwara Region 1997.<br />
There is land available in the <strong>region</strong> for increased cattle keeping<br />
especially in Masasi and Mtwara districts. However, poor animal<br />
husbandry practices among the inhabitants, and common cattle<br />
63
diseases mainly rinderpest and trypanosomiasis due to high tsetse<br />
fly infestation in the <strong>region</strong> have been singled out as possible<br />
causes for poor development of the livestock industry in the<br />
<strong>region</strong>. Goats require little care and for this reason they are more<br />
numerous than cattle especially in Newala district. Pigs are bred<br />
almost exclusively in Masasi district.<br />
The slight increase in population over a period of about 10 years<br />
(table II-10) is credited to the established livestock rearing centres<br />
of Mbawala, Kitere and Nangaramo. The Mtwara Rural<br />
Integrated Project Support (RIPS) greatly contributed to<br />
distribution of goats to the rest of the <strong>region</strong> from its centre in<br />
Newala district. The strategy of the programme was "Loan a goat<br />
and repay a goat to another farmer". By 1994 about 148<br />
participants had benefited from the programme.<br />
It was reported in 1994 that meat consumption in the <strong>region</strong><br />
ranged between 1 - 1.5 kg/annum per head of the population,<br />
while the national average was estimated at 8-9 kgs/annum per<br />
person. Milk too is hardly available to the majority of the people<br />
in the <strong>region</strong>.<br />
The current status of livestock infrastructure in the <strong>region</strong> is not<br />
very clear. However, it was reported earlier in 1985 that there<br />
were a total of 30 dips, 20 crushes and one livestock research<br />
centre.<br />
64
2.3.3 FORESTRY:<br />
About 8.33 percent of <strong>region</strong>al land area of 1,672,000 Ha. is<br />
covered by forest reserves. This is 139,295 Ha. The biggest<br />
proportion of the forest cover in the <strong>region</strong> is in Masasi district. A<br />
total of 130,545 Ha. of forest reserves falls under central<br />
government. This is 93.7%. Another 8,749 Ha. or 6.3% of total<br />
forest reserves is owned by District councils. There are altogether<br />
16 forest reserves in the <strong>region</strong>. Most of them are in Masasi<br />
district.<br />
A large part of forest composition in these forest areas is of<br />
various valuable tree species like Mpingo (Dalbergia melanoxylo),<br />
Mninga (Pterocarpus angolensis) and Mvule (Mellicia excelsa).<br />
These forests are rich in valuable timber but their exploitation has,<br />
been very minimal. However, from an environmental point of<br />
view this low exploitation of forests is a blessing in disguise.<br />
The existing exploitation of forests reserves is carried out by those<br />
dealing in lumbering and wood carving. Generally forest<br />
harvesting in the <strong>region</strong> for charcoal and firewood is carried out in<br />
open woodland areas and other forests outside the reserves.<br />
Table II-11 shows revenue collected from forest products<br />
referred above.<br />
65
TABLE II-11: REVENUE COLLECTED FROM FOREST PRODUCTS IN<br />
MTWARA REGION 1992 - 1997:<br />
Year<br />
Timber Volume Cubic<br />
Meters<br />
Value T.shs.<br />
1992/93 486.50 3,266,752<br />
1993/94 326.80 1,238,637<br />
1994/95 406.85 3,684,143<br />
1995/96 416.00 7,420,019<br />
1996/97 180.65 7,170,895<br />
Total 1,816.80 22,780,446<br />
Source: Mtwara Regional Forest Office, 1997.<br />
Fig. 20(a): Timber Volume Cubic Meters produced, Mtwara <strong>region</strong> 1992/93 -<br />
1996/97<br />
500<br />
450<br />
400<br />
350<br />
300<br />
250<br />
200<br />
150<br />
100<br />
50<br />
0<br />
1992/93 1993/94 1994/95 1995/96 1996/97<br />
66
Fig. 20(b): Revenue collected from forests in Tshs. Mtwara <strong>region</strong> 1992/93 -<br />
1996/97<br />
8,000,000<br />
7,000,000<br />
6,000,000<br />
5,000,000<br />
4,000,000<br />
3,000,000<br />
2,000,000<br />
1,000,000<br />
0<br />
1992/93 1993/94 1994/95 1995/96 1996/97<br />
The table reflects the low value of timber in 1992/93 through<br />
1994/95. The year 1995/96 - 1996/97 experienced better prices<br />
for timber and especially so in 1996/97. Still the government<br />
earned very little revenue from the resource compared to what lies<br />
untapped.<br />
Demand for forest products in the <strong>region</strong> mainly firewood,<br />
charcoal, building poles and timber is more than what the <strong>region</strong><br />
can give out without replacement. This demand for wood<br />
products will continue to rise every year as the population<br />
increases and particularly so as long as shifting agriculture remains<br />
in favour. Some programmes have already started appearing on<br />
the scene. The <strong>region</strong> has been implementing for same years a<br />
programme of tree planting or establishment of community<br />
woodlots. These in essence are meant to meet the daily fuelwood<br />
requirements for the community and for other uses. The general<br />
trend towards implementing this objective is indicated in Table II-<br />
12.<br />
67
TABLE II-12: MTWARA REGION AFFORESTATION<br />
PROGRAMME 1992/93 - 1996/97:<br />
Year<br />
Tree Seedling<br />
Production<br />
Planted Area (Ha.)<br />
Target<br />
Actual<br />
1992/93 500,000 422,800 248.7<br />
1993/94 350,000 292,000 171.8<br />
1994/95 75,000 65,934 38.8<br />
1995/96 20,000 18,057 10.6<br />
1996/97 300,000 259,000 152.4<br />
Total 1,245,000 1,057,791 622.3<br />
Source: Regional Forest Office, Mtwara 1997.<br />
It is appreciated that some positive action is being taken to<br />
mitigate the end result of deforestation. But the pace appears to<br />
be too far behind the speed of destruction. For instance it took 5<br />
growing seasons to establish 622.3 Ha. and by the same logic it<br />
means it would take 29 years to establish 18,250 Ha. deforested<br />
in 1988.<br />
In this case, Mtwara <strong>region</strong> is required to take measures of<br />
planting more tree woodlots at both community and household<br />
levels. At the same time continue dermacating and reserving more<br />
forest reserves and up keeping the present reserves by preventing<br />
encroachment in these areas.<br />
68
2.3.4 FISHERY:<br />
Mtwara Coastline stretches from the Ruvuma River in the South<br />
to the Lindi <strong>region</strong> border, a distance of about 125 km. The area<br />
is characterised by a narrow continental shelf extending to no<br />
more than 8 km offshore. Fishing in the <strong>region</strong> has been carried<br />
out along this coast entirely at traditional subsistence level. To<br />
some extent there has been fishing activities along the |Ruvuma<br />
river, in the inland lakes (Kitere and Chidya) and in some ponds<br />
constructed by individual villages. The amount of fish landed per<br />
head per year in Mtwara <strong>region</strong> remains very small indeed, at 2<br />
kgs. The national average amount of landed fish is 12 kgs.<br />
During the past decade or so, returns from fishing have declined<br />
because resources close to the coast have been over exploited.<br />
Fishing can only be profitably carried out in the high seas where<br />
artisanal fishermen cannot reach.<br />
In 1993 about 2,500 fishermen in about 19 villages along the<br />
Indian Ocean coastline were engaged in fishing. The fishing<br />
industry mainly along the coast not only provides the population<br />
with food (protein and fats) but also generates employment and<br />
income. Table II-13 shows returns of fish landed by artisan<br />
fishermen.<br />
69
TABLE II-13: SALES IN TONS AND VALUE OF FISH CATCH LANDED<br />
BY ARTISAN FISHERMEN, MTWARA REGION 1991 - 1996:<br />
Year Amount of Fish (M.Tons) Value T.Shs.<br />
1991/92 13,143.99 1,147,789,440<br />
1992/93 15,423.57 1,807,536,737<br />
1993/94 16,194.75 2,711,314,624<br />
1994/95 587.90 141,604,780<br />
1995/96 589.90 141,694,700<br />
Total 45,940.11 6,239,939,281<br />
Source: Regional Natural Resources Office, Mtwara, 1997.<br />
Fig. 21 (a): Sales in tons of fish catch landed by Artisan Fishermen, Mtwara Region<br />
1991 - 1996<br />
18000<br />
16000<br />
14000<br />
12000<br />
10000<br />
8000<br />
6000<br />
4000<br />
2000<br />
0<br />
1991/92 1992/93 1993/94 1994/95 1995/96<br />
70
Fig. 21 (b): Value of fish (T.Shs.) catch landed by Artisan Fishermen, Mtwara Region<br />
1991 - 1996<br />
3,000,000,000<br />
2,500,000,000<br />
2,000,000,000<br />
1,500,000,000<br />
1,000,000,000<br />
500,000,000<br />
0<br />
1991/92 1992/93 1993/94 1994/95 1995/96<br />
The value of landed fish is very modest considering the number of<br />
fishermen involved. There is a need for them to improve their<br />
fishing gear so as to maximise returns of their labour. Inefficient<br />
fishing gear have encouraged many fishermen in the area to resort<br />
to dynamite fishing. This is a very destructive way of fishing since<br />
it destroys the marine breeding environment.<br />
Table II-14 shows revenue to central government earned from<br />
exported sea products.<br />
71
TABLE II-14: SEA PRODUCTS EXPORTED FROM MTWARA<br />
REGION 1991/92 - 1995/96:<br />
Year<br />
Amount of Sea Products<br />
(Metric Tones)<br />
Value T.Shs.<br />
1991/92 189,676 253,800,900<br />
1992/93 212,156 482,744,000<br />
1993/94 77,737 145,154,000<br />
1994/95 79,104 348,439,500<br />
1995/96 66,467 211,055,000<br />
Total 624,140 1,441,183,400<br />
Issued Licenses 10,550,928<br />
Grand Total 1,451,734,328<br />
Source: Regional Natural Resources Office, Mtwara, 1997.<br />
Fig. 22:<br />
Amount of Sea Products (Metric Tones) Exported from Mtwara <strong>region</strong><br />
1991/92 - 1995/96<br />
250,000<br />
200,000<br />
150,000<br />
100,000<br />
50,000<br />
0<br />
1991/92 1992/93 1993/94 1994/95 1995/96<br />
72
Most of the sea products which were exported included fish,<br />
prawns, shells, crustacea, shark fins and jaws.<br />
The fishing industry in the <strong>region</strong> has not performed significantly in<br />
contributing to the <strong>region</strong>s economy. It has contributed less than 1<br />
percent of <strong>region</strong>al annual GDP. Efforts already started and being<br />
implemented by RIPS through provision of credit facilities to<br />
fishermen should be expanded to enable more fishermen benefit<br />
from the facility. It is through this way artisan fishermen would be<br />
able to moderately modernise their fishing methods and improve<br />
their fish catch as a result. Furthermore, in order to increase<br />
supply of protein for up country districts in the <strong>region</strong> more fishponds<br />
could be encouraged, coupled with proper management<br />
techniques imparted to the farmers through demonstrations of<br />
properly managed fish-farms.<br />
2.3.5 WILDLIFE:<br />
About 3.91 percent of <strong>region</strong>al land area or 65,450 hectares is<br />
covered by two game reserves. These are Msanjesi (44,425 Ha.)<br />
and Lukwika/Lumesule (21,025 Ha) both of which are in Masasi<br />
district. The reserves contain a reasonable number of wild animals<br />
including elephants, lions, leopards, greater kudu, zebra, water<br />
bucks, sable antelope, wildebeest, impala, buffaloes, wild dogs<br />
and pig species. Also aquatic animals exist in Ruvuma river like<br />
hippos and crocodiles. Notwithstanding the abundance in wild<br />
life, these areas are still under utilised as tourist attractions. Gains<br />
to the <strong>region</strong>al economy through tourism hunting, game viewing<br />
and photography is very insignificant. Table II-15 shows the little<br />
government revenue collections from recovered trophies.<br />
73
TABLE II-15: REVENUE FROM RECOVERED GOVERNMENT TROPHIES<br />
IN MTWARA REGION 1991/92 - 1995/96:<br />
Year<br />
Number of<br />
Government<br />
Trophies<br />
Weight in Kgs.<br />
Value in T.shs.<br />
1991/92 189 124.4 5,228,390<br />
1992/93 98 89.2 1,957,600<br />
1993/94 111 66.5 1,605,000<br />
1994/95 160 150.0 2,722,000<br />
1995/96 134 73.3 1,597,000<br />
Source: Regional Natural Resources Office, 1997.<br />
2.3.6 BEEKEEPING:<br />
Because of many nectar yielding plant species including woodland<br />
miombos the potential for beekeeping in Mtwara <strong>region</strong> is good.<br />
Furthermore, the yielding period is long as cashewnut trees start<br />
flowering early in the dry season. Beekeepers in the <strong>region</strong> have<br />
more traditional beehives than modern ones. (See Table II-16).<br />
TABLE II-16: NUMBER AND TYPES OF BEEHIVES IN MTWARA<br />
REGION 1991/92 - 1993/94:<br />
Year Traditional Beehives Modern Beehives<br />
1991/92 12,000 440<br />
1993/94 17,500 800<br />
Source: Regional Natural Resources Office, Mtwara, 1996.<br />
74
TABLE II-17:<br />
BEEKEEPING PRODUCTS AND VALUE, MTWARA REGION<br />
1991 - 1996:<br />
Year Honey (Kgs) Value T.shs. Beewax (Kgs) Value T.shs.<br />
1991 10,130 5,005,000 12,218 14,661,000<br />
1992 48,600 24,300,000 15,172 18,206,400<br />
1993 135,820 67,910,000 21,914 21,914,000<br />
1994 124,012 124,012,000 8,210 9,852,000<br />
1995 11,008 1,108,000 12,924 19,386,000<br />
1996 25,210 29,976,000 21,246 38,299,200<br />
Total 354,780 252,311,000 91,684 122,319,200<br />
Source: Regional Natural Resources Office, Mtwara, 1997.<br />
Fig. 23 (a): Beekeeping Products (Kgs), Mtwara Region 1991 - 1996:<br />
140,000<br />
120,000<br />
100,000<br />
80,000<br />
60,000<br />
40,000<br />
20,000<br />
0<br />
1991 1992 1993 1994 1995 1996<br />
Honey (Kgs)<br />
Beewax (Kgs)<br />
75
Fig. 23 (b): Beekeeping Value (T.Shs), Mtwara Region 1991 - 1996:<br />
140,000,000<br />
120,000,000<br />
100,000,000<br />
80,000,000<br />
60,000,000<br />
40,000,000<br />
20,000,000<br />
0<br />
1991 1992 1993 1994 1995 1996<br />
Honey Value T.shs.<br />
Beeswax Value T.shs.<br />
Table II-17 show the trend in incomes generated from sale of<br />
honey and beewax from 1991 - 1996. The year 1993 recorded<br />
the highest total weight of 135,820 Kgs. of honey sold. In terms<br />
of income accrued from honey sales, the year 1994 was the best.<br />
It appears in that year honey commanded a better price per<br />
kilogram than the previous year.<br />
Decline in sales of honey during the period 1995 to 1996 lacks a<br />
clear explanation. But surprisingly it was during these two<br />
declining years the <strong>region</strong> realised the highest sales of beewax<br />
totalling T.sh. 57,685,200. Beekeeping if taken seriously through<br />
use of better beehives and better management could significantly<br />
add to household incomes and provide a much needed<br />
employment outlet.<br />
76
2.3.7 MINING:<br />
The Southern Geological Zone Office in Mtwara has established<br />
that Mtwara <strong>region</strong> has potential in two major minerals. These are<br />
coral stones and gemstone.<br />
Coral stone is excavated along the Indian Ocean shoreline in<br />
Mtwara district for the production of lime which is mainly used in<br />
house construction.<br />
Gemstone is located at specific areas in the <strong>region</strong>. Important<br />
gemstones found in the <strong>region</strong> are shown in Table II-18.<br />
TABLE II-18: MINERAL DEPOSITS IN MTWARA REGION, 1997:<br />
District<br />
Minerals<br />
Newala<br />
Tandahimba<br />
Masasi<br />
Rhodolite, Sapphire, Amethyst and Red Garnets<br />
Sapphire, Tourmaline, Red Garnets, Graphite<br />
Red Garnets, Sapphire, Marble, Chrysoberyl,<br />
Alexandrite, Tourmaline and Rhodolite.<br />
Source: Southern Geological Zone Office, Mtwara, 1997.<br />
Potentials of these minerals in the <strong>region</strong> has attracted a<br />
reasonable number of dealers from inside and outside the <strong>region</strong><br />
and some foreign nationals. Exploration has not been done as<br />
thoroughly as it should be for this reason exploitation of these<br />
resources is still minimal. Authorities in the <strong>region</strong> also point out<br />
that low mining has been associated with inferior mining<br />
equipment. In 1996, a total of 21 Master Gemstone dealers were<br />
77
licensed to mine minerals in the <strong>region</strong> but, hardly 50 percent of<br />
them have so far managed to carry out mining allegedly because of<br />
a lack of proper mining equipment.<br />
The Government has taken steps to ensure that mining, selling and<br />
exports of precious stones are conducted according to<br />
regulations. By December 1996, 21 shops for Master Dealers<br />
and Lapidary had been opened and 37,466.97 grams of various<br />
precious stones worth T.shs. 72,333,660 had gone through the<br />
market. By 1997 50,514.11 grams of precious stones worth<br />
T.shs. 113,164,600 were marketed in the <strong>region</strong>.<br />
2.3.8 INDUSTRIES:<br />
There is at present very little industrial activities going on in the<br />
<strong>region</strong> apart from some small scale industries. The one time<br />
operating industries all being agro-based industries are faced with<br />
enormous operating problems. These are the five cashewnut<br />
processing and two sisal processing industries. The cashewnut<br />
industries were established in the late seventies but hardly any one<br />
performed as expected mainly because of capital liquidity.<br />
These cashewnut industries are in the process of being privatised.<br />
However, the sisal processing plants are operating though at<br />
below capacities. The low price of sisal fibre in the world market<br />
is the main reason behind poor performance of the sisal industry in<br />
general .<br />
78
3.0 SOCIAL SERVICES:<br />
3.1 EDUCATION:<br />
3.1.1 Pre-School Education:<br />
SECTION III<br />
It is only in recent years that pre-school education has gained<br />
popularity. There were only 50 nursery school in 1994 but by<br />
1996 this had increased to 117 schools. So that it is estimated<br />
more than 10% of eligible 5 to 6 years old attended pre-schools in<br />
1996. According to Table III-1 the balance between sexes is<br />
almost 50:50. The average number of pupils per class is 51 to the<br />
<strong>region</strong> and varies only slightly between districts. On the other<br />
hand the average number of pupils per teacher varies a lot. The<br />
<strong>region</strong>al average of 83 is high.<br />
TABLE III-1:<br />
District<br />
NUMBER AND ENROLMENT AT PRE-SCHOOL CENTRES,<br />
BY DISTRICT AND SEX, MTWARA REGION 1996:<br />
Pre-<br />
School<br />
Centres<br />
Number of Pupils<br />
Boys Girls Total<br />
Pupils<br />
per<br />
Centre<br />
Mtwara/Mikindani 10 255 212 467 47<br />
Mtwara Rural 20 488 516 1004 50<br />
Masasi 37 1139 1215 2354 64<br />
Newala 50 1040 1053 2093 42<br />
Total 117 2922 2996 5918 51<br />
79
Source: Mtwara Regional Education Office (1997)<br />
Fig. 24: Number of pupils at Pre-School Centres by district and sex, Mtwara <strong>region</strong><br />
1996<br />
1400<br />
1200<br />
1000<br />
800<br />
600<br />
400<br />
200<br />
0<br />
Mtwara/Mikindani Mtwara Rural Masasi Newala<br />
Boys<br />
Girls<br />
TABLE III-2:<br />
District<br />
Mtwara/Mikindan<br />
i<br />
THE PUPIL/TEACHER RATIO, BY DISTRICT, MTWARA<br />
REGION PRE-SCHOOL EDUCATION, 1996:<br />
Number of<br />
Teachers<br />
Number of<br />
Pupils<br />
Average Number of<br />
Pupils per Teacher<br />
11 467 42<br />
Mtwara Rural 4 1,004 251<br />
Masasi 18 2,354 131<br />
Newala 38 2,093 55<br />
Total 71 5,918 83<br />
Source: Regional Education Officer, Mtwara, 1997.<br />
80
Mtwara/Mikindani has a reasonable ratio of 42. Newala too is<br />
not bad. But the figures of 131 and 251 for Masasi and Mtwara<br />
Rural respectively are far too high.<br />
Fig. 25: Average number of pupils per teacher by district,<br />
Mtwara <strong>region</strong> Pre-school education, 1996<br />
Newala<br />
Masasi<br />
Mtwara Rural<br />
Mtwara/Mikindani<br />
0 50 100 150 200 250 300<br />
3.1.2 Primary School Education:<br />
3.1.2.1 Enrolment:<br />
The history of primary school education in Mtwara <strong>region</strong> is one<br />
of commendable development. In 1974/75 the <strong>region</strong> had 371<br />
schools. By 1996 the number of schools had increased to 493.<br />
The total enrollment increased from 74,790 in 1974/75 to<br />
141,167 in 1996. See Table III-3. The total enrollment in 1985<br />
was 119,964 pupils.<br />
81
TABLE III-3:<br />
District<br />
NUMBER AND ENROLMENT IN PRIMARY SCHOOLS,<br />
MTWARA REGION, 1974/75 AND 1996:<br />
Number of<br />
Schools<br />
Enrolment Total<br />
Average Pupils per<br />
School<br />
1974/75 1996 1974/75 1996 1974/7<br />
5<br />
1996<br />
Mtwara/Miki<br />
ndani<br />
- 19 - 10,461 - 551<br />
Mtwara Rural - 82 11,740* 19,785 - 241<br />
Masasi - 193 34,110 61,573 - 319<br />
Newala** - 199 28,940 49,348 - 248<br />
Total 371 493 74,790 141,16<br />
7<br />
202 286<br />
* Included Mtwara/Mikindani district<br />
** Included Tandahimba district.<br />
Source: : Mtwara Regional Integrated Development Plan 1975 - 1980, Vol.I.<br />
: Regional Education Office, Mtwara, 1997.<br />
Fig. 26: Total enrolment in primary schools by district, Mtwara <strong>region</strong> 1974/75<br />
and 1996<br />
82
70000<br />
60000<br />
50000<br />
40000<br />
30000<br />
20000<br />
10000<br />
0<br />
Mtwara /<br />
Mikindani<br />
Mtwara<br />
Rural<br />
Masasi<br />
Newala**<br />
1974/75<br />
1996<br />
The average number of pupils per school has increased from 202<br />
in 1975 to 286 in 1996 which is consistent with trends in other<br />
<strong>region</strong>s. The larger number of pupils per school in the urban<br />
district of Mtwara/Mikindani is again in tune with the rest of the<br />
country.<br />
The trend in terms of classrooms is encouraging in that this shows<br />
slight improvement from an average of 50 pupils per classroom to<br />
48. However, 61% of the classrooms quoted for 1996 were of a<br />
temporary nature.<br />
TABLE III-4: NUMBER OF CLASSROOMS AND EMOLUMENT IN<br />
PRIMARY SCHOOLS, BY DISTRICT, MTWARA REGION<br />
1974/75 AND 1996:<br />
District<br />
Number of<br />
Classrooms<br />
Total Enrolment<br />
Average Pupils<br />
per Classroom<br />
1974/75 1996 1974/75 1996 1974/7<br />
5<br />
1996<br />
83
Mtwara/Mikindani - 164 - 10,461 - 64<br />
Mtwara Rural 292* 443 11,740* 19,785 40 45<br />
Masasi 634 1,159 34,110 61,573 54 53<br />
Newala** 559 1,172 28,940 49,348 52 42<br />
Total 1,485 2,938 74,790 141,167 50 48<br />
* Included Mtwara/Mikindani district<br />
** Included Tandahimba district<br />
Source: : Mtwara Regional Integrated Development Plan 1975 - 1980 Vol. I.<br />
: Regional Education Office, Mtwara, 1997.<br />
84
Fig. 27:<br />
70000<br />
Total emolument in primary schools by district, Mtwara<br />
<strong>region</strong> 1974/75 and 1996:<br />
60000<br />
50000<br />
40000<br />
30000<br />
1974/75<br />
1996<br />
20000<br />
10000<br />
0<br />
Mtwara /<br />
Mikindani<br />
Mtwara<br />
Rural<br />
Masasi<br />
Newala<br />
In 1996 the number of boys enrolled into primary schools was<br />
more or else equal to that of boys. See Table III-5. According<br />
to Table III-6 the <strong>region</strong> had 4,231 streams in 1996 giving an<br />
average of 33 pupils per stream. The differences between<br />
districts are not great. The Mtwara Regional Integrated<br />
Development Plan 1975 - 1980 quotes 1,796 streams for<br />
1974/75 thus giving a <strong>region</strong>al average of pupils per stream of 42.<br />
Therefore 1996 showed an improvement.<br />
85
TABLE III-5: ENROLMENT IN PRIMARY SCHOOLS, BY SEX<br />
AND BY DISTRICT, MTWARA REGION, 1996:<br />
District<br />
Enrolment to Std. I<br />
Boys Girls Total % Girls<br />
Mtwara/Mikindani 1,051 1,014 2,065 49.1<br />
Mtwara Rural 1,582 1,431 3,013 47.5<br />
Masasi 4,865 5,119 9,984 51.3<br />
*Newala 4,044 3,899 7,943 49.1<br />
Total 11,542 11,463 23,005 49.8<br />
* Included Tandahimba District.<br />
Source: Regional Education Office, Mtwara, 1997.<br />
Fig. 28: Enrolment to Std I in primary schools by district<br />
and sex, Mtwara Region, 1996:<br />
6,000<br />
5,000<br />
4,000<br />
Boys<br />
Girls<br />
3,000<br />
2,000<br />
1,000<br />
0<br />
Mtwara/<br />
Mikindani<br />
Mtwara<br />
Rural<br />
Masasi<br />
*Newala<br />
86
TABLE III-6:<br />
NUMBER OF STREAMS IN PRIMARY SCHOOLS, BY<br />
DISTRICT, MTWARA REGION 1996<br />
District Total Enrolment Number of<br />
Streams<br />
Pupils per<br />
stream<br />
Mtwara/Mikindani 10,461 245 43<br />
Mtwara Rural 19,785 591 33<br />
Masasi 61,573 1872 33<br />
Newala* 49,348 1523 32<br />
Total 141,167 4231 33<br />
Source: Regional Education office, Mtwara 1990<br />
* Included Tandahimba<br />
In 1974/75 the number of children of the school going age group<br />
(7 to 14 yrs) who were not attending school was 59,000 through<br />
that year's total enrolment was 74,790.<br />
1.2.2 Primary School Dropouts:<br />
Regional authorities reveal that dropouts are a problem in this<br />
<strong>region</strong> as elsewhere in <strong>Tanzania</strong>. The dropout percentage was as<br />
follows in recent years.<br />
1993 - 2.3%<br />
1994 - 2.1%<br />
1995 - 1.2%<br />
1996 - 2.4%<br />
87
TABLE III-7: PRIMARY SCHOOL DROPOUTS BY DISTRICT<br />
AND SEX, MTWARA REGION, 1996<br />
District Boys Girls Total<br />
Mtwara/Mikindani 1 5 6<br />
Mtwara Rural 290 192 482<br />
Masasi 146 120 266<br />
Newala* 477 330 807<br />
Total 914 647 1561<br />
* Included Tandahimba district<br />
Source: Regional Education office, Mtwara, 1997<br />
Fig. 29: Primary school dropouts by district and sex, Mtwara <strong>region</strong>, 1996<br />
500<br />
450<br />
400<br />
350<br />
300<br />
250<br />
200<br />
150<br />
100<br />
50<br />
0<br />
Mtwara/<br />
Mikindani<br />
Boys<br />
Girls<br />
Mtwara<br />
Rural<br />
Masasi<br />
Newala*<br />
Table II-7 show that for 1996 girls accounted for 41% of all<br />
dropouts while boys were responsible for 59%. According to<br />
Ministry of Education and Culture national headquarters truancy<br />
accounted for 77.5% of all dropouts followed by pregnancies at<br />
88
10.2%. Death and other causes accounted for 6.3% and 6.0%<br />
respectively. See Table III-8.<br />
TABLE III-8: REASONS FOR DROPOUTS BY SEX, MTWARA<br />
REGION, PRIMARY SCHOOLS 1995<br />
Cause<br />
Number of Dropouts<br />
Boys Girls Total<br />
% of Total<br />
Truancy 1820 831 2651 77.5<br />
Pregnancy 0 349 349 10.2<br />
Death 126 88 214 6.3<br />
Others 113 93 206 6.0<br />
Total 2059 1361 3420 100<br />
Source: Ministry of Education and Culture, Dar es Salaam July 1996.<br />
Fig. 30: Reasons for dropouts in primary schools by sex, Mtwara <strong>region</strong>, 1995<br />
89
2000<br />
900<br />
1800<br />
800<br />
1600<br />
700<br />
1400<br />
600<br />
1200<br />
500<br />
1000<br />
400<br />
800<br />
600<br />
300<br />
400<br />
200<br />
200<br />
100<br />
Boys 0<br />
0<br />
Truancy<br />
Pregnancy<br />
Death<br />
Others<br />
Girls<br />
Boys<br />
Girls<br />
90
1.2.3 Primary School Teachers:<br />
An adequate supply of teachers of adequate quality is one of the<br />
essentials of a successful primary education system. In 1974/75<br />
the <strong>region</strong> had 1,191 teachers of all grades. The requirement of<br />
grade IIIA teacher in 1996 was 2,198 but only 1374 or 62.5% of<br />
the requirements were available. Grade IIIB teachers<br />
requirements were 2,466 while there were actually 2,681 teachers<br />
which makes a surplus of 215. Table III-9 demonstrates this.<br />
TABLE III-9 REQUIREMENTS AND AVAILABILITY OF PRIMARY<br />
SCHOOL TEACHERS BY GRADE AND BY DISTRICT,<br />
MTWARA REGION 1996<br />
District<br />
Requirements Availability Deficit/Excess<br />
IIIA IIIB Total IIIA IIIB Total IIIA IIIB<br />
Mtwara/Mi<br />
kindani<br />
Mtwara<br />
Rural<br />
156 144 300 158 183 341 +2 +39<br />
321 304 625 204 365 569 -117 +61<br />
Masasi 903 1,11<br />
6<br />
2,019 491 1,071 1,562 -412 -45<br />
Newala 818 902 1,720 521 1,062 1,583 -297 +160<br />
Total 2,19<br />
8<br />
2,46<br />
6<br />
4,664 1,374 2,681 4,055 -824 +215<br />
Source: Regional Education office, Mtwara 1997.<br />
As expected the urban district of Mtwara/Mikindani showed a<br />
surplus of teachers of all grades. All the rural districts had a<br />
deficit. But the situation is not so bad when viewed in terms of<br />
91
pupils per teacher. The ratio is not drastically different between<br />
the urban district and the rural districts, except for Masasi. See<br />
Table III-10. The <strong>region</strong>al average number of pupils per teacher<br />
for 1996 is 35. It was 63 in 1974/75. This is a dramatic<br />
improvement.<br />
TABLE III-10: THE NUMBER OF PUPILS PER<br />
TEACHER, BY DISTRICT, MTWARA REGION<br />
1996:<br />
District<br />
Total<br />
Enrolment<br />
Total number of<br />
Teachers<br />
Number of pupils<br />
per teacher<br />
Mtwara/Mikindan<br />
i<br />
10,461 341 31<br />
Mtwara Rural 19,785 569 35<br />
Masasi 61,573 1,562 39<br />
Newala 49,348 1,583 31<br />
Total 141,167 4055 35<br />
Source: Regional Education Office, Mtwara 1997.<br />
2.4 Primary education Infrastructure:<br />
Classrooms are a key ingredient in primary education. Mtwara<br />
residents and authorities have done some work in the construction<br />
of classrooms. But if temporary classrooms are excluded, the<br />
<strong>region</strong> has only reached 32% of the <strong>region</strong>al target for permanent<br />
classrooms. The situation is particularly acute in the rural districts<br />
of Mtwara Rural, Masasi and Newala.<br />
92
TABLE III-11:<br />
District<br />
PRIMARY EDUCATION CLASSROOM REQUIREMENTS AND<br />
AVAILABILITY BY DISTRICT, MTWARA REGION 1996<br />
Requirement<br />
s<br />
Available<br />
Deficit of Permanent classrooms<br />
Permanent Temporary Total Number %<br />
Mtwara/Mikindani 192 138 26 164 54 28<br />
Mtwara Rural 511 212 231 443 299 59<br />
Masasi 1,572 510 649 1,159 1,062 68<br />
Newala* 1,322 296 876 1,172 1,026 78<br />
Total 3,597 1,156 1,782 2,938 2,441 68<br />
* Included Tandahimba<br />
Source: Regional education office, Mtwara 1997<br />
Classrooms are not the only area where physical facilities are<br />
inadequate. According to the <strong>region</strong>al authorities the construction<br />
of “permanent "pit latrines as toilets for pupils is behind by 91%,<br />
cupboards by 78%, tables by 67%, desks by 54% and chairs by<br />
50%. See Table III-12.<br />
TABLE III-12:<br />
THE NUMBER OF TOILETS AND AMOUNT OF FURNITURE<br />
IN PRIMARY SCHOOLS, MTWARA REGION 1995:<br />
Forestry Requirements Actual Shortage % Shortage<br />
Toilets 5,125 458 4,667 91<br />
Desks 76,778 35,089 41,689 54<br />
Tables 12,997 4,281 8,716 67<br />
Chairs 9,904 4,930 4,974 50<br />
Cupboards 4,880 1,058 3,822 78<br />
Source: Ministry of Education and Culture Report, 1995.<br />
94
The above are not the only areas of concern. Teachers' houses<br />
are also important for primary education efficiency and teacher<br />
morale. This area is probably the one area where very little has<br />
been done. Newala district shows an appalling deficit of 81<br />
percent. The other three district score a deficit which is much<br />
worse. It is 90 percent or higher. See Table III-3.<br />
TABLE III-3: TEACHERS' HOUSES IN PRIMARY SCHOOLS,<br />
BY DISTRICT, MTWARA REGION, 1996:<br />
District<br />
Requirement<br />
Available<br />
Deficit of Permanent<br />
Permanent Temporary Total No % Deficit<br />
Mtwara/Mikinda<br />
ni<br />
228 22 27 49 206 90<br />
Mtwara Rural 562 56 202 258 506 90<br />
Masasi 2019 161 768 929 1858 92<br />
Newala 1694 324 343 667 1370 81<br />
Total 4503 563 1340 1903 3940 87<br />
* Included Tandahimba district.<br />
Source: Regional Education Office, Mtwara, 1997.<br />
3.1.2.5 Comparative Status of Primary Education in Mtwara Region:<br />
It is interesting to compare the performance of districts in terms of<br />
the number of schools and total emolument relative to the district's<br />
population. At 1,639 people per primary school Newala shows<br />
to be the best covered district particularly when you consider the<br />
figure of 151 pupil per 1,000 population. There are probably<br />
relatively more children avoiding attending primary schools in<br />
95
Mtwara/Mikindani and Mtwara Rural districts than in the other<br />
two districts of Newala and Masasi.<br />
TABLE III-14:<br />
District<br />
POPULATION COVERAGE BY PRIMARY SCHOOLS AND<br />
PRIMARY SCHOOL ENROLMENT, BY DISTRICT, MTWARA<br />
REGION, 1996:<br />
Total<br />
Population<br />
Number<br />
of<br />
Schools<br />
Total<br />
Enrolmen<br />
t<br />
Population<br />
per School<br />
Pupils per<br />
1,000<br />
Population<br />
Mtwara/Miki<br />
ndani<br />
103,815 19 10,461 5,464 101<br />
Mtwara Rural 190,962 82 19,785 2,329 104<br />
Newala* 326,207 199 49,348 1,639 151<br />
Masasi 384,421 193 61,573 1,992 160<br />
Total 1,005,405 493 141,167 2,039 140<br />
* Included Tandahimba district.<br />
Source: Compiled from data supplied by Regional Education Office.<br />
Both Mtwara/Mikindani and Mtwara Rural have the worst<br />
coverage per school and the lowest number of pupils per 1,000<br />
population.<br />
96
TABLE III-15: PRIMARY EDUCATION IN MTWARA<br />
REGION AND IN SELECTED REGIONS 1996:<br />
Region<br />
Populati<br />
on per<br />
School<br />
Pupils<br />
per 1000<br />
People<br />
Pupils<br />
per<br />
School<br />
Pupils<br />
per<br />
Classroo<br />
m<br />
Pupils<br />
per<br />
Teacher<br />
Pupils<br />
per<br />
Stream<br />
Mtwara 2,039 140 286 48 35 33<br />
Mwanza 2,671 144 385 85 45 NA<br />
Lindi 2,757 109 299 52 22 37<br />
Singida 2,710 139 378 77 38 NA<br />
Mbeya 1,800 190 342 NA 37 NA<br />
Dodoma 2,839 132 375 77 35 38<br />
Shinyanga 2,473 139 344 197 56 38<br />
Iringa 2,024 162 327 47 37 NA<br />
Rukwa 2,467 125 308 59 34 NA<br />
Morogoro 2,387 134 319 66 35 35<br />
Source:<br />
Regional Socio-Economic Profile of Mwanza, Lindi, Singida, Mbeya, Dodoma,<br />
Shinyanga, Iringa, Rukwa, Morogoro.<br />
A comparison of the status of primary education between selected<br />
<strong>region</strong>s shows up some interesting facts. For example when<br />
Mwanza is compared to Mtwara, Mwanza schools are<br />
overcrowded but proportionately slightly more children in the<br />
community in Mwanza go to school than in Mtwara. Lindi<br />
schools are also comparatively overcrowded compare to Mtwara<br />
even fewer pupils in the community to school. But surprisingly<br />
Lindi has lots of teachers compared to the number of pupils.<br />
Compared to Mtwara both Shinyanga and Singida have very<br />
97
overcrowded schools but proportionately the same number of<br />
children go to school in the three <strong>region</strong>s. Mbeya has<br />
proportionately more schools in communities than Mtwara. But<br />
because a high proportion of school age children go to school,<br />
such schools are overcrowded when compared to Mtwara.<br />
Dodoma, Rukwa, Morogoro are like Lindi when compared to<br />
Mtwara. But the number of teachers relative to pupils is the same<br />
as in Mtwara. Although Iringa like Mbeya has many schools<br />
relative to the population it ends up to the same degree of<br />
overcrowding as Mtwara. This is because proportionately many<br />
more children of school going age attend schools.<br />
Looking at the ten <strong>region</strong>s a child has a better chance for quality<br />
education in the <strong>region</strong>s of Mtwara, Lindi, Rukwa and Morogoro<br />
<strong>region</strong>s. When it comes to assessing the chances of that child to<br />
go school at all, the child has better chances in Mbeya, Iringa,<br />
Mwanza, Singida and Shinyanga <strong>region</strong>s.<br />
3.1.2.6 Special Primary Schools<br />
Mtwara <strong>region</strong> has taken the lead in <strong>Tanzania</strong> in establishing<br />
primary schools to cater for the special needs of disabled children.<br />
These children have as much right to education as other children.<br />
Disabilities catered for are:<br />
- deafness<br />
- blindness<br />
- mental retardation<br />
- leprosy<br />
98
Distribution of such schools are given in table III-16 with Masasi<br />
district having the best coverage.<br />
TABLE III-16 SPECIAL PRIMARY SCHOOLS FOR THE DISABLED, BY<br />
DISTRICT, MTWARA REGION 1996<br />
District Name of School Type of Disability<br />
Mtwara/Mikindani Shangani Mental retardation<br />
Newala Luchingu Mental retardation<br />
Masasi<br />
Lulindi<br />
Mwena<br />
Masasi<br />
Migongo<br />
Lukuledi<br />
Mangaka<br />
Ndanda<br />
Mental retardation<br />
Leprosy<br />
Blindness<br />
Mental retardation<br />
Deafness<br />
Mental retardation<br />
Mental retardation<br />
Source: Regional Education Office, Mtwara 1997<br />
3.1.3. Adult Education<br />
Mtwara <strong>region</strong> ranks 13th among 19 position. Therefore, there is<br />
still much to be done to catch up with other <strong>region</strong>s let alone<br />
eradicate illiteracy. But it can be said with some pride that<br />
Mtwara has come a long way to reach 57.1% literacy. The rate<br />
was a mere 28% in 1967. See Table III-19<br />
99
TABLE III-17 PERCENTAGE OF LITERACY FOR POPULATION AGED<br />
10 YEARS AND ABOVE IN MTWARA REGION COMPARED<br />
TO OTHER REGIONS IN THE LAST THREE CENSUSES<br />
Region 1967<br />
Census<br />
1978<br />
Census<br />
100<br />
1988<br />
Census<br />
Ranking<br />
Mtwara 28 51.4 57.1 13<br />
Kilimanjaro 56 74.1 80.8 1<br />
D’Salaam 60 73.3 80.7 1<br />
Ruvuma 41 66.3 70.5 2<br />
Tanga 40 60.6 66.0 4<br />
Morogoro 37 58.6 62.8 6<br />
Mara 35 56.4 63.9 5<br />
Iringa 31 54.0 68.3 3<br />
kagera 40 52.9 59.5 8<br />
Dodoma 24 49.5 55.5 14<br />
Mbeya 29 49.2 61.9 7<br />
Rukwa - 48.5 58.6 9<br />
Lindi - 48.4 53.8 16<br />
Singida 24 46.7 57.4 11<br />
Mwanza 25 44.3 57.3 12<br />
Coast 26 44.0 51.1 17<br />
Kigoma 19 43.7 55.1 15<br />
Arusha 26 41.9 58.1 10<br />
Tabora 27 40.5 50.5 18<br />
Shinyanga 16 33.2 48.3 19
Source: 1988 Population census<br />
The 1988 census also revealed that urban population tend to be<br />
more literate than rural populations in the <strong>region</strong>. Males also tend<br />
to be more literate than females. But unlike some <strong>region</strong>s the rate<br />
of literacy for rural males was higher than that of urban females.<br />
See table III-18<br />
TABLE III-18<br />
LITERACY RATE FOR RURAL AND URBAN POPULATIONS<br />
OF 10 YEARS AND ABOVE IN MTWARA REGION<br />
COMPARED TO OTHER REGIONS IN TANZANIA 1988<br />
CENSUS<br />
Region Male Female<br />
Rural Urban Total Rural Urban Total<br />
Mtwara 65.5 77.9 67.3 46.3 61.6 48.5<br />
Mbeya 69.9 87.5 73.3 48.4 70.4 58.5<br />
Mara 73.7 88.0 75.3 53.7 71.5 55.6<br />
Dodoma 61.5 85.4 64.3 45.1 73.7 48.2<br />
Arusha 61.5 91.8 65.6 46.4 82.8 50.9<br />
Kilimanjaro 84.5 90.3 85.5 75.7 83.6 76.9<br />
Tanga 72.8 88.6 75.9 53.2 75.6 57.3<br />
Morogoro 68.8 86.4 72.9 49.5 72.0 54.6<br />
Coast 60.1 72.2 64.0 40.1 51.8 44.9<br />
DSM 68.4 90.0 87.9 48.0 77.7 74.6<br />
Lindi 62.4 75.9 64.6 42.0 60.2 44.8<br />
Ruvuma 77.7 87.6 78.7 61.4 75.7 63.3<br />
Iringa 80.1 87.4 84.9 57.2 70.4 58.5<br />
101
Mwanza 63.7 83.7 67.6 43.4 66.9 47.8<br />
Kagera 68.0 84.4 69.0 49.7 72.4 50.9<br />
Shinyanga 57.9 85.9 59.9 36.2 67.7 39.3<br />
Singida 65.0 85.5 66.8 47.2 70.8 49.3<br />
Rukwa 69.1 84.3 71.3 43.9 66.4 47.3<br />
Kigoma 65.1 83.1 67.4 43.1 62.7 45.5<br />
Source: 1988 Population Census<br />
The process of adult illiteracy eradication is an arduous one. It<br />
involves the identification of illiterates, persuasion and motivation.<br />
It involves identification of teachers, place and times for classes.<br />
It involves supervision, registration, examinations and even after<br />
literacy is attained, follow up exercises to ensure literates remain<br />
literate.<br />
Table III-19 reveals a portion of this process to give an idea of<br />
the immensity of dropouts between registration and the passing of<br />
terminal literacy tests. For example in 1981 some 150,373<br />
people registered but only 28,046 attained literacy i.e. 19% of<br />
those who registered or 21.8% of those who were examined.<br />
TABLE III-19 NUMBER OF ILLITERATES REGISTERED EXAMINED AND<br />
PASSED, MTWARA REGION, 1975-1992 (SELECTED YEARS)<br />
Registered Examined Pass<br />
Year Male Female Total Male Female Total %<br />
Examined<br />
102<br />
Male Female Total %<br />
Passed<br />
1975 103669 97556 201225 76500 97138 173638 86.3 23609 18930 42539 24.5<br />
1977 61991 78453 140444 36074 40174 76248 54.3 11365 8115 19480 25.5<br />
1981 57879 92494 150373 49600 79121 128721 85.6 16168 11878 28046 21.8<br />
1983 45811 71344 117155 38559 61802 100361 85.7 22409 29134 51543 51.4<br />
1986 28587 49065 77652 27607 47455 75062 96.7 21876 37741 59617 79.4
1992 38954 57485 96439 15999 24953 40952 42.5 6575 7808 14383 35.1<br />
Source: Regional Education Office, Mtwara, (1997).<br />
Fig. 31: Number of illiterates Registered, Examined and Passed,<br />
Mtwara Region, 1975-1992 (Selected Years)<br />
250000<br />
200000<br />
150000<br />
100000<br />
50000<br />
0<br />
1975 1977 1981 1983 1986 1992<br />
Total Registered Total Examined Total Passed<br />
Table III-20 shows the kind of distribution of attendances at<br />
literacy classes by sex and also by district. Females outnumber<br />
males in attending classes. Mtwara rural and Masasi have the<br />
most candidates.<br />
TABLE III-20 ATTENDANCE AT ADULT EDUCATION CLASSES,<br />
MTWARA REGION, DECEMBER 1995 BY DISTRICT<br />
District<br />
Attendance<br />
Male Female Total %<br />
Mtwara/Mikindani 603 1286 1889 37.0<br />
Mtwara Rural 4019 5062 9081 31.8<br />
Masasi 4244 5117 9361 18.0<br />
103
Newala/Tandahimba 1577 2850 4427 31.0<br />
Total 10443 14315 24758 23.8<br />
Source: Regional Education Office, Mtwara, (1997).<br />
Fig. 32: Attendance at Adult Education Classes,Mtwara Region, December 1995 By<br />
District<br />
6000<br />
5000<br />
4000<br />
3000<br />
2000<br />
Male<br />
Female<br />
1000<br />
0<br />
Mtwara /<br />
Mikindani<br />
Mtwara<br />
Rural<br />
Masasi<br />
Newala /<br />
Tandahimba<br />
Mtwara <strong>region</strong> boasted of 492 adult education centres in 1995<br />
with 2612 classes and 3,583 teachers. Such recent figures on<br />
adult literacy should of course be taken with caution. See Table<br />
III-21.<br />
TABLE III-21: DISTRIBUTION OF ADULT EDUCATION CENTRES<br />
CLASSES, TEACHER AND CURRICULUM CENTRES, BY<br />
DISTRICT, MTWARA REGION, 1995<br />
District Centres Classes<br />
Primar<br />
y<br />
School<br />
No. of Teachers<br />
Volunte<br />
ers<br />
Curriculum Centres<br />
Total Old New Total<br />
Mtwara<br />
(U)<br />
19 23 19 5 24 4 10 14<br />
104
Mtwara<br />
(R)<br />
82 752 296 377 673 13 10 23<br />
Masasi 187 1336 561 775 1336 6 4 10<br />
Newala/T<br />
andahimb<br />
a<br />
204 501 1047 50 1550 19 10 29<br />
Total 492 2612 1925 1658 3583 42 34 76<br />
Source: Regional Education Office, Mtwara, (1997).<br />
1.4 Secondary School Education:<br />
In 1996 primary school pupils who were examined for Form I<br />
entry were 11,415. Out of these 1,045 were duly selected which<br />
is 9.2% of the number of examinees. Sexwise 9.0% of the boys<br />
were selected and 9.3% of the girl examinees were also selected.<br />
Mtwara/Mikindani, which is an urban district, had the best<br />
selection ratio of 18.6%. See Table III-22.<br />
TABLE III-22: SELECTION FOR FORM I, BY SEX AND<br />
DISTRICT, MTWARA REGION, 1996:<br />
District Examinees Non Examinees Selected<br />
Boys Girls Total Boys Girls Total Boys Girls Total<br />
No. %<br />
Mtwara/Mi<br />
kindani<br />
Mtwara<br />
Rural<br />
480 553 1,033 1 1 2 104 88 192 18.6<br />
718 668 1,386 11 8 19 56 57 113 8.2<br />
Masasi 2,150 2,546 4,696 25 26 51 186 194 380 8.1<br />
Newala* 2,051 2,249 4,300 42 61 103 140 220 360 8.4<br />
Total 5,399 6,016 11,415 79 96 175 486 559 1,045 9.2<br />
* Includes Tandahimba district.<br />
Source: Regional Education Office, Mtwara, 1997.<br />
105
106
Fig. 33 (a): Examinees for Form I by district and sex, Mtwara <strong>region</strong>, 1996<br />
3000<br />
2500<br />
Boys<br />
Girls<br />
2000<br />
1500<br />
1000<br />
500<br />
0<br />
Mtwara/Mi<br />
kindani<br />
Mtwara<br />
Rural<br />
Masasi<br />
Newala*<br />
Fig. 33 (b): Selected for Form I by di strict and sex, Mtwara <strong>region</strong>, 1996<br />
250<br />
200<br />
Boys<br />
Girls<br />
150<br />
100<br />
50<br />
0<br />
Mtwara/Mi<br />
kindani<br />
Mtwara<br />
Rural<br />
Masasi<br />
Newala*<br />
About 20% of the Secondary Education schools and streams are<br />
private. The <strong>region</strong> has a total of 13 school and 124 streams.<br />
Given an estimated population of 991,323 for 1995 there is one<br />
secondary school for every 76,256 people. This ratio is<br />
107
unsatisfactorily high. It is borne out by the low figure of secondary<br />
school pupils per 10,000 population.<br />
TABLE III-23: NUMBER OF SCHOOLS AND STREAMS IN SECONDARY<br />
SCHOOL, BY LEVEL AND OWNERSHIP, MTWARA REGION,<br />
1995:<br />
Ownershi<br />
p<br />
Number<br />
Schools<br />
of<br />
Streams<br />
I II III IV V VI TOTAL<br />
Public 10 24 22 22 22 4 4 98<br />
Private 3 7 7 6 6 0 0 26<br />
Total 13 31 29 28 28 4 4 124<br />
Source: Basic Statistics in Education, Regional Data, 1995.<br />
TABLE III-24:<br />
Owner<br />
ship<br />
This is 42.0 ordinary level students and 1.6 advanced level<br />
students. See Table III-24 and III-25. The average number of<br />
pupils per stream is satisfactory. It is 36 for ordinary level and 20<br />
for advanced level.<br />
ENROLMENT IN SECONDARY SCHOOLS BY SEX, LEVEL<br />
AND OWNERSHIP, MTWARA REGION, 1995:<br />
I II III IV V VI<br />
Forms<br />
Boys<br />
Form I - IV<br />
Girl<br />
s<br />
Tota<br />
l<br />
Boy<br />
s<br />
Form V - VI<br />
Girl<br />
s<br />
Tota<br />
l<br />
Public 870 837 797 712 87 75 1,65<br />
4<br />
1,56<br />
2<br />
3,21<br />
6<br />
95 67 162<br />
Privat<br />
e<br />
244 254 204 225 0 0 473 454 927 0 0 0<br />
108
Total 1,11<br />
4<br />
1,09<br />
1<br />
1,00<br />
1<br />
937 87 75 2,12<br />
7<br />
2,01<br />
6<br />
4,14<br />
3<br />
95 67 162<br />
Source: Basic Statistics in Education, Regional Data, 1995.<br />
109
Fig. 34(a): Enrolment in secondary schools by ownership, Mtwara <strong>region</strong>, 1995:<br />
900<br />
800<br />
700<br />
600<br />
500<br />
400<br />
300<br />
200<br />
100<br />
0<br />
I II III IV V VI<br />
Public<br />
Private<br />
Fig. 34 (b):<br />
2000<br />
1500<br />
1000<br />
Enrolment in secondary schools (Form I - IV) by ownership and sex,<br />
Mtwara <strong>region</strong>, 1995<br />
500<br />
Boys<br />
Girls<br />
0<br />
Public<br />
Private<br />
Fig. 34 (c):<br />
Enrolment in secondary schools (Form V - VI) by ownership and<br />
sex, Mtwara <strong>region</strong>, 1995<br />
110
100<br />
80<br />
60<br />
Boys<br />
Girls<br />
40<br />
20<br />
0<br />
Public<br />
Private<br />
TABLE III-25: PUPILS PER STREAM AND PUPILS PER 10,000<br />
POPULATION, MTWARA REGION, 1995:<br />
Level<br />
Population<br />
(Est.)<br />
Total<br />
Enrolment<br />
Streams<br />
Pupils per<br />
Stream<br />
Pupils per<br />
10,000<br />
people<br />
Form I-IV 991,323 4,143 116 36 42.0<br />
Form V-VI 991,323 162 8 20 1.6<br />
Source: Compiled from Regional Education Office Data, Mtwara, 1997.<br />
Looking at Table III-26 the number of teachers in public<br />
secondary schools in 209 while that of private schools is 32. This<br />
works out at 16 pupils and 29 pupils per teacher for public and<br />
private secondary schools respectively. The private sector ratio is<br />
unsatisfactory.<br />
TABLE III-26: SECONDARY SCHOOL TEACHERS BY SEX,<br />
QUALIFICATION AND SCHOOL OWNERSHIP, MTWARA<br />
REGION, 1995:<br />
Teachers'<br />
Qualifications<br />
Male<br />
Public<br />
Femal<br />
e<br />
Private<br />
Total Male Femal<br />
e<br />
Total<br />
BSc. (Ed.) 10 8 18 0 0 0<br />
111
BSc. (Gen.) 1 0 1 1 0 1<br />
BA (Ed.) 6 3 9 1 0 1<br />
BA (Gen.) 0 1 1 0 0 0<br />
Dip. Science 64 21 85 5 0 5<br />
Dip. Arts 76 12 88 5 0 5<br />
Grade A 5 0 5 2 0 2<br />
Others 2 0 2 18 0 18<br />
Total 164 45 209 32 0 32<br />
Source: Basic Statistics in Education, Regional Data, 1995.<br />
3.2 HEALTH<br />
3.2.1 Introduction<br />
Although the three enemies of development: poverty, ignorance<br />
and disease are still with the <strong>region</strong>, a start has been made to<br />
eradicate them. The <strong>region</strong>'s GDP per capita of Tshs 59,533 for<br />
1994 is on the high side by <strong>Tanzania</strong> standards. Mtwara's 57.1%<br />
literacy by 1988 in middling by <strong>Tanzania</strong> standards. The status of<br />
the health of the <strong>region</strong>'s residents on the other hand judged by<br />
Life Expectancy (the ultimate health indicator) is not so good even<br />
by national standards.<br />
The health sector in Mtwara <strong>region</strong> is faced by a variety of basic<br />
problems which work against the development of a healthy and<br />
productive population. Poor communications, poor water<br />
supplies, poverty, poorly run health services and malnutrition are<br />
only some of the factors contributing towards ill-health. The<br />
112
elative isolation of the <strong>region</strong> from development centres in the<br />
north has also under developed the <strong>region</strong> and consequently its<br />
ability to deliver good health services.<br />
3.2.2 Morbidity and Mortality<br />
The decline in the economy nationwide in the eighties and nineties<br />
was reflected in the health sector by deterioration in the<br />
maintenance of health infrastructure, inadequate and unreliable<br />
supply of drugs. Consequently there has been widespread<br />
lowering of morale among health workers. The impact of all these<br />
factors has been an increase in the <strong>region</strong>'s morbidity and mortality<br />
from diseases.<br />
The ten most common causes of morbidity are shown in Table III-<br />
27<br />
TABLE III-27<br />
THE TEN MOST COMMON CAUSES OF MORBIDITY<br />
AS A PERCENTAGE OF CASES, MTWARA REGION 1991<br />
Disease<br />
% of all<br />
cases<br />
Ranking<br />
Malaria 26.0 1<br />
Diarrhoea 8.6 2<br />
Eye diseases 7.2 3<br />
Upper respiratory tract<br />
infections<br />
6.6 4<br />
Pneumonia 5.1 5<br />
Accidents 3.1 6<br />
Skin diseases 2.5 7<br />
113
Intestinal worms 1.6 8<br />
Gonorrhea 1.4 9<br />
Anaemia 1.3 10<br />
Other diagnoses 15.4 -<br />
Il defined symptoms 21.2 -<br />
Total 100 -<br />
Source: Regional Ministry of health Office, Mtwara 1997<br />
On the ten most common causes of illness the main culprits are in<br />
order of importances: Malaria, diarrhoea and upper respiratory<br />
tract infections.<br />
114
TABLE III-28<br />
Diseases<br />
THE NUMBER OF CASES OF MOST IMPORTANT REPORTED<br />
CAUSES OF MORBIDITY AND MORTALITY, MTWARA REGION<br />
1995 AND 1996<br />
Reported<br />
cases<br />
Report<br />
ed<br />
deaths<br />
Top 10<br />
ranking<br />
1995 1996 1995 1996 1995 1996<br />
Malaria 236,673 236,713 850 271 1 1<br />
Diarrhoea 41,844 211,441 124 124 5 2<br />
Bloody<br />
Dysentery<br />
1,210 20,286 33 41 - 8<br />
Measles 42 33 0 0 - -<br />
Intestinal<br />
Worms<br />
20,225 33,189 0 0 6 6<br />
Skins Diseases 45,415 134,347 0 0 4 4<br />
Gonorrhoea 13,395 26,039 0 0 7 7<br />
ARI 71,157 45,958 0 0 2 5<br />
Schistosomiasis 10,181 10,443 0 0 9 9<br />
Eye Disease 46,930 139,626 0 0 3 3<br />
Syphilis 11,996 0 0 0 8 -<br />
Meningitis 1,082 803 158 165 10 10<br />
Typhoid 8 0 0 0 - -<br />
AIDS 311 142 0 78 - -<br />
TB 1,592 137 0 99 - -<br />
Source: Taarifa ya Huduma za Afya Kinga Mkoa wa Mtwara, 1996<br />
According to Table III-28 the list of the ten most important causes of<br />
illness had changed to some extent between 1991 and 1996. Anaemia<br />
and accidents were no longer among the top ten. Their place was taken<br />
over by meningitis, syphilis and bloody dysentery.<br />
115
Communicable diseases form a different class of diseases which tend to<br />
come and go. But when in existence spread quick sometimes manage to<br />
reach epidemic proportions. Table III 29 and III-30 show the situation<br />
with respect to 1994 and 1995.<br />
TABLE III-29 DISTRIBUTION OF COMMUNICABLE DISEASE CASES IN<br />
MTWARA AND NEIGHBORING REGIONS, 1994 and 1995<br />
Region Cholera Meningitis Dysentery Rabies Plague<br />
1994 1995 1994 1995 1994 1995 1994 1995 1994 1995<br />
Mtwara 33 0 191 1065 993 560 14 23 0 0<br />
Lindi 129 0 657 343 238 187 0 0 0 0<br />
Ruvuma 0 0 15 114 159 179 1 121 0 0<br />
Iringa 0 0 11 18 4,19<br />
7<br />
147 0 50 0 0<br />
Morogor<br />
o<br />
0 0 99 177 586 77 267 134 0 0<br />
Coast 0 0 0 14 2,25<br />
0<br />
DSM 3 11 0 1,86<br />
7<br />
304 0 87 0 0<br />
0 2 1 0 0<br />
Source: Health Statistics Abstract, 1997<br />
TABLE III-30 DISTRIBUTION OF DEATHS CAUSED BY COMMUNICABLE<br />
DISEASES IN MTWARA AND NEIGHBORING REGIONS, 1994<br />
AND 1995<br />
Region Cholera Meningitis Dysentery Rabies Plague<br />
1994 1995 1994 1995 1994 1995 1994 1995 1994 1994<br />
Mtwara 1 0 17 139 34 20 0 1 0 0<br />
Lindi 7 0 68 39 5 0 0 0 0 0<br />
Ruvuma 0 0 1 29 12 4 1 4 0 0<br />
116
Iringa 0 0 5 4 10 0 0 0 0 0<br />
Morogor<br />
o<br />
0 0 9 9 12 1 21 2 0 0<br />
Coast 0 0 0 3 23 8 0 1 0 0<br />
DSM 2 0 0 0 15 0 0 1 0 0<br />
Source: Health Statistics Abstract, 1997<br />
TABLE III-31<br />
The tables show that for Mtwara <strong>region</strong> the major communicable<br />
disease problems were meningitis and dysentry. In fact the <strong>region</strong><br />
accounted for most of the meningitis cases and deaths in 1995<br />
among the neighbours. Among the seven neighboring <strong>region</strong>s<br />
Mtwara accounted for 42% of all fatalities from the communicable<br />
diseases in the two years. Mtwara was then a high risk <strong>region</strong>.<br />
Aids, Tuberculosis and leprosy are the <strong>region</strong>s added health<br />
hazards.<br />
On top of the above problems, young children have to contend<br />
with measles, pertussis, diphtheria, tetanus and polio. Malnutrition<br />
is the ever present underlying cause which exacerbates the risks<br />
from these diseases. Table III-3 shows just how serious was<br />
measles in Mtwara and its neighboring <strong>region</strong>s. At number 4<br />
ranking Mtwara is a medium risk <strong>region</strong> among the seven<br />
neighbours, at least for 1992, 1993 and 1994.<br />
DISTRIBUTION OF REPORTED CASES OF MEASLES IN<br />
MTWARA AND NEIGHBORING REGIONS 1992-1994<br />
Region Number of Cases Ranking<br />
1992 1993 1994 Total<br />
Mtwara 232 819 222 1,273 4<br />
117
Lindi 98 770 37 905 7<br />
Ruvuma 1,379 497 208 2,084 2<br />
Iringa 811 1,367 1,283 3,461 1<br />
Morogoro 672 660 154 1,486 3<br />
Coast 238 702 98 1,038 6<br />
Dar-es-<br />
Salaam<br />
437 725 66 1,228 5<br />
Source: Health Statistics Abstract, 1997<br />
3.2.3 Health Facilities<br />
The distribution of health facilities between districts is shown in<br />
Table III-32. The majority of facilities are in Newala and Masasi<br />
which districts also have the largest populations. Distribution by<br />
ownership is a Table III-33. The pace of privatisation of the health<br />
delivery system is very slow in the <strong>region</strong> compared to the rest of<br />
the country.<br />
TABLE III-32 DISTRIBUTION OF HEALTH FACILITIES, BY DISTRICT<br />
MTWARA REGION 1996<br />
District Hospitals Health<br />
centres<br />
Dispensarie<br />
s<br />
MCH Clinics<br />
Mtwara/Mikindani 1 0 17 11<br />
Mtwara Rural 0 4 28 33<br />
Newala* 1 6 39 46<br />
Masasi 2 4 42 43<br />
Total 4 14 126 133<br />
118
* Included tandahimba district<br />
Source: Regional Ministry of Health office, Mtwara 1997<br />
The coverage of the <strong>region</strong>'s population by the existing health<br />
facilities as shown in Tables III-34 and III-35 show improvement<br />
over the corresponding values given by the 1978 population<br />
census.<br />
119
TABLE III-33<br />
Facility<br />
DISTRIBUTION OF HEALTH FACILITIES BY<br />
OWNERSHIP, MTWARA REGION 1996<br />
Ownership<br />
Public private Total<br />
Hospitals 3 1 4<br />
Health Centres 12 2 14<br />
Dispensaries 108 18 126<br />
Source: Regional Ministry of Health office, Mtwara 1992<br />
Whereas in 1996 the population per dispensary was 7,979 it was<br />
8,039 in 1978. In 1978 the average population per hospital bed<br />
in the <strong>region</strong> was 844, this had improved to 690 by 1996. The<br />
number of dispensaries had increased by 31% from 96 to 126.<br />
Likewise the number of hospital beds increased by 50% from 914<br />
to 1457. Districtwise both Masasi and Newala are poorly<br />
covered compared to the other two districts.<br />
TABLE III-34: POPULATION COVERAGE OF HOSPITALS AND<br />
DISPENSARIES BY DISTRICT, MTWARA REGION, 1996<br />
District Pop 1996<br />
(Est)<br />
Number of<br />
hospitals<br />
Pop per<br />
hospital<br />
Number of<br />
Dispensarie<br />
s<br />
Pop per<br />
Dispensary<br />
Mtwara/Miki<br />
ndani<br />
103,815 1 103,815 17 6,107<br />
Mtwara Rural 190,962 0 0 28 6,820<br />
Newala* 326,207 1 326,207 39 8,364<br />
Masasi 384,421 2 192,211 42 9,153<br />
Total 1005,405 4 251,351 126 7.979<br />
* Included Tandahimba<br />
120
Source:<br />
Compiled from data supplied by Ministry of Health and 1988 Population Census<br />
121
TABLE III-35: DISTRIBUTION OF HOSPITAL/HEALTH CENTRE BEDS AND<br />
POPULATION COVERAGE OF HEALTH FACILITIES MTWARA REGION<br />
1996<br />
District Pop 1996<br />
(Est)<br />
No of<br />
hospital/<br />
H.C.<br />
Beds<br />
No of<br />
Health<br />
facilities<br />
Populati<br />
on per<br />
bed<br />
Populati<br />
on per<br />
facility<br />
Facilities<br />
per<br />
10,000<br />
people<br />
Mtwara/M<br />
ikindani<br />
103,815 n.a 18 n.a 5,768 1.7<br />
Mtwara<br />
Rural<br />
190,962 n.a 32 n.a 5,968 1.7<br />
Newala* 326,207 n.a 46 n.a 7,091 1.4<br />
Masasi 384,421 n.a. 48 n.a 8,009 1.2<br />
Total 1,005,405 1457 144 690 6982 1.4<br />
* Included :Tandahimba district<br />
Note: :Health Facilities are hospitals, health Centres and dispensaries<br />
Source: :Compiled from 1988 Population Census and Table III-32<br />
:Health Statistics Abstract, 1997,<br />
According to covered population per bed in Table III-36 Mtwara<br />
<strong>region</strong> is the best served after Ruvuma and Kilimanjaro, However<br />
when viewed in terms of the number of health facilities is not so<br />
well endowed. It ranks 16 th . It is only better provided for than<br />
Mwanza, Kagera, Tabora and Shinyanga<br />
122
TABLE III-36 NUMBER OF POPULATION PER BED BY REGION 1995<br />
Region Pop 1995 (Est) Number of beds Pop per bed Ranking<br />
Mtwara 991,801 1,457 681 3<br />
Arusha 1,776,799 1,535 1,158 16<br />
Coast 737,178 795 927 13<br />
DSM 1,856,661 2,141 867 10<br />
Dodoma 1,487,139 1,711 869 11<br />
Iringa 1,460,498 2,005 728 5<br />
Kagera 1,641,104 2,074 791 8<br />
Kigoma 1,030,691 832 1,239 18<br />
K'njaro 1,556,928 2,289 680 2<br />
Lindi 741,479 980 757 7<br />
Mara 1,232,112 1,072 1,149 15<br />
Mbeya 1,759,814 1,854 949 14<br />
Morogoro 1,475,604 2,088 707 4<br />
Mwanza 2,351,233 2,867 820 9<br />
Rukwa 996,903 861 1,158 17<br />
Ruvuma 987,223 1,635 604 1<br />
Shinyanga 2,225,069 1,537 1,448 20<br />
Singida 961,038 696 1,381 19<br />
Tabora 1,214,073 1,322 918 12<br />
Tanga 1,457,756 1,935 753 6<br />
Total 27,941,103 31,686 882 -<br />
Source: Health Statistics Abstract, 1997.<br />
123
TABLE III-37:<br />
Region<br />
POPULATION PER HEALTH FACILITY AND NUMBER OF HEALTH<br />
FACILITIES PER 10,000 POPULATION BY REGION, 1995:<br />
Population Number of Population Number of<br />
Estimate Health per Facility Facilities Rankin<br />
1995 Facilities<br />
Per 10,000 g<br />
Pop.<br />
Mtwara 991,801 139 7,135 1.4 16<br />
Arusha 1,776,799 285 6,234 1.6 14<br />
Coast 737,178 192 3,839 2.6 1<br />
DSM 1,856,661 430 4,318 2.3 3<br />
Dodoma 1,487,139 244 6,095 1.6 13<br />
Iringa 1,460,498 285 5,125 2.0 5<br />
Kagera 1,641,104 220 7,460 1.3 18<br />
Kigoma 1,030,691 181 5,694 1.8 10<br />
Kilimanjaro 1,556,928 395 3,942 2.5 2<br />
Lindi 741,479 139 5,334 1.9 8<br />
Mara 1,232,112 233 5,288 1.9 7<br />
Mbeya 1,759,814 292 6,027 1.7 12<br />
Morogoro 1,475,604 280 5,270 1.9 6<br />
Mwanza 2,351,233 317 7,417 1.3 17<br />
Rukwa 996,903 147 6,782 1.5 15<br />
Ruvuma 987,223 195 5,063 2.0 4<br />
Shinyanga 2,225,069 275 8,091 1.2 20<br />
Singida 961,038 163 5,896 1.7 11<br />
Tabora 1,214,073 161 7,541 1.3 19<br />
Tanga 1,457,756 271 5,379 1.9 9<br />
Total 27,941,103 4,844 5,768 1.7 -<br />
Source: Compiled from 1988 Population Census data and Health Statistics Abstract (1997)<br />
data.<br />
124
2.4 Child Immunization:<br />
There are six early childhood diseases against which immunization<br />
can be given. They are tuberculosis, pertussis, diphtheria, tetanus,<br />
polio and measles. The number one target group for such<br />
immunization consist of new born children before they reach one<br />
year. The secondary target group are the under fives. The <strong>region</strong><br />
expects to reach 100% immunization of one year olds by 1999.<br />
The immunization of children under one year had by 1996 reached<br />
a very good coverage of 88.3% for BCG, 82.2% for DPT3,<br />
83.1% for Polio3 and 83.5% for Measles.<br />
TABLE III-38:<br />
DISTRIBUTION OF COVERAGE BY IMMUNIZATION OF<br />
CHILDREN UNDER ONE YEAR, BY DISTRICT, MTWARA<br />
REGION, 1996:<br />
District<br />
Mtwara/Miki<br />
ndani<br />
Target<br />
No.<br />
Children<br />
BCG DPT3 Polio 3 Measles<br />
No. % No. % No. % No. %<br />
3,426 2,623 76.6 2,375 69.3 2,399 70 2,454 71.6<br />
Mtwara Rural 7,699 7,000 90.9 5,629 73.1 5,869 76.2 5,502 71.5<br />
Newala 12,340 10,569 85.5 11,973 97.0 11,870 96.2 11,997 97.2<br />
Masasi 15,438 14,145 91.6 12,004 78.0 12,196 80.0 12,543 81.2<br />
Total (1996) 38,903 34,337 88.3 31,981 82.2 32,334 83.1 32,496 83.5<br />
Total (1995) 39,765 34,855 87.7 38,341 96.4 32,633 82.1 32,087 80.7<br />
Source: Regional MCHCO Annual Report, Mtwara, 1996.<br />
125
TABLE III-39: DISTRIBUTION OF COVERAGE BY IMMUNIZATION OF<br />
UNDER FIVE CHILDREN, BY DISTRICT, MTWARA REGION,<br />
1996:<br />
District<br />
Target<br />
Number<br />
Registered<br />
Complete<br />
Immunization<br />
Continuing with<br />
Immunization<br />
Number % Number % Number %<br />
Mtwara/Mikind<br />
ani<br />
17,129 9,707 56.7 9,028 52.7 372 2.2<br />
Mtwara Rural 38,521 27,486 71.4 21,789 56.6 5,699 14.8<br />
Newala 61,695 39,129 63.4 31,922 51.8 7,207 11.7<br />
Masasi 77,190 71,320 92.4 69,870 90.5 7,320 9.5<br />
Total (1996) 194,535 147,642 75.9 132,609 68.2 20,598 10.6<br />
Total (1995) 195,647 166,805 85.3 146,360 74.8 29,732 15.2<br />
Source: Taarifa ya Huduma za Afya Kinga Mkoa wa Mtwara, 1996.<br />
Fig. 35: Distribution coverage of number registred and complete immunization of<br />
under five children by district, Mtwara <strong>region</strong>, 1996<br />
126
80,000<br />
70,000<br />
60,000<br />
50,000<br />
40,000<br />
30,000<br />
20,000<br />
10,000<br />
0<br />
Mtwara /<br />
Mikindani<br />
Mtwara<br />
Rural<br />
Newala<br />
Masasi<br />
Registered<br />
Complete Immunization<br />
These percentages showed an improvement of over 1995 except<br />
for DPT3 which was 96.4% in 1995. But at this rate of<br />
improvement there is little hope that the target of 100% by 1999<br />
will be attained. See Table III-38. The exception is Newala<br />
district which did extremely well in 1996.<br />
With regard to the immunization of under fives Masasi district<br />
alone is performing well at 90.5 coverage by 1996. The other<br />
three districts are doing badly. The coverage of<br />
Mtwara/Mikindani, Mtwara Rural and Newala districts are<br />
52.7%, 56.6% and 51.8% respectively. The 1996 performance<br />
is generally down from 1995.<br />
3.2.5 Child Nutrition:<br />
127
Under the section on "Food Adequacy" Mtwara <strong>region</strong> is<br />
compared to Singida <strong>region</strong>. The two <strong>region</strong>s have more or less<br />
an identical human population size and are not far apart in the<br />
quantity of pulses and oil seeds produced annually. Also neither<br />
<strong>region</strong> have a significant wildlife population. Yet the number of<br />
livestock units per 1,000 people is 52 for Mtwara and 1,656 for<br />
Singida. This means that expectant mothers and young children<br />
have better access to animal protein (milk, meat etc.) in Singida<br />
than their counterparts in Mtwara <strong>region</strong>. Availability or nonavailability<br />
of protein has implications on the weight of babies<br />
born, nutritional status of under fives, the average height and<br />
general well being of a population. With the help of UNICEF a<br />
CSDP exercise was undertaken in various selected <strong>region</strong>s to<br />
monitor children nutritional status and educate mothers on child<br />
nutrition. Table III-40 shows the results of this intervention in the<br />
<strong>region</strong>s, Mtwara and Singida included.<br />
TABLE III-40: PERCENTAGE OF CHILDREN BORN SEVERELY<br />
UNDERWEIGHT IN CSPD REGIONS, 1990 - 1994:<br />
Region 1990 1991 1992 1993 1994<br />
Mtwara 6.3 5.5 1.8 1.9 2.0<br />
Singida 3.5 1.4 1.5 1.1 1.1<br />
Coast - - - 7.1 4.4<br />
Morogoro 3.2 3.3 2.2 1.6 1.4<br />
Iringa 1.7 1.4 1.3 1.1 1.1<br />
Ruvuma 3.9 3.7 2.3 1.6 1.5<br />
Kagera 2.0 2.1 1.6 1.2 1.2<br />
Kilimanjaro 0.6 0.4 0.3 0.2 0.2<br />
Mara 6.9 3.0 2.8 1.6 1.4<br />
Mwanza - - - 3.2 2.3<br />
Shinyanga 2.0 1.4 1.5 1.1 1.1<br />
128
Total 2.8 2.5 1.6 1.6 1.4<br />
Source: UNICEF Dar-es-Salaam Office, 1997.<br />
Mtwara and Singida started in 1990 with 6.3% and 3.5% severe<br />
underweight respectively. Each <strong>region</strong> progressively reduced this<br />
ratio to reach 2.0% and 1.1% respectively by 1994.<br />
129
TABLE III-41: NUTRITION STATUS OF CHILDREN AT BIRTH IN<br />
TANZANIA MAINLAND, BY REGION, 1995:<br />
Number<br />
Children Under Nutrition<br />
Region weighed<br />
Weight Total %<br />
underweight children which accounted for 3.7% of all children<br />
weighed.<br />
3.2.6 Infant and Under five Mortality:<br />
Infant and Under five Mortality rates are a measure of the success<br />
of all those interventions which affect the health of infants and<br />
young children. Mtwara <strong>region</strong>'s IMR and U5MR as reflected in<br />
Tables III-42 and III-43.<br />
TABLE III-42:<br />
Region<br />
IMR AND U5MR IN TANZANIA MAINLAND BY REGIONS,<br />
1975, 1985 AND 1995 (Est.)<br />
IMR<br />
1975 1985 1995<br />
(est)<br />
U5MR<br />
1975 1985 1995<br />
(est)<br />
Mtwara 161 138 119 267 233 202<br />
Lindi 151 140 129 255 236 218<br />
Ruvuma 145 113 88 245 188 143<br />
Morogoro 140 124 96 267 209 163<br />
Coast 121 113 105 204 189 174<br />
Dar es Salaam 108 105 102 179 173 168<br />
Iringa 152 130 111 257 220 189<br />
Dodoma 133 132 130 225 222 220<br />
Arusha 108 75 52 179 129 78<br />
Kagera 133 130 127 225 219 212<br />
Kigoma 163 115 81 269 192 137<br />
Kilimanjaro 76 67 59 119 104 90<br />
131
Mara 140 125 112 236 211 189<br />
Mbeya 161 124 96 267 209 163<br />
Mwanza 139 115 95 233 192 157<br />
Rukwa 170 131 101 283 221 172<br />
Shinyanga 150 110 81 252 183 131<br />
Singida 137 96 67 231 157 106<br />
Tabora 140 101 73 236 166 116<br />
Tanga 112 106 100 187 176 166<br />
Source: Health Statistics Abstract 1997.<br />
Fig. 36: IMR and U5MR in Mtwara <strong>region</strong>, 1975, 1985 and 1995 (Est.)<br />
300<br />
250<br />
200<br />
150<br />
U5MR<br />
100<br />
IMR<br />
50<br />
0<br />
1975 1985 1995 1975 1985 1995<br />
The <strong>region</strong> ranks at the bottom along with Lindi <strong>region</strong>. The two<br />
<strong>region</strong>s have the worst IMR and U5MR. Another factor which<br />
becomes clear in studying Table III-43 is that urban areas have a<br />
lower IMR and U5MR than rural areas in Mtwara, as indeed in<br />
132
TABLE III-43:<br />
most of <strong>Tanzania</strong>. Rural areas are more risky healthwise for the<br />
young child.<br />
Region<br />
IMR AND U5MR IN TANZANIA MAINLAND, BY REGIONS<br />
AND URBAN/RURAL CONFIGURATION, 1988:<br />
IMR<br />
U5MR<br />
Rural Urban Averag<br />
e<br />
Rural Urban Average<br />
Mtwara 143 108 138 241 180 233<br />
Lindi 143 121 129 241 204 236<br />
Ruvuma 114 107 113 190 177 188<br />
Morogoro 134 94 125 226 153 211<br />
Coast 115 104 113 193 172 189<br />
Dar es Salaam 121 103 105 203 169 173<br />
Iringa 130 135 130 219 229 220<br />
Dodoma 136 94 132 230 154 222<br />
Arusha 76 72 75 120 114 129<br />
Kagera 130 116 130 220 193 219<br />
Kigoma 116 109 115 194 181 192<br />
Kilimanjaro 66 73 67 102 115 104<br />
Mara 128 101 125 216 116 211<br />
Mbeya 128 107 124 216 177 209<br />
Mwanza 119 97 115 200 158 192<br />
Rukwa 134 112 131 227 186 221<br />
Shinyanga 112 92 110 186 150 183<br />
Singida 99 81 96 161 129 157<br />
Tabora 101 103 101 165 169 166<br />
Tanga 109 89 106 182 144 176<br />
133
Source:<br />
1988 Population Census.<br />
Fig. 37: IMR and U5MR in Mtwara <strong>region</strong> Rural/Urban configuration, 1988<br />
250<br />
200<br />
150<br />
100<br />
50<br />
IMR<br />
U5MR<br />
0<br />
Rural Urban Rural Urban<br />
From Table III-44 a similar picture to the Urban/Rural set up<br />
appears with respect to the sex of a child. Female children in<br />
Mtwara and most of <strong>Tanzania</strong> are less at risk from death than their<br />
male counterparts. They have a lower IMR and U5MR as a<br />
population than the male population.<br />
TABLE III-44:<br />
Region<br />
IMR AND U5MR IN TANZANIA MAINLAND BY REGION AND<br />
BY SEX, 1988:<br />
IMR<br />
Male Female Averag<br />
e<br />
U5MR<br />
Male Female Averag<br />
e<br />
Mtwara 141 134 138 238 227 233<br />
Lindi 140 139 140 237 235 236<br />
Ruvuma 115 110 113 193 183 188<br />
Morogoro 133 118 125 224 197 211<br />
134
Coast 118 109 113 199 180 189<br />
Dar es Salaam 109 100 105 181 165 173<br />
Iringa 137 124 130 231 209 220<br />
Arusha 79 82 75 126 131 129<br />
Dodoma 136 127 132 230 114 222<br />
Kagera 133 127 130 224 213 219<br />
Kigoma 119 111 115 200 184 192<br />
Mara 128 122 125 216 205 211<br />
Kilimanjaro 67 67 67 104 104 104<br />
Mbeya 130 118 124 220 197 209<br />
Mwanza 122 108 115 204 178 192<br />
Rukwa 137 125 131 232 211 221<br />
Shinyanga 114 106 110 191 175 183<br />
Singida 98 94 96 161 152 157<br />
Tabora 103 99 101 169 163 166<br />
Tanga 110 102 106 183 168 176<br />
Source:<br />
1988 Population Census.<br />
3.2.7 Maternal Mortality:<br />
Death of women directly connected with child bearing is still a<br />
problem in developing countries and certainly in Mtwara <strong>region</strong>.<br />
Unlike for IMR and U5MR the Maternal Mortality Rate for<br />
Mtwara is average for the country. Since 1992 MMR has shown<br />
signs of some slight improvement.<br />
135
136
TABLE IV-45:<br />
MATERNAL MORTALITY RATE IN TANZANIA MAINLAND<br />
BY REGIONS FOR 1992 TO 1995:<br />
Region 1992 1993 1994 1995 Rankin<br />
g<br />
Mtwara 264 212 161 252 10<br />
Lindi 262 289 193 264 14<br />
Ruvuma 225 189 186 177 8<br />
Morogoro 289 172 190 153 6<br />
Coast 209 111 70 187 5<br />
Dar es Salaam 220 398 237 328 19<br />
Iringa 311 321 276 281 18<br />
Arusha 102 158 114 159 4<br />
Shinyanga 143 188 199 184 9<br />
Singida 242 171 238 207 13<br />
Dodoma 197 214 208 266 16<br />
Kagera 304 343 190 242 12<br />
Kigoma 144 155 105 87 2<br />
Kilimanjaro 126 46 107 63 1<br />
Mara 67 59 106 124 3<br />
Mbeya 67 361 436 264 20<br />
Mwanza 221 186 266 207 15<br />
Rukwa 172 294 243 267 17<br />
Tabora 151 185 130 216 7<br />
Tanga 255 172 220 195 11<br />
Total 199 211 197 208 -<br />
137
Source: Health Statistics Abstract, 1997.<br />
138
Fig. 38: Maternal mortality rate in Mtwara <strong>region</strong> to Total Mainland for 1992 to 1995<br />
300<br />
250<br />
200<br />
150<br />
Mtwara Region<br />
Total Mainland<br />
100<br />
50<br />
0<br />
1992 1993 1994 1995<br />
One way to reduce MMR is to ensure that all women of child<br />
bearing age are immunised against tetanus. Table III-46 shows<br />
how this exercise fared in 1996. A total 39.8% of this group of<br />
women had two or more vaccinations rendering them nominally<br />
immune. The rate for 1995 was 42.2%. Further efforts are<br />
required particularly in the district of Mtwara/Mikindani and<br />
Mtwara Rural, which districts scored rates of 24.4% and 26.2%<br />
respectively. This means only one quarter of women of the target<br />
group were immunised against tetanus in these two districts.<br />
139
TABLE III-46:<br />
District<br />
TETANUS VACCINATION OF WOMEN WITHIN THE CHILD<br />
BEARING AGE GROUP, MTWARA REGION, BY DISTRICTS,<br />
1996:<br />
Mtwara/Mi<br />
kindani<br />
Mtwara<br />
Rural<br />
Newala Masasi Total<br />
1996 1995<br />
Target Number 17,129 38,493 61,695 77,190 194,507 198,829<br />
1st Vaccination:Number 2,865 6,138 14,720 11,415 35,138 55,495<br />
:Percent 16.7 15.9 23.9 14.8 18.1 27.9<br />
2nd<br />
2,261 4,208 13,200 9,631 29,300 41,649<br />
Vaccination:Number<br />
13.2 10.9 21.4 12.5 15.1 20.9<br />
:Percent<br />
3rd<br />
1,138 2,876 11,483 10,965 26,462 25,466<br />
Vaccination:Number<br />
:Percent 6.6 7.5 18.6 14.2 13.6 12.8<br />
4th<br />
Vaccination:Number<br />
:Percent<br />
5th<br />
Vaccination:Number<br />
:Percent<br />
Two or More<br />
Vaccination: Number<br />
:Percent<br />
525 1,970 7,292 5,013 14,800 12,490<br />
3 5.1 11.8 6.5 7.6 6.3<br />
248 1,021 3,596 1,921 6,786 4,253<br />
1.4 2.7 5.8 2.5 3.5 2.1<br />
4,172 10,075 35,571 27,530 77,348 83,858<br />
24.4 26.2 57.7 35.7 39.8 42.2<br />
Source: Taarifa ya Huduma za Afya Kinga Mkoa wa Mtwara, 1996.<br />
3.2.8 AIDS:<br />
Acquired Immunity Deficiency Syndrome (AIDS) is gaining importance as<br />
a cause of death in the <strong>region</strong>. The first case of AIDS in the <strong>region</strong> was<br />
discovered in 1985. By 1996 the cumulative total of AIDS cases was<br />
2,244 or 242 in every 100,000 population. See Table III-47 and III-48.<br />
140
Compared to its neighbours the <strong>region</strong> has the least number of cases. Its<br />
ranking as number 13 on the national scale shows that its situation<br />
AIDSwise is better than average.<br />
TABLE III-47<br />
CUMULATIVE AIDS CASES BY REGION IN SELECTED<br />
NEIGHBORING REGIONS 1991-1996<br />
Region 1991 1992 1993 1994 1995 1996<br />
Mtwara 1361 1962 2090 2201 2267 2244<br />
Lindi 842 1211 1691 1966 2173 2480<br />
Ruvuma 1197 1807 2480 2847 3087 3345<br />
Morogoro 2398 3598 4328 4575 4605 4605<br />
Coast 1676 2215 2740 3023 3268 3373<br />
DSM 8834 9295 10406 11050 11302 12983<br />
Iringa 2281 3334 4462 4674 4785 4883<br />
Dodoma 536 762 1028 1071 1090 1096<br />
Total<br />
Mainland<br />
44195 60066 73572 79445 83351 88467<br />
Source: Health Statistics Abstract 1997<br />
TABLE III-48 RATE OF AIDS PER 100,000 POPULATION BASED ON<br />
CUMULATIVE CASES IN SELECTED NEIGHBORING<br />
REGIONS 1992,1993 AND 1996<br />
Region 1992 1993 1996 1996<br />
Ranking in<br />
<strong>Tanzania</strong><br />
Mainland<br />
Mtwara 106 110 242 13<br />
Lindi 95 112 328 7<br />
Ruvuma 111 128 328 6<br />
Morogoro 160 164 305 9<br />
141
Coast 189 206 446 4<br />
DSM 538 531 678 1<br />
Iringa 144 161 325 8<br />
Source: Health Statistics Abstract, 1997<br />
The rate of new cases per year has slowed down possibly<br />
because health education is becoming effective. At 2244<br />
cumulative cases the <strong>region</strong> has only 2.5% of the cumulative cases<br />
in the Mainland, although it has some 3.8% of the country's<br />
population.<br />
3.2.9 Life Expectancy<br />
Life expectancy is the ultimate measure of a <strong>region</strong>'s health<br />
environment. In the case of Mtwara <strong>region</strong> life expectancy at birth<br />
averaged 40 years. That was in 1978. In 1988 this had increased<br />
to 44 and 48 for males and females respectively. These figures<br />
are below the national averages, and ranks Mtwara a low of<br />
number 16 being only better than Rukwa, Dodoma, Iringa and<br />
Kagera.<br />
TABLE III-49<br />
LIFE EXPECTANCY AT BIRTH TANZANIA MAINLAND BY<br />
SEX AND BY REGION 1978 AND 1988 IN YEARS<br />
Region Average 1978 1988 Ranking<br />
Average Male Female<br />
Mtwara 40 46 44 48 16<br />
Lindi 42 47 46 48 13<br />
Ruvuma 43 49 48 50 8<br />
Morogoro 44 46 45 48 15<br />
142
Coast 47 48 46 51 9<br />
DSM 50 50 50 50 5<br />
Iringa 41 45 44 47 19<br />
Arusha 50 57 57 58 2<br />
Dodoma 45 46 45 47 18<br />
Kagera 45 45 44 45 20<br />
Kigoma 40 48 47 49 11<br />
Kilimanjaro 58 59 57 62 1<br />
Mara 44 47 46 48 12<br />
Mbeya 41 47 45 48 14<br />
Mwanza 44 48 46 50 10<br />
Rukwa 40 45 44 47 17<br />
Shinyanga 42 50 48 51 6<br />
Singida 44 55 54 55 3<br />
Tabora 44 53 53 54 4<br />
Tanga 49 49 48 51 7<br />
Mainland 44 49 51 -<br />
Source: 1988 Population Census<br />
3.2.10 Other Health Issues<br />
3.2.10.1 Tuberculosis and Leprosy<br />
These two scourges are still with the <strong>region</strong>. The onset of AIDS<br />
has strengthened the spread of tuberculosis so much so that it is<br />
143
on the increase. Table III-50 figures for TB rates are misleading,<br />
the slight decline in 1993 was only temporary since elsewhere in<br />
the country the disease has increased. The leprosy rates reflect<br />
the true trend consistent with the rest of the country. Leprosy is<br />
on the decline.<br />
144
TABLE III-50<br />
SWEAR POSITIVE PULMONARY TB AND LEPROSY CASE<br />
DETECTION RATE PER 100,000 POPULATION IN MTWARA<br />
AND NEIGHBORING REGIONS 1992 AND 1993<br />
Region TB Rates Leprosy Rates<br />
1992 1993 1992 1993<br />
Mtwara 96 94 53.0 39.8<br />
Lindi 61 64 24.0 18.3<br />
Morogoro 47 58 27.0 15.4<br />
Coast 58 78 11.0 17.0<br />
DSM 126 213 0.0 10.4<br />
Iringa 51 65 1.8 2.7<br />
Total<br />
Mainland<br />
48 57 13 11<br />
Source: Health Statistics Abstract, 1997<br />
Mtwara <strong>region</strong> has the highest case detection rate for leprosy in<br />
the country not only among neighboring <strong>region</strong>s. The <strong>region</strong>'s<br />
rates are about four times the national averages.<br />
3.2.10.2 Cost Sharing<br />
Given the high cost of running health services by the public sector,<br />
and at the same time given the fiscal constraints, the government<br />
since 1994 has encouraged the public to share in the cost of<br />
running public facilities. It involves a change in attitude, so it is<br />
only slowly that people are coming to accept this reality. During<br />
1994/95 and 1995/96 Mtwara residents paid user charges to the<br />
145
tune of TShs 10.7 million and TShs 7.5 million respectively. A<br />
start has been made. Asking households to take care of part of<br />
health care bills is in line with government efforts to encourage the<br />
privatisation of the health sector.<br />
3.3 WATER SUPPLY<br />
3.3.1 Introduction<br />
The sources of water in the <strong>region</strong> are dominated by rivers<br />
Ruvuma, Mbuo, Mambi and Mbangala and lakes Kitere and<br />
Chidya. But in order to supply the much scattered population<br />
ground water is also exploited as well as some harvesting of rain<br />
water.<br />
Environmental degradation through uncontrolled cultivation and<br />
deforestation have taken their toll on water availability.<br />
Destruction of tree cover over spring water sources have dried up<br />
such sources. Twenty three water schemes out of 53 constructed<br />
between 1970 and 1980 have dried up this way.<br />
3.3.2 Rural Water Supplies<br />
The kinds of rural water supply facilities varies a lot from district<br />
to district. Mtwara rural has a rich mixture of piped system,<br />
boreholdes, shallow wells and dams.<br />
146
District Status Piped<br />
systems<br />
Bore<br />
Holes<br />
Shallow<br />
wells<br />
Dams<br />
Mtwara<br />
Rural<br />
working<br />
not workers<br />
total<br />
% not working<br />
4<br />
16<br />
20<br />
80<br />
19<br />
26<br />
45<br />
58<br />
206<br />
134<br />
340<br />
39<br />
4<br />
2<br />
6<br />
33<br />
Masasi<br />
working<br />
not working<br />
total<br />
% not working<br />
-<br />
-<br />
-<br />
-<br />
-<br />
-<br />
-<br />
-<br />
415<br />
150<br />
565<br />
27<br />
-<br />
-<br />
-<br />
-<br />
Newala*<br />
working<br />
not working<br />
total<br />
40%<br />
60%<br />
100%<br />
-<br />
-<br />
-<br />
-<br />
-<br />
-<br />
-<br />
-<br />
-<br />
* Includes Tandahimba District<br />
Source: Regional Water Engineer, Mtwara 1997<br />
Masasi on the other hand relies only on shallow wells and Newala<br />
on piped systems using electricity. See Table III-51<br />
The water supply needs of the districts were met at the following<br />
level in 1996:-<br />
Mtwara Rural - 44%<br />
Masasi - 41%<br />
Newala/Tandahimba - 40%<br />
Although 87% of the villages are covered by one or more safe<br />
water supply system, the quickest way to increase coverage in the<br />
future is the rehabilitation of systems now out of use. The general<br />
147
deterioration of the nation's economy has also affected water<br />
supplies in Mtwara <strong>region</strong>.<br />
In an effort to break away from reliance on government budgetary<br />
allocations for operating and maintenance of water systems village<br />
water committees have been set up. See Table III-52. Some 134<br />
water committees have been set up among 24% of the <strong>region</strong>'s<br />
villages. Water funds are in 102 or 19% of all villages are<br />
covered.<br />
TABLE III-52<br />
District<br />
DISTRIBUTION OF VILLAGE WATER COMMITTEES AND VILLAGE<br />
WATER FUNDS, BY DISTRICT, MTWARA REGION 1996<br />
Number<br />
of<br />
villages<br />
Village water<br />
Committees<br />
Village water Funds<br />
Number % Number %<br />
Mtwara Rural 101 41 41 26 26<br />
Masasi 214 47 22 47 22<br />
Newala<br />
Tandahimba<br />
and<br />
233 46 20 29 12<br />
Total 548 134 24 102 19<br />
Source: Regional Water Engineer, Mtwara 1997<br />
3.3.3 Urban Water Supplies<br />
Masasi town is dependent on four water sources: Mchema dam, 5<br />
deep wells at Magumchila, 50 shallow wells dug within the town<br />
area and water catchment from Mwena and Mwili springs. A<br />
variety of sources also supply Mtwara and Mikindani townships.<br />
These are: 7 deep wells in Mtawanya valley, 2 deep wells within<br />
the Mikindani area and lastly the spring at Mchuchu. Newala<br />
148
TABLE III-53<br />
town is served by the extensive Makonde plateau piped water<br />
system which relies on electricity.<br />
These four major towns of the <strong>region</strong>, i.e. Mtwara, Mikindani,<br />
Masai and Newala need 12.2 million litres of water each day. So<br />
far by 1996 only 6.0 million litres could be supplied. This is 49%<br />
of the demand. Once again fiscal constraints are to blame for this<br />
low coverage. See Table III-53.<br />
DEMAND AND SUPPLY OF SAFE WATER BY TOWNS,<br />
MTWARA REGION 1996 ('000 litres per day)<br />
Township Demand Supply Shortage<br />
litres litres Litres %<br />
Mtwara 8000 4500 3500 44<br />
Mikindani 200 54 146 73<br />
Masasi 2000 900 1100 55<br />
Newala 2000 500 1500 75<br />
Total 12200 5954 6246 51<br />
Source: Regional water Engineer, Mtwara, 1997<br />
Fig. 39: Demand and supply of safe water by towns, Mtwara <strong>region</strong> 1996 ('000 litres<br />
per day)<br />
149
Newala<br />
Masasi<br />
Supply<br />
Demand<br />
Mikindani<br />
Mtwara<br />
0 1000 2000 3000 4000 5000 6000 7000 8000<br />
150
3.3.4 Sanitation<br />
TABLE III-54<br />
The 1988 Population Census gave for the first time a<br />
comprehensive picture of the sanitation situation in the <strong>region</strong>. The<br />
census revealed that 86.5% of all households or 89% of the<br />
<strong>region</strong>'s population had access to toilet facilities.<br />
ACCESS TO TOILETS BY HOUSEHOLD AND<br />
POPULATION MTWARA REGION 1988<br />
Type of Facility Household Population<br />
Number % Number %<br />
with flush inside 2313 1.2 10,528 1.2<br />
with<br />
outside/shared<br />
flush<br />
1518 0.8 6318 0.7<br />
with pit latrine 168,026 84.5 762,662 87.1<br />
no toilet 26,974 13.5 96,430 11.0<br />
not stated 9 0.0 44 0.0<br />
Total 198,840 100 875,982 100<br />
Source: 1988 Population Census<br />
According to Table III-55 the district of Newala leads in having<br />
the least percentage of people without toilet facilities closely<br />
followed by Masasi. This is with respect to rural areas. The<br />
<strong>region</strong>al percentage of those without toilets is 11.9.<br />
151
TABLE III-55 ACCESS TO TOILETS BY DISTRICT AND POPULATION<br />
MTWARA REGION RURAL AREAS 1988<br />
District<br />
Total<br />
Populatio<br />
n<br />
Flush Toilet Pit latrine No Toilet N.S<br />
Pop % Pop % Pop % Po<br />
p<br />
Mtwara/Mikindani 9405 339 3.6 7581 80.<br />
6<br />
1485 15.<br />
8<br />
o<br />
Mtwara Rural 161,576 1580 1.0 123,78<br />
6<br />
76.<br />
6<br />
36210 22.<br />
4<br />
0<br />
Masasi 304,274 2306 0.8 269,80<br />
9<br />
88.<br />
7<br />
32115 10.<br />
5<br />
44<br />
Newala* 275,595 2884 1.0 253,17<br />
2<br />
91.<br />
9<br />
19,539 7.1 0<br />
Total 750,850 7109 1.0 654,34<br />
8<br />
87.<br />
1<br />
89,349 11.<br />
9<br />
44<br />
* Included Tandahimba District<br />
Source: 1988 Population Census<br />
In urban areas, the percent age of people without toilets is 5.6%<br />
for the <strong>region</strong>. As expected this figure is smaller than that of rural<br />
areas. Mtwara/ Mikindani has the largest proportion of its urban<br />
population without toilets. It is 7.7%.<br />
TABLE III-56:<br />
District<br />
Mtwara/Mikinda<br />
ni<br />
ACCESS TO TOILET FACILITIES BY DISTRICT AND<br />
POPULATION, MTWARA REGION URBAN AREAS 1988:<br />
Total<br />
Populatio<br />
n<br />
Flush Toilets Pit Latrines No Toilets N.S.<br />
Popul<br />
ation<br />
% Populat<br />
ion<br />
% Popul<br />
ation<br />
% Pop.<br />
66,455 7,789 11.7 53,563 80.6 5,103 7.7 0<br />
152
Mtwara Rural 6,613 54 0.8 6,321 95.6 238 3.6 0<br />
Newala* 25,652 369 1.4 24,369 95.0 914 3.6 0<br />
Masasi 26,412 1,525 5.8 24,061 91.1 826 3.1 0<br />
Total 125,132 9,737 7.8 108,31<br />
4<br />
86.6 7,081 5.6 0<br />
* Includes Tandahimba<br />
Source: 1988 Population Census.<br />
The combined rural plus urban access coverage for the <strong>region</strong> is<br />
89%. Only 11% of Mtwara's population have no toilets or have<br />
no access to one. Mtwara Rural district has the worst record of a<br />
district. Some 21.6% of the district's population do not have<br />
access to toilet facilities. See Table III-57.<br />
District<br />
Mtwara/Mik<br />
indani<br />
Mtwara<br />
Rural<br />
DISTRICT, MTWARA REGION 1988:<br />
Total<br />
Populatio<br />
n<br />
Flush Toilets Pit Latrines No Toilets N.S.<br />
Populatio<br />
n<br />
% Populatio<br />
n<br />
% Populatio<br />
n<br />
% Pop.<br />
75,860 8,128 10.7 61,144 80.6 6,588 8.7 0<br />
168,189 1,634 1.0 130,107 77.4 36,448 21.6 0<br />
Newala* 301,247 3,253 1.1 277,544 92.1 20,453 6.8 0<br />
Masasi 330,686 3,831 1.2 293,870 88.9 32,941 9.9 44<br />
Total 875,982 16,846 1.9 762,665 87.1 96,430 11.0 0<br />
* Included Tandahimba District.<br />
Source: 1988 Population Census.<br />
153
SECTION IV<br />
ECONOMIC INFRASTRUCTURE<br />
4.1 Introduction<br />
4.2 Roads<br />
Economic development is not possible without an adequate<br />
supporting <strong>economic</strong> infrastructure. Mtwara <strong>region</strong> has a lot of<br />
potential for development but it is also an open secret that the<br />
<strong>region</strong>s <strong>economic</strong> infrastructure is grossly underdeveloped. Take<br />
the example of communications. The <strong>region</strong>'s communication links<br />
with the outside are rudimentary and tend to be seasonal. Within<br />
the <strong>region</strong>, the lack of maintenance make road transport between<br />
one corner of the <strong>region</strong> and another, both uncertain and<br />
hazardous. Inspite of these set backs the <strong>region</strong>'s average<br />
contribution to the national GDP is 3.27% way ahead of Rukwa,<br />
Dodoma, Singida, Kigoma and Coast <strong>region</strong>s. Improvement in<br />
the <strong>region</strong>'s infrastructure will enhance the <strong>region</strong>'s contribution to<br />
the national economy.<br />
The <strong>region</strong> is connected to the outside by the following roads<br />
outlets:-<br />
- The Mtwara, Lindi, Kilwa, Dar es Salaam, Coastal trunk road.<br />
- The Mtwara,Songea, Makambako round about link to the<br />
Tanzam highway.<br />
154
The friendship bridge over the Ruvuma river to Mozambique has<br />
still to be built.<br />
155
ROAD NETWORK - MTWARA REGION MAP<br />
MTWARA REGON ADMIN MAP<br />
LINDI<br />
Indian Ocean<br />
Mtwara<br />
Masasi<br />
MASASI<br />
NEWALA<br />
MTWARA<br />
Newala<br />
MTWARA<br />
MOZAMBIQUE<br />
Computer Graphic design & Cartography by: L.V.Mtaroni (97).<br />
LEGEND<br />
Regional boundary<br />
District boundaries<br />
Road network<br />
Ocean Water bourder<br />
Background Mtwara<br />
District Urban centers.<br />
Other Urban centers.<br />
156
TABLE IV-I;<br />
All these links are subject to the vagaries of the weather so that<br />
they are nearly always impassable during the rainy season. Even<br />
during the dry season they are used with difficulty and are<br />
expensive of spares, fuel and time.<br />
Intra-<strong>region</strong>al road links exist but suffer from maintenance. Hence,<br />
these too are travelled by road users at their own risk. Unlike their<br />
counterparts in Sukuma land who use bicycles as alternatives for<br />
light loads, the sandy terrain which predominates the <strong>region</strong><br />
excludes this.<br />
The absence of a sizeable cattle herd also excludes the use of<br />
oxcarts for the movement of farm inputs and crop produce. In<br />
many parts of the <strong>region</strong> walking with your load is the only<br />
alternative to car transport.<br />
Mtwara <strong>region</strong> has 5,596 kms of roads which works out at a road<br />
density level of 0.335 kms per sq km of land. Table IV-I compares<br />
Mtwara <strong>region</strong> with certain selected <strong>region</strong>s.<br />
Region Total Roads<br />
(Kms)<br />
STATUS ROAD TRANSPORT IN MTWARA REGION AND<br />
SOME SELECTED REGIONS<br />
Earth<br />
(Kms)<br />
Roads<br />
% Earth<br />
Roads<br />
Road<br />
Km/Km 2<br />
density<br />
Mtwara 5596 5401 97 0.335<br />
Lindi 6686 6444 96 0.100<br />
Mwanza 6349 5147 81 0.315<br />
Dodoma 4236 3384 80 0.103<br />
Shinyanga 5670 4852 86 0.112<br />
Morogoro 3742 - - 0.315<br />
Tanga 2778 1382 50 0.102<br />
Mbeya 4831 3765 78 0.076<br />
157
Source: Compiled from data supplied by Regional Engineer, Mtwara, 1997<br />
:Regional Socio-Economic Profiles, Lindi, Mwanza, Dodoma, Shinyanga, Morogoro, Tanga and<br />
Mbeya<br />
TABLE IV-2<br />
DISTRIBUTION ROADS BY DISTRICT AND BY TYPE OF<br />
SURFACE MTWARA REGION 1997<br />
District Type of Surface (Kms) Total Road<br />
Density<br />
Km/Km 2<br />
Tarmac Gravel Earth<br />
Mtwara 53 20 880 953 0.253<br />
Newala 1.5 - 1,081 1,082.5 0.269<br />
Masasi 80 40 3,440 3,560 0.398<br />
Total 134.5 60 5,401 5,595.5 0.335<br />
Source: Taarifa fupi ya hali ya maendeleo Mkoa wa Mtwara, April 1995<br />
It is clear from table IV-I that in terms of road density Mtwara<br />
<strong>region</strong> has a better than average development. However table<br />
IV-2 shows that only some 200 kms of Mtwara <strong>region</strong> roads are<br />
either gravel or tarmac surfaced. That is only 3% of total road<br />
length. Some 97% of the roads are earth surfaced with the<br />
implication that they are generally impassable during the rainy<br />
season. By the time the rains stop and repairs are undertaken it<br />
leaves only 3 to 4 months of passable use. Three quarters of the<br />
time the roads are impassable or barely so because of rains or<br />
because they have yet to be repaired.<br />
According to responsibility, trunk and <strong>region</strong>al roads are the<br />
responsibility of the Regional Engineer while district and feeder<br />
roads belong to district authorities. See Table IV-3. District<br />
councils throughout the country have showed little aptitude in<br />
158
maintaining roads they are responsible for. Hence these feeder<br />
and district roads in Mtwara go largely impaired from one year to<br />
the next. Trunk and <strong>region</strong>al roads have a better track record for<br />
maintenances.<br />
TABLE IV-3<br />
Class<br />
CLASSIFICATION OF ROADS,<br />
MTWARA REGION, 1997<br />
Kilometres<br />
Trunk 395<br />
Regional 778<br />
District 1592<br />
Feeder 2831<br />
Total 5596<br />
Source: Regional Engineer, Mtwara 1997:<br />
Utekelezaji wa irani za CCM za Uchaguzi wa madiwani 1994 na Wabunge 1995<br />
4.3. Air Services<br />
Air transport for some months in the year is the only reliable link<br />
with the outside world that Mtwara <strong>region</strong> possesses. The only<br />
other alternative is marine transport. The rainy season renders<br />
most of road transport impassable. Of course, air transport can<br />
only cater for urgent or high value cargo and V.I.P. passengers.<br />
It is too expensive for ordinary use. Competition for space on<br />
marine boats is restrictive.<br />
159
The <strong>region</strong> has the benefit of three aerodromes; one major airport,<br />
one minor airport and one airstrip. Mtwara is the major airport<br />
capable of handling Boeing 737 aircraft and regular commercial<br />
traffic. Masasi is a minor airport while Newala is a mere airstrip<br />
for use by light, non-commercial aircraft at irregular intervals.<br />
According to Table IV-4 the general decline in the country's<br />
economy has also affected adversely the volume of air cargo and<br />
air passengers handled by Masasi and Mtwara airports in recent<br />
years. Nevertheless, the importance especially of Mtwara airport<br />
in <strong>Tanzania</strong> is still evident. It is the most busy airport after Dar es<br />
salaam, Kilimanjaro, Mwanza and Zanzibar. In terms of air cargo<br />
Mtwara was ahead of Zanzibar in 1991,1992 and 1993. See<br />
Table IV-5 and IV-6.<br />
TABLE IV-4<br />
THE TREND OF SCHEDULED COMMERCIAL AIR<br />
FREIGHT (TONS) AND SCHEDULED COMMERCIAL<br />
AND NON-COMMERCIAL AIR PASSENGERS<br />
HANDLED AT MTWARA AND MASASI AIRPORTS<br />
1986-1993<br />
Year Mtwara Masasi<br />
Freight<br />
Passenge<br />
rs<br />
Freight<br />
Passengers<br />
1986 301.0 28,607 - -<br />
1987 329.3 28,918 - -<br />
1988 311.1 24,820 - 1,986<br />
1989 322.6 19,950 - 668<br />
1990 318.4 17,445 - 103<br />
1991 235.0 20,138 - 72<br />
160
1992 170.5 16,489 - -<br />
1993 156.7 18,886 - 1,842<br />
Source: Transport Statistics 1993<br />
161
Fig. 40: The trend of scheduled commercial Air Freight (tons) and scheduled<br />
commercial<br />
and non-commercial Air Passengers handled at Mtwara Airport 1986-1993<br />
30000<br />
25000<br />
20000<br />
15000<br />
10000<br />
5000<br />
0<br />
1986 1987 1988 1989 1990 1991 1992 1993<br />
Freight<br />
Passengers<br />
TABLE IV-5<br />
COMMERCIAL AND NON-COMMERCIAL AIR TRAFFIC<br />
PASSENGERS HANDLED AT MAJOR AIR PORTS IN<br />
TANZANIA 1986-1993<br />
Year D’Salaam K'njaro Mwanza *Zanzibar Mtwara<br />
1986 572,257 194,630 52,752 139,194 28,607<br />
1987 580,591 206,476 74,840 133,981 28,918<br />
1988 569,796 191,931 86,210 174,289 24,820<br />
1989 471,163 175,409 56,151 81,225 19,950<br />
1990 504,838 190,630 55,597 119,893 17,445<br />
1991 510,716 195,171 71,743 129,200 20,138<br />
1992 437,165 212,262 71,181 115,001 16,489<br />
1993 *272,753 191,139 59,504 79,214 18,886<br />
Source: Transport Statistics 1993<br />
* Scheduled Commercial Traffic only<br />
162
TABLE IV-6 COMMERCIAL AIR TRAFFIC FREIGHT HANDLED AT<br />
MAJOR AIR PORTS IN TANZANIA 1986-1993<br />
Year *DSM K'njar<br />
o<br />
Mwanza<br />
Zanziba<br />
r<br />
Mtwara<br />
1986 7,047.9 841.7 236.4 474.9 301.0<br />
1987 5,798.0 708.7 426.8 499.9 329.3<br />
1988 8,225.4 1,287.5 837.4 1,202.9 311.1<br />
1989 5,236.8 1,246.3 669.2 660.8 232.6<br />
1990 7,657.9 1,348.2 627.6 319.2 318.4<br />
1991 8,442.7 1,348.2 1,102.1 200.2 235.0<br />
1992 5,517.2 683.1 737.7 69.2 170.5<br />
1993 5,730.2 2,029.2 1,065.6 123.6 156.7<br />
Source: Transport Statistics, 1993<br />
* Scheduled commercial traffic only<br />
4.4. Marine Services<br />
Mtwara <strong>region</strong> has one major harbour and that is Mtwara port.<br />
This port is so strategically well placed that it could serve as an<br />
outlet for cargo to and from the southern <strong>region</strong>s of Mtwara,<br />
Ruvuma and Lindi as well as the countries of Malawi and Zambia.<br />
Lack of good communication links with its hinterland has dimmed<br />
the development of this port's potential.<br />
The harbour was built as long back as the pre-Independence<br />
years of 1950's primarily to service the British Overseas Food<br />
Corporation. O.F.C. was an ambitious colonial oil seed<br />
production scheme. This venture failed leaving the harbour with<br />
excess capacity. The harbour can accommodate two ships at a<br />
163
time at its deep water berth as well as another three ships within<br />
the harbour and at its entrance channel. It has covered storage<br />
capacity of 15,000 tons and a 15,000 square meters of open yard<br />
that could be used for container storage. All in all the port can<br />
handle 400,000 tons of cargo a year. This can be extended to<br />
750,000 tons if containerization is opted for. Actual utilization,<br />
however, has averaged 90,000 tons per annum over the last five<br />
years. Thus only one quarter of the harbour's capacity is utilized.<br />
Mtwara port is connected to Dar es Salaam port by some regular<br />
commercial freight and passenger services which need a lot of<br />
improvement. Such marine transport services do not offer a viable<br />
alternative to the road link between the northern and southern<br />
zones of the country. But they provide along with air services a<br />
crucial safety valve especially during the rainy season.<br />
4.5 Telecommunication Network<br />
Apart from Radio <strong>Tanzania</strong> services which are widely used and<br />
listened to, the <strong>Tanzania</strong> Telecommunications Company offers<br />
telephone and fax services. Some 900 customers in Mtwara town<br />
and 400 others in the districts are directly connected to the<br />
network. The total capacity is for 1550 telephone lines.<br />
Radio calls and Postal mail services also exist and are widely<br />
used.<br />
4.6 Energy<br />
4.6.1 Electricity:<br />
164
TANESCO provides commercial electricity services to Mtwara<br />
urban area and to Masasi and Newala towns. For Mtwara town<br />
the company generates 1.13 MWs though the demand is as high<br />
as 3.5 MWs. The Masasi power station produces only 3.0 MWs<br />
for Masasi and Newala since one of its generators capable of<br />
producing another 1.5 MWs broke down. The three towns are<br />
currently under supplied.<br />
TABLE IV-7:<br />
District<br />
ACCESS TO ELECTRICITY BY URBAN AREAS, BY<br />
DISTRICT, MTWARA REGION 1988<br />
Total<br />
Pop.<br />
Total<br />
Househol<br />
d<br />
Pop<br />
covered<br />
H/Holds<br />
covered<br />
% Pop<br />
covered<br />
%<br />
H/Holds<br />
covered<br />
Mtwara/Mi<br />
kindani<br />
Mtwara<br />
Rural<br />
66,452 15,705 15,451 3,410 23.3 21.7<br />
6,613 1,542 39 9 0.6 0.6<br />
Masasi 26,411 6,289 2,042 440 7.7 7.0<br />
Newala 25,648 5,830 638 122 2.5 2.1<br />
Total 125,12<br />
4<br />
29,366 18,170 3,981 14.5 13.6<br />
Source: 1988 Population census<br />
TABLE IV-8:<br />
ACCESS TO ELECTRICITY BY RURAL AREAS MTWARA<br />
REGION, 1988<br />
Total Population Total h/Holds %<br />
Population<br />
% H/Holds<br />
With Electricity 3,745 285 0.5 0.2<br />
No Electricity 747,064 168,588 99.5 99.8<br />
Not stated 44 9 - -<br />
165
Total 750,853 169,482 100 100<br />
Source: 1988 Population census<br />
Table IV - 7 reveals Mtwara Urban has the best coverage of any urban<br />
centre at 23.3% of population followed by Masasi at 7.7%. The average<br />
for urban areas is 14.5% of population and 13.6% of households have<br />
access to electricity. According to Table IV - 8 in rural areas only 0.5%<br />
of the population or 0.2% of households have electricity.<br />
TABLE IV - 9: ACCESS TO ELECTRICITY MTWARA REGION, 1988<br />
Total<br />
Population<br />
Total<br />
households<br />
% of<br />
population<br />
% of<br />
households<br />
With<br />
21,915 4,266 2.5 2.2<br />
electricity<br />
No electricity 854,018 193,973 97.5 97.8<br />
Not stated - 9 - -<br />
Total 875,933 198,248 100 100<br />
Source: 1988 Population Census<br />
TABLE IV-10<br />
Region<br />
ACCESS TO ELECTRICITY IN SELECTED REGIONS<br />
Number of h/holds with<br />
electricity<br />
% of h/holds with<br />
electricity<br />
Mtwara 4.266 2.2<br />
Shinyanga 8.503 3.0<br />
Iringa 6,032 2.4<br />
Morogoro 16,883 7.4<br />
Source: Shinyanga, Iringa, Morogoro Socio Economic Profiles.<br />
Tables IV-9 and IV-10 shows that the number and proportion of<br />
households with access to electricity in the <strong>region</strong> is low even<br />
compared to some selected <strong>region</strong>s.<br />
166
4.6.2 Fuelwood<br />
The use of firewood in rural areas and charcoal in urban areas is<br />
the traditional way to the preparation of food, heating water etc.<br />
With only 2.2% the <strong>region</strong>'s household gaining access to<br />
electricity, fuelwood is indeed the predominant energy source for<br />
domestic purposes. Intensive and extensive use of fuelwood is<br />
depleting the <strong>region</strong>'s forest slowly but surely.<br />
4.6.3 Other forms of Energy<br />
Fossil fuels are important in that for domestic lighting purposes,<br />
kerosene is the number one source in both rural and urban areas.<br />
Secondly, exploration for natural gas in Msimbati bay could yield<br />
the <strong>region</strong> and its neighbours with an abundant alternative source<br />
of domestic energy. The potential is there, hopefully.<br />
4.7 Land development<br />
TABLE IV-II :<br />
The focus for land development has always been directed to<br />
urban areas where according to the 1988 census only 14.3% of<br />
the <strong>region</strong>al population live. This is a direct consequent of current<br />
land policy which is clear with respect to urban areas only and<br />
secondly, scarcity has created a market for the land in urban<br />
centres. Table IV-11 shows activities undertaken since 1995 to<br />
help along the process of land development in urban areas.<br />
LAND DEVELOPMENT SERVICES FOR URBAN<br />
AREAS, MTWARA REGION 1995/96 AND 1996/97<br />
Services 1995/96 1996/97 TOTAL<br />
167
Townships,<br />
- Town Planning Maps<br />
- Plots<br />
6<br />
785<br />
2<br />
272<br />
8<br />
1057<br />
Surveys<br />
- Plots 138 181 319<br />
Tittle deeds<br />
Evaluation land Property and<br />
houses<br />
- Institutions<br />
- private<br />
140<br />
3<br />
22<br />
Source: Regional Land Development Office, Mtwara, 1997<br />
107<br />
1<br />
13<br />
247<br />
4<br />
35<br />
168
SECTION V<br />
OTHER DEVELOPMENT ISSUES:<br />
5.1 Women in Development:<br />
5.1.1 Women at Household Level:<br />
Mtwara along with its southern neighbour Lindi has a very high<br />
population of women compared to men. In both <strong>region</strong>s there<br />
52.3 women for every 47.7 men; say roughly 52:48. This is high<br />
by <strong>Tanzania</strong> standards. The average women to men ratio is<br />
51:49 for the Mainland. This means women are even more vitally<br />
important for the <strong>economic</strong> and social welfare of Mtwara <strong>region</strong><br />
than many other places in the country. Added to this the majority<br />
of indigenous residents of the <strong>region</strong> are by culture matrilineal.<br />
Such customs place the woman at the centre stage socially.<br />
According to the National Sample Census of Agricultural 1994/95<br />
the proportion of agricultural household which are headed by<br />
females in the <strong>region</strong> is 23.0%. Only the <strong>region</strong>s of Dodoma,<br />
Coast/DSM, Iringa and Singida have higher proportions at<br />
25.5%, 27.8%, 30.2% and 23.2% respectively. In these<br />
households women are exposed to leadership challenges and<br />
consequently to the decision making process they cannot duck.<br />
Mtwara women as producers of wealth, and food for households<br />
are as active in the <strong>region</strong> as their counterparts elsewhere in<br />
<strong>Tanzania</strong>. This means most work in the fields and at home is done<br />
by women. The same Sample Census reported that <strong>Tanzania</strong><br />
women handle:<br />
169
64% of filling<br />
70% of sowing<br />
71% of weeding<br />
73% of harvesting<br />
56% of marketing.<br />
These duties are in addition to searching for fuelwood, fetching<br />
water for the family, cooking and of course child bearing and<br />
rearing.<br />
5.1.2 Women leadership at above household level:<br />
Women like men have to be trained for and exposed to leadership<br />
situations right from childhood if they are to assume positions of<br />
responsibility in society. Recruitment of female children for<br />
primary and secondary education are just two such example.<br />
During this stage equity to men in terms of opportunity is the<br />
guiding principle. See Table V-1.<br />
TABLE V-1:<br />
THE POSITION OF WOMEN TRAINING FOR AND IN<br />
LEADERSHIP IN MTWARA REGION, BY DISTRICT, 1996:<br />
District<br />
Mtwara/M<br />
ikindani<br />
Mtwara<br />
Rural<br />
Masasi Newala* Total<br />
Primary School Enrolment<br />
STD I Female 1,014 1,431 5,119 3,899 11,463<br />
Male 1,051 1,582 4,865 4,044 11,542<br />
Primary School Enrollment<br />
(1995) (Total) Female n.a n.a n.a n.a 65,734<br />
Male n.a n.a n.a n.a 64,664<br />
Pupils Selected for Form I Female 88 57 194 220 559<br />
170
Male 104 56 186 140 486<br />
Secondary School Total<br />
Enrolment (1995): Form I-IV Female n.a n.a n.a n.a 2,016<br />
Male n.a n.a n.a n.a 2,127<br />
Form V - VI Female n.a n.a n.a n.a 67<br />
Male n.a n.a n.a n.a 95<br />
Adult Literacy % 1978<br />
Adult Literacy % 1988<br />
Female<br />
urban<br />
Male<br />
urban<br />
Female<br />
rural<br />
Male<br />
rural<br />
Female<br />
urban<br />
Male<br />
urban<br />
Female<br />
rural<br />
Male<br />
rural<br />
n.a n.a n.a n.a 47.6<br />
n.a n.a n.a n.a 75.4<br />
n.a n.a n.a n.a 38.2<br />
n.a n.a n.a n.a 63.1<br />
n.a n.a n.a n.a 61.6<br />
n.a n.a n.a n.a 77.9<br />
n.a n.a n.a n.a 46.3<br />
n.a n.a n.a n.a 65.5<br />
Primary School Teachers Female 231 111 335 438 1,115<br />
Male 113 471 1,245 1,211 3,040<br />
Secondary School Teachers<br />
(1995)<br />
Female n.a n.a n.a n.a 45<br />
Male n.a n.a n.a n.a 196<br />
District Councillor Female 4 5 10 10 29<br />
Male 13 17 31 51 112<br />
Member of National Assembly Female 0 0 1 0 1<br />
Male 1 1 2 3 7<br />
171
* Includes Tandahimba District.<br />
Source: Basic Statistics in Education, Regional Data, 1995.<br />
Regional Education Office, Mtwara, 1997.<br />
Regional Commissioners office, Mtwara, 1997.<br />
From this table the following facts can be deduced. Recruitment<br />
of pupils into primary schools gives equal opportunities to female<br />
and male children. When it comes to recruitment into Secondary<br />
Schools a deliberate policy of favouring female pupils comes into<br />
play to help reduce existing imbalance. A deliberate effort needs<br />
to be made to increase the adult literacy of women in both rural<br />
and urban areas to bring it to par with that of men. Although a<br />
good start has been made in increasing the number of women in<br />
junior positions e.g. teachers, further efforts are needed to redress<br />
existing inequality. Lastly, the elective process now recognises the<br />
potential women have as district councillor, members of the<br />
National Assembly etc.. but a lot remains to be done to achieve<br />
equity between the sexes.<br />
5.1.3 Gender Issues and the Alleviation of Poverty:<br />
Women especially in rural areas if left on their own are not<br />
capable of having an impact on the issue of redressing the<br />
inequalities between men and women. Committed individuals,<br />
non-governmental organisations, the government itself and others<br />
need to come forward and educate women of all walks of life to<br />
awaken them to take note of these injustices. Since this involves a<br />
change of attitude, it is a slow process. Nevertheless, a start has<br />
to be made.<br />
172
In Mtwara <strong>region</strong> a start has been made. Women are encouraged<br />
to come together in groups. Further, members of these groups<br />
are exposed to discussions in gender equality and equity. Issues<br />
of poverty are discussed also. The end result of membership in<br />
these groups is to prepare the woman to awaken and do<br />
something about these two major concerns. This way then<br />
women start to come forward to contest leadership positions in<br />
society or get involved in income generating activities along with<br />
like minded colleagues. Table V-2 expresses how far the <strong>region</strong><br />
has got in stimulating women towards these causes. Altogether,<br />
there are 459 women groups in <strong>region</strong> with 6,452 members<br />
involved in a variety of income generating activities including<br />
services, production, trading and processing.<br />
TABLE V-2:<br />
District<br />
DISTRIBUTION OF WOMEN INCOME GENERATING GROUPS<br />
BY DISTRICT, MTWARA REGION, MARCH 1997:<br />
Number<br />
of<br />
Groups<br />
Total<br />
Number of<br />
Members<br />
Type of Economic Activity<br />
Mtwara/Mikin<br />
dani<br />
113 1453 Tea rooms, salt processing, bread<br />
baking, rearing goats and cows,<br />
tailoring, porcelain making,<br />
fuelwood trading etc.<br />
Mtwara Rural 52 1225 Flour milling, goat keeping, shop<br />
keeping, tea rooms, farming,<br />
tailoring, hair plaiting, porcelain<br />
making, beekeeping.<br />
Newala 141 1215 Goat and poultry keeping,<br />
beekeeping, farming, hair salons,<br />
tailoring,<br />
cashewnuts<br />
decortication, flour milling, oil<br />
milling.<br />
173
Tandahimba 87 610 Goat rearing, making porcelain<br />
articles, hair salons, tea rooms,<br />
farming.<br />
Masasi 66 1949 Keeping goats, bees, poultry and<br />
fish. sorghum farming, hair salons,<br />
porcelain articles, flour milling, tea<br />
rooms, oil milling.<br />
Total 459 6452<br />
Source: Regional Commissioner's Office, Mtwara, 1997.<br />
Given that the <strong>region</strong> had 219,267 women of 15-44 years in<br />
1996, the number of women now members of the women groups<br />
is very small. It works out at 2.9% of women in this age group.<br />
There are too many potential members now out in the cold.<br />
Some of these groups have gone one step further. They have<br />
taken advantage of group security to obtain loans from various<br />
sources to improve their incomes. With respect to the Women's<br />
Fund 31 groups have so far benefited to the total of T.shs. 11<br />
million in the course of 1995/96. Of this loan T.sh. 4 million has<br />
been paid back leaving a balance of T.sh. 9 million yet to be paid<br />
back as of 31 March 1997. The details are shown in Table V-3.<br />
TABLE V-3:<br />
District<br />
LOANS FROM WOMEN'S FUND TO WOMEN GROUPS, BY<br />
DISTRICT, MTWARA REGION, MARCH 1997:<br />
Number of<br />
groups<br />
benefited<br />
Purpose<br />
Loan<br />
T.Shs.<br />
"000"<br />
Paid Back<br />
December<br />
1996<br />
Balance<br />
to pay<br />
back<br />
"000"<br />
174
Mtwara/Mi<br />
kindani<br />
6 Cattle<br />
keeping (1)<br />
Fuelwood<br />
trading (1)<br />
Tea rooms<br />
(4)<br />
900<br />
580<br />
1,400<br />
-<br />
206.7<br />
930<br />
1,116<br />
413<br />
866<br />
Sub Total 6 2,800 1,136.7 2,395.3<br />
Mtwara<br />
Rural<br />
12 Second<br />
hand clothy<br />
(1)<br />
Charcoal (1)<br />
Shopkeepin<br />
g (1)<br />
Tea rooms<br />
(2)<br />
Farming (6)<br />
Other (1)<br />
250<br />
100<br />
250<br />
500<br />
1,500<br />
250<br />
140<br />
-<br />
180<br />
154<br />
900<br />
-<br />
170<br />
124<br />
130<br />
466<br />
959<br />
310<br />
Sub Total 12 2,850 1,374 2,159<br />
Newala/Ta<br />
ndahimba<br />
2 Farming 2,580 620 2,579.2<br />
Masasi 11 Vegetable<br />
gardening<br />
Tea Rooms<br />
Club<br />
Others<br />
250<br />
1,000<br />
250<br />
1,250<br />
71<br />
452<br />
-<br />
474<br />
239<br />
788<br />
310<br />
1,076<br />
Sub Total 11 2,750 997 2,413<br />
Grand<br />
Total<br />
31 10,980 4,127.7 9,546.5<br />
Source: Regional Commissioner's Office, Mtwara, 1997.<br />
5.2 Environmental Conservation:<br />
175
Mtwara <strong>region</strong> is the most densely populated <strong>region</strong> in the<br />
southern zone. In comparison with its neighbours, population per<br />
sq.km. is as follows for 1996:<br />
Mtwara <strong>region</strong> - 53.2<br />
Lindi <strong>region</strong> - 9.6<br />
Morogoro <strong>region</strong> - 17.0<br />
Ruvuma <strong>region</strong> - 12.0<br />
Iringa <strong>region</strong> - 21.3<br />
Such density inevitably puts a lot of pressure on the environment.<br />
Forests in the <strong>region</strong> are getting depleted as people's demand for<br />
firewood and charcoal increase with each passing year. Demand<br />
for more land to put under the hoe pushes forests further and<br />
further away from settlements and the task of searching and<br />
fetching firewood gets more and more arduous. Uncontrolled<br />
cultivation especially on the Makonde Plateau has lead to erosion<br />
so that the floods in 1990 were rendered more damaging to soils,<br />
vegetation and communications. The search for protein in the<br />
absence of reasonably sized <strong>region</strong>al livestock herd puts pressure<br />
on wildlife. So much so that in recent years wildlife has been<br />
hunted to near extinction. The only wildlife can now be found in<br />
two game reserves totalling a mere 4% of the <strong>region</strong>'s land area.<br />
Population pressure on land has also affected water supplies.<br />
Uncontrolled deforestation especially of vegetation around water<br />
catchment areas and water sources has resulted in the silting of<br />
dams and drying up wells. Twenty three water schemes out of<br />
fifty three constructed between 1970 and 1980 have dried up. It<br />
would appear others are to follow suit.<br />
176
Small scale mining has come to the <strong>region</strong>. This of course, brings<br />
wealth to the <strong>region</strong>. But it has got to be monitored for such<br />
environmental damage like scarring of the countryside and the<br />
pollution of rivers and other water sources.<br />
On the coast, dynamite fishing is on the increase. Dynamite<br />
damage to corals on the continental shelf is more or less<br />
permanent. It is a scenic disaster and destroys the breeding<br />
environment of thousands of useful marine species. Lastly, the<br />
mangrove forest belt also needs looking after to prevent over<br />
exploitation for poles. It is also the breeding ground for prawns.<br />
177
5.3 Tourism:<br />
Although this industry is still undeveloped, it can be transformed<br />
into a significant employment and foreign exchange earning sector.<br />
The <strong>region</strong> has the necessary attractions. The two game reserves<br />
of Msanjesi and Lukwika/Lumesule are rich in such wildlife<br />
species as elephant, lions, leopards, greater kudu, zebra, water<br />
bucks, sable antelopes, wildebeest, impala, buffaloes, wild dogs<br />
and pig types. The Ruvuma river offers hippos and crocodiles.<br />
The <strong>region</strong> also has 125 kms. of coast line where sandy beaches<br />
abound. In addition Msambati bay offers a unique scenic beauty<br />
ideal for photography tourism. The historical moments in<br />
Mikindani offers a glimpse into the past civilization along the coast.<br />
So, the attractions are there what is needed is improvement of<br />
infrastructure such as suitable hotel accommodation, appropriate<br />
transport and communications. Promotion and the provision of<br />
the right entertainment follow automatically once the above are in<br />
place.<br />
Lastly, cultural tourism could be given a try. The rich cultures of<br />
the Makonde, Makua, Yao and others provide opportunities<br />
which could prove appropriate. It should not be forgotten that<br />
Mtwara is the home of the now world, famous "Makonde<br />
Carvings". A lot can be built on that.<br />
178
SECTION VI<br />
POTENTIAL INVESTMENT AREAS:<br />
6.1 Agriculture:<br />
The general trend in food production and some years of food<br />
inadequacies clearly indicates how the performance of agriculture<br />
in the <strong>region</strong> has been below expectations. Production of starch<br />
foods, cassava and sorghum have generally been encouraging but<br />
more could have been done to encourage surplus production of<br />
these two crops. More serious problems in agriculture in the<br />
<strong>region</strong> lie in the very low production of leguminous crops more<br />
specifically pigeon peas and cowpeas. The two are well adapted<br />
to Mtwara conditions. The importance of these pulses in diet<br />
formulation as sources of protein cannot be over emphasized.<br />
Good nutrition status of the expectant mothers depend more on<br />
sufficient intake of protein as the case is with young children. It is<br />
clear that production of these legumes is lagging behind <strong>region</strong>al<br />
requirement.<br />
As a result the <strong>region</strong> has been experiencing protein food scarcity<br />
in most times. This scarcity of legumes could be attributed to<br />
various limitations. It is proposed therefore that the <strong>region</strong> through<br />
its already established district programmes such as Onjama,<br />
Tutumane etc. meant to solve the problem of food in the <strong>region</strong><br />
and to raise the standard of living of the people should give special<br />
campaign on production of these legumes because of their<br />
importance as sources of protein food in the human diet.<br />
179
Rice production in the <strong>region</strong> is contributing between 4-9 percent<br />
out of the total food crops produced. More people in the <strong>region</strong><br />
are becoming consumers of rice as a staple food. However<br />
<strong>region</strong>al production of this crop is very low. Rice has had to be<br />
imported in the <strong>region</strong> to meet the demand. To attain self<br />
sufficiency in rice production in the <strong>region</strong> can only be achieved if<br />
small scale irrigation schemes complement the present production<br />
level.<br />
Mtwara <strong>region</strong>'s economy depends heavily on cashewnut<br />
production. Stabilization of the <strong>region</strong>al economy so as to<br />
increase per capita income depends much on the development of<br />
the cashewnut industry. To do this will depend on the<br />
improvement of old cashewnut trees and the planting of new and<br />
better trees. Hence investment in agricultural production inputs to<br />
improve the existing cashewnut trees and establish new plantations<br />
will stimulate the <strong>region</strong>al economy.<br />
6.2 Livestock:<br />
Given the low livestock population in the <strong>region</strong>, serious planning<br />
and determination by the <strong>region</strong> is needed in investing in this<br />
sector. There is ample room for investment opportunities in<br />
livestock through stocking up with single purpose or dual purpose<br />
cattle for meat and milk. This proposal could best be<br />
implemented and most effectively through the establishment of<br />
cattle ranches in suitable areas in the districts. Livestock<br />
expansion in the <strong>region</strong> must go hand in hand with tsetse fly<br />
control programmes aimed at reducing their number so as to give<br />
cattle greater access to pasture areas.<br />
180
181
6.3 Forestry:<br />
Forest product demand in the <strong>region</strong> is very high compared to<br />
what the <strong>region</strong> is able to supply. This include demand for<br />
fuelwood, timber and building poles. This fact implies that if no<br />
proper actions are taken to control this situation the <strong>region</strong> is<br />
bound to experience environmental destruction. The <strong>region</strong> is<br />
therefore faced with the challenge of finding a balance between the<br />
exploitation of the forest resources and their replacement.<br />
Management plans for forest resources in every district should be<br />
formulated to provide guidance required to keep exploitation<br />
within sustainable limits. Afforestation needs to go hand in hand<br />
with forest utilization.<br />
6.4 Beekeeping:<br />
Beekeeping being a tradition in Mtwara <strong>region</strong> has proved to be<br />
the kind of industry that lends itself well to self employment. More<br />
peasant farmers should be encouraged, motivated and trained for<br />
profitable beekeeping.<br />
Market research for the honey and beeswax products should<br />
be carried out in an effort to provide easy access to markets by<br />
the beekeeping households. Proper processing could be the<br />
bottleneck.<br />
6.5 Mining:<br />
182
Full mineral exploitation in Mtwara <strong>region</strong> has not been achieved<br />
as yet. Availability of full information on mineral status through<br />
proper exploration is a prerequisite. Investors in the mine sector<br />
cannot afford to over gamble. Availability of a certain level of<br />
reliable data on deposits is paramount. For this reason, in order<br />
for the <strong>region</strong> to attract investors in this sector indicative<br />
exploration needs to be carried out soonest.<br />
6.6 Industrial Development:<br />
The privatisation of cashewnut processing factories is a logical<br />
step following the wind of change from public entrepreneurship to<br />
private enterprise. The raw material is there and the market for<br />
processed nuts is good. A search for the right technology could<br />
all that is required to make cashewnut processing on factory scale<br />
profitable. Other agro-based industries such as oil milling and<br />
flour milling are suitable areas of investment especially at village<br />
level to encourage income generation and lighten the burden on<br />
women. Now that gemstone mining is gaining importance<br />
mechanisation of the mining process opens a new venue for<br />
industrialisation.<br />
6.7 Transport:<br />
Road development especially the development of a national road<br />
highway connecting the <strong>region</strong>s of Lindi and Mtwara to the capital<br />
Dar-es-Salaam is perhaps the most felt need of the southern zone.<br />
Second to this priority is the upgrading of the whole road system.<br />
Tarmac could be better, gravel roads should be extended. Earth<br />
roads should progressively be transformed to gravel standard. As<br />
183
it is now, all earth surfaced roads are impassable during the rainy<br />
season which means for 50% of the year. Road density is<br />
adequate but road quality is appalling. This jeopardises the<br />
movement of farm produce, goods, people and services between<br />
different points in the <strong>region</strong>.<br />
For the future, the development another highway to Lake Nyasa<br />
could connect up Malawi with the Mtwara port which latter is<br />
currently grossly underutilised. The construction of a bridge<br />
connecting <strong>Tanzania</strong> and Mozambique at Nengomano<br />
(Mozambique) and Mtambaswala/Masunguru (<strong>Tanzania</strong>) needs<br />
capital to open up the big potential for trade between these two<br />
countries. Investment in ferries along the Ruvuma river especial<br />
the Kilambo (<strong>Tanzania</strong>)/Namoto (Mozambique) and Maparawe<br />
(<strong>Tanzania</strong>)/Namatili (Mozambique) crossing could also boost the<br />
commercial links.<br />
6.8 Energy:<br />
The supply of electricity is much below demand. Further<br />
investment in needed to boost up the supply of electricity if the<br />
<strong>region</strong> is to attract industries and provide enough power for water<br />
supplies and other domestic needs. In the long run Mtwara and<br />
Lindi <strong>region</strong>s have to be connected to the National Grid to solve<br />
the <strong>region</strong>s' long term energy problems. The existence of gas<br />
deposits at Songo Songo in Lindi <strong>region</strong> could provide the<br />
opportunity.<br />
Oil exploration could be extended to Mtwara <strong>region</strong> especially the<br />
Msimbati bay area.<br />
184
6.9 Health:<br />
The health sector is already open for private investment. A start<br />
has been made but the pace is very slow compared to other areas<br />
in the country. In the long run this country's delivery of health care<br />
will be predominantly in the private sector. Hence, individuals,<br />
NGO's, companies and other private sector organisations are<br />
welcome to invest in the establishment and running of clinics,<br />
dispensaries, health centres and hospitals in the <strong>region</strong>. Other<br />
investment areas in the health sector are:<br />
- The training of health personnel to boost the number of<br />
trained personnel or even short courses to improve<br />
productivity of existing personnel.<br />
- The supply of drugs, vaccines, equipment and other<br />
medical supplies in order to improve the quality of medical<br />
care and so contain health problems. This is the area<br />
where even the small investor or donor can provide what<br />
little there is to give.<br />
- Technical assistance is vital particularly in the initial stages<br />
of privatisation or establishment of a major health facility<br />
or health care system.<br />
The containment of AIDS and HIV infection is a task for every<br />
one. The problem is gaining ground in Mtwara <strong>region</strong>. Health<br />
education and other preventive measures are desperately required<br />
185
now. Well wishers are welcome to play their part alongside<br />
others already on the front line.<br />
Parallel to AIDS are STDs. The <strong>region</strong> has a higher than normal<br />
level of infection of STDs. An easy access to appropriate drugs<br />
administered by qualified personnel could also have a positive<br />
impact on HIV infection. The supply of STD drugs at affordable<br />
prices or even the establishment of STD treatment centres in each<br />
ward could be the answer.<br />
6.10 Education:<br />
Like health, investment in the education sector at all levels from<br />
pre-school education to University is now open to all well wishers.<br />
There is still quite a significant portion of children of school going<br />
age who are not going to school because of distances and the<br />
quality of primary education. The average for Mtwara of the<br />
number of pupils per 1,000 population is 140 only. This means<br />
up to 100 children per 1,000 population are not going to school.<br />
The enrolment at secondary level is very, very low. Vocational<br />
training centres for youths are virtually non existent. The number<br />
and quality of primary school teachers is unsatisfactory. So there<br />
is indeed a very large area in education for an investor to choose<br />
from. The quality of primary and secondary education is low.<br />
Even assistance to existing establishment in terms of infrastructure<br />
or teaching materials will have impact in raising the standard of<br />
education.<br />
6.11 Water Supply:<br />
186
Supply against demand for safe water is quite low for both urban<br />
and rural areas. It is about 40% for rural areas and 51% for<br />
towns. The giant Makonde Plateau Water Supply system is ailing<br />
through aging pipes, equipment and a shortage of electricity. So<br />
there is little hope of raising the supply of safe water unless new<br />
investment in terms of pipes and equipment for existing piped<br />
systems and pumping equipment for deep holes and shallow wells<br />
is forthcoming. Better still investment in the development of new<br />
water systems to supplement existing' systems would do a lot of<br />
good.<br />
Shallow wells lend themselves very well for assistance even by the<br />
smaller investor.<br />
Sanitation and sewerage is critical in urban areas because of<br />
overcrowding. A look at all Mtwara towns would reveal that all<br />
are in need of investment in the field of planned central disposal of<br />
water run off and domestic sewerage.<br />
6.12 Environmental Protection:<br />
Like elsewhere in <strong>Tanzania</strong> the forest resources of Mtwara <strong>region</strong><br />
are taking a beating from demand for fuel by an increasing<br />
population. Given that Mtwara even by <strong>Tanzania</strong> standards is one<br />
of the more heavily populated <strong>region</strong>s, this pressure on the forests<br />
is more than normally damaging. Investment in afforestation is the<br />
most feasible alternative to the real threat of desertification.<br />
Increasing the access to electricity by the population can relieve<br />
some pressure on the forests. With regard to dynamite fishing<br />
damage to the coral reefs, a vigorous law enforcement regime is<br />
187
the only answer, tempered by public education backed by patrol<br />
boats.<br />
6.13 Women Development:<br />
Though a start has been made further efforts are called for to<br />
increase awareness among the <strong>region</strong>'s women population<br />
regarding gender issues and poverty alleviation. This can only be<br />
done by investment in more women groups to reach more women.<br />
The use of income generation as a motivation tool means further<br />
and more loans and training to women.<br />
6.14 Tourism and Wildlife:<br />
For optimum effect tourism and wildlife development go hand in<br />
hand. Investment in wildlife protection benefits the tourism<br />
industry. On the other hand a booming tourist trade is ample<br />
justification for wildlife protection. Mtwara <strong>region</strong> has the<br />
attractions of two wildlife rich game reserves, virgin beaches on a<br />
125 km. coast line, scenic Msimbati bay and the Mikindani<br />
historical monuments. But it needs investment in hotel<br />
accommodation, transport and access roads of acceptable<br />
standard. Cultural Tourism is another potential area for<br />
investment.<br />
188
ANNEX A<br />
MTWARA REGION IN A NUTSHELL<br />
1.0 GENERAL:<br />
1.1 Location:<br />
Southern most part of <strong>Tanzania</strong> between longitudes 38 o and<br />
40 o 30" east Greenwich, latitudes 10 o 05" and 11 o 25" south<br />
of the Equator.<br />
1.2 Land Frontiers:<br />
North - Lindi Region<br />
East - Indian Ocean<br />
South - Mozambique<br />
West - Ruvuma Region<br />
1.3 Land Area:<br />
Land area 16,720 sq. kms. or 1.9% of <strong>Tanzania</strong> Mainland.<br />
Smallest <strong>region</strong> of <strong>Tanzania</strong> Mainland after Kilimanjaro.<br />
Some minor lakes.<br />
1.4 Administrative Units:<br />
- 5 districts of Mtwara/Mikindani Urban, Mtwara<br />
Rural, Masasi, Newala, Tandahimba.<br />
- 21 divisions<br />
- 98 wards<br />
- 554 villages.<br />
189
190
1.5 Population:<br />
(a)<br />
Population 1988 Census<br />
Total = 875,977<br />
Sex ratio = 91.9<br />
Growth rate = 1.4%<br />
Population density = 52.4 per sq. km.<br />
Average household size = 4.4<br />
Net lifetime Migration = -98,689<br />
Urbanization = 14.3%<br />
(b)<br />
Population Projections<br />
1996 A.D. 2000 A.D.<br />
Total = 1,005,405 1,078,848<br />
Density = 60.1/km 2 64.5/km 2<br />
(c)<br />
Other Censuses<br />
1.6 Ethnicity:<br />
1978 - Total Population: 771,818<br />
1967 - Total Population: 621,293<br />
Bantu groups indigenous to area:<br />
Makonde = Newala, Tandahimba, Masasi and<br />
Mtwara Rural.<br />
Makua = Masasi and Mtwara Rural.<br />
Yao = Masasi.<br />
191
1.7 Climate:<br />
Rainfall November/December to April/May. Single peaked<br />
in January. 830 mm. to 1120 mm per annum rising with<br />
elevation. Temperatures moderated by Indian Ocean.<br />
High of 27 o C at Coast in December down to 23 o C in July.<br />
1.8 Agro-Ecological Zones:<br />
Zone I: South half of Mtwara Rural and South-East of<br />
Newala<br />
1000 mm rainfall. Monomodal. 6 months<br />
growing season. Low altitude, Soils of low<br />
fertility.<br />
Zone II:<br />
North half of Mtwara Rural<br />
600 mm. rainfall. Monomodal. 6 months<br />
growing season. Mid altitude. Soils of low<br />
fertility but with medium moisture retaining<br />
capacity.<br />
Zone III:<br />
The Whole of Masasi (except northern<br />
part) North and West parts of Newala<br />
600 mm to 1000 mm. rainfall. Monomodal.<br />
5 months growing season. Low altitude.<br />
Soils of low fertility.<br />
Zone IV:<br />
The South - East of Mtwara Rural<br />
192
Over 600 mm rainfall. Bimodal. 7 months<br />
growing season. Low altitude. Soils of<br />
high fertility and alluvial origin.<br />
2.0 ECONOMIC INFRASTRUCTURE:<br />
2.1 Roads:<br />
= 5,596 kms: 135 kms. tarmac, 60 kms gravel and 5401 kms<br />
earth<br />
= Road density: 0.335 km/km 2 .<br />
= Seasonal.<br />
2.2 Airservices:<br />
= Major airport at Mtwara capable Boeing 737 commercial<br />
traffic.<br />
= One other airport at Masasi and an airstrip at Newala.<br />
2.3 Marine Transport:<br />
= One major port with deep water berths, capable of<br />
400,000 tons per year.<br />
= Regular boat services to Dar-es-Salaam of doubtful<br />
reliability.<br />
2.4 Electricity (1988):<br />
Urban areas: Coverage 18,170 people of 14.5% of urban<br />
population.<br />
Rural areas: Coverage 3,745 people or 0.5% of rural<br />
population.<br />
3.0 BASIC SOCIAL FACILITIES<br />
193
3.1 Health 1996<br />
Hospital: 3 public 1 Private Total 4<br />
Health Centres: 12 public 2 private Total 14<br />
Dispensaries: 108 public 18 private Total 126.<br />
MCH Clinics: 133 all public.<br />
3.2 Education (1996):<br />
Pre-Schools Number:<br />
Enrolment:<br />
117 all private<br />
2,922 boys<br />
2,996 girls<br />
5,918 total.<br />
Primary Schools Number: 493<br />
Enrolment: 141,167<br />
Secondary Schools Number: 13<br />
Enrolment: I-IV: 4,143<br />
V-VI: 162<br />
3.3. Water:<br />
(a)<br />
(b)<br />
Rural Water Supplies<br />
Working Not working Total<br />
Piped Systems 4 16 20<br />
Makonde Plateau<br />
System for Newala 40% 60% 100%<br />
and Tandahimba.<br />
Bore holes 19 26 45<br />
Shallow Wells 621 284 905<br />
Dams 4 2 6<br />
Urban Water Supplies<br />
Bore holes 14 - 14<br />
194
Shallow Wells 50 - 50<br />
Springs 3 -<br />
Dams 1 -<br />
3<br />
1<br />
195
4.0 PRODUCTIVE SECTOR FACILITIES<br />
4.1 Agriculture (1996)<br />
600,000 ha. arable land<br />
270,300 ha. under cultivation.<br />
4.2 Livestock<br />
a) Livestock Units (1994)<br />
Cattle = 19,700<br />
goats/sheep = 164,000<br />
Pigs = 6,000<br />
Poultry = 3.2 million<br />
b) Livestock facilities (1985)<br />
= 30 dips<br />
= 20 crushes<br />
= 1 livestock research centre<br />
5.0 SELECTED SOCIAL/ECONOMIC/INDICATORS (1996)<br />
5.1 Education (Primary)<br />
Population 2,039<br />
Pupils per 1,000 population 140<br />
Pupils per school 286<br />
Pupils per classroom 48<br />
Pupils per teacher 35<br />
Pupils per stream 33<br />
% shortage of teacher to requirements 13<br />
% shortage of teacher homes to<br />
requirements 87<br />
% shortage of school toilets to<br />
requirements 91<br />
196
% shortage of classrooms to<br />
requirements 68<br />
5.2 Education (Secondary)<br />
Population per school 76,256<br />
Pupils per 10,000 people<br />
"O" level 42.0<br />
"A" level 1.6<br />
Pupils per teacher<br />
Public schools 16<br />
Private schools 29<br />
5.3 Adult literacy<br />
1967 28%<br />
1978 51.4%<br />
1988 57.1%<br />
5.4 Health<br />
a) Facilities<br />
Population per hospital 251,351<br />
Population per dispensary 7,979<br />
Population per hospital bed 690<br />
Population per facility 6,982<br />
Facilities per 10,000 people 1.7<br />
b) Services<br />
< 1 Child Immunisation Coverage<br />
BCG = 88.3%<br />
DTP 3 = 82.2%<br />
Polio 3 = 83.1%<br />
Measles = 83.5%<br />
< 5 Child Immunisation Coverage: 68.2%<br />
Two or more T.T. vaccinations for women 39.8%<br />
197
c) Basic Indicators<br />
Infant Mortality Rate (IMR)<br />
1978 161<br />
1988 138<br />
1995 (Est) 119<br />
1988 IMR<br />
Rural 143<br />
Urban 108<br />
Male 141<br />
Female 134<br />
Underfive Mortality Rate (U5MR)<br />
1978 269<br />
1988 233<br />
1995 (Est) 202<br />
1988 U5MR<br />
Rural 241<br />
Urban 180<br />
Male 238<br />
Female 227<br />
Maternal Mortality Rate (MMR)<br />
1992 264<br />
1993 212<br />
1994 161<br />
1995 252<br />
Life Expectancy<br />
1978 male 40 years<br />
1978 female 46 years<br />
1988 male 45 years<br />
1988 female 48 years<br />
Aacquired Immunity Defficiency Syndrom (AIDS)<br />
198
Rate of AIDS per 100,000 population = 242<br />
5.5 Water<br />
Supply of safe water against demand:<br />
Rural areas<br />
Mtwara Rural district 44%<br />
Masasi district 41%<br />
Newala/Tandahimba district 40%<br />
Urban areas<br />
Mtwara town 56%<br />
Mikindani town 27%<br />
Masasi town 45%<br />
Newala town 25%<br />
Regional Total 49%<br />
5.6 Sanitation (1988)<br />
Population covered with toilet facilities:<br />
Rural Areas = 88.1%<br />
Urban Areas = 94.4%<br />
Regional average = 89.0%<br />
5.7 Regional Economy<br />
a) Regional GDP at current Prices (Millions)<br />
Tshs. US$<br />
1980 1,099 134<br />
1985 2,890 175<br />
1990 22,975 117<br />
1994 62,491 113<br />
b) Regional GDP per Capita (Current Prices)<br />
Tshs. US$<br />
1980 1,385 168<br />
1985 3,397 206<br />
199
1990 24,481 124<br />
1994 59,533 108<br />
6.0 OTHER ISSUES<br />
a) Women Income Generation/Gender Issue<br />
Groups<br />
Groups 459<br />
Members 6,452<br />
b) Youth <strong>economic</strong> groups<br />
Groups 94<br />
c) Tourist attractions<br />
= Msanjesi Game Reserve<br />
= Lukwika/Lumesule Game Reserve<br />
= Ruvuma River<br />
= 125 kms. coast line<br />
= Msimbati bay<br />
= Mikindani Historical Monuments.<br />
200
ANNEX B<br />
MTWARA/MIKINDANI DISTRICT SUMMARY (1996)<br />
1.0 GENERAL:<br />
1.1 Location/Borders<br />
An eastern enclave on Indian Ocean Coast.<br />
North and East - Indian Ocean<br />
West, South, North - Mtwara Rural.<br />
1.2 Land Area<br />
Land = 163 sq. kms.<br />
= No large water body.<br />
= 1.0% <strong>region</strong>al land area.<br />
1.3 Administrative Units<br />
Division = 2<br />
Wards = 13<br />
Villages = 6<br />
1.4 Population<br />
(a) Population 1988 Census<br />
Total = 75,857<br />
Sex Ratio = 103.8<br />
Growth rate = See Mtwara Rural<br />
Population density = 745.1/km 2<br />
% Urban Population = 87.6<br />
Average household size:<br />
Urban = 4.2<br />
Rural = 4.5<br />
District = 4.3<br />
201
(b)<br />
Population Projections<br />
1996 A.D. 2000 A.D.<br />
Total 103,815 121,449<br />
Density 636.9/Km 2 745.1/km 2<br />
(c)<br />
Other Census<br />
1967 1978<br />
Total Population = 48,491<br />
Growth Rate 1967/78 (See Mtwara Rural)<br />
Sex Ratio = 102.8<br />
% Urban Population = 100<br />
1.5 Ethnicity (indigenous)<br />
Bantu mainly but mixed including Makonde, Makua and<br />
Yao.<br />
2.0 ECONOMIC INFRASTRUCTURE:<br />
(a)<br />
(b)<br />
Roads<br />
See Mtwara Rural District.<br />
Marine/Air Transport Services<br />
One major Marine port<br />
One major Air port<br />
One minor port at Mikindani<br />
(c) Electricity (1988)<br />
Access to Electricity:<br />
Households = 21.7%<br />
Population = 23.3%<br />
202
3.0 BASIC SOCIAL FACILITIES:<br />
3.1 Health<br />
Hospitals = 1<br />
Health Centres = Nil<br />
Dispensaries = 17<br />
MCH Clinics = 11<br />
3.2 Education<br />
Pre-Schools<br />
Number = 10<br />
Total emolment = 467<br />
Primary Schools<br />
Number = 19<br />
Total emolment = 10,461<br />
3.3 Water<br />
Urban Water Supplies<br />
9 deep wells<br />
1 spring.<br />
4.0 SELECTED SOCIAL/ECONOMIC INDICATORS<br />
4.1 Education (Primary)<br />
Population per school : 5,464<br />
Pupils per 1000 population : 101<br />
Pupils per school : 551<br />
Pupils per classroom : 64<br />
Pupils per stream : 43<br />
Pupils per teacher : 31<br />
% Surplus of teachers to requirements: 6<br />
% Shortage of teacher houses to requirements: 90<br />
% Shortage of classrooms to requirements: 28<br />
4.2 Health<br />
203
(a)<br />
(b)<br />
Facilities<br />
Population per dispensary 6,107<br />
Population per facility 5,768<br />
Facilities per 10,000 people 1.7<br />
Services<br />
Under One Children Immunisation Coverage<br />
BCG = 76.6%<br />
DPT3 = 69.3%<br />
Polio 3 = 70.0%<br />
Measles = 71.6%<br />
Under Five Children Immunisation Coverage = 52.7%<br />
Two or more T.T. Vaccinations for Women = 24.4%<br />
4.3 Water<br />
Supply of water against demand<br />
Mtwara town = 56%<br />
Mikindani town = 27%<br />
4.4. Sanitation<br />
Population Covered by Toilet Facilities (1988)<br />
Rural areas = 84.2%<br />
Urban areas = 92.3%<br />
District average = 91.3%<br />
5.0 OTHER ISSUES:<br />
(a) Women Groups<br />
Number = 113<br />
Members = 1,453<br />
(b)<br />
(c)<br />
Youth Groups<br />
Number = 14<br />
Tourist Attractions<br />
204
= Msimbati bay<br />
= Mikindani Historical Monuments<br />
= Coast Line.<br />
205
ANNEX C<br />
MTWARA RURAL DISTRICT SUMMARY (1996)<br />
1.0 GENERAL<br />
1.1 Location/borders<br />
Eastern part of the <strong>region</strong><br />
North - Lindi <strong>region</strong><br />
East - Indian Ocean<br />
- Mtwara/Mikindani district<br />
South - Ruvuma River/Mozambique<br />
West - Newala district.<br />
1.2 Land Area<br />
Land = 3,597 sq.kms.<br />
= No large water body<br />
= 21.5% <strong>region</strong>al land area.<br />
1.3 Administrative Units<br />
Divisions = 6<br />
Wards = 17<br />
Villages = 101<br />
1.4 Population<br />
(a) Population 1988 Census<br />
Total = 168,189<br />
Sex Ratio = 91.4<br />
Growth Rate = 2.4%(includes Mtwara/Mikindani)<br />
Population density = 56.6/km 2<br />
% Urban population = 3.9<br />
Average household size<br />
Urban = 4.3<br />
Rural = 4.5<br />
206
(b)<br />
(c)<br />
District = 4.5<br />
Population Projections<br />
1996 A.D. 2000 A.D<br />
Total 190.962 203,480<br />
Density 53.1/km 2 56.6/km 2<br />
Other Censuses<br />
1967 1978<br />
Total Population = 144,033<br />
Growth Rate 67/78 (Includes Mtwara/<br />
Mikindani) = 2.2%<br />
Sex Ratio = 94.8<br />
% Urban Population = 0.0%<br />
1.5 Ethnicity (indigenous)<br />
Bantu mainly : Makonde and Makua.<br />
2.0 ECONOMIC INFRASTRUCTURE<br />
(a)<br />
(b)<br />
Roads (Includes Mtwara/Mikindani)<br />
53 kms Tarmac<br />
20 kms Gravel<br />
880 kms Earth<br />
953 kms Total<br />
Road density - 0.253 km/km 2 .<br />
Marine/Air Transport Services<br />
None<br />
(c) Electricity (1988)<br />
Access to electricity:<br />
Households - 0.6%<br />
Population - 0.6%<br />
207
208
3.0 BASIC SOCIAL FACILITIES<br />
3.1 Health<br />
Hospitals - Nil<br />
Health Centres - 4<br />
dispensaries - 28<br />
MCH clinics - 33<br />
3.2 Education<br />
Pre-Schools<br />
Number - 20<br />
Total enrolment - 1004<br />
Primary Schools<br />
number - 82<br />
total enrolment - 19,785<br />
3.3. Water<br />
Rural Water Supplies<br />
Working notworking Total<br />
Piped Systems 4 16 20<br />
Bore Holes 19 26 45<br />
Shallow wells 206 134 340<br />
4.0 PRODUCTIVE SECTOR FACILITIES<br />
Livestock Units (1985) includes Mtwara/Mikindani<br />
cattle - 2,820<br />
Goats - 14,919<br />
Sheep - 3,382<br />
Pigs - 151<br />
Poultry - 106,000<br />
209
5.0 SELECTED SOCIAL/ECONOMIC INDICATORS<br />
5.1 Education (Primary)<br />
Poppulation per school : 2,329<br />
Pupils per 100 population : 104<br />
Pupils per school : 241<br />
Pupils per classroom : 45<br />
Pupils per stream : 33<br />
Pupils per teacher : 35<br />
% shortage of teachers to requirements : 5<br />
% shortage of teacher houses to requirements 90<br />
% shortage of classrooms to requirements: 59<br />
5.2 Health<br />
a) Facilities<br />
Popualtion per dispensary: 6,820<br />
Population per facility 5,968<br />
Facilities per 10,000 people 1.7<br />
b) Services<br />
Under one children immunisation coverage<br />
BCG - 90<br />
DPT3 - 73.1%<br />
PORIO - 76.2%<br />
Measles - 71.5%<br />
Under five children Immunization Coverage 56.6%<br />
Two or more T.T. Vaccinations for women 26.2%<br />
5.3 Water<br />
Supply of water against demand<br />
Mtwara rural district 44%<br />
210
5.4 Sanitation<br />
Population covered by toilet facilities (1988)<br />
Rural areas = 77.6%<br />
Urban areas = 96.4%<br />
District average = 78.4%<br />
6.0 OTHER ISSUES<br />
(a)<br />
(b)<br />
(c)<br />
Women groups<br />
Number = 52<br />
Members = 1,225<br />
Youth groups<br />
Number = 22<br />
Tourist Attractions<br />
= Ruvuma River<br />
= Coast line.<br />
211
1.0 GENERAL<br />
ANNEX D<br />
NEWALA DISTRICT SUMMARY<br />
(Including Tandahimba 1996)<br />
1.1 Location/Borders<br />
Middle of the <strong>region</strong>:<br />
North East - Lindi Region<br />
North West - Masasi District<br />
East - Mtwara Rural District<br />
South - Ruvuma River/Mozambique<br />
West - Masasi District.<br />
1.2 Land Area<br />
Land = 4,020 sq. kms.<br />
= No large water body<br />
= 24.0% of <strong>region</strong>al land area.<br />
1.3 Administrative Units<br />
Division = 6<br />
Wards = 38<br />
Villages = 233<br />
1.4 Population<br />
(a)<br />
Population 1988 Census<br />
Total = 301,247<br />
Sex Ratio = 85.5<br />
Growth Rate = 1.0%<br />
Population density = 74.9/km 2<br />
212
% Urban population = 8.5<br />
Average household size<br />
Urban = 4.4<br />
Rural = 4.5<br />
District = 4.5<br />
(b)<br />
(c)<br />
Population Projections<br />
1996 A.D. 2000 A.D.<br />
Total 326,207 339,439<br />
Density 81.1/km 2 84.4/km 2<br />
Other Censuses<br />
1967 1978<br />
Total Population = 307,385<br />
Growth Rate 67/68 = 1.1<br />
Sex Ratio = 94.8<br />
%Urban Population = 10.0<br />
1.5 Ethnicity (indigenous):<br />
Bantu mainly: Makonde.<br />
2.0 ECONOMIC INFRASTRUCTURE<br />
(a) Roads<br />
1.5 kms Tarmac<br />
1081 kms Earth<br />
1082.5 kms Total<br />
Road density = 0.269 kms/km 2<br />
(b)<br />
Marine/Air Transport Services<br />
One airstrip.<br />
(c) Electricity (1988)<br />
213
Access to electricity<br />
Households = 2.1%<br />
Population = 2.5%<br />
3.0 BASIC SOCIAL FACILITIES<br />
3.1 Health<br />
Hospitals = 1<br />
Health Centres = 6<br />
Dispensaries = 39<br />
MCH Clinics = 46<br />
3.2 Education<br />
Pre-Schools<br />
Number = 50<br />
Total enrolment = 2,093<br />
Primary Schools<br />
Number = 199<br />
Total emolment = 49,348<br />
3.3 Water<br />
Both rural and urban areas supplied from electricity<br />
powered Makonde Plateau Water Supply system.<br />
4.0 PRODUCTIVE SECTOR FACILITIES<br />
Livestock Units (1985)<br />
Cattle = 2,621<br />
Goats = 67,947<br />
Sheep = 2,346<br />
Pigs = 186<br />
214
Poultry 1.2 million<br />
215
5.0 SELECTED SOCIAL/ECONOMIC INDICATORS<br />
5.1 Education (Primary)<br />
Population per school - 1,639<br />
Pupils per 1,000 population - 151<br />
Pupils per school - 248<br />
Pupils per classroom - 64<br />
Pupils per stream - 32<br />
Pupils per teacher - 31<br />
% shortage of teachers to requirement :4<br />
% shortage teacher houses to requirements :81<br />
% shortage of classrooms to requirements :78<br />
5.2 Health<br />
a) Facilities<br />
Population per dispensary : 8,364<br />
Population per facility : 7,091<br />
Facilities per 10,000 people : 1.4<br />
b) Services<br />
Under one children Immunization Coverage<br />
BCG - 85.6%<br />
DPT3 - 97.0%<br />
Polio3 - 96.2%<br />
Measles 97.2%<br />
Under five children Immunization Coverage - 51.8%<br />
Two or more T.T. vaccination for women -<br />
5<br />
7<br />
.<br />
7<br />
%<br />
216
5.3 Water<br />
Supply of water against demand<br />
rural areas - 40%<br />
Newala town - 25%<br />
5.4 Sanitation<br />
Population covered by toilet facilities (1988)<br />
rural areas - 92.9%<br />
urban areas - 96.4%<br />
District average 93.2%<br />
6.0 OTHER ISSUES<br />
a) Women Groups<br />
member - 228<br />
members - 1,825<br />
b) Youth groups<br />
number - 30<br />
c) Tourist Attractions<br />
Ruvuma river<br />
217
ANNEX E<br />
MASASI DISTRICT SUMMARY<br />
1.0 GENERAL<br />
1.1. Location/borders<br />
Western area of the <strong>region</strong><br />
North-Lindi <strong>region</strong><br />
East-newala district<br />
South-Ruvuma River/Mozambique<br />
West-Ruvuma <strong>region</strong><br />
1.2 Land Area<br />
Land - 8,940 sq km<br />
- no large water body<br />
- 53.5 of <strong>region</strong>al land area<br />
1.3 Administrative Units<br />
Divisions - 7<br />
Wards - 30<br />
Villages - 214<br />
1.4 Population<br />
Population 1988 Census<br />
Total - 330,684<br />
Sex Ratio 93.6<br />
Population density 46.4 /km 2 .<br />
% urban population 8.0<br />
Average household size<br />
Urban - 4.2<br />
Rural - 4.3<br />
District - 4.3<br />
218
) Population projections<br />
1996 A.D. 2000 A.D.<br />
Total 384,421 414,480<br />
Density 43.0 / km 2 46.4/km 2<br />
(c)<br />
Other Censuses<br />
1967 1978<br />
Total Population = 271,909<br />
Growth Rate 67/78 = 2.2%<br />
Sex Ratio = 95.4<br />
% Urban Population = 4.8<br />
1.5 Ethnicity (indigenous)<br />
Bantu mainly: Makua and Yao.<br />
2.0 ECONOMIC INFRASTRUCTURE:<br />
(a)<br />
(b)<br />
Roads<br />
80 kms Tarmac<br />
40 kms Gravel<br />
3,440 kms Earth<br />
3,560 kms. Total<br />
Road density = 0.398 kms/km 2<br />
Marine/Air Transport Services<br />
One air port.<br />
(c) Electricity (1988)<br />
Access to electricity:<br />
Households = 7.0%<br />
Population = 7.7%<br />
219
3.0 BASIC SOCIAL FACILITIES:<br />
3.1 Health<br />
Hospitals = 2<br />
Health Centres = 4<br />
Dispensaries = 42<br />
MCH Clinics = 43<br />
3.2 Education<br />
3.3 Water<br />
Pre-Schools<br />
Number = 37<br />
Total enrolment = 2,354<br />
Primary Schools<br />
Number = 193<br />
Total enrolment = 61,573<br />
(a)<br />
Rural Water Supplies<br />
Working Not Working Total<br />
Piped systems - - -<br />
Boreholes - - -<br />
Shallow wells 415 150 565<br />
Dams - - -<br />
(b)<br />
Urban Water Supplies (Masasi town)<br />
1 Dam<br />
5 Deep wells<br />
50 Shallow wells.<br />
220
221
4.0 PRODUCTIVE SECTOR FACILITIES<br />
Livestock Units (1985)<br />
Cattle = 9,022<br />
Goats = 4,598<br />
Sheep = 7,746<br />
Pigs = 4,252<br />
Poultry = 1.3 million.<br />
5.0 SELECTED SOCIAL/ECONOMIC INDICATORS<br />
5.1 Education (Primary)<br />
Population per school: 1,992<br />
Pupils per 1000 population: 160<br />
Pupils per school: 319<br />
Pupils per classroom: 53<br />
Pupils per stream: 33<br />
Pupils per teacher: 39<br />
% Shortage of teachers to requirements: 13<br />
% Shortage of teacher houses to requirements: 92<br />
% Shortage of classrooms to requirements: 68<br />
5.2 Health:<br />
a) Facilities<br />
Population per dispensary: 9,153<br />
Population per facility: 8,009<br />
Facility per 10,000 people: 1.2<br />
(b)<br />
Services<br />
Under One Children Immunisation Coverage<br />
BCG = 91.6%<br />
DPT3 = 78.0%<br />
Polio 3 = 80.0%<br />
Measles = 81.2%<br />
222
Under Five Children Immunisation Coverage = 90.5%<br />
Two or More T.T. Vaccinations for Women = 35.7%<br />
5.3 Water:<br />
Supply of water against demand.<br />
Rural areas: 41%<br />
Masasi town: 45%<br />
5.4 Sanitation:<br />
Population Coverage by toilet facilities (1988)<br />
Rural areas = 89.5%<br />
Urban areas = 96.9%<br />
District average = 90.1%<br />
6.0 OTHER ISSUES:<br />
(a)<br />
(b)<br />
(c)<br />
Women groups<br />
Number = 66<br />
Members = 1,949<br />
Youth groups<br />
Number = 28<br />
Tourist Attractions<br />
= Msanje Game Reserve<br />
= Lukwika/Lumesule Game Reserve<br />
= Ruvuma river.<br />
223
ANNEX H<br />
1.0 GENERAL INFORMATION ABOUT TANZANIA<br />
Location: (29 0 E-41 0 ; 1 0 S - 12 0 S)<br />
Land Frontiers:<br />
To the North:<br />
To West:<br />
To South:<br />
To East:<br />
Kenya and Uganda<br />
Burundi, Rwanda and Zaire<br />
Zambia, Malawi and Mozambique<br />
Indian Ocean<br />
AREA OF MAINLAND<br />
Land area<br />
881,289 Sq.Km.<br />
Water area (Inland) 61,495 Sq.Km.<br />
<strong>Tanzania</strong> area 942,784 Sq.Km.<br />
TANZANIA MAINLAND AREA BY REGIONS (SQ KM)<br />
Total 942,784<br />
Arusha 84,567 Morogoro 70,799<br />
Coast 32,407 Mwanza 35,248<br />
Dodoma 41,311 Lindi 66,046<br />
Iringa 58,936 D'Salaam 1,393<br />
Kigoma 45,066 Rukwa 75,240<br />
Kagera 39,627 Ruvuma 66,477<br />
Kilimanjaro 13,309 Shinyanga 50,781<br />
Mara 30,150 Singida 49,341<br />
Mbeya 62,420 Tabora 76,151<br />
224
Population<br />
Mtwara 16,707 Tanga 26,808<br />
TOTAL POPULATION AND LIFE EXPECTANCY FOR TANZANIA - BY<br />
REGIONS, 1967, 1978, 1988, 1996:<br />
REGION<br />
TOTAL POPULATION LIFE EXP. 1988<br />
1967 (No.) 1978 (No.) 1988<br />
('000)<br />
1996**<br />
('000)<br />
M<br />
Yrs<br />
W Yrs<br />
Dodoma<br />
Arusha<br />
Kilimanjaro<br />
Tanga<br />
Morogoro<br />
Coast<br />
Dar es Salaam<br />
Lindi<br />
Mtwara<br />
Ruvuma<br />
Iringa<br />
Mbeya<br />
Singida<br />
Tabora<br />
Rukwa<br />
Kigoma<br />
Shinyanga<br />
Kagera<br />
Mwanza<br />
Mara<br />
709,380<br />
610,474<br />
652,722<br />
771,060<br />
682,700<br />
428,041<br />
356,286<br />
419,853<br />
621,293<br />
395,447<br />
689,905<br />
753,765<br />
457,938<br />
502,068<br />
276,091<br />
473,443<br />
899,468<br />
658,712<br />
1,055,883<br />
544,125<br />
972,005<br />
926,223<br />
902,437<br />
1,037,767<br />
939,264<br />
516,586<br />
843,090<br />
527,624<br />
771,818<br />
561,575<br />
925,044<br />
1,079,864<br />
613,949<br />
817,907<br />
451,897<br />
648,941<br />
1,323,535<br />
1,009,767<br />
1,443,379<br />
723,827<br />
1,234.9<br />
1,348.4<br />
1,106.0<br />
1,307.3<br />
1,254.0<br />
636.5<br />
1,357.6<br />
645.0<br />
887.4<br />
781.4<br />
1,206.0<br />
1,472.7<br />
789.9<br />
1,033.8<br />
693.3<br />
857.8<br />
1,768.6<br />
1,358.8<br />
1,874.4<br />
968.6<br />
1,472.5<br />
1,784.0<br />
1,703.5<br />
1,521.8<br />
1,519.4<br />
740.9<br />
1,945.7<br />
744.8<br />
976.7<br />
1,001.3<br />
1,472.9<br />
1,857.0<br />
949.4<br />
1,232.6<br />
954.7<br />
1,047.6<br />
2,194.83<br />
1,659.5<br />
2,270.9<br />
1,202.0<br />
57<br />
46<br />
50<br />
45<br />
44<br />
44<br />
47<br />
57<br />
46<br />
46<br />
45<br />
45<br />
44<br />
46<br />
44<br />
48<br />
48<br />
54<br />
53<br />
48<br />
58<br />
51<br />
50<br />
47<br />
47<br />
45<br />
49<br />
62<br />
48<br />
48<br />
48<br />
48<br />
48<br />
50<br />
47<br />
50<br />
51<br />
55<br />
54<br />
51<br />
<strong>Tanzania</strong> Mainland 11,958,654 17,036,499 22,582.4 28,252.2 49 51<br />
Zanzibar North<br />
Zanzibar South<br />
Zanzibar Urban<br />
Pemba<br />
Pemba<br />
56,360<br />
39,087<br />
95,047<br />
72,015<br />
92,306<br />
77,017<br />
51,749<br />
142,041<br />
106,290<br />
99,014<br />
97.1<br />
70.2<br />
208.4<br />
137.4<br />
127.7<br />
119.0<br />
91.8<br />
290.4<br />
172.6<br />
160.4<br />
46<br />
45<br />
46<br />
46<br />
45<br />
47<br />
50<br />
52<br />
48<br />
50<br />
Zanzibal Is. 354,815 476,111 640.7 834.2 46 49<br />
<strong>Tanzania</strong> United Rep. 12,313,469 17,512,610 23,223.1 29,086.4 47 50<br />
225
Note: The projections are based on the national Population Census of 1988, and the<br />
calculated growth rates since the 1978 census.<br />
Source: Bureau of Statistics.<br />
Land Use<br />
(Ha. millions) Proportion<br />
Small holder cultivation 4.1 5%<br />
Large scale agriculture 1.1 1%<br />
Grazing Land 35.0 39%<br />
Forest and Wood Lands 44.0 50%<br />
Other Lands 4.4 5%<br />
Total 88.6 100%<br />
Arable Land:<br />
Arable Land (Ha) 3,634,000<br />
Lakes<br />
Victoria<br />
Tanganyika<br />
Nyasa<br />
Rukwa<br />
Eyasi<br />
Natron<br />
Manyara<br />
34,850 sq km<br />
13,350 sq km<br />
5,600 sq km<br />
2,850 sq km<br />
1,050 sq km<br />
900 sq km<br />
320 sq km<br />
Mountain summits (metres above sea level)<br />
Kilimanjaro 5,895<br />
Meru 4,566<br />
226
Climate<br />
(a)<br />
Rainfall<br />
Main rain season on the coast is between March and May<br />
and the second season is between October and<br />
December. Rainfall is well distributed throughout the year<br />
but there is a peak during March and May.<br />
Average maximum temperature (degrees centigrade)<br />
Jan. Apr. July October<br />
Dar es Salaam 31.6 30.1 28.6 31.3<br />
Arusha 28.9 25.3 21.1 27.3<br />
Dodoma 31.4 28.4 26.0 30.2<br />
Average manimum tempereture (degrees centigrade)<br />
Jan. Apr. July October<br />
Dar es Salaam 23.3 22.9 18.3 31.3<br />
Arusha 12.2 16.9 12.6 27.3<br />
Dodoma 19.2 13.5 16.2 30.2<br />
Gross Domestic Product at factor cost (billion Shs.) 1992.<br />
At current price 688.0<br />
At constant prices 32.2<br />
GDP growth rate at 1976 prices 1985-92 3.69%<br />
Per capita 27,355<br />
At current price 27,355<br />
At constant price 1,280<br />
227
1.2 SOCIAL SERVICES<br />
HEALTH FACILITIES<br />
YEAR HOSPITALS RHC DISPENSARIES<br />
1960 98 22 975<br />
1980 149 239 2,600<br />
1990 173 276 3,014<br />
Education: Enrollment rates 1995 compared with<br />
other East Africa countries<br />
COUNTRY<br />
GROSS ENROLLMENT<br />
PRIMARY<br />
SECONDARY<br />
KENYA<br />
UGANDA<br />
TANZANIA<br />
94<br />
76<br />
67<br />
28<br />
20<br />
13<br />
228
NATIONAL PARKS<br />
National Parks (area in sq km)<br />
PARK<br />
(i) SERENGETI<br />
NATIONAL<br />
PARK<br />
LOCATION AND PARTICULARS<br />
LOCATION: At the border of Arusha & Mara Region, about<br />
32 km from Arusha town<br />
AREA SIZE: 14,763 square km. It is the largest and oldest<br />
Park in <strong>Tanzania</strong> having been established under the British<br />
Colony in 195l. It contains the greatest and most spectacular<br />
concentration of plain animals left any where in Africa.<br />
MAJOR ATTRACTIONS: Wildebeest about 1.7 million,<br />
Lions 3,000. About 35 species of animals and 500 species of<br />
birds, Buffalos, Chetah, Leopards etc.<br />
(ii) LAKE<br />
MANYARA<br />
NATIONAL<br />
PARK<br />
LOCATION: Some 125 Kilometres South West of Arusha<br />
town. It was officially established and gazzetted as a National<br />
Park in 1960.<br />
AREA: Lake Manyara National Park covers a total area of<br />
320 square kilometres, 230 kilometres constituting Lake<br />
Manyara itself.<br />
MAJOR ATTRACTIONS: The Rift Valley edge on the West<br />
with the vast lake underneath. Natural forest with many<br />
natural rivers and springs.<br />
Tree-climbing lions, various species of animals plus about 360<br />
species of birds, Elephants, Hippos, Leopards, Baboons etc.<br />
(iii) TARANGIRE<br />
NATIONAL<br />
PARK<br />
LOCATION: South of Arusha town along the Dodoma<br />
Highway. It was established in l970.<br />
AREA: Tarangire National Park covers some 2,600 Square<br />
kilometres.<br />
MAJOR ATTRACTIONS: Tree climbing pythons, zebra,<br />
kongoni, elephant, buffalo, waterbuck, gazettes and oryx.<br />
229
(iv)ARUSHA<br />
NATIONAL<br />
PARK<br />
(MOMELA)<br />
LOCATION: The Park is located between Mount Meru and<br />
Mount Kilimanjaro. Formally Ngudoto National Park until<br />
1967. Was commissioned as National Park in 1960.<br />
AREA: The park covers some 137 square Kilometres.<br />
MAJOR ATTRACTIONS: Ngurdoto Crater, Lake Momella,<br />
Mount Meru and the Natural Momela Forests. There are<br />
many species of Animals and birds. The most common being<br />
African elephant, colobus and velvet monkey, hippo, duicker<br />
and a number of bird species.<br />
(v)KILIMANJAR<br />
O NATIONAL<br />
PARK<br />
LOCATION: The Kilimanjaro National Park which derived<br />
its name from Mount Kilimanjaro is part and parcel of the<br />
Mountain. It was established in 1973.<br />
AREA: The bounderies of the Park include the natural forest<br />
under and around the Mountain. It covers some 760 square<br />
Kilometres.<br />
MAJOR ATTRACTIONS: Mount Kilimanjaro with its three<br />
peaks Shira (3,962 metres) Mawenzi and Kibo (5,149 and<br />
5,895 metres respectively) above sea level form the largest<br />
part of the Park's attraction. There are also various species of<br />
Animals, plants and birds.<br />
(vi)MIKUMI<br />
NATIONAL<br />
PARK<br />
LOCATION: It is situated some 216 km along the Dar -<br />
Zambia Highway. It was established in 1964.<br />
AREA: Mikumi National Park which borders with Africa's<br />
largest Game reserve, the Selous is the third biggest National<br />
Park after Serengeti and Ruaha National Park and covers 3230<br />
sq km.<br />
MAJOR ATTRACTIONS: The plains sorrounding River<br />
Mkata which are rich in flora and fauna are by themselves a<br />
wonderful scenarial. The common animals found in the park<br />
include zebra, buffalos, elephants, Hippos, lions and the<br />
Impalas.<br />
230
(vii)UDZUNGWA<br />
NATIONAL<br />
PARK<br />
LOCATION: This Park is located South of Mikumi National<br />
Park along the Mikumi-Ifakara Highway. The Park was<br />
established in 1992.<br />
AREA: The Park which derives its identity from the famous<br />
Udzungwa mountain has an area of 1990 square kilometres.<br />
MAJOR ATTRACTIONS: Its unique species of Fauna and<br />
Flora which called for its declaration as a National Park. The<br />
Udzungwa Mountains and Forests are a good source of Rivers<br />
and springs, one of them being the famous Kilombero River,<br />
which constitutes the essential part of the multi-hactoral its<br />
total Kilombero Sugar Plantations. Additional attractions:<br />
Lions, Buffalos, Giraffes etc.<br />
(viii)RUAHA<br />
NATIONAL PARK<br />
LOCATION: The name Ruaha, is derived from the Hehe word<br />
"Luvaha" meaning a river.<br />
AREA: Park covers an area of 12,950 square kilometres, the<br />
second largest in the country. Ruaha National Park which was<br />
established in 1964 is situated some 130 km west of Iringa<br />
town.<br />
MAJOR ATTRACTIONS: The Ruaha River by itself is an<br />
attraction, leave alone some hundreds of species of Flora<br />
which sorround it. Besides there are a lot of Crocodiles,<br />
Hippos, Elephants etc.<br />
(ix) KATAVI<br />
NATIONAL<br />
PARK *<br />
LOCATION: It is located in Mpanda District, Rukwa Region.<br />
It was established in 1974.<br />
AREA: The Katavi National Park which is about 40<br />
kilometres South -East of Mpanda town covers an area of<br />
2,253 square kilometres.<br />
MAJOR ATTRACTION: Lakes Chala and Chada plus other<br />
springs and rivers whose waters feed into lake Rukwa<br />
constitute a unique environment. Animals in the park include<br />
zebra, sable, eland, leopard, buffalo, lion, antelops etc.<br />
Animals like, Buffalos, Elephants, Zebras and BushBucks are a<br />
good attraction to visitors.<br />
231
(x)MAHALE<br />
NATIONAL<br />
PARK<br />
LOCATION Located some 120 south of Kigoma town along<br />
the shores of lake Tanganyika, Mahale National Park is yet<br />
another attraction in <strong>Tanzania</strong>'s Natural Heritages.<br />
AREA: Mahale nation Park has about 1,613 square kilometres<br />
and was gazzetted in 1948.<br />
MAJOR ATTRACTIONS:Chimpanzees are a major attraction.<br />
Also there is a good number of monkey species including red<br />
colobus monkeys. It is estimated that there are 700<br />
Chimpanzees in Mahale and 15 species of monkeys whose<br />
habits tally with those of the Chimps.<br />
(xi) GOMBE<br />
NATIONAL<br />
PARK<br />
LOCATION Gombe National Park is situated 16 km north of<br />
Kigoma town in western <strong>Tanzania</strong>. It is a narrow strip of<br />
mountainous country bounded in the east by the eastern rift<br />
valley escarpment and by lake Tanganyika in the west<br />
AREA: Covering some 52 square kilometres. National park,<br />
was commssioned in 1968.<br />
MAJOR ATTRACTIONS:Ever green forests and primates.<br />
These include Chimpanzees, Baboons, blue monkey red tails<br />
and red colobus.<br />
(xii) RUBONDO<br />
NATIONAL<br />
PARK<br />
LOCATION: The Park which form park of a number of<br />
archipelagos in Lake Victoria covers some 240 square<br />
Kilometres. it was established in 1977<br />
MAJOR ATTRACTIONS: The Chimpanzees. But other<br />
attractions include, Hippos, Giraffes, and Elephants. the<br />
absence of man-eaters such as Lions & Leopards ensures a safe<br />
walk in Rubondo Park even some fishing activities with boats<br />
under Park wardens are carried out.<br />
(xiii)<br />
NGORONGORO<br />
LOCATION: It is situated west of Arusha town some 230 kms.<br />
AREA: The park covers 8320 sq km<br />
MAJOR ATTRACTION: Wildebeest, Lions, Buffalos,<br />
Leopards, Variety of birds species, Giraffes, elephans etc<br />
232
233