mtwara region socio-economic profile - Tanzania Online Gateway
mtwara region socio-economic profile - Tanzania Online Gateway
mtwara region socio-economic profile - Tanzania Online Gateway

You also want an ePaper? Increase the reach of your titles
YUMPU automatically turns print PDFs into web optimized ePapers that Google loves.
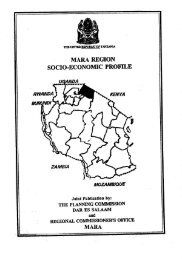
THE UNITED REPUBLIC OF TANZANIA<br />
MTWARA REGION<br />
SOCIO-ECONOMIC PROFILE<br />
UGANDA<br />
RWANDA<br />
BURUNDI<br />
KENYA<br />
MTWARA<br />
REGION<br />
ZAMBIA<br />
MSUMBIJI<br />
Joint Publication by:<br />
THE PLANNING COMMISSION<br />
DAR ES SALAAM<br />
and<br />
REGIONAL COMMISSIONER'S OFFICE<br />
MTWARA
TABLE OF CONTENTS<br />
Page<br />
FOREWORD.....................................................................................................................V<br />
SECTION I<br />
LAND, PEOPLE AND CLIMATE<br />
1.1 Geographical Location:............................................................................................. 1<br />
1.2 Land Area:................................................................................................................... 1<br />
1.3 Administrative Units:................................................................................................ 1<br />
1.4 Ethnicity:..................................................................................................................... 4<br />
1.5 Population Size, Growth and Distribution:............................................................. 4<br />
1.6 Population sex, households and Age Groups:.................................................... 15<br />
1.7 Urban/Rural Population Distribution:................................................................... 24<br />
1.8 Migration and Employment.................................................................................... 27<br />
1.9 Climate and Soils:..................................................................................................... 30<br />
1.10 Topography and Drainage:.................................................................................. 31<br />
1.11 Agro-Ecological Zones:........................................................................................ 31<br />
SECTION II<br />
REGIONAL ECONOMY<br />
2.1 INTRODUCTION:............................................................................................................ 34<br />
2.2 REGIONAL GDP AND PER CAPITA GDP: ................................................................... 35<br />
2.3 PRODUCTIVE SECTORS............................................................................................. 43<br />
2. 3.1 Agriculture ............................................................................................................ 43<br />
2.3.2 Livestock:............................................................................................................... 61<br />
2.3.3 Forestry:................................................................................................................. 65<br />
2.3.4 Fishery:................................................................................................................... 69<br />
2.3.5 Wildlife:.................................................................................................................. 73<br />
2.3.6 Beekeeping:............................................................................................................ 74<br />
2.3.7 Mining:................................................................................................................... 77<br />
2.3.8 Industries:.............................................................................................................. 78<br />
i
SECTION III<br />
SOCIAL SERVICES<br />
3.1 EDUCATION: ................................................................................................................ 79<br />
3.1.1 Pre-School Education:.......................................................................................... 79<br />
3.1.2 Primary School Education:................................................................................... 81<br />
1.2.2 Primary School Dropouts:.................................................................................... 87<br />
1.2.3 Primary School Teachers:.................................................................................... 91<br />
2.4 Primary education Infrastructure:.......................................................................... 92<br />
3.1.2.5 Comparative Status of Primary Education in Mtwara Region:.................... 95<br />
3.1.2.6 Special Primary Schools .................................................................................... 98<br />
3.1.3. Adult Education................................................................................................... 99<br />
3.1.4 Secondary School Education:........................................................................... 105<br />
3.2 HEALTH....................................................................................................................... 112<br />
3.2.1 Introduction......................................................................................................... 112<br />
3.2.2 Morbidity and Mortality.................................................................................... 113<br />
3.2.3 Health Facilities ................................................................................................... 118<br />
2.4 Child Immunization:............................................................................................... 125<br />
3.2.5 Child Nutrition:.................................................................................................... 127<br />
3.2.6 Infant and Under five Mortality:....................................................................... 131<br />
3.2.7 Maternal Mortality:............................................................................................. 135<br />
3.2.8 AIDS: .................................................................................................................... 140<br />
3.2.9 Life Expectancy ................................................................................................... 142<br />
3.2.10 Other Health Issues .......................................................................................... 143<br />
3.3 WATER SUPPLY ........................................................................................................ 146<br />
3.3.1 Introduction......................................................................................................... 146<br />
3.3.2 Rural Water Supplies.......................................................................................... 146<br />
3.3.3 Urban Water Supplies ........................................................................................ 148<br />
3.3.4 Sanitation ............................................................................................................. 151<br />
ii
SECTION IV<br />
ECONOMIC INFRASTRUCTURE<br />
4.1 Introduction............................................................................................................ 154<br />
4.2 Roads....................................................................................................................... 154<br />
ROAD NETWORK - MTWARA REGION............................................................... 156<br />
4.3. Air Services............................................................................................................ 159<br />
4.4. Marine Services..................................................................................................... 163<br />
4.5 Telecommunication Network................................................................................ 164<br />
4.6 Energy...................................................................................................................... 164<br />
4.6.1 Electricity:............................................................................................................. 164<br />
4.6.2 Fuelwood.............................................................................................................. 167<br />
4.6.3 Other forms of Energy........................................................................................ 167<br />
4.7 Land development ................................................................................................. 167<br />
SECTION V<br />
OTHER DEVELOPMENT ISSUES<br />
5.1 WOMEN IN DEVELOPMENT:..................................................................................... 169<br />
5.1.1 Women at Household Level:............................................................................. 169<br />
5.1.2 Women leadership at above household level: ............................................... 170<br />
5.1.3 Gender Issues and the Alleviation of Poverty:.............................................. 172<br />
5.2 Environmental Conservation:............................................................................... 175<br />
5.3 Tourism:................................................................................................................... 178<br />
SECTION VI<br />
POTENTIAL INVESTMENT AREAS<br />
6.1 Agriculture:............................................................................................................. 179<br />
6.2 Livestock:................................................................................................................ 180<br />
6.3 Forestry:.................................................................................................................. 182<br />
6.4 Beekeeping:............................................................................................................. 182<br />
6.5 Mining:.................................................................................................................... 182<br />
6.6 Industrial Development:........................................................................................ 183<br />
6.7 Transport:................................................................................................................ 183<br />
6.8 Energy:..................................................................................................................... 184<br />
6.9 Health:...................................................................................................................... 185<br />
iii
6.10 Education:............................................................................................................. 186<br />
6.11 Water Supply:....................................................................................................... 186<br />
6.12 Environmental Protection:.................................................................................. 187<br />
6.13 Women Development:......................................................................................... 188<br />
6.14 Tourism and Wildlife:.......................................................................................... 188<br />
ANNEX A<br />
Mtwara Region in a Nutshell...................................................................................... 189<br />
ANNEX B<br />
Mtwara/Mikindani District Summary (1996) ............................................................ 201<br />
ANNEX C<br />
Mtwara Rural District Summary (1996) ..................................................................... 206<br />
ANNEX D<br />
Newala District Summary ............................................................................................ 212<br />
ANNEX E<br />
Masasi District Summary ............................................................................................ 218<br />
ANNEX H<br />
GENERAL INFORMATION ABOUT TANZANIA .................................................... 224<br />
Area Of Mainland ........................................................................................................ 224<br />
<strong>Tanzania</strong> Mainland Area By Regions (Sq Km)........................................................ 224<br />
Population..................................................................................................................... 225<br />
Life Expectancy For <strong>Tanzania</strong> - By Regions, 1967, 1978, 1988, 1996: ................. 225<br />
Land Use....................................................................................................................... 226<br />
Arable Land:................................................................................................................. 226<br />
Lakes .............................................................................................................................. 226<br />
Mountain Summits (Metres Above Sea Level)....................................................... 226<br />
Climate ........................................................................................................................... 227<br />
Rainfall........................................................................................................................... 227<br />
Social Services.............................................................................................................. 228<br />
Health Facilities ............................................................................................................ 228<br />
National Parks............................................................................................................... 229<br />
iv
FOREWORD<br />
1. As we approach the 21st Century the problems facing rural<br />
areas in developing countries like <strong>Tanzania</strong> are numerous and<br />
formidable. Social and Economic services are deteriorating<br />
and proving to be unsustainable; school enrollment rates are<br />
declining; food situation is precarious; infant and maternal<br />
mortality rates continue to be high; unemployment is on the<br />
rise triggering off mass migration of youth from the rural areas<br />
into already overcrowded urban centres; in Mtwara Region, for<br />
example, land pressure is escalating and deforestation is going<br />
on at an alarming rate.<br />
2. This situation has arisen because of many factors including ill -<br />
prepared rural development programmes and weak monitoring<br />
and supervision of the implementation of development<br />
programmes and sectoral strategies. The observed<br />
shortcomings in the policy formulation, project identification,<br />
design, and implementation in the developing countries is in<br />
turn attributed to lack of reliable and adequate data and<br />
information on the rural development process.<br />
3. The publication of Regional Socio-<strong>economic</strong> Profiles series by<br />
the Planning Commission in collaboration with Regional<br />
Commissioner's offices should be viewed as a fruitful attempt<br />
towards finding solutions to the existing problem of data and<br />
information gap.<br />
4. The Regional Profile series cover a wide range of data and<br />
information on geography, population, social <strong>economic</strong><br />
parameters, social services, <strong>economic</strong> infrastructure and<br />
productive sectors. The publications so far have proved to be<br />
v
of high demand and a vital source of information to many<br />
policy makers, planners, researchers, donors and functional<br />
managers.<br />
The Planning Commission has found it a worthwhile effort to<br />
extend the exercise to cover even more <strong>region</strong>s. Readers are<br />
invited to make suggestions and constructive criticisms which<br />
can assist in improving the quality and effectiveness of future<br />
Profiles.<br />
5. I would like to take this opportunity to acknowledge with<br />
thanks once again the financial support of the Royal<br />
Norwegian Embassy which facilitated the preparation of the<br />
Mtwara Region Socio-Economic Profile. I would also like to<br />
thank both the Planning Commission and Mtwara Regional<br />
Planning Staff who put a lot of effort into ensuring the<br />
successful completion of this task.<br />
Nassoro W. Malocho (MP)<br />
MINISTER OF STATE<br />
PLANNING AND PARASTATAL SECTOR REFORM<br />
December, 1997<br />
vi
SECTION I<br />
LAND, PEOPLE AND CLIMATE<br />
1.1 Geographical Location:<br />
Mtwara <strong>region</strong> is one of 20 <strong>region</strong>s of <strong>Tanzania</strong> Mainland. It is<br />
the southernmost <strong>region</strong>. It lies between longitudes 38 o and 40 o<br />
30" east of Greenwich. It is also situated between latitudes 10 o<br />
05" and 11 o 25" south of the Equator.<br />
It borders Lindi <strong>region</strong> to the north, the Indian Ocean to the east<br />
and separated by the Ruvuma river from Mozambique in the<br />
south. To the west it borders Ruvuma <strong>region</strong>.<br />
1.2 Land Area:<br />
The <strong>region</strong> occupies 16,720 sq. kms or 1.9% of <strong>Tanzania</strong><br />
Mainland land area of 885,987 sq. kms. It is the second smallest<br />
<strong>region</strong> after Kilimanjaro. The <strong>region</strong> is divided between districts<br />
as in Table I - 1.<br />
1.3 Administrative Units:<br />
Mtwara <strong>region</strong> is administratively subdivided into 5 districts, 21<br />
divisions, 98 wards and 554 villages as shown in Table I - 1. The<br />
smallest of the districts is logically the urban district of<br />
Mtwara/Mikindani at 163 sq. kms. and the largest is Masasi at<br />
8,940 sq. kms which is 55 times the size of the urban district.<br />
1
Masasi district has also got the largest number of divisions, wards<br />
and villages.<br />
2
Originally Mtwara Region included Lindi until 1971 when Lindi<br />
was created to form a separate <strong>region</strong>.<br />
TABLE I - 1: AREA AND ADMINISTRATIVE STRUCTURE OF<br />
MTWARA REGION, 1996:<br />
District<br />
Area<br />
(Km 2 )<br />
Number of<br />
Divisions<br />
Number of<br />
Wards<br />
Number of<br />
Villages<br />
Mtwara/Mikindani<br />
(U)<br />
163 2 13 6<br />
Mtwara Rural 3,597 6 17 101<br />
Newala 2,126 3 16 130<br />
Tandahimba 1,894 3 22 103<br />
Masasi 8,940 7 30 214<br />
Total 16,720 21 98 554<br />
Source: Regional Commissioner's Office, Mtwara, 1997.<br />
3
Fig. 1: Distribution of area (Sq. Km) by<br />
district, Mtwara <strong>region</strong><br />
Mtwara/Mikind<br />
ani (U)<br />
1%<br />
Mtwara Rural<br />
22%<br />
Masasi<br />
53%<br />
Newala<br />
13%<br />
Tandahimba<br />
11%<br />
1.4 Ethnicity:<br />
The 1948 and 1967 censuses indicated that the majority of the<br />
indigenous people of the <strong>region</strong> were of Bantu origin. The most<br />
dominant groups are the Makonde of Newala, Tandahimba,<br />
Masasi and Mtwara rural. They made 60% of the population.<br />
This group is followed by the Makua of Masasi and Mtwara rural.<br />
The Yao, the third group, are found in Masasi.<br />
1.5 Population Size, Growth and Distribution:<br />
The history of Mtwara <strong>region</strong> population size is recorded by the<br />
1967, 1978 and 1988 population censuses as in Table I-2<br />
including the densities of the population per sq. km.<br />
TABLE I - 2: POPULATION OF MTWARA REGION 1967, 1978 AND<br />
1988:<br />
4
Year 1967 1978 1988<br />
Population 621,293 771,818 875,977<br />
Population<br />
Density<br />
37 46 53<br />
Source:<br />
Data compiled from 1988 Population Census.<br />
5
Fig. 2 (a): Population of Mtwara <strong>region</strong> 1967, 1978 and 1988<br />
1,000,000<br />
800,000<br />
600,000<br />
400,000<br />
200,000<br />
0<br />
1967 1978 1988<br />
Fig. 2 (b): Population density of Mtwara <strong>region</strong> 1967, 1978 and 1988<br />
60<br />
50<br />
40<br />
30<br />
20<br />
10<br />
0<br />
1967 1978 1988<br />
Mtwara <strong>region</strong>'s population increased by more than 40% between<br />
1967 and 1988.<br />
However, in order to get the proper perspective, the <strong>region</strong>s<br />
population and density has to be matched against other <strong>region</strong>s in<br />
<strong>Tanzania</strong> mainland. From Table I-3 the picture emerges that<br />
Mtwara <strong>region</strong> though having only 1.9% of Mainland land area<br />
carries 4% of its population. This can be explained by a higher<br />
than average population density. Mtwara has a density of 53.2<br />
6
people per sq. km. while the mainland average is a mere 25.3<br />
people per sq. km.<br />
TABLE I-3: POPULATION DISTRIBUTION BY REGION AND<br />
DENSITY, TANZANIA MAINLAND, 1988:<br />
Region<br />
Land Area Sq.<br />
Km.<br />
Populatio<br />
n<br />
Population<br />
Density per Sq.<br />
Km.<br />
Population as a<br />
% of Mainland<br />
Mtwara 16,710 875,977 53.2 4.0<br />
Lindi 67,000 646,345 9.6 2.9<br />
Shinyanga 50,760 1,763,960 34.9 7.9<br />
Mwanza 20,095 1,878,271 93.5 8.4<br />
Dodoma 41,311 1,235,277 30.0 5.5<br />
Arusha 82,098 1,352,225 16.5 6.0<br />
Kilimanjaro 13,309 1,108,699 83.7 4.9<br />
Tanga 26,677 1,280,262 48.1 5.7<br />
Morogoro 70,799 1,222,737 17.0 5.4<br />
Coast/DSM 33,800 1,998,865 59.1 8.9<br />
Ruvuma 66,477 783,327 12.0 3.5<br />
Iringa 56,850 1,193,074 21.3 5.3<br />
Mbeya 60,350 1,476,261 24.0 6.6<br />
Singida 49,341 791,814 16.0 3.5<br />
Tabora 76,151 1,036,293 14.0 4.6<br />
Rukwa 68,635 704,050 10.1 3.1<br />
Kigoma 37,040 853,263 23.1 3.8<br />
Mara 21,760 952,616 43.7 4.2<br />
Kagera 28,456 1,313,639 46.6 5.8<br />
Total Mainland 887,619 22,466,95<br />
5<br />
25.3 100.0<br />
7
Source:<br />
1988 Population Census.<br />
Fig. 3 (a) Distribution of land area (Sq. Km)<br />
of Mtwara <strong>region</strong> to the total Mainland<br />
Mtwara<br />
2%<br />
Total<br />
Mainland<br />
98%<br />
Fig. 3 (b) Distribution of population of Mtwara<br />
<strong>region</strong> to the total Mainland, 1988<br />
Mtwara<br />
4%<br />
Total<br />
Mainland<br />
96%<br />
8
Fig. 3 (c) Distribution of population density for Mtwara<br />
<strong>region</strong> to the total Mainland, 1988<br />
Average<br />
Mainland<br />
32%<br />
Mtwara<br />
68%<br />
Compared to its neighbouring <strong>region</strong>s of Lindi, Ruvuma,<br />
Morogoro and Coast (excluding DSM) Mtwara is the most<br />
densely populated <strong>region</strong>.<br />
TABLE I-4:<br />
Region<br />
POPULATION AND POPULATION GROWTH BY<br />
REGIONS, 1978 AND 1988:<br />
Population<br />
Annual Growth Rates<br />
1978 1988 1967/78 1978/88<br />
Mtwara 771,818 875,977 2.0 1.4<br />
Dar-es-Salaam 843,090 1,360,850 7.8 4.7<br />
Rukwa 451,897 704,050 4.5 4.2<br />
Tabora 817,907 1,042,622 4.4 2.4<br />
Kagera 1,009,767 1,313,639 3.9 2.7<br />
Arusha 926,223 1,352,225 3.8 3.7<br />
Shinyanga 1,323,535 1,763,960 3.5 2.9<br />
Mbeya 1,079,864 1,476,261 3.3 3.1<br />
Ruvuma 561,575 779,868 3.2 3.3<br />
10
Dodoma 972,005 1,235,277 2.9 2.4<br />
Kilimanjaro 902,437 1,106,068 2.9 2.1<br />
Morogoro 939,264 1,279,931 2.9 2.6<br />
Kigoma 648,941 853,263 2.9 2.7<br />
Mwanza 1,443,379 1,876,776 2.8 2.6<br />
Tanga 1,037,767 1,280,262 2.7 2.1<br />
Iringa 925,044 1,193,074 2.7 2.7<br />
Singida 613,949 793,887 2.7 2.5<br />
Mara 723,827 952,616 2.6 2.9<br />
Lindi 527,624 642,364 2.1 2.0<br />
Coast 516,586 639,182 1.7 2.1<br />
Total Mainland 17,036,499 22,466,955 3.2 2.8<br />
Source:<br />
1988 Population Census, National Profile.<br />
Fig. 4:<br />
Annual population growth rates 1967/78 and 1978/88 of Mtwara<br />
<strong>region</strong> to the total Mainland<br />
3.5<br />
3<br />
2.5<br />
2<br />
1.5<br />
1<br />
0.5<br />
0<br />
1967/78 Mtwara<br />
1978/88<br />
11<br />
Total Mainland<br />
A perusal of Table I-4 reveals that during 1967/78 Mtwara <strong>region</strong><br />
had the least but one annual population growth rate. During the<br />
subsequent ten years 1978/88 the <strong>region</strong> showed the least growth
of any <strong>region</strong> and also that the rate had gone down compared to<br />
the previous ten years.<br />
12
TABLE I-5:<br />
ANNUAL POPULATION GROWTH<br />
RATES BY DISTRICT, 1967/78 AND 1978/88<br />
District 1967/78 1978/88<br />
Mtwara/Mikindani<br />
Mtwara Rural<br />
and<br />
2.2 2.4<br />
Newala & Tandahimba 1.1 1.0<br />
Masasi 2.2 1.9<br />
Total 2.0 1.4<br />
Source: 1988 Population Census - Mtwara Regional Profile.<br />
Fig. 5: Annual population growth rates by district, 1967/78 and 1978/88, Mtwara<br />
<strong>region</strong><br />
2.5<br />
2<br />
1.5<br />
1<br />
0.5<br />
0<br />
Mtwara / Mikindani<br />
and Mtwara Rural<br />
Newala &<br />
Tandahimba<br />
Masasi<br />
1967/78<br />
1978/88<br />
According to Table I-5 all districts show a decline in annual<br />
population growth rate except for Mtwara<br />
Rural/Mtwara/Mikindani. The exception can be explained by the<br />
fact that the annual growth rate in urban areas of the <strong>region</strong> went up<br />
13
etween 1978 and 1988 quite markedly. Newala/Tandahimba<br />
district is possibly one of few districts in the country which have an<br />
annual population growth rate of as low as 1.0.<br />
TABLE I-6:<br />
POPULATION DENSITY AND DISTRIBUTION BY DISTRICT,<br />
MTWARA REGION, 1988, 1996 AND 2000 A.D:<br />
District<br />
Land<br />
Area<br />
1988 1996 2000<br />
Km 2<br />
Actual<br />
Populati<br />
on<br />
Annual<br />
Growth<br />
Rate %<br />
Population<br />
Density per<br />
Km 2<br />
Population<br />
Estimate<br />
Population<br />
Density<br />
per Km 2<br />
Population<br />
Estimate<br />
Population<br />
Density<br />
per Km 2<br />
Mtwara/Mik<br />
indani<br />
Mtwara<br />
Rural<br />
163 75,857 4.0 465.4 103,815 636.9 121.449 745.1<br />
3,597 168,189 1.6 46.8 190,962 53.1 203,480 56.6<br />
Newala 2,126 301,247* 1.0 74.9* 149,555 70.3 155,615 73.2<br />
Tandahimb<br />
a<br />
1,894 - 1.0 - 176,555 93.3 183,824 97.1<br />
Masasi 8,940 330,684 1.9 37.0 384,421 43.0 414,480 46.4<br />
Total 16,720 875,977 1.4 52.4 1,005,405 60.1 1,078,84<br />
5<br />
64.5<br />
Source:<br />
Data compiled from 1988 Population Census<br />
* Includes Tandahimba district<br />
Note: Annual growth rates estimates except for Masasi.<br />
Table 1-6 reveals that Masasi is the most populous district<br />
accounting for almost 40% of the <strong>region</strong>'s population. The<br />
Mtwara/Mikindani urban district is now the smallest in terms of<br />
people but its share of the total <strong>region</strong>al population is increasing.<br />
It was 8.6% in 1988 but it is expected to be 11% by 2000 A.D.<br />
14
Mtwara Rural, Newala and Tindahimba districts in 1996<br />
accounted for 19% 15% and 18% respectively.<br />
1.6 Population sex, households and Age Groups:<br />
Distribution of the 1988 population census between the sexes<br />
gives a <strong>region</strong>al average sex ratio of 91.9. This means for every<br />
100 females there are 91.9 males. There are a lot more women<br />
compared to men than is average for mainland <strong>Tanzania</strong>. Newala<br />
district displayed the biggest dispacity in a number between the<br />
sexes in the <strong>region</strong>. It had a sex ratio of 85.5 or approximately 46<br />
males for every 54 females. See Table 1-7.<br />
The situation with respect to 1978 census is that the <strong>region</strong>al<br />
average sex ratio since then had remained essentially the same<br />
except for a slight shift. The 1978 sex ration was 93.5. This<br />
means that by 1988 the imbalance in numbers between the sexes<br />
was even greater than it was in 1978.<br />
The urban district of Mtwara/Mikindani showed more men than<br />
women in both cases. In 1978 the sex ratio was 102.8. The sex<br />
ratio of 103.8 in 1988 shows that the gap is widening. See Table<br />
I-7 and I-8. There are 198,848 households in Mtwara <strong>region</strong><br />
making an average household size of 4.4. Mtwara Rural and<br />
Newala districts had the highest size at 4.5. Mtwara Urban and<br />
Masasi districts had the lowest at 4.3. See Table 1.9.<br />
15
TABLE I-7:<br />
POPULATION DISTRIBUTION BY SEX AND<br />
DISTRICT, 1988:<br />
District Male Female Total Sex Ratio<br />
Mtwara/Mikindani Urban 38,916 37,491 76,407 103.8<br />
Mtwara Rural 80,853 88,459 169,312 91.4<br />
Newala 141,857 165,858 307,715 85.5<br />
Masasi 162,160 173,288 335,448 93.6<br />
Total 423,786 465,096 888,882 91.9<br />
Source:<br />
1988 Population Census.<br />
Fig. 6: Population distribution by district and sex, Mtwara <strong>region</strong> 1988<br />
180,000<br />
160,000<br />
140,000<br />
120,000<br />
100,000<br />
80,000<br />
60,000<br />
40,000<br />
20,000<br />
0<br />
Mtwara/<br />
Mikindani<br />
Urban<br />
Mtwara<br />
Rural<br />
Newala<br />
Masasi<br />
Male<br />
Female<br />
16
TABLE I-8:<br />
POPULATION DISTRIBUTION BY SEX AND<br />
DISTRICT, 1978:<br />
District Male Female Total Sex Ratio<br />
Mtwara/Mikindani Urban 24,584 23,907 48,491 102.8<br />
Mtwara Rural 70,090 73,943 144,033 94.8<br />
Newala 145,599 161,786 307,385 90.0<br />
Masasi 132,769 139,140 271,909 95.4<br />
Total 373,042 398,776 771,818 93.5<br />
Source:<br />
1988 Population Census, Regional Profile Mtwara.<br />
Fig. 7: Population distribution by district and sex, Mtwara <strong>region</strong> 1978<br />
180,000<br />
160,000<br />
140,000<br />
120,000<br />
100,000<br />
80,000<br />
60,000<br />
40,000<br />
20,000<br />
0<br />
Mtwara/Mi<br />
kindani<br />
Urban<br />
Mtwara<br />
Rural<br />
Newala<br />
Masasi<br />
Male<br />
Female<br />
17
TABLE I-9:<br />
District<br />
Mtwara/Mikindani<br />
Urban<br />
POPULATION HOUSEHOLD SIZE BY DISTRICT,<br />
MTWARA REGION, 1988:<br />
Total<br />
Population<br />
Number of<br />
Households<br />
Average Household<br />
Size<br />
75,857 17,814 4.3<br />
Mtwara Rural 168,189 37,519 4.5<br />
Newala 301,247 66,496 4.5<br />
Masasi 330,684 77,019 4.3<br />
Total 875,977 198,848 4.4<br />
Source:<br />
1988 Population Census, Mtwara Regional Profile.<br />
TABLE I-10:<br />
District<br />
POPULATION HOUSEHOLD SIZE BY DISTRICT AND BY<br />
RURAL/URBAN ORIENTATION, MTWARA REGION, 1988:<br />
Population Number of Households Average Household Size<br />
Rural Urban Rural Urban Rural Urban<br />
Mtwara/Mikindani Urban 9,405 66,452 2,109 15,705 4.5 4.2<br />
Mtwara Rural 161,576 6,613 35,977 1,542 4.5 4.3<br />
Newala 275,599 25,648 60,666 5,830 4.5 4.4<br />
Masasi 304,273 26,411 70,730 6,289 4.3 4.2<br />
Total 750,883 125,124 169,482 29,366 4.4 4.3<br />
Source:<br />
1988 Population Census, Mtwara Region Profile.<br />
18
Fig. 8: Rural and Urban population orientation by district, Mtwara <strong>region</strong>, 1988<br />
350,000<br />
300,000<br />
250,000<br />
200,000<br />
150,000<br />
100,000<br />
50,000<br />
0<br />
Mtwara/<br />
Mikindani<br />
Urban<br />
Mtwara<br />
Rural<br />
Newala<br />
Masasi<br />
Rural<br />
Urban<br />
Table 1.10 reveals the trend in household size between urban and<br />
rural areas. In every case urban sizes are smaller than rural<br />
household sizes.<br />
TABLE I-11:<br />
POPULATION AGE GROUPS BY DISTRICT, MTWARA<br />
REGION, 1988:<br />
District<br />
Age Groups<br />
0 - 4 5 - 14 15 - 44 45 - 64 65+<br />
Dependenc<br />
y Ratio<br />
Mtwara/Mikindani Urban 10,483 19,007 37,566 7,390 2,115 70.30<br />
Mtwara Rural 24,144 43,087 71,469 22,182 8,373 80.73<br />
Newala 39,881 82,481 127,408 41,258 16,483 82.32<br />
Masasi 52,055 88,769 135,005 41,480 16,626 89.21<br />
Total 126,561 233,347 371,451 112,303 43,577 83.41<br />
Source:<br />
1988 Population Census, Regional Profile, Mtwara.<br />
19
Fig. 9 (a): Population age groups in Mtwara/Mikindani Urban, 1988<br />
40,000<br />
35,000<br />
30,000<br />
25,000<br />
20,000<br />
15,000<br />
10,000<br />
5,000<br />
0<br />
0 - 4 5 - 14 15 - 44 45 - 64 65+<br />
Fig. 9 (b): Population age groups in Mtwara Rural district, 1988<br />
80,000<br />
70,000<br />
60,000<br />
50,000<br />
40,000<br />
30,000<br />
20,000<br />
10,000<br />
0<br />
0 - 4 5 - 14 15 - 44 45 - 64 65+<br />
20
Fig. 9 (c): Population age groups in Newala district, 1988<br />
140,000<br />
120,000<br />
100,000<br />
80,000<br />
60,000<br />
40,000<br />
20,000<br />
0<br />
0 - 4 5 - 14 15 - 44 45 - 64 65+<br />
Fig. 9 (d): Population age groups in Masasi district, 1988<br />
140,000<br />
120,000<br />
100,000<br />
80,000<br />
60,000<br />
40,000<br />
20,000<br />
0<br />
0 - 4 5 - 14 15 - 44 45 - 64 65+<br />
The distribution of various age groups in the <strong>region</strong>'s population is<br />
shown in Table I-11 and I-12 for 1988 and 1978 respectively.<br />
The dependency ratio has decreased from 86.26 in 1978 to<br />
83.41 in 1988. This <strong>economic</strong>ally is a healthy sign. For some<br />
inexplicable reason Masasi district's dependence ratio increased<br />
dramatically from 53.31 in 1978 to 89.21 in 1988. The<br />
proportion of people 65 years of age and over in the population<br />
21
increased from 4.7% to 4.9% between the two censuses. The<br />
national average is 4.3% for 1988. The proportion of the 0 - 14<br />
age group was 41.6% in 1978 and 40.6% in 1988. This is very<br />
good when compared to the national average of 45.7% for 1988.<br />
Population control policies<br />
TABLE 1-12: POPULATION AGE GROUPS BY DISTRICT,<br />
MTWARA REGION, 1978:<br />
District<br />
Total<br />
Population<br />
Age Groups<br />
Depe<br />
nden<br />
ce<br />
Rati<br />
o<br />
0 - 4 5 - 14 15 - 44 45 - 64 65+<br />
Mtwara/Mikindani<br />
Urban<br />
48,491 7,824 11,406 24,309 4,068 884 70.8<br />
8<br />
Mtwara Rural 144,033 23,438 35,239 60,621 18,360 6,375 82.3<br />
6<br />
Newala 307,385 46,777 80,129 129,085 35,333 16,061 86.9<br />
5<br />
Masasi 271,909 45,345 71,076 107,774 34,811 12,903 53.3<br />
1<br />
Total 771,818 123,38 197,850 321,789 92,592 36,222 86.2<br />
6<br />
Source:<br />
1988 Population Census, Regional Profile, Mtwara.<br />
are being effective. This is also consistent with the low population growth<br />
rate which declined further from 2.0% to 1.4% between 1978 and 1988.<br />
22
Fig. 10 (a): Population age groups in Mtwara/Mikindani Urban, 1978<br />
25,000<br />
20,000<br />
15,000<br />
10,000<br />
5,000<br />
0<br />
0 - 4 5 - 14 15 - 44 45 - 64 65+<br />
Fig. 10 (b): Population age groups in Mtwara Rural district, 1978<br />
70,000<br />
60,000<br />
50,000<br />
40,000<br />
30,000<br />
20,000<br />
10,000<br />
0<br />
0 - 4 5 - 14 15 - 44 45 - 64 65+<br />
23
Fig. 10 (c): Population age groups in Newala district, 1978<br />
140,000<br />
120,000<br />
100,000<br />
80,000<br />
60,000<br />
40,000<br />
20,000<br />
0<br />
0 - 4 5 - 14 15 - 44 45 - 64 65+<br />
Fig. 10 (d): Population age groups in Masasi district, 1978<br />
140,000<br />
120,000<br />
100,000<br />
80,000<br />
60,000<br />
40,000<br />
20,000<br />
0<br />
0 - 4 5 - 14 15 - 44 45 - 64 65+<br />
1.7 Urban/Rural Population Distribution:<br />
In Mainland <strong>Tanzania</strong> 18.3% of the population were living in<br />
urban areas in 1988. In Mtwara 14.3% of the <strong>region</strong>'s population<br />
lived in urban areas. It was 12.0% in 1978 and 3.3% in 1967 for<br />
Mtwara. In 1978 the urban settlements were Mtwara/Mikindani,<br />
24
Newala, Masasi, Mahuta and Bondeni. The 1967, 1978 and<br />
1988 statistics show that slowly the <strong>region</strong> is getting urbanized.<br />
From Tables I-13 and I-14 the <strong>region</strong>al average trend is clear.<br />
The <strong>region</strong> moved from 12% urbanization in 1978 to 14.4%<br />
urbanization in 1988. The position with respect to the districts of<br />
Mtwara Urban and Newala need some explaining. The departure<br />
shown by these districts from the norm may have been due to the<br />
re-demarcation of administrative boundaries.<br />
TABLE I-13:<br />
District<br />
DISTRIBUTION OF RURAL AND URBAN POPULATION BY<br />
DISTRICT, MTWARA REGION, 1978 AND 1988:<br />
Urban Rural Total<br />
1978 1988 1978 1988 1978 1988<br />
Mtwara/Mikindani<br />
Urban<br />
48,491 66,452 NIL 9,405 48,491 75,857<br />
Mtwara Rural NIL 6,613 144,033 161,576 144,033 168,189<br />
Newala 30,735 25,648 276,650 275,599 307,385 301,247<br />
Masasi 13,129 26,411 258,780 304,273 271,909 330,684<br />
Total 92,355 125,12<br />
4<br />
679,463 750,883 771,818 875,977<br />
Source:<br />
1978 Population Census Vol.IV<br />
1988 Population Census, Regional Profile, Mtwara.<br />
25
Fig. 11 (a) Distribution of rural and urban population by district, Mtwara <strong>region</strong>,<br />
1978<br />
300,000<br />
250,000<br />
200,000<br />
150,000<br />
100,000<br />
50,000<br />
0<br />
Mtwara/<br />
Mikindani<br />
Urban<br />
Mtwara<br />
Rural<br />
Newala<br />
Masasi<br />
Urban 1978 Rural 1978<br />
Fig. 11 (b) Distribution of rural and urban population by district, Mtwara <strong>region</strong>,<br />
1988<br />
350,000<br />
300,000<br />
250,000<br />
200,000<br />
150,000<br />
100,000<br />
50,000<br />
0<br />
Mtwara/<br />
Mikindani<br />
Urban<br />
Mtwara<br />
Rural<br />
Newala<br />
Masasi<br />
Urban 1988 Rural 1988<br />
26
TABLE I-14: URBAN POPULATION DISTRIBUTION AND<br />
PROPORTION OF TOTAL REGIONAL<br />
POPULATION, BY DISTRICT 1978 AND 1988:<br />
District<br />
Urban<br />
Population<br />
1978 1988<br />
% of Total<br />
Population<br />
Urban<br />
Population<br />
% of<br />
Total<br />
Populatio<br />
n<br />
Mtwara/Mikin<br />
dani Urban<br />
48, 491 100 66,452 87.6<br />
Mtwara Rural Nil 0 6,613 3.9<br />
Newala 30,735 10.0 25,648 8.5<br />
Masasi 13,129 4.8 26,411 8.0<br />
Total 92,355 12.0 125,124 14.3<br />
Source:<br />
1978 Population Census Vol IV<br />
1988 Population Census, Regional Profile, Mtwara<br />
1.8 Migration and Employment<br />
Table 1-15 shows the migration status of the <strong>region</strong> in 1988.<br />
Lifetime in migration stood at 46,299 while out migration was as<br />
much as 144,988. This gives a net lifetime migration of -98,689.<br />
The negative net lifetime migration figure means that the <strong>region</strong> was<br />
losing people to other parts of the country. Mtwara <strong>region</strong> is in the<br />
same situation as its fellow southern neighbours Lindi and Ruvuma<br />
<strong>region</strong>s.<br />
27
TABLE 1-15: LIFETIME MIGRATION BY REGION,<br />
TANZANIA MAINLAND, 1988:<br />
Region<br />
Lifetime in<br />
Migration<br />
Lifetime<br />
Out<br />
Migration<br />
Net lifetime<br />
Migration<br />
Gross<br />
Migration<br />
Mtwara 46,299 144,988 -98,689 191,287<br />
Lindi 95,200 145,031 -49,831 240,231<br />
Arusha 218,429 76,703 141,724 295,130<br />
K'njaro 93,040 217,423 -124,383 310,463<br />
Tanga 98,747 150,915 -52,168 249,662<br />
Morogoro 172,393 141,956 30,437 314.349<br />
Coast 103,804 207,716 -103,912 311.520<br />
Dar es Salaam 651,246 150,625 500,621 801,871<br />
Dodoma 89,900 190,985 -101,085 280,885<br />
Ruvuma 66,442 81,661 -15,219 148,103<br />
Iringa 49,282 169,480 -120,198 218,762<br />
Mbeya 160,377 113,378 46,999 273,755<br />
Singida 86,651 150,531 -63,880 237,182<br />
Tabora 241,729 175,359 66,370 417,088<br />
Rukwa 87,599 49,294 38,305 136,893<br />
Kigoma 26,795 129,718 -102,923 150,513<br />
Shinyanga 288,210 281,447 6,763 569,657<br />
Kagera 103,713 109,693 -5,980 213,406<br />
Mwanza 270,142 303,646 -33,504 573,788<br />
Mara 75,987 115,865 -39,878 191,852<br />
Total 3,025,983 3,106,414 -80,431 6,132,397<br />
28
Source: 1988 Population Census National <strong>profile</strong>.<br />
The southern zone as a whole and Mtwara in particular is<br />
unattractive to the new generation who move out in search of<br />
greener pastures elsewhere in <strong>Tanzania</strong>. They are <strong>economic</strong><br />
"refugees". To stem this outflow means a lot of work in making<br />
the <strong>region</strong> and the zone <strong>economic</strong>ally attractive to young people.<br />
Drastic improvement in road connections with the north will open<br />
up the <strong>region</strong> to markets in the north. It can also provide access<br />
to the <strong>region</strong> for industrial goods and supporting <strong>economic</strong> and<br />
social services inputs from the more developed parts of the<br />
country. The <strong>region</strong> had the potential to make it attractive to<br />
coming generations of young people so that they do not need to<br />
go beyond its borders to seek a secure <strong>economic</strong> future.<br />
Current efforts at providing employment to youths include<br />
indirectly the opening up of a thriving gemstone mining industry<br />
where any one can participate as a small scale miner. The<br />
establishment of 459 women groups as part of the gender issue<br />
exercise, boosts employment among women. Similarly, the<br />
existence of youth groups dedicated to income generation is<br />
another relevant effort which has the potential for great expansion.<br />
So far 38 groups and 15 individual youths have taken advantage<br />
of loans of up to TShs 7.5 million. The distribution of these youth<br />
groups is Newala 30, Masasi 28, Mtwara/Mikindani 14 and<br />
Mtwara Rural 22.<br />
Future strategy could include the expansion of women and youth<br />
groups, expansion of small scale gemstone mining and the<br />
development of the tourist industry. But in the long run the<br />
29
agricultural, forestry (including beekeeping) and the fishing<br />
industries have got to be developed to the extent that they attract<br />
new generations. The industry sector is another long term<br />
possibility.<br />
1.9 Climate and Soils:<br />
Prevailing winds are critical in determining climate for this <strong>region</strong><br />
which borders on the Indian Ocean. During the period<br />
November/December to April/May the dominant winds are from<br />
the north-east. They bring a hot humid rainy season to the <strong>region</strong>,<br />
when they blow from south-east the <strong>region</strong> is dry, cooler and less<br />
humid.<br />
The rainy season of November/December to April/May is single<br />
peaked, the peak being reached in January but occasionally in<br />
February or March. The amount of total annual precipitation<br />
tends to vary with altitude. Mtwara district rains vary from 935<br />
mm to 116 mm in the hills and the plateau. It is 893 mm at<br />
Masasi Mission and 1001 mm at Newala. It also varies from<br />
1133 mm at Mtopwa to 832 mm at Lukwika Mission.<br />
Likewise temperatures vary from 27 0 as the highest monthly mean<br />
at Mtwara on the coast in December to 23 0 C in July. Relative<br />
humidity goes from 87% in March to 79% in October in Mtwara.<br />
Temperatures and humidity are lower inland.<br />
Geology determines soils. The <strong>region</strong> has two geological zones<br />
and hence two geologically determined soils types. The first zone<br />
is geologically the coastal sedimentary formation extending some<br />
30
125 kms from the Indian Ocean to the edge of the Makonde<br />
Plateau of Newala. This zone produces deep, well drained, sandy<br />
soils of low fertility and low moisture holding capacity. They are<br />
produced from sandstones. Some areas give rise to marine heavy<br />
clay soils or vertisols. Further, coastal limestones produce red,<br />
well drained, heavy textured soils.<br />
The second zone geologically extend west of the coastal<br />
sediments. It is a zone of pre-cambrian basement rocks<br />
consisting of gneisses and granulites. Soils from this basement are<br />
variable. They are deep, well drained, red clays to the north of<br />
Masasi town. These are the best soils in the <strong>region</strong> since they suit<br />
best the upland crops of the <strong>region</strong>. South of Masasi course<br />
grained sandy soils occur frequently.<br />
1.10 Topography and Drainage:<br />
Topography wise the <strong>region</strong> is divided into two halves. The<br />
coastal plain with its complexity of landforms. Secondly the<br />
basement plain dominated by the Makonde Plateau at 300mm to<br />
400mm. It is generally low level with isolated rocky hills and<br />
steep river sides.<br />
The western half lying beyond the Makonde Plateau drains to the<br />
south through the tributaries of the Ruvuma river. The Maombi<br />
and Mbuo rivers drain most of the Makonde Plateau.<br />
1.11 Agro-Ecological Zones:<br />
31
Mtwara <strong>region</strong> has four agro-ecological zones according to<br />
climate, landform, agriculture and soil / vegetation characteristics.<br />
Zone I:<br />
South half of Mtwara Rural and South - East of<br />
Newala:<br />
Monomodal rainfall with annual precipitation<br />
exceeding 1000 mm and 6 months of growing<br />
season (November - April). Low altitude.<br />
Isohyperthermic temperatures. Soils of low<br />
fertility.<br />
Zone II:<br />
North half of Mtwara Rural:<br />
Monomodal rainfall averaging 600mm to 1000<br />
mm in six months (November - April) Mid<br />
altitude. Isohyperthermic temperatures. Soils of<br />
low fertility with medium moisture retaining<br />
capacity.<br />
Zone III:<br />
The Whole of Masasi (Except Northern Part)<br />
North and West Parts of Newala:<br />
Monomodal rainfall averaging 600 mm to 1000<br />
mm in 5 months growing season (December -<br />
April). Low altitude. Isohyperthermic<br />
temperatures. Soils of low fertility.<br />
Zone IV:<br />
The South East of Mtwara Rural:<br />
32
Bimodal rainfall pattern with annual precipitation<br />
of over 600 mm. The growing season last 7<br />
months. (November - May) Soils of high fertility<br />
and of alluvial origin. Low altitude.<br />
33
SECTION II<br />
REGIONAL ECONOMY:<br />
2.1 Introduction:<br />
Present day Mtwara <strong>region</strong> came into being in 1971 as a result of<br />
the division of Mtwara and Lindi as a single <strong>region</strong> into two<br />
separate <strong>region</strong>s. The <strong>region</strong> is located at the extreme southern<br />
end of the republic. Inspite of this remoteness and its <strong>economic</strong><br />
background, the <strong>region</strong> has made some <strong>economic</strong> progress.<br />
Mtwara like the rest of <strong>Tanzania</strong> is predominately agricultural.<br />
The main occupation of the inhabitants of the <strong>region</strong> is farming.<br />
About 92 percent of the population is engaged in agriculture, apart<br />
from other rural activities like fishing, beekeeping and small scale<br />
industries. Approximately 85 percent of the <strong>region</strong>'s total area is<br />
arable land. However less than 20 percent of this is under<br />
cultivation. The average farm size per rural household (169,482<br />
households - 1988 Census) which averages 4.4 persons is<br />
estimated at 1.5 ha.<br />
Farm mechanization and oxenization are still far from realisation.<br />
The hand hoe is the common farming tool in the <strong>region</strong>. Major<br />
food crops include cassava, millet and sorghum. Only recently<br />
has maize gained popularity. Cashewnuts is the predominant cash<br />
crop in the <strong>region</strong>. Others are groundnuts and simsim. Livestock<br />
keeping is not traditional among the <strong>region</strong>'s population, hence<br />
contribution of this sector to the <strong>region</strong>'s economy is insignificant.<br />
Prospects for the mining industry in the <strong>region</strong> are great. Various<br />
34
minerals have been identified and exploited on a small scale.<br />
Since 1995 sapphire, christalbella, alexandrite, tourmaline and<br />
rhodolite have been mined in Masasi district.<br />
2.2 Regional GDP and Per Capita GDP:<br />
The <strong>region</strong>'s economy from the point of view of GDP earnings<br />
between the years 1980 and 1994 portrays a gradual but<br />
significant increase (Table II - 1). GDP earnings increased from<br />
T.shs. 1.099 billion in 1980 to T.shs. 62.491 billion in 1994. The<br />
year 1988 registered an exceptionally high increase of over 87<br />
percent in GDP earnings compared to that of the previous year. It<br />
is said that the increase in GDP in the year under mention was<br />
mainly caused by increased production in agricultural, fishing and<br />
mineral sectors. From that year the <strong>region</strong>'s economy was<br />
stimulated and continued to show remarkable increases in GDP<br />
earnings. These earnings came from various production activities<br />
and services. It is noted that the <strong>region</strong>'s average contribution to<br />
the Nation's GDP between 1980 and 1990 had been 3 percent<br />
but increased to 4 percent from 1991 to 1994 (Table II-1).<br />
Mtwara <strong>region</strong> ranks 14th in GDP contribution to the Nation's<br />
economy among the Mainland <strong>region</strong>s as by 1994 (Table II-2).<br />
It is further observed in Table II-1 that Mtwara <strong>region</strong>'s per<br />
Capita GDP at current prices trend over 15 years (1980 - 1994)<br />
indicates increased per capita earnings from T.shs. 1,385 in 1980<br />
to T.shs. 59,533 in 1994. However, when these per capita<br />
annual earnings are considered in terms of the U.S.A. dollar the<br />
picture changes. It is only during the first six years of the 1980s<br />
that the people in Mtwara had comparatively satisfactory<br />
35
purchasing power. The sudden fall of the value of the T.shilling in<br />
1986 and onwards meant the population in the <strong>region</strong> actually<br />
earned 50 - 60 percent less in terms of US dollar than they did in<br />
1982.<br />
TABLE II-I<br />
1980-1994<br />
Year<br />
THE GDP AND PER CAPITA GDP OF MTWARA REGION AT<br />
CURRENT PRICES AND PERCENTAGE CHANGE<br />
G.D.P. at<br />
current<br />
prices TShs<br />
million<br />
%<br />
chang<br />
e<br />
TShs<br />
Per Capita GDP %<br />
chang<br />
e<br />
Excha<br />
nge<br />
rate<br />
U.S.A<br />
.<br />
Dollars<br />
% Ave<br />
contributi<br />
on to<br />
National<br />
GDP<br />
1980 1,099 - 1,385 8.22 168 - 3<br />
1981 1,354 23.20 1,683 8.35 202 20.24 3<br />
1982 1,734 28.06 2,125 9.52 223 10.40 3<br />
1983 1,873 8.02 2,264 12.44 182 -<br />
18.39<br />
1984 2,254 20.34 2,687 18.16 148 -<br />
18.68<br />
3<br />
3<br />
1985 2,890 28.22 3,397 16.50 206 39.19 3<br />
1986 3,886 34.46 4,505 51.70 87 -<br />
57.77<br />
1987 5,198 33.76 5,943 83.70 71 -<br />
18.40<br />
3<br />
3<br />
1988 9,763 87.82 11,002 125.0<br />
0<br />
1989 15,342 57.14 16,812 192.0<br />
0<br />
88 23.94 3<br />
88 0.00 3<br />
36
1990 22,975 49.75 24,481 197.0<br />
0<br />
1991 29,330 27.66 30,390 234.0<br />
0<br />
124 40.91 3<br />
130 4.84 4<br />
1992 37,913 29.26 38,190 335.0<br />
0<br />
1993 49,786 31.32 48,776 480.0<br />
0<br />
114 -<br />
12.31<br />
102 -<br />
10.53<br />
4<br />
4<br />
1994 62,491 25.52 59,533 553.0<br />
0<br />
Ave 16,525.9 16,878.<br />
2<br />
108 5.88 4<br />
136.1 3.27<br />
Source:<br />
Planning Commission, Based on National Accounts of <strong>Tanzania</strong> 1976-1994, 11th Edition August<br />
1995.<br />
Fig. 12 (a): The GDP at current prices (million T.Shs), Mtwara <strong>region</strong> 1980-1994<br />
37
70,000<br />
60,000<br />
50,000<br />
40,000<br />
30,000<br />
20,000<br />
10,000<br />
0<br />
Fig. 12 (b): Per Capita GDP at current prices of Mtwara <strong>region</strong> 1980-1994<br />
60,000<br />
50,000<br />
40,000<br />
30,000<br />
20,000<br />
10,000<br />
0<br />
38
TABLE II:2<br />
Region<br />
AVERAGE ANNUAL REGIONAL GDP CONTRIBUTION<br />
BY PERCENTAGE TO THE NATIONAL GDP 1980-1994<br />
Average Annual<br />
GDP contribution %<br />
GDP contribution<br />
Ranking<br />
Mtwara 3.27 14<br />
Dar es Salaam 20.33 1<br />
Arusha 7.80 2<br />
Mwanza 7.67 3<br />
Mbeya 6,00 4<br />
Shinyanga 5.80 5<br />
Iringa 5.53 6<br />
Tanga 5.52 7<br />
Morogoro 4.67 8<br />
Kagera 4.60 9<br />
Kilimanjaro 3.67 10<br />
Mara 3.47 11<br />
Tabora 3.40 12<br />
Ruvuma 3.33 13<br />
Rukwa 3.13 15<br />
Dodoma 3.07 16<br />
Singida 2.87 17<br />
Kigoma 2.53 18<br />
Lindi 2.00 19<br />
Coast 1.00 20<br />
Total 100.00<br />
39
Source:<br />
Planning Commission Based on National Accounts of <strong>Tanzania</strong> 1976-1994 11th Edition, August<br />
1995.<br />
It is of interest to compare Mtwara <strong>region</strong>'s GDP and per capita<br />
GDP against its neighbouring <strong>region</strong>s of Lindi, Ruvuma, Morogoro<br />
and Coast. These <strong>region</strong>s besides being neighbouring also have<br />
more or less similar agricultural based economies. Table II-3<br />
shows the GDP and Per Capita GDP of each of these neighboring<br />
<strong>region</strong>s between 1980 and 1994. Morogoro <strong>region</strong> shows very<br />
outstanding positive generation of both GDP and Per Capital<br />
GDP during the entire period of 10 years under consideration.<br />
Major contributors to Morogoro <strong>region</strong>s economy are the sugar<br />
estates of Kilombero and Mtibwa. Mtwara <strong>region</strong> ranks second in<br />
<strong>economic</strong> development among these five <strong>region</strong>s. Mtwara's major<br />
contributors is the cashewnut crop which accounts for over 25<br />
percent of the <strong>region</strong>'s economy. Forty percent of the nation's<br />
output of cashewnut comes from Mtwara <strong>region</strong>.<br />
Ruvuma ranks third. Maize is Ruvuma's main <strong>economic</strong> earner<br />
followed by coffee and tobacco. Lindi and Coast <strong>region</strong>s rank<br />
fourth and fifth respectively. Economic bases of these two <strong>region</strong>s<br />
are weak in having no major cash crop sufficiently developed to<br />
have an impact.<br />
Morogoro <strong>region</strong> has other <strong>economic</strong> advantages in that during<br />
the period under discussion it had many operating factories.<br />
Output products and employment generation contributed<br />
enormously to the <strong>economic</strong> growth of the <strong>region</strong>. Mtwara on the<br />
other hand holds the position of the most important<br />
communication centre or transport mode for the whole southern<br />
zone, by having the Port of Mtwara.<br />
40
TABLE II-3<br />
Mtwara<br />
COMPARATIVE GDPs AND PER CAPITA GDPs<br />
FOR MTWARA, RUVUMA, LINDI, MOROGORO<br />
AND COAST AT CURRENT PRICES 1985-1994<br />
Lindi<br />
Ruvuma<br />
Morogoro<br />
Coast<br />
Year<br />
Regioon<br />
Region<br />
Region<br />
Region<br />
Region<br />
GDP<br />
(TShsml.)<br />
Per<br />
capita<br />
GDP<br />
Tshs<br />
GDP<br />
(Tshs<br />
ml.)<br />
Per<br />
capita<br />
GDP<br />
Tshs<br />
GDP<br />
(Tshs<br />
Ml.)<br />
Per<br />
capita<br />
GDP<br />
Tshs<br />
GDP<br />
(Tshs<br />
ml.)<br />
Per<br />
capita<br />
GDP<br />
Tshs<br />
GDP<br />
(Tshs<br />
mil)<br />
Per<br />
capita<br />
GDP<br />
Tshs<br />
1985 2890 3397 1416 2336 3329 4691 4436 3946 1037 1735<br />
1986 3886 4505 1295 2095 3886 5296 5182 4493 1295 2124<br />
1987 5198 5943 7076 11222 9163 12077 6788 5737 1675 2689<br />
1988 9763 11002 13204 20471 17210 22023 11977 9550 3128 4914<br />
1989 15,342 16812 21103 31815 27412 34109 18669 14476 5014 7661<br />
1990 22,975 24481 11153 16350 18063 21856 35881 27054 6637 9860<br />
1991 29,330 30390 13860 19756 22909 26954 44974 32974 8372 12095<br />
1992 37,913 38190 17962 24897 29567 33828 54969 39189 10504 14756<br />
1993 49,786 48776 23299 31404 38638 42985 67846 47034 13312 18183<br />
1994 62,491 59533 29253 38340 48565 52537 88073 59370 17033 22624<br />
Compiled Data: Based on National Accounting of <strong>Tanzania</strong> 1976-1994 11th Edition, August<br />
1995.<br />
41
Fig.13 (a): Comparative GDPs (TShs. mill) Mtwara, Ruvuma, Lindi,<br />
Morogoro and Coast <strong>region</strong>s at current prices 1985-1994<br />
90000<br />
80000<br />
70000<br />
60000<br />
50000<br />
40000<br />
30000<br />
20000<br />
10000<br />
0<br />
1985<br />
1986<br />
1987<br />
1988<br />
1989<br />
1990<br />
1991<br />
1992<br />
1993<br />
1994<br />
Mtwara Lindi Ruvuma Morogoro Coast<br />
Fig.13 (b): Comparative Per Capita GDPs (TShs.) Mtwara, Ruvuma, Lindi,<br />
Morogoro and Coast <strong>region</strong>s at current prices 1985-1994<br />
60000<br />
50000<br />
40000<br />
30000<br />
20000<br />
10000<br />
0<br />
1985<br />
1986<br />
1987<br />
1988<br />
1989<br />
1990<br />
1991<br />
1992<br />
1993<br />
1994<br />
Mtwara Lindi Ruvuma Morogoro Coast<br />
42
2.3 PRODUCTIVE SECTORS<br />
2. 3.1 AGRICULTURE<br />
Agriculture is the predominant <strong>economic</strong> sector in Mtwara <strong>region</strong> .<br />
About 90 per cent of the agricultural output is by small holder<br />
farmers. The main food crops being cassava, sorghum, millet and<br />
with increasing importance maize and paddy. Cashewnut is the<br />
most important cash crop. Sesame and groundnuts also<br />
contribute to the cash income of the peasant farmer. Coconut is<br />
important along the Coast. All these crops are produced over<br />
cultivated land of about 270,300 hectares. The total arable land is<br />
599,500 Ha. (Rolling Plan and Forward Budget 1967/98-<br />
1999/2000) This implies that about 55 percent of the arable land<br />
is not yet exploited.<br />
It is known that about two decades or so ago the <strong>region</strong> had<br />
chronic problem of food deficiency. Considerable food stuff had<br />
to be imported into the <strong>region</strong>. It is for this reason that food<br />
production strategies aimed at increasing food production at the<br />
district levels were formulated with the sole objective of achieving<br />
food sufficiency at the household level throughout the <strong>region</strong>.<br />
These district programmes were:-<br />
ONJAMA of Masasi district aimed at eradicating food deficiency<br />
in the district. TUTUMANE a programme aimed at boosting up<br />
crop production in NewaLa district and KUCHAKUMI was to<br />
create food sufficiency in Mtwara rural district while KIWAMI<br />
was launched to increase food production in Mtwara urban<br />
district. All these programmes succeeded in their objective<br />
43
through mobilisation of households for increased food production.<br />
Not only did food production in these districts increase but there<br />
were reports of decreased severe malnutrition among children<br />
under 5 years.<br />
Food Crops:<br />
Major food crops produced in the <strong>region</strong> include cassava,<br />
sorghum, millet, paddy and maize. Leguminous crops grown<br />
extensively as protein sources are peigon peas, cowpeas,<br />
bambaranuts and groundnuts. However, maize and paddy are<br />
grown in limited areas and quantity. Although a large number of<br />
the population prefer rice and maize as their main food crops, the<br />
<strong>region</strong>al authorities emphasise production of cassava and sorghum<br />
due to their tolerance to drought conditions which sometimes<br />
prevails in the <strong>region</strong>. Table II-4 highlights the general trend of<br />
food production between 1990-1997.<br />
TABLE II-4: MTWARA REGION FOOD CROPS PRODUCTION<br />
IN TONES BY DISTRICTS<br />
Crops 1990/9<br />
1<br />
1991/9<br />
2<br />
1992/9<br />
3<br />
1993/9<br />
4<br />
1994/9<br />
5<br />
1995/9<br />
6<br />
1996/9<br />
7<br />
Cassava 107,00<br />
0<br />
101,41<br />
0<br />
129,41<br />
5<br />
177,31<br />
0<br />
230,14<br />
0<br />
332,70<br />
4<br />
404,46<br />
3<br />
Sorghum 46,290 11,610 90,203 14,000 27,040 52,091 63,823<br />
Maize 28,830 19,650 74,671 15,120 58,130 90,343 106,44<br />
4<br />
Paddy 11,180 15,300 43,592 17,440 33,620 53,612 24,716<br />
Cow/pigeon<br />
peas<br />
20,380 65,880 22,750 34,000 21,210 17,260 30,252<br />
44
Source: Regional Agricultural Development Office, Mtwara 1997<br />
45
Fig. 14: Mtwara Region Food Crops Production in Tones by Districts, 1990/91 -<br />
1996/97<br />
450,000<br />
400,000<br />
350,000<br />
300,000<br />
250,000<br />
Cassava<br />
Sorghum<br />
Maize<br />
Paddy<br />
Cow/pigeon peas<br />
200,000<br />
150,000<br />
100,000<br />
50,000<br />
0<br />
1990/91 1991/92 1992/93 1993/94 1994/95 1995/96 1996/97<br />
Cassava:<br />
Production figures in Table II-4 clearly indicates how the cassava<br />
crop performs in the <strong>region</strong>. Production has increased steadily<br />
from the 1990/91 growing season to 1996/97. This increase in<br />
production is 278 per cent over the period of 7 years. Cassava<br />
constituted about 50 percent of total major food production in<br />
1990/91 and 64 percent in 1996/97. In times of surplus<br />
production of other favoured food crops such as maize surplus,<br />
cassava experience difficulties of getting an attractive market<br />
price. This marketing problem has been experienced by peasant<br />
farmers in the last three growing season. This is partly due to the<br />
introduction of free market system and because of falling prices on<br />
the world market. A proposition of establishing cassava starch<br />
processing plants in the <strong>region</strong> could be of worthwhile<br />
consideration in widening the market for surplus cassava.<br />
46
Sorghum:<br />
Sorghum a drought resistant crop capable of being grown all over<br />
the <strong>region</strong> including areas of marginal rainfall. It takes second<br />
position in importance as a food crop. Inspite of its drought<br />
resistance advantage the crop is not popular with peasants.<br />
Production data of sorghum during the years 1990-1997 indicated<br />
in Table II-4 shows an ups and downs growth pattern. A record<br />
production was experienced back in 1992/93 when about 90,203<br />
tones were realised in the <strong>region</strong>. A year later 1993/94<br />
production of the crop went down to 14,000 tones. This was<br />
close to its lowest level of 11,610 tons in 1991/92. From there<br />
on there has been a remarkable increase in production. it is clear<br />
that combined efforts of increased production of cassava and<br />
sorghum could be the permanent solution to the food crised in the<br />
<strong>region</strong> that tends to reoccur every now and then.<br />
This crop should continue to be campaigned for production as a<br />
hedge food crop in time of failures of other food crops for drought<br />
reasons or insect infestation as in the case of cassava mealy bug.<br />
Maize:<br />
Maize has recently gamed popularity as a food grain in Mtwara<br />
<strong>region</strong>. In table II-4 one observes fluctuating maize production in<br />
the seven years (1990-1997). Maize popularity among the<br />
peasants farmers is gaining momentum. This is in contrast to<br />
sorghum which is declining. It is during the years 1991/92 and<br />
1993/94 only that maize contributed less than 10 percent of total<br />
food crops. During the remaining years shown in Table II-4 maize<br />
47
contributed between 13.5% in 1990/91 and 17% in 1996/97. It<br />
is a common phenomenon that maize has an ever demanding<br />
market in and outside the <strong>region</strong>. However, farmers should be<br />
well advised to blend their maize crop production with cassava<br />
and sorghum for the reasons given earlier.<br />
Paddy:<br />
The conditions in Mtwara <strong>region</strong> are good for paddy production.<br />
The crop can be grown in the fertile river valleys partly flooded<br />
during the rainy season. The crop is increasingly becoming an<br />
important food crop in the <strong>region</strong>. It ranks fourth after cassava,<br />
sorghum and maize. Table II-4 shows a fluctuating production<br />
trend for paddy, between 1990/91 and 1996/97. Paddy<br />
production contributed 10% and 12% of food production in<br />
1992/93 and 1995/96 growing seasons respectively. In other<br />
years paddy contributed between 4% and 9%. It will be through<br />
the development of small scale irrigation that production of paddy<br />
will be speeded up. Therefore the <strong>region</strong> should embark on the<br />
development of potential river valleys for irrigation.<br />
Cow/Pigeon Peas:<br />
Cow peas and pigeon peas are the main pulses of Mtwara <strong>region</strong>.<br />
They are primarily grown for home consumption. Table II-4<br />
shows fluctuating production between 1990/91 and 1996/97.<br />
Generally these pulses have contributed less than 10 percent of<br />
total main food crops. It is only during the year 1991/92 that they<br />
contributed about 30 percent. However, there is a need to<br />
increase production of these pulses for the sake of a balanced<br />
48
diet. Adequate production of pulses which could encourage the<br />
positive trend of reduced severe malnutrition among the under<br />
fives in the <strong>region</strong>.<br />
Food Adequacy:<br />
Mtwara <strong>region</strong> experiences a serious problem of a high number of<br />
under weight babies at birth. Sources from the Ministry of Health<br />
had reported in 1995 that in the <strong>region</strong> out of 23,127 new born<br />
babies weighed, 850 babies had severe under weight (i.e. 60%<br />
below normal) and 4,138 babies were moderately under weight<br />
i.e. between 60% and 80% of normal. The total of 4,988 under<br />
weight babies at birth is equivalent to 22 per cent. This data is a<br />
direct reflection on the nutrition status of the mothers. Proper<br />
nutrition for expectants leads to normal weights of babies at birth.<br />
These mothers lacked adequate protein. It is common<br />
knowledge that Mtwara <strong>region</strong> has a very small livestock<br />
population of 15,046 cattle 84,864 goats and 14,519 sheep<br />
(Livestock Population Census 1984).<br />
Taking Singida <strong>region</strong> for comparison with Mtwara <strong>region</strong> in<br />
respect of children under nutrition at birth, the following interesting<br />
information is revealed.<br />
Parameters<br />
49<br />
Mtwara<br />
Regions<br />
Singida<br />
Population (Projection 1996) 1,005,405 962,000<br />
Livestock Units (1996 Est.) 52,500 1,592,826<br />
Livestock Units per 1000 people 52 1,656<br />
% Babies Severely under weight 3.7 1.2<br />
% Babies Moderately Under weight 17.9 4.1
% Total Under weights 22.0 5.3<br />
Source: Compiled Data: Health Statistics Abstract, 1997.<br />
The above table shows that 22% of children born in Mtwara<br />
<strong>region</strong> are under weight compared to only 5.3 for Singida <strong>region</strong>.<br />
The national average is 9 percent. This is enough evidence to<br />
show that there is no protein adequacy in Mtwara <strong>region</strong>.<br />
Requirements surpass availability. It is important that extra protein<br />
production of either form must be stepped up in the <strong>region</strong>. Since<br />
livestock keeping in the <strong>region</strong> is unaffordable by the majority and<br />
it is not a tradition among the population, the only alternative in the<br />
short run is to encourage production of more pulses than at<br />
present.<br />
Cash Crops:<br />
Major cash crops grown in Mtwara <strong>region</strong> are cashewnuts,<br />
groundnuts and sesame. Table II-5 shows general production<br />
trends of these major cash crops in the <strong>region</strong> between the years<br />
1990/91 and 1995/96.<br />
TABLE II-5: PRODUCTION OF MAJOR CASH CROPS 1990/91<br />
- 1995/96 MTWARA REGION (TONS)<br />
Crop 1990/91 1991/92 1992/93 1993/94 1994/95 1995/96<br />
Cashewnuts 15,209 21,286 17,943 21,834 27,463 49,106<br />
Groundnuts 6,150 21,790 41,220 13,010 12,040 17,771<br />
Sesame 4,020 2,940 7,380 1,860 3,920 10,965<br />
Others (Soya and<br />
Sunflower)<br />
5,270 230 1,948 - 170 95<br />
Total 30,649 46,246 68,491 36,704 43,593 77,937<br />
50
Source: Regional Agricultural Development Office, Mtwara, 1997.<br />
51
Fig. 15: Production of major cash crops 1990/91 - 1995/96 Mtwara <strong>region</strong> (tons)<br />
50,000<br />
45,000<br />
40,000<br />
35,000<br />
30,000<br />
25,000<br />
20,000<br />
15,000<br />
10,000<br />
5,000<br />
0<br />
1990/91 1991/92 1992/93 1993/94 1994/95 1995/96<br />
Cashewnuts Groundnuts Sesame Others (Soya and Sunflower)<br />
Cashewnut:<br />
According to 1992 statistics of export crops, cashewnut<br />
accounted for 11 percent of agricultural commodities exported by<br />
the country. Leading crops were Cotton, Coffee, Tobacco, Tea<br />
and Sisal.<br />
52
Cashew export for 1981 - 1991 were as follows: (Values in<br />
Million U.S. Dollars).<br />
Years: 1981 1982 1983 1984 1985 1986 1987 1988 1989 1990 1991<br />
Million<br />
U.S.A<br />
$<br />
60.4<br />
8<br />
25.5<br />
5<br />
12.9<br />
8<br />
28.8<br />
2<br />
13.4<br />
3<br />
15.7<br />
7<br />
13.9<br />
6<br />
19.4<br />
8<br />
13.7<br />
0<br />
12.2<br />
7<br />
16.7<br />
0<br />
Cashewnut is not only one of the sources of foreign exchange<br />
earnings for the country but it is also a regular source of income<br />
for producers of the crop, all of whom are smallholders.<br />
Cashewnut production in <strong>Tanzania</strong> is primarily produced for<br />
export purposes. A negligible amount of the crop is consumed<br />
domestically.<br />
TABLE II-6: MTWARA REGION CASHEWNUT PRODUCTION<br />
IN TONS BY DISTRICT 1990/91 - 1995/96:<br />
Distric<br />
t<br />
1990/9<br />
1<br />
1991/9<br />
2<br />
1992/9<br />
3<br />
1993/9<br />
4<br />
1994/9<br />
5<br />
1995/9<br />
6<br />
Total %<br />
Newala 8,220 11,764 7,033 10,901 13,754 27,749 79,421 52<br />
Masasi 4,409 5,538 5,960 7,894 10,722 10,319 44,842 29<br />
Mtwara 2,580 3,984 4,950 3,039 2,987 11,038 28,578 19<br />
Total 15,209 21,286 17,943 21,834 27,463 49,106 152,84<br />
1<br />
100<br />
Source: Regional Agricultural Development Office, Mtwara 1997.<br />
53
Fig. 16: Mtwara <strong>region</strong> cashewnut production in tons per district 1990/91 -<br />
1995/96<br />
30,000<br />
25,000<br />
20,000<br />
15,000<br />
10,000<br />
5,000<br />
0<br />
1990/91 1991/92 1992/93 1993/94 1994/95 1995/96<br />
Newala Masasi Mtwara<br />
Table II-5 reveals that cashewnuts is the major cash crop in the<br />
<strong>region</strong>. It constituted an average of 50.9 percent of the total<br />
volume of cash crops raised during 1990/91 to 1995/96.<br />
1992/93 was exceptional in that cashewnut constituted only 26%<br />
of total tonnage of cash crops in the <strong>region</strong>. Groundnuts in the<br />
same year recorded a very impressive figure of 41,220 tons<br />
equivalent to 60 percent of total cash crops grown. Groundnuts<br />
accounted for at least 20 percent of total tonnage of cash crops<br />
between 1990/91 - 1995/96. Sesame, Soya and Sunflower are<br />
also of <strong>economic</strong> importance in the <strong>region</strong>.<br />
It is officially recognised that Mtwara <strong>region</strong> is the main cashewnut<br />
producer in the country. About 50 percent of national production<br />
comes from this <strong>region</strong>. Within the <strong>region</strong> over 50 percent of the<br />
54
cashewnut crop comes from Newala district. Masasi ranks<br />
second with 29% contribution and Mtwara district the least with<br />
an average contribution of 19 percent (Table II-6).<br />
In general production of cashewnut in the <strong>region</strong> has been<br />
increasing since the growing season of 1990/91. A slight drop<br />
was noted in 1992/93.<br />
The increase in the <strong>region</strong>'s production from 8,220 tons in<br />
1990/91 to 27,749 tons in the 1995/96 season is the result of a<br />
sustained and vigorous cashewnut tree improvement campaign.<br />
The campaign focused on judicial use of sulphur as a fungicide<br />
combined with vigorous agricultural husbandry interventions which<br />
rainforced the benefits from sulphur spraying. The Cashewnut<br />
Improvement Programme (CIP) which started in 1990 and ended<br />
in 1996 played a major role in the revival of the cashewnut<br />
industry in the <strong>region</strong>. The programme packages comprised of<br />
cashew research efforts, distribution of improved seed and<br />
seedlings, marketing and availability of cashew inputs, in particular<br />
sulphur and relevant appliances. In this case, annual sulphur<br />
supply increased from 229 tons in 1989/90 to 1382 tons in<br />
1994/95. Distribution of 10 tons of improved seed and 240,038<br />
improved grafted seedlings to farmers between 1992 and 1996<br />
greatly influenced increase of cashewnut output. The <strong>region</strong><br />
however, has still a lot of work ahead to bring up production of<br />
the crop near to or to the levels reached in the early seventies<br />
when marketed/production of 60,000 tons of the crop were<br />
recorded (See Table II-7).<br />
55
Cashewnut had been on decline since 1974/75 to reach low level<br />
of 7,200 tons in 1985/86. This decline is 88 percent fall in<br />
production against that of 1973/74. Cashewnut production<br />
showed positive growth from 1991/92 to 1995/96 at national<br />
level and in Mtwara <strong>region</strong>.<br />
TABLE II-7: MTWARA REGIONAL CASHEWNUT PRODUCTION AS<br />
COMPARED WITH TANZANIA MAINLAND<br />
RODUCTION 1973/74 - 1995/96<br />
Year<br />
<strong>Tanzania</strong><br />
Production (Tons)<br />
Mtwara Region<br />
1973/74 145,000 60,000 41<br />
1974/75 118,947 48,000 40<br />
1975/76 83,734 35,000 42<br />
1976/77 97,652 38,000 39<br />
1977/78 68,383 35,000 51<br />
1978/79 57,006 23,000 40<br />
1979/80 41,510 14,926 36<br />
1980/81 60,942 29,043 48<br />
1981/82 44,539 19,508 44<br />
1982/83 32,352 15,352 47<br />
1983/84 47,960 18,601 39<br />
1984/85 32,815 13,745 42<br />
1985/86 16,548 7,200 44<br />
%<br />
56
1986/87 24,256 12,823 53<br />
1987/88 24,275 12,423 51<br />
1988/89 19,275 11,007 57<br />
1989/90 19,935 8,500 43<br />
1990/91 28,470 14,800 52<br />
1991/92 41,238 22,100 54<br />
1992/93 39,323 17,943 46<br />
1993/94 46,598 23,000 49<br />
1994/95 63,403 27,536 43<br />
1995/96 81,729 49,107 60<br />
Source: Mtwara Regional Commissioner’s Office (1996)<br />
Fig. 17: Mtwara Regional cashewnut production as compared with<br />
<strong>Tanzania</strong> Mainland poduction 1973/74 - 1995/96<br />
160,000<br />
140,000<br />
120,000<br />
<strong>Tanzania</strong> Mainland<br />
Mtwara Region<br />
100,000<br />
80,000<br />
60,000<br />
40,000<br />
20,000<br />
0<br />
1973/74<br />
1975/76<br />
1977/78<br />
1979/80<br />
1981/82<br />
1983/84<br />
1985/86<br />
1987/88<br />
1989/90<br />
1991/92<br />
1993/94<br />
1995/96<br />
57
The same picture of general cashewnut production decline<br />
nationally is observed from Table II-7. Since Mtwara <strong>region</strong> had<br />
been contributing more to national production than any other<br />
single <strong>region</strong>, its poor performance in the years between 1974/75<br />
to 1989/90 directly affected the Mainland's total production.<br />
Poor performance of the cashewnut industry from 1974/75<br />
onward has been explained to be due to three major causes.<br />
These factors combined together to make cashew an unattractive<br />
and unprofitable crop for most farmers. The reasons were:<br />
(i)<br />
(ii)<br />
(iii)<br />
The dramatic spread of Powdery Mildew (Odium<br />
anacardi) which significantly reduced production.<br />
Decline in producer prices as percentage of export parity<br />
price from 70% in the early seventies to 30% in 1987.<br />
The policy of villagization whereby farmers' homes were<br />
reallocated into villages far away from their farms.<br />
TABLE II-8: CASHEWNUT PRODUCTION (TONS) BY MAJOR<br />
PRODUCING REGIONS IN TANZANIA MAINLAND 1991/92 -<br />
1995/96:<br />
Region 1991/9<br />
2<br />
1992/9<br />
3<br />
1993/9<br />
4<br />
1994/9<br />
5<br />
1995/9<br />
6<br />
Total<br />
As % of<br />
Total<br />
Mtwara 22,100 17,943 23,000 27,536 49,107 139,68<br />
6<br />
51.1<br />
Lindi 5,913 7,435 5,944 9,063 11,585 39,940 14.6<br />
Coast 4,163 2,333 7,468 12,200 6,855 33,019 12.1<br />
Tanga 2,246 2,122 2,148 500 978 7,994 2.9<br />
Ruvuma 2,854 5,165 4,981 6,640 7,997 27,637 10.1<br />
D’Salaam 3,840 4,131 3,576 5,864 1,591 19,002 7.0<br />
58
Others 97 194 652 1,000 3,613 6,156 2.2<br />
Total 41,213 39,323 47,769 62,803 81,726 272,83<br />
4<br />
100.0<br />
Source: Ministry of Agriculture, 1997.<br />
Fig. 18: Cashewnut production (tons) by major producing <strong>region</strong>s in <strong>Tanzania</strong><br />
Mainland 1991/92 - 1995/96:<br />
50,000<br />
45,000<br />
40,000<br />
35,000<br />
30,000<br />
25,000<br />
20,000<br />
15,000<br />
10,000<br />
5,000<br />
0<br />
Mtwara Lindi Coast Tanga Ruvuma D’Salaam Others<br />
1991/92 1992/93 1993/94<br />
1994/95 1995/96<br />
The table above tries to compare Mtwara <strong>region</strong> with other major<br />
cashewnut producing <strong>region</strong>s in the country. It is by far the<br />
biggest producer, accounting for 51.1 percent of all cashewnut<br />
produced in the country between 1991/92 to 1995/96. Lindi<br />
59
egion ranks second with 14.6 percent contribution, followed by<br />
Coast, Ruvuma, Dar-es-Salaam and Tanga <strong>region</strong>s in that<br />
descending order.<br />
60
Irrigation:<br />
Irrigation farming in Mtwara <strong>region</strong> is feasible and would greatly<br />
make up for the loss on agricultural production caused by<br />
seasonal and impredictable rainfall. Currently very little<br />
development on irrigation has been undertaken though there exists<br />
several potential irrigable valleys. These are of the Ruvuma river<br />
in Mtwara, Newala and Masasi districts, Mbangala and Mtesei in<br />
Masasi, Mambi in Mtwara and Newala districts and Mbuo in<br />
Mtwara. Lack of capital, appropriate technology and will, stunts<br />
development of the irrigation option.<br />
2.3.2 LIVESTOCK:<br />
The standard of livestock keeping in Mtwara <strong>region</strong> is very low.<br />
For that reason the <strong>region</strong> experiences great deficiency of animal<br />
pterion of livestock origin. The livestock population status<br />
estimated in 1985 is presented in table II-9.<br />
TABLE II-9: ESTIMATED LIVESTOCK POPULATION IN<br />
MTWARA REGION BY DISTRICT 1985:<br />
District Cattle Goats Sheep Pigs Poultry<br />
Mtwara 2,820 14,919 3,382 151 105,965<br />
Newala 2,621 67,947 2,346 186 1,205,353<br />
Masasi 9,022 4,598 7,746 4,252 1,315,722<br />
Total 14,463 88,464 13,470 4,589 2,627,040<br />
Source: Regional Livestock Department records Mtwara <strong>region</strong>, 1985.<br />
61
Fig. 19 (a): Estimated livestock population in Mtwara district, 1985<br />
120,000<br />
100,000<br />
80,000<br />
60,000<br />
40,000<br />
20,000<br />
0<br />
Cattle Goats Sheep Pigs Poultry<br />
Fig. 19 (b): Estimated livestock population in Newala district, 1985<br />
1,400,000<br />
1,200,000<br />
1,000,000<br />
800,000<br />
600,000<br />
400,000<br />
200,000<br />
0<br />
Cattle Goats Sheep Pigs Poultry<br />
62
Fig. 19 (c): Estimated livestock population in Masasi district, 1985<br />
1400000<br />
1200000<br />
1315722<br />
1000000<br />
800000<br />
600000<br />
400000<br />
200000<br />
0 9022 4598 7746 4252<br />
Cattle Goats Sheep Pigs Poultry<br />
General trend of livestock population from 1972 to 1994 is<br />
highlighted in Table II-10.<br />
TABLE II-10: LIVESTOCK POPULATION IN MTWARA<br />
REGION FROM 1972 - 1994 (Estimate)<br />
Year Cattle Goats and Sheep Pigs Poultry<br />
1972 9,540 54,130 1,520 230,600<br />
1985 14,463 88,464 4,589 2,627,040<br />
1994 19,700 164,000 6,000 3,200,000<br />
Source: Compiled Data: Regional Livestock Development Office, Mtwara Region 1997.<br />
There is land available in the <strong>region</strong> for increased cattle keeping<br />
especially in Masasi and Mtwara districts. However, poor animal<br />
husbandry practices among the inhabitants, and common cattle<br />
63
diseases mainly rinderpest and trypanosomiasis due to high tsetse<br />
fly infestation in the <strong>region</strong> have been singled out as possible<br />
causes for poor development of the livestock industry in the<br />
<strong>region</strong>. Goats require little care and for this reason they are more<br />
numerous than cattle especially in Newala district. Pigs are bred<br />
almost exclusively in Masasi district.<br />
The slight increase in population over a period of about 10 years<br />
(table II-10) is credited to the established livestock rearing centres<br />
of Mbawala, Kitere and Nangaramo. The Mtwara Rural<br />
Integrated Project Support (RIPS) greatly contributed to<br />
distribution of goats to the rest of the <strong>region</strong> from its centre in<br />
Newala district. The strategy of the programme was "Loan a goat<br />
and repay a goat to another farmer". By 1994 about 148<br />
participants had benefited from the programme.<br />
It was reported in 1994 that meat consumption in the <strong>region</strong><br />
ranged between 1 - 1.5 kg/annum per head of the population,<br />
while the national average was estimated at 8-9 kgs/annum per<br />
person. Milk too is hardly available to the majority of the people<br />
in the <strong>region</strong>.<br />
The current status of livestock infrastructure in the <strong>region</strong> is not<br />
very clear. However, it was reported earlier in 1985 that there<br />
were a total of 30 dips, 20 crushes and one livestock research<br />
centre.<br />
64
2.3.3 FORESTRY:<br />
About 8.33 percent of <strong>region</strong>al land area of 1,672,000 Ha. is<br />
covered by forest reserves. This is 139,295 Ha. The biggest<br />
proportion of the forest cover in the <strong>region</strong> is in Masasi district. A<br />
total of 130,545 Ha. of forest reserves falls under central<br />
government. This is 93.7%. Another 8,749 Ha. or 6.3% of total<br />
forest reserves is owned by District councils. There are altogether<br />
16 forest reserves in the <strong>region</strong>. Most of them are in Masasi<br />
district.<br />
A large part of forest composition in these forest areas is of<br />
various valuable tree species like Mpingo (Dalbergia melanoxylo),<br />
Mninga (Pterocarpus angolensis) and Mvule (Mellicia excelsa).<br />
These forests are rich in valuable timber but their exploitation has,<br />
been very minimal. However, from an environmental point of<br />
view this low exploitation of forests is a blessing in disguise.<br />
The existing exploitation of forests reserves is carried out by those<br />
dealing in lumbering and wood carving. Generally forest<br />
harvesting in the <strong>region</strong> for charcoal and firewood is carried out in<br />
open woodland areas and other forests outside the reserves.<br />
Table II-11 shows revenue collected from forest products<br />
referred above.<br />
65
TABLE II-11: REVENUE COLLECTED FROM FOREST PRODUCTS IN<br />
MTWARA REGION 1992 - 1997:<br />
Year<br />
Timber Volume Cubic<br />
Meters<br />
Value T.shs.<br />
1992/93 486.50 3,266,752<br />
1993/94 326.80 1,238,637<br />
1994/95 406.85 3,684,143<br />
1995/96 416.00 7,420,019<br />
1996/97 180.65 7,170,895<br />
Total 1,816.80 22,780,446<br />
Source: Mtwara Regional Forest Office, 1997.<br />
Fig. 20(a): Timber Volume Cubic Meters produced, Mtwara <strong>region</strong> 1992/93 -<br />
1996/97<br />
500<br />
450<br />
400<br />
350<br />
300<br />
250<br />
200<br />
150<br />
100<br />
50<br />
0<br />
1992/93 1993/94 1994/95 1995/96 1996/97<br />
66
Fig. 20(b): Revenue collected from forests in Tshs. Mtwara <strong>region</strong> 1992/93 -<br />
1996/97<br />
8,000,000<br />
7,000,000<br />
6,000,000<br />
5,000,000<br />
4,000,000<br />
3,000,000<br />
2,000,000<br />
1,000,000<br />
0<br />
1992/93 1993/94 1994/95 1995/96 1996/97<br />
The table reflects the low value of timber in 1992/93 through<br />
1994/95. The year 1995/96 - 1996/97 experienced better prices<br />
for timber and especially so in 1996/97. Still the government<br />
earned very little revenue from the resource compared to what lies<br />
untapped.<br />
Demand for forest products in the <strong>region</strong> mainly firewood,<br />
charcoal, building poles and timber is more than what the <strong>region</strong><br />
can give out without replacement. This demand for wood<br />
products will continue to rise every year as the population<br />
increases and particularly so as long as shifting agriculture remains<br />
in favour. Some programmes have already started appearing on<br />
the scene. The <strong>region</strong> has been implementing for same years a<br />
programme of tree planting or establishment of community<br />
woodlots. These in essence are meant to meet the daily fuelwood<br />
requirements for the community and for other uses. The general<br />
trend towards implementing this objective is indicated in Table II-<br />
12.<br />
67
TABLE II-12: MTWARA REGION AFFORESTATION<br />
PROGRAMME 1992/93 - 1996/97:<br />
Year<br />
Tree Seedling<br />
Production<br />
Planted Area (Ha.)<br />
Target<br />
Actual<br />
1992/93 500,000 422,800 248.7<br />
1993/94 350,000 292,000 171.8<br />
1994/95 75,000 65,934 38.8<br />
1995/96 20,000 18,057 10.6<br />
1996/97 300,000 259,000 152.4<br />
Total 1,245,000 1,057,791 622.3<br />
Source: Regional Forest Office, Mtwara 1997.<br />
It is appreciated that some positive action is being taken to<br />
mitigate the end result of deforestation. But the pace appears to<br />
be too far behind the speed of destruction. For instance it took 5<br />
growing seasons to establish 622.3 Ha. and by the same logic it<br />
means it would take 29 years to establish 18,250 Ha. deforested<br />
in 1988.<br />
In this case, Mtwara <strong>region</strong> is required to take measures of<br />
planting more tree woodlots at both community and household<br />
levels. At the same time continue dermacating and reserving more<br />
forest reserves and up keeping the present reserves by preventing<br />
encroachment in these areas.<br />
68
2.3.4 FISHERY:<br />
Mtwara Coastline stretches from the Ruvuma River in the South<br />
to the Lindi <strong>region</strong> border, a distance of about 125 km. The area<br />
is characterised by a narrow continental shelf extending to no<br />
more than 8 km offshore. Fishing in the <strong>region</strong> has been carried<br />
out along this coast entirely at traditional subsistence level. To<br />
some extent there has been fishing activities along the |Ruvuma<br />
river, in the inland lakes (Kitere and Chidya) and in some ponds<br />
constructed by individual villages. The amount of fish landed per<br />
head per year in Mtwara <strong>region</strong> remains very small indeed, at 2<br />
kgs. The national average amount of landed fish is 12 kgs.<br />
During the past decade or so, returns from fishing have declined<br />
because resources close to the coast have been over exploited.<br />
Fishing can only be profitably carried out in the high seas where<br />
artisanal fishermen cannot reach.<br />
In 1993 about 2,500 fishermen in about 19 villages along the<br />
Indian Ocean coastline were engaged in fishing. The fishing<br />
industry mainly along the coast not only provides the population<br />
with food (protein and fats) but also generates employment and<br />
income. Table II-13 shows returns of fish landed by artisan<br />
fishermen.<br />
69
TABLE II-13: SALES IN TONS AND VALUE OF FISH CATCH LANDED<br />
BY ARTISAN FISHERMEN, MTWARA REGION 1991 - 1996:<br />
Year Amount of Fish (M.Tons) Value T.Shs.<br />
1991/92 13,143.99 1,147,789,440<br />
1992/93 15,423.57 1,807,536,737<br />
1993/94 16,194.75 2,711,314,624<br />
1994/95 587.90 141,604,780<br />
1995/96 589.90 141,694,700<br />
Total 45,940.11 6,239,939,281<br />
Source: Regional Natural Resources Office, Mtwara, 1997.<br />
Fig. 21 (a): Sales in tons of fish catch landed by Artisan Fishermen, Mtwara Region<br />
1991 - 1996<br />
18000<br />
16000<br />
14000<br />
12000<br />
10000<br />
8000<br />
6000<br />
4000<br />
2000<br />
0<br />
1991/92 1992/93 1993/94 1994/95 1995/96<br />
70
Fig. 21 (b): Value of fish (T.Shs.) catch landed by Artisan Fishermen, Mtwara Region<br />
1991 - 1996<br />
3,000,000,000<br />
2,500,000,000<br />
2,000,000,000<br />
1,500,000,000<br />
1,000,000,000<br />
500,000,000<br />
0<br />
1991/92 1992/93 1993/94 1994/95 1995/96<br />
The value of landed fish is very modest considering the number of<br />
fishermen involved. There is a need for them to improve their<br />
fishing gear so as to maximise returns of their labour. Inefficient<br />
fishing gear have encouraged many fishermen in the area to resort<br />
to dynamite fishing. This is a very destructive way of fishing since<br />
it destroys the marine breeding environment.<br />
Table II-14 shows revenue to central government earned from<br />
exported sea products.<br />
71
TABLE II-14: SEA PRODUCTS EXPORTED FROM MTWARA<br />
REGION 1991/92 - 1995/96:<br />
Year<br />
Amount of Sea Products<br />
(Metric Tones)<br />
Value T.Shs.<br />
1991/92 189,676 253,800,900<br />
1992/93 212,156 482,744,000<br />
1993/94 77,737 145,154,000<br />
1994/95 79,104 348,439,500<br />
1995/96 66,467 211,055,000<br />
Total 624,140 1,441,183,400<br />
Issued Licenses 10,550,928<br />
Grand Total 1,451,734,328<br />
Source: Regional Natural Resources Office, Mtwara, 1997.<br />
Fig. 22:<br />
Amount of Sea Products (Metric Tones) Exported from Mtwara <strong>region</strong><br />
1991/92 - 1995/96<br />
250,000<br />
200,000<br />
150,000<br />
100,000<br />
50,000<br />
0<br />
1991/92 1992/93 1993/94 1994/95 1995/96<br />
72
Most of the sea products which were exported included fish,<br />
prawns, shells, crustacea, shark fins and jaws.<br />
The fishing industry in the <strong>region</strong> has not performed significantly in<br />
contributing to the <strong>region</strong>s economy. It has contributed less than 1<br />
percent of <strong>region</strong>al annual GDP. Efforts already started and being<br />
implemented by RIPS through provision of credit facilities to<br />
fishermen should be expanded to enable more fishermen benefit<br />
from the facility. It is through this way artisan fishermen would be<br />
able to moderately modernise their fishing methods and improve<br />
their fish catch as a result. Furthermore, in order to increase<br />
supply of protein for up country districts in the <strong>region</strong> more fishponds<br />
could be encouraged, coupled with proper management<br />
techniques imparted to the farmers through demonstrations of<br />
properly managed fish-farms.<br />
2.3.5 WILDLIFE:<br />
About 3.91 percent of <strong>region</strong>al land area or 65,450 hectares is<br />
covered by two game reserves. These are Msanjesi (44,425 Ha.)<br />
and Lukwika/Lumesule (21,025 Ha) both of which are in Masasi<br />
district. The reserves contain a reasonable number of wild animals<br />
including elephants, lions, leopards, greater kudu, zebra, water<br />
bucks, sable antelope, wildebeest, impala, buffaloes, wild dogs<br />
and pig species. Also aquatic animals exist in Ruvuma river like<br />
hippos and crocodiles. Notwithstanding the abundance in wild<br />
life, these areas are still under utilised as tourist attractions. Gains<br />
to the <strong>region</strong>al economy through tourism hunting, game viewing<br />
and photography is very insignificant. Table II-15 shows the little<br />
government revenue collections from recovered trophies.<br />
73
TABLE II-15: REVENUE FROM RECOVERED GOVERNMENT TROPHIES<br />
IN MTWARA REGION 1991/92 - 1995/96:<br />
Year<br />
Number of<br />
Government<br />
Trophies<br />
Weight in Kgs.<br />
Value in T.shs.<br />
1991/92 189 124.4 5,228,390<br />
1992/93 98 89.2 1,957,600<br />
1993/94 111 66.5 1,605,000<br />
1994/95 160 150.0 2,722,000<br />
1995/96 134 73.3 1,597,000<br />
Source: Regional Natural Resources Office, 1997.<br />
2.3.6 BEEKEEPING:<br />
Because of many nectar yielding plant species including woodland<br />
miombos the potential for beekeeping in Mtwara <strong>region</strong> is good.<br />
Furthermore, the yielding period is long as cashewnut trees start<br />
flowering early in the dry season. Beekeepers in the <strong>region</strong> have<br />
more traditional beehives than modern ones. (See Table II-16).<br />
TABLE II-16: NUMBER AND TYPES OF BEEHIVES IN MTWARA<br />
REGION 1991/92 - 1993/94:<br />
Year Traditional Beehives Modern Beehives<br />
1991/92 12,000 440<br />
1993/94 17,500 800<br />
Source: Regional Natural Resources Office, Mtwara, 1996.<br />
74
TABLE II-17:<br />
BEEKEEPING PRODUCTS AND VALUE, MTWARA REGION<br />
1991 - 1996:<br />
Year Honey (Kgs) Value T.shs. Beewax (Kgs) Value T.shs.<br />
1991 10,130 5,005,000 12,218 14,661,000<br />
1992 48,600 24,300,000 15,172 18,206,400<br />
1993 135,820 67,910,000 21,914 21,914,000<br />
1994 124,012 124,012,000 8,210 9,852,000<br />
1995 11,008 1,108,000 12,924 19,386,000<br />
1996 25,210 29,976,000 21,246 38,299,200<br />
Total 354,780 252,311,000 91,684 122,319,200<br />
Source: Regional Natural Resources Office, Mtwara, 1997.<br />
Fig. 23 (a): Beekeeping Products (Kgs), Mtwara Region 1991 - 1996:<br />
140,000<br />
120,000<br />
100,000<br />
80,000<br />
60,000<br />
40,000<br />
20,000<br />
0<br />
1991 1992 1993 1994 1995 1996<br />
Honey (Kgs)<br />
Beewax (Kgs)<br />
75
Fig. 23 (b): Beekeeping Value (T.Shs), Mtwara Region 1991 - 1996:<br />
140,000,000<br />
120,000,000<br />
100,000,000<br />
80,000,000<br />
60,000,000<br />
40,000,000<br />
20,000,000<br />
0<br />
1991 1992 1993 1994 1995 1996<br />
Honey Value T.shs.<br />
Beeswax Value T.shs.<br />
Table II-17 show the trend in incomes generated from sale of<br />
honey and beewax from 1991 - 1996. The year 1993 recorded<br />
the highest total weight of 135,820 Kgs. of honey sold. In terms<br />
of income accrued from honey sales, the year 1994 was the best.<br />
It appears in that year honey commanded a better price per<br />
kilogram than the previous year.<br />
Decline in sales of honey during the period 1995 to 1996 lacks a<br />
clear explanation. But surprisingly it was during these two<br />
declining years the <strong>region</strong> realised the highest sales of beewax<br />
totalling T.sh. 57,685,200. Beekeeping if taken seriously through<br />
use of better beehives and better management could significantly<br />
add to household incomes and provide a much needed<br />
employment outlet.<br />
76
2.3.7 MINING:<br />
The Southern Geological Zone Office in Mtwara has established<br />
that Mtwara <strong>region</strong> has potential in two major minerals. These are<br />
coral stones and gemstone.<br />
Coral stone is excavated along the Indian Ocean shoreline in<br />
Mtwara district for the production of lime which is mainly used in<br />
house construction.<br />
Gemstone is located at specific areas in the <strong>region</strong>. Important<br />
gemstones found in the <strong>region</strong> are shown in Table II-18.<br />
TABLE II-18: MINERAL DEPOSITS IN MTWARA REGION, 1997:<br />
District<br />
Minerals<br />
Newala<br />
Tandahimba<br />
Masasi<br />
Rhodolite, Sapphire, Amethyst and Red Garnets<br />
Sapphire, Tourmaline, Red Garnets, Graphite<br />
Red Garnets, Sapphire, Marble, Chrysoberyl,<br />
Alexandrite, Tourmaline and Rhodolite.<br />
Source: Southern Geological Zone Office, Mtwara, 1997.<br />
Potentials of these minerals in the <strong>region</strong> has attracted a<br />
reasonable number of dealers from inside and outside the <strong>region</strong><br />
and some foreign nationals. Exploration has not been done as<br />
thoroughly as it should be for this reason exploitation of these<br />
resources is still minimal. Authorities in the <strong>region</strong> also point out<br />
that low mining has been associated with inferior mining<br />
equipment. In 1996, a total of 21 Master Gemstone dealers were<br />
77
licensed to mine minerals in the <strong>region</strong> but, hardly 50 percent of<br />
them have so far managed to carry out mining allegedly because of<br />
a lack of proper mining equipment.<br />
The Government has taken steps to ensure that mining, selling and<br />
exports of precious stones are conducted according to<br />
regulations. By December 1996, 21 shops for Master Dealers<br />
and Lapidary had been opened and 37,466.97 grams of various<br />
precious stones worth T.shs. 72,333,660 had gone through the<br />
market. By 1997 50,514.11 grams of precious stones worth<br />
T.shs. 113,164,600 were marketed in the <strong>region</strong>.<br />
2.3.8 INDUSTRIES:<br />
There is at present very little industrial activities going on in the<br />
<strong>region</strong> apart from some small scale industries. The one time<br />
operating industries all being agro-based industries are faced with<br />
enormous operating problems. These are the five cashewnut<br />
processing and two sisal processing industries. The cashewnut<br />
industries were established in the late seventies but hardly any one<br />
performed as expected mainly because of capital liquidity.<br />
These cashewnut industries are in the process of being privatised.<br />
However, the sisal processing plants are operating though at<br />
below capacities. The low price of sisal fibre in the world market<br />
is the main reason behind poor performance of the sisal industry in<br />
general .<br />
78
3.0 SOCIAL SERVICES:<br />
3.1 EDUCATION:<br />
3.1.1 Pre-School Education:<br />
SECTION III<br />
It is only in recent years that pre-school education has gained<br />
popularity. There were only 50 nursery school in 1994 but by<br />
1996 this had increased to 117 schools. So that it is estimated<br />
more than 10% of eligible 5 to 6 years old attended pre-schools in<br />
1996. According to Table III-1 the balance between sexes is<br />
almost 50:50. The average number of pupils per class is 51 to the<br />
<strong>region</strong> and varies only slightly between districts. On the other<br />
hand the average number of pupils per teacher varies a lot. The<br />
<strong>region</strong>al average of 83 is high.<br />
TABLE III-1:<br />
District<br />
NUMBER AND ENROLMENT AT PRE-SCHOOL CENTRES,<br />
BY DISTRICT AND SEX, MTWARA REGION 1996:<br />
Pre-<br />
School<br />
Centres<br />
Number of Pupils<br />
Boys Girls Total<br />
Pupils<br />
per<br />
Centre<br />
Mtwara/Mikindani 10 255 212 467 47<br />
Mtwara Rural 20 488 516 1004 50<br />
Masasi 37 1139 1215 2354 64<br />
Newala 50 1040 1053 2093 42<br />
Total 117 2922 2996 5918 51<br />
79
Source: Mtwara Regional Education Office (1997)<br />
Fig. 24: Number of pupils at Pre-School Centres by district and sex, Mtwara <strong>region</strong><br />
1996<br />
1400<br />
1200<br />
1000<br />
800<br />
600<br />
400<br />
200<br />
0<br />
Mtwara/Mikindani Mtwara Rural Masasi Newala<br />
Boys<br />
Girls<br />
TABLE III-2:<br />
District<br />
Mtwara/Mikindan<br />
i<br />
THE PUPIL/TEACHER RATIO, BY DISTRICT, MTWARA<br />
REGION PRE-SCHOOL EDUCATION, 1996:<br />
Number of<br />
Teachers<br />
Number of<br />
Pupils<br />
Average Number of<br />
Pupils per Teacher<br />
11 467 42<br />
Mtwara Rural 4 1,004 251<br />
Masasi 18 2,354 131<br />
Newala 38 2,093 55<br />
Total 71 5,918 83<br />
Source: Regional Education Officer, Mtwara, 1997.<br />
80
Mtwara/Mikindani has a reasonable ratio of 42. Newala too is<br />
not bad. But the figures of 131 and 251 for Masasi and Mtwara<br />
Rural respectively are far too high.<br />
Fig. 25: Average number of pupils per teacher by district,<br />
Mtwara <strong>region</strong> Pre-school education, 1996<br />
Newala<br />
Masasi<br />
Mtwara Rural<br />
Mtwara/Mikindani<br />
0 50 100 150 200 250 300<br />
3.1.2 Primary School Education:<br />
3.1.2.1 Enrolment:<br />
The history of primary school education in Mtwara <strong>region</strong> is one<br />
of commendable development. In 1974/75 the <strong>region</strong> had 371<br />
schools. By 1996 the number of schools had increased to 493.<br />
The total enrollment increased from 74,790 in 1974/75 to<br />
141,167 in 1996. See Table III-3. The total enrollment in 1985<br />
was 119,964 pupils.<br />
81
TABLE III-3:<br />
District<br />
NUMBER AND ENROLMENT IN PRIMARY SCHOOLS,<br />
MTWARA REGION, 1974/75 AND 1996:<br />
Number of<br />
Schools<br />
Enrolment Total<br />
Average Pupils per<br />
School<br />
1974/75 1996 1974/75 1996 1974/7<br />
5<br />
1996<br />
Mtwara/Miki<br />
ndani<br />
- 19 - 10,461 - 551<br />
Mtwara Rural - 82 11,740* 19,785 - 241<br />
Masasi - 193 34,110 61,573 - 319<br />
Newala** - 199 28,940 49,348 - 248<br />
Total 371 493 74,790 141,16<br />
7<br />
202 286<br />
* Included Mtwara/Mikindani district<br />
** Included Tandahimba district.<br />
Source: : Mtwara Regional Integrated Development Plan 1975 - 1980, Vol.I.<br />
: Regional Education Office, Mtwara, 1997.<br />
Fig. 26: Total enrolment in primary schools by district, Mtwara <strong>region</strong> 1974/75<br />
and 1996<br />
82
70000<br />
60000<br />
50000<br />
40000<br />
30000<br />
20000<br />
10000<br />
0<br />
Mtwara /<br />
Mikindani<br />
Mtwara<br />
Rural<br />
Masasi<br />
Newala**<br />
1974/75<br />
1996<br />
The average number of pupils per school has increased from 202<br />
in 1975 to 286 in 1996 which is consistent with trends in other<br />
<strong>region</strong>s. The larger number of pupils per school in the urban<br />
district of Mtwara/Mikindani is again in tune with the rest of the<br />
country.<br />
The trend in terms of classrooms is encouraging in that this shows<br />
slight improvement from an average of 50 pupils per classroom to<br />
48. However, 61% of the classrooms quoted for 1996 were of a<br />
temporary nature.<br />
TABLE III-4: NUMBER OF CLASSROOMS AND EMOLUMENT IN<br />
PRIMARY SCHOOLS, BY DISTRICT, MTWARA REGION<br />
1974/75 AND 1996:<br />
District<br />
Number of<br />
Classrooms<br />
Total Enrolment<br />
Average Pupils<br />
per Classroom<br />
1974/75 1996 1974/75 1996 1974/7<br />
5<br />
1996<br />
83
Mtwara/Mikindani - 164 - 10,461 - 64<br />
Mtwara Rural 292* 443 11,740* 19,785 40 45<br />
Masasi 634 1,159 34,110 61,573 54 53<br />
Newala** 559 1,172 28,940 49,348 52 42<br />
Total 1,485 2,938 74,790 141,167 50 48<br />
* Included Mtwara/Mikindani district<br />
** Included Tandahimba district<br />
Source: : Mtwara Regional Integrated Development Plan 1975 - 1980 Vol. I.<br />
: Regional Education Office, Mtwara, 1997.<br />
84
Fig. 27:<br />
70000<br />
Total emolument in primary schools by district, Mtwara<br />
<strong>region</strong> 1974/75 and 1996:<br />
60000<br />
50000<br />
40000<br />
30000<br />
1974/75<br />
1996<br />
20000<br />
10000<br />
0<br />
Mtwara /<br />
Mikindani<br />
Mtwara<br />
Rural<br />
Masasi<br />
Newala<br />
In 1996 the number of boys enrolled into primary schools was<br />
more or else equal to that of boys. See Table III-5. According<br />
to Table III-6 the <strong>region</strong> had 4,231 streams in 1996 giving an<br />
average of 33 pupils per stream. The differences between<br />
districts are not great. The Mtwara Regional Integrated<br />
Development Plan 1975 - 1980 quotes 1,796 streams for<br />
1974/75 thus giving a <strong>region</strong>al average of pupils per stream of 42.<br />
Therefore 1996 showed an improvement.<br />
85
TABLE III-5: ENROLMENT IN PRIMARY SCHOOLS, BY SEX<br />
AND BY DISTRICT, MTWARA REGION, 1996:<br />
District<br />
Enrolment to Std. I<br />
Boys Girls Total % Girls<br />
Mtwara/Mikindani 1,051 1,014 2,065 49.1<br />
Mtwara Rural 1,582 1,431 3,013 47.5<br />
Masasi 4,865 5,119 9,984 51.3<br />
*Newala 4,044 3,899 7,943 49.1<br />
Total 11,542 11,463 23,005 49.8<br />
* Included Tandahimba District.<br />
Source: Regional Education Office, Mtwara, 1997.<br />
Fig. 28: Enrolment to Std I in primary schools by district<br />
and sex, Mtwara Region, 1996:<br />
6,000<br />
5,000<br />
4,000<br />
Boys<br />
Girls<br />
3,000<br />
2,000<br />
1,000<br />
0<br />
Mtwara/<br />
Mikindani<br />
Mtwara<br />
Rural<br />
Masasi<br />
*Newala<br />
86
TABLE III-6:<br />
NUMBER OF STREAMS IN PRIMARY SCHOOLS, BY<br />
DISTRICT, MTWARA REGION 1996<br />
District Total Enrolment Number of<br />
Streams<br />
Pupils per<br />
stream<br />
Mtwara/Mikindani 10,461 245 43<br />
Mtwara Rural 19,785 591 33<br />
Masasi 61,573 1872 33<br />
Newala* 49,348 1523 32<br />
Total 141,167 4231 33<br />
Source: Regional Education office, Mtwara 1990<br />
* Included Tandahimba<br />
In 1974/75 the number of children of the school going age group<br />
(7 to 14 yrs) who were not attending school was 59,000 through<br />
that year's total enrolment was 74,790.<br />
1.2.2 Primary School Dropouts:<br />
Regional authorities reveal that dropouts are a problem in this<br />
<strong>region</strong> as elsewhere in <strong>Tanzania</strong>. The dropout percentage was as<br />
follows in recent years.<br />
1993 - 2.3%<br />
1994 - 2.1%<br />
1995 - 1.2%<br />
1996 - 2.4%<br />
87
TABLE III-7: PRIMARY SCHOOL DROPOUTS BY DISTRICT<br />
AND SEX, MTWARA REGION, 1996<br />
District Boys Girls Total<br />
Mtwara/Mikindani 1 5 6<br />
Mtwara Rural 290 192 482<br />
Masasi 146 120 266<br />
Newala* 477 330 807<br />
Total 914 647 1561<br />
* Included Tandahimba district<br />
Source: Regional Education office, Mtwara, 1997<br />
Fig. 29: Primary school dropouts by district and sex, Mtwara <strong>region</strong>, 1996<br />
500<br />
450<br />
400<br />
350<br />
300<br />
250<br />
200<br />
150<br />
100<br />
50<br />
0<br />
Mtwara/<br />
Mikindani<br />
Boys<br />
Girls<br />
Mtwara<br />
Rural<br />
Masasi<br />
Newala*<br />
Table II-7 show that for 1996 girls accounted for 41% of all<br />
dropouts while boys were responsible for 59%. According to<br />
Ministry of Education and Culture national headquarters truancy<br />
accounted for 77.5% of all dropouts followed by pregnancies at<br />
88
10.2%. Death and other causes accounted for 6.3% and 6.0%<br />
respectively. See Table III-8.<br />
TABLE III-8: REASONS FOR DROPOUTS BY SEX, MTWARA<br />
REGION, PRIMARY SCHOOLS 1995<br />
Cause<br />
Number of Dropouts<br />
Boys Girls Total<br />
% of Total<br />
Truancy 1820 831 2651 77.5<br />
Pregnancy 0 349 349 10.2<br />
Death 126 88 214 6.3<br />
Others 113 93 206 6.0<br />
Total 2059 1361 3420 100<br />
Source: Ministry of Education and Culture, Dar es Salaam July 1996.<br />
Fig. 30: Reasons for dropouts in primary schools by sex, Mtwara <strong>region</strong>, 1995<br />
89
2000<br />
900<br />
1800<br />
800<br />
1600<br />
700<br />
1400<br />
600<br />
1200<br />
500<br />
1000<br />
400<br />
800<br />
600<br />
300<br />
400<br />
200<br />
200<br />
100<br />
Boys 0<br />
0<br />
Truancy<br />
Pregnancy<br />
Death<br />
Others<br />
Girls<br />
Boys<br />
Girls<br />
90
1.2.3 Primary School Teachers:<br />
An adequate supply of teachers of adequate quality is one of the<br />
essentials of a successful primary education system. In 1974/75<br />
the <strong>region</strong> had 1,191 teachers of all grades. The requirement of<br />
grade IIIA teacher in 1996 was 2,198 but only 1374 or 62.5% of<br />
the requirements were available. Grade IIIB teachers<br />
requirements were 2,466 while there were actually 2,681 teachers<br />
which makes a surplus of 215. Table III-9 demonstrates this.<br />
TABLE III-9 REQUIREMENTS AND AVAILABILITY OF PRIMARY<br />
SCHOOL TEACHERS BY GRADE AND BY DISTRICT,<br />
MTWARA REGION 1996<br />
District<br />
Requirements Availability Deficit/Excess<br />
IIIA IIIB Total IIIA IIIB Total IIIA IIIB<br />
Mtwara/Mi<br />
kindani<br />
Mtwara<br />
Rural<br />
156 144 300 158 183 341 +2 +39<br />
321 304 625 204 365 569 -117 +61<br />
Masasi 903 1,11<br />
6<br />
2,019 491 1,071 1,562 -412 -45<br />
Newala 818 902 1,720 521 1,062 1,583 -297 +160<br />
Total 2,19<br />
8<br />
2,46<br />
6<br />
4,664 1,374 2,681 4,055 -824 +215<br />
Source: Regional Education office, Mtwara 1997.<br />
As expected the urban district of Mtwara/Mikindani showed a<br />
surplus of teachers of all grades. All the rural districts had a<br />
deficit. But the situation is not so bad when viewed in terms of<br />
91
pupils per teacher. The ratio is not drastically different between<br />
the urban district and the rural districts, except for Masasi. See<br />
Table III-10. The <strong>region</strong>al average number of pupils per teacher<br />
for 1996 is 35. It was 63 in 1974/75. This is a dramatic<br />
improvement.<br />
TABLE III-10: THE NUMBER OF PUPILS PER<br />
TEACHER, BY DISTRICT, MTWARA REGION<br />
1996:<br />
District<br />
Total<br />
Enrolment<br />
Total number of<br />
Teachers<br />
Number of pupils<br />
per teacher<br />
Mtwara/Mikindan<br />
i<br />
10,461 341 31<br />
Mtwara Rural 19,785 569 35<br />
Masasi 61,573 1,562 39<br />
Newala 49,348 1,583 31<br />
Total 141,167 4055 35<br />
Source: Regional Education Office, Mtwara 1997.<br />
2.4 Primary education Infrastructure:<br />
Classrooms are a key ingredient in primary education. Mtwara<br />
residents and authorities have done some work in the construction<br />
of classrooms. But if temporary classrooms are excluded, the<br />
<strong>region</strong> has only reached 32% of the <strong>region</strong>al target for permanent<br />
classrooms. The situation is particularly acute in the rural districts<br />
of Mtwara Rural, Masasi and Newala.<br />
92
TABLE III-11:<br />
District<br />
PRIMARY EDUCATION CLASSROOM REQUIREMENTS AND<br />
AVAILABILITY BY DISTRICT, MTWARA REGION 1996<br />
Requirement<br />
s<br />
Available<br />
Deficit of Permanent classrooms<br />
Permanent Temporary Total Number %<br />
Mtwara/Mikindani 192 138 26 164 54 28<br />
Mtwara Rural 511 212 231 443 299 59<br />
Masasi 1,572 510 649 1,159 1,062 68<br />
Newala* 1,322 296 876 1,172 1,026 78<br />
Total 3,597 1,156 1,782 2,938 2,441 68<br />
* Included Tandahimba<br />
Source: Regional education office, Mtwara 1997<br />
Classrooms are not the only area where physical facilities are<br />
inadequate. According to the <strong>region</strong>al authorities the construction<br />
of “permanent "pit latrines as toilets for pupils is behind by 91%,<br />
cupboards by 78%, tables by 67%, desks by 54% and chairs by<br />
50%. See Table III-12.<br />
TABLE III-12:<br />
THE NUMBER OF TOILETS AND AMOUNT OF FURNITURE<br />
IN PRIMARY SCHOOLS, MTWARA REGION 1995:<br />
Forestry Requirements Actual Shortage % Shortage<br />
Toilets 5,125 458 4,667 91<br />
Desks 76,778 35,089 41,689 54<br />
Tables 12,997 4,281 8,716 67<br />
Chairs 9,904 4,930 4,974 50<br />
Cupboards 4,880 1,058 3,822 78<br />
Source: Ministry of Education and Culture Report, 1995.<br />
94
The above are not the only areas of concern. Teachers' houses<br />
are also important for primary education efficiency and teacher<br />
morale. This area is probably the one area where very little has<br />
been done. Newala district shows an appalling deficit of 81<br />
percent. The other three district score a deficit which is much<br />
worse. It is 90 percent or higher. See Table III-3.<br />
TABLE III-3: TEACHERS' HOUSES IN PRIMARY SCHOOLS,<br />
BY DISTRICT, MTWARA REGION, 1996:<br />
District<br />
Requirement<br />
Available<br />
Deficit of Permanent<br />
Permanent Temporary Total No % Deficit<br />
Mtwara/Mikinda<br />
ni<br />
228 22 27 49 206 90<br />
Mtwara Rural 562 56 202 258 506 90<br />
Masasi 2019 161 768 929 1858 92<br />
Newala 1694 324 343 667 1370 81<br />
Total 4503 563 1340 1903 3940 87<br />
* Included Tandahimba district.<br />
Source: Regional Education Office, Mtwara, 1997.<br />
3.1.2.5 Comparative Status of Primary Education in Mtwara Region:<br />
It is interesting to compare the performance of districts in terms of<br />
the number of schools and total emolument relative to the district's<br />
population. At 1,639 people per primary school Newala shows<br />
to be the best covered district particularly when you consider the<br />
figure of 151 pupil per 1,000 population. There are probably<br />
relatively more children avoiding attending primary schools in<br />
95
Mtwara/Mikindani and Mtwara Rural districts than in the other<br />
two districts of Newala and Masasi.<br />
TABLE III-14:<br />
District<br />
POPULATION COVERAGE BY PRIMARY SCHOOLS AND<br />
PRIMARY SCHOOL ENROLMENT, BY DISTRICT, MTWARA<br />
REGION, 1996:<br />
Total<br />
Population<br />
Number<br />
of<br />
Schools<br />
Total<br />
Enrolmen<br />
t<br />
Population<br />
per School<br />
Pupils per<br />
1,000<br />
Population<br />
Mtwara/Miki<br />
ndani<br />
103,815 19 10,461 5,464 101<br />
Mtwara Rural 190,962 82 19,785 2,329 104<br />
Newala* 326,207 199 49,348 1,639 151<br />
Masasi 384,421 193 61,573 1,992 160<br />
Total 1,005,405 493 141,167 2,039 140<br />
* Included Tandahimba district.<br />
Source: Compiled from data supplied by Regional Education Office.<br />
Both Mtwara/Mikindani and Mtwara Rural have the worst<br />
coverage per school and the lowest number of pupils per 1,000<br />
population.<br />
96
TABLE III-15: PRIMARY EDUCATION IN MTWARA<br />
REGION AND IN SELECTED REGIONS 1996:<br />
Region<br />
Populati<br />
on per<br />
School<br />
Pupils<br />
per 1000<br />
People<br />
Pupils<br />
per<br />
School<br />
Pupils<br />
per<br />
Classroo<br />
m<br />
Pupils<br />
per<br />
Teacher<br />
Pupils<br />
per<br />
Stream<br />
Mtwara 2,039 140 286 48 35 33<br />
Mwanza 2,671 144 385 85 45 NA<br />
Lindi 2,757 109 299 52 22 37<br />
Singida 2,710 139 378 77 38 NA<br />
Mbeya 1,800 190 342 NA 37 NA<br />
Dodoma 2,839 132 375 77 35 38<br />
Shinyanga 2,473 139 344 197 56 38<br />
Iringa 2,024 162 327 47 37 NA<br />
Rukwa 2,467 125 308 59 34 NA<br />
Morogoro 2,387 134 319 66 35 35<br />
Source:<br />
Regional Socio-Economic Profile of Mwanza, Lindi, Singida, Mbeya, Dodoma,<br />
Shinyanga, Iringa, Rukwa, Morogoro.<br />
A comparison of the status of primary education between selected<br />
<strong>region</strong>s shows up some interesting facts. For example when<br />
Mwanza is compared to Mtwara, Mwanza schools are<br />
overcrowded but proportionately slightly more children in the<br />
community in Mwanza go to school than in Mtwara. Lindi<br />
schools are also comparatively overcrowded compare to Mtwara<br />
even fewer pupils in the community to school. But surprisingly<br />
Lindi has lots of teachers compared to the number of pupils.<br />
Compared to Mtwara both Shinyanga and Singida have very<br />
97
overcrowded schools but proportionately the same number of<br />
children go to school in the three <strong>region</strong>s. Mbeya has<br />
proportionately more schools in communities than Mtwara. But<br />
because a high proportion of school age children go to school,<br />
such schools are overcrowded when compared to Mtwara.<br />
Dodoma, Rukwa, Morogoro are like Lindi when compared to<br />
Mtwara. But the number of teachers relative to pupils is the same<br />
as in Mtwara. Although Iringa like Mbeya has many schools<br />
relative to the population it ends up to the same degree of<br />
overcrowding as Mtwara. This is because proportionately many<br />
more children of school going age attend schools.<br />
Looking at the ten <strong>region</strong>s a child has a better chance for quality<br />
education in the <strong>region</strong>s of Mtwara, Lindi, Rukwa and Morogoro<br />
<strong>region</strong>s. When it comes to assessing the chances of that child to<br />
go school at all, the child has better chances in Mbeya, Iringa,<br />
Mwanza, Singida and Shinyanga <strong>region</strong>s.<br />
3.1.2.6 Special Primary Schools<br />
Mtwara <strong>region</strong> has taken the lead in <strong>Tanzania</strong> in establishing<br />
primary schools to cater for the special needs of disabled children.<br />
These children have as much right to education as other children.<br />
Disabilities catered for are:<br />
- deafness<br />
- blindness<br />
- mental retardation<br />
- leprosy<br />
98
Distribution of such schools are given in table III-16 with Masasi<br />
district having the best coverage.<br />
TABLE III-16 SPECIAL PRIMARY SCHOOLS FOR THE DISABLED, BY<br />
DISTRICT, MTWARA REGION 1996<br />
District Name of School Type of Disability<br />
Mtwara/Mikindani Shangani Mental retardation<br />
Newala Luchingu Mental retardation<br />
Masasi<br />
Lulindi<br />
Mwena<br />
Masasi<br />
Migongo<br />
Lukuledi<br />
Mangaka<br />
Ndanda<br />
Mental retardation<br />
Leprosy<br />
Blindness<br />
Mental retardation<br />
Deafness<br />
Mental retardation<br />
Mental retardation<br />
Source: Regional Education Office, Mtwara 1997<br />
3.1.3. Adult Education<br />
Mtwara <strong>region</strong> ranks 13th among 19 position. Therefore, there is<br />
still much to be done to catch up with other <strong>region</strong>s let alone<br />
eradicate illiteracy. But it can be said with some pride that<br />
Mtwara has come a long way to reach 57.1% literacy. The rate<br />
was a mere 28% in 1967. See Table III-19<br />
99
TABLE III-17 PERCENTAGE OF LITERACY FOR POPULATION AGED<br />
10 YEARS AND ABOVE IN MTWARA REGION COMPARED<br />
TO OTHER REGIONS IN THE LAST THREE CENSUSES<br />
Region 1967<br />
Census<br />
1978<br />
Census<br />
100<br />
1988<br />
Census<br />
Ranking<br />
Mtwara 28 51.4 57.1 13<br />
Kilimanjaro 56 74.1 80.8 1<br />
D’Salaam 60 73.3 80.7 1<br />
Ruvuma 41 66.3 70.5 2<br />
Tanga 40 60.6 66.0 4<br />
Morogoro 37 58.6 62.8 6<br />
Mara 35 56.4 63.9 5<br />
Iringa 31 54.0 68.3 3<br />
kagera 40 52.9 59.5 8<br />
Dodoma 24 49.5 55.5 14<br />
Mbeya 29 49.2 61.9 7<br />
Rukwa - 48.5 58.6 9<br />
Lindi - 48.4 53.8 16<br />
Singida 24 46.7 57.4 11<br />
Mwanza 25 44.3 57.3 12<br />
Coast 26 44.0 51.1 17<br />
Kigoma 19 43.7 55.1 15<br />
Arusha 26 41.9 58.1 10<br />
Tabora 27 40.5 50.5 18<br />
Shinyanga 16 33.2 48.3 19
Source: 1988 Population census<br />
The 1988 census also revealed that urban population tend to be<br />
more literate than rural populations in the <strong>region</strong>. Males also tend<br />
to be more literate than females. But unlike some <strong>region</strong>s the rate<br />
of literacy for rural males was higher than that of urban females.<br />
See table III-18<br />
TABLE III-18<br />
LITERACY RATE FOR RURAL AND URBAN POPULATIONS<br />
OF 10 YEARS AND ABOVE IN MTWARA REGION<br />
COMPARED TO OTHER REGIONS IN TANZANIA 1988<br />
CENSUS<br />
Region Male Female<br />
Rural Urban Total Rural Urban Total<br />
Mtwara 65.5 77.9 67.3 46.3 61.6 48.5<br />
Mbeya 69.9 87.5 73.3 48.4 70.4 58.5<br />
Mara 73.7 88.0 75.3 53.7 71.5 55.6<br />
Dodoma 61.5 85.4 64.3 45.1 73.7 48.2<br />
Arusha 61.5 91.8 65.6 46.4 82.8 50.9<br />
Kilimanjaro 84.5 90.3 85.5 75.7 83.6 76.9<br />
Tanga 72.8 88.6 75.9 53.2 75.6 57.3<br />
Morogoro 68.8 86.4 72.9 49.5 72.0 54.6<br />
Coast 60.1 72.2 64.0 40.1 51.8 44.9<br />
DSM 68.4 90.0 87.9 48.0 77.7 74.6<br />
Lindi 62.4 75.9 64.6 42.0 60.2 44.8<br />
Ruvuma 77.7 87.6 78.7 61.4 75.7 63.3<br />
Iringa 80.1 87.4 84.9 57.2 70.4 58.5<br />
101
Mwanza 63.7 83.7 67.6 43.4 66.9 47.8<br />
Kagera 68.0 84.4 69.0 49.7 72.4 50.9<br />
Shinyanga 57.9 85.9 59.9 36.2 67.7 39.3<br />
Singida 65.0 85.5 66.8 47.2 70.8 49.3<br />
Rukwa 69.1 84.3 71.3 43.9 66.4 47.3<br />
Kigoma 65.1 83.1 67.4 43.1 62.7 45.5<br />
Source: 1988 Population Census<br />
The process of adult illiteracy eradication is an arduous one. It<br />
involves the identification of illiterates, persuasion and motivation.<br />
It involves identification of teachers, place and times for classes.<br />
It involves supervision, registration, examinations and even after<br />
literacy is attained, follow up exercises to ensure literates remain<br />
literate.<br />
Table III-19 reveals a portion of this process to give an idea of<br />
the immensity of dropouts between registration and the passing of<br />
terminal literacy tests. For example in 1981 some 150,373<br />
people registered but only 28,046 attained literacy i.e. 19% of<br />
those who registered or 21.8% of those who were examined.<br />
TABLE III-19 NUMBER OF ILLITERATES REGISTERED EXAMINED AND<br />
PASSED, MTWARA REGION, 1975-1992 (SELECTED YEARS)<br />
Registered Examined Pass<br />
Year Male Female Total Male Female Total %<br />
Examined<br />
102<br />
Male Female Total %<br />
Passed<br />
1975 103669 97556 201225 76500 97138 173638 86.3 23609 18930 42539 24.5<br />
1977 61991 78453 140444 36074 40174 76248 54.3 11365 8115 19480 25.5<br />
1981 57879 92494 150373 49600 79121 128721 85.6 16168 11878 28046 21.8<br />
1983 45811 71344 117155 38559 61802 100361 85.7 22409 29134 51543 51.4<br />
1986 28587 49065 77652 27607 47455 75062 96.7 21876 37741 59617 79.4
1992 38954 57485 96439 15999 24953 40952 42.5 6575 7808 14383 35.1<br />
Source: Regional Education Office, Mtwara, (1997).<br />
Fig. 31: Number of illiterates Registered, Examined and Passed,<br />
Mtwara Region, 1975-1992 (Selected Years)<br />
250000<br />
200000<br />
150000<br />
100000<br />
50000<br />
0<br />
1975 1977 1981 1983 1986 1992<br />
Total Registered Total Examined Total Passed<br />
Table III-20 shows the kind of distribution of attendances at<br />
literacy classes by sex and also by district. Females outnumber<br />
males in attending classes. Mtwara rural and Masasi have the<br />
most candidates.<br />
TABLE III-20 ATTENDANCE AT ADULT EDUCATION CLASSES,<br />
MTWARA REGION, DECEMBER 1995 BY DISTRICT<br />
District<br />
Attendance<br />
Male Female Total %<br />
Mtwara/Mikindani 603 1286 1889 37.0<br />
Mtwara Rural 4019 5062 9081 31.8<br />
Masasi 4244 5117 9361 18.0<br />
103
Newala/Tandahimba 1577 2850 4427 31.0<br />
Total 10443 14315 24758 23.8<br />
Source: Regional Education Office, Mtwara, (1997).<br />
Fig. 32: Attendance at Adult Education Classes,Mtwara Region, December 1995 By<br />
District<br />
6000<br />
5000<br />
4000<br />
3000<br />
2000<br />
Male<br />
Female<br />
1000<br />
0<br />
Mtwara /<br />
Mikindani<br />
Mtwara<br />
Rural<br />
Masasi<br />
Newala /<br />
Tandahimba<br />
Mtwara <strong>region</strong> boasted of 492 adult education centres in 1995<br />
with 2612 classes and 3,583 teachers. Such recent figures on<br />
adult literacy should of course be taken with caution. See Table<br />
III-21.<br />
TABLE III-21: DISTRIBUTION OF ADULT EDUCATION CENTRES<br />
CLASSES, TEACHER AND CURRICULUM CENTRES, BY<br />
DISTRICT, MTWARA REGION, 1995<br />
District Centres Classes<br />
Primar<br />
y<br />
School<br />
No. of Teachers<br />
Volunte<br />
ers<br />
Curriculum Centres<br />
Total Old New Total<br />
Mtwara<br />
(U)<br />
19 23 19 5 24 4 10 14<br />
104
Mtwara<br />
(R)<br />
82 752 296 377 673 13 10 23<br />
Masasi 187 1336 561 775 1336 6 4 10<br />
Newala/T<br />
andahimb<br />
a<br />
204 501 1047 50 1550 19 10 29<br />
Total 492 2612 1925 1658 3583 42 34 76<br />
Source: Regional Education Office, Mtwara, (1997).<br />
1.4 Secondary School Education:<br />
In 1996 primary school pupils who were examined for Form I<br />
entry were 11,415. Out of these 1,045 were duly selected which<br />
is 9.2% of the number of examinees. Sexwise 9.0% of the boys<br />
were selected and 9.3% of the girl examinees were also selected.<br />
Mtwara/Mikindani, which is an urban district, had the best<br />
selection ratio of 18.6%. See Table III-22.<br />
TABLE III-22: SELECTION FOR FORM I, BY SEX AND<br />
DISTRICT, MTWARA REGION, 1996:<br />
District Examinees Non Examinees Selected<br />
Boys Girls Total Boys Girls Total Boys Girls Total<br />
No. %<br />
Mtwara/Mi<br />
kindani<br />
Mtwara<br />
Rural<br />
480 553 1,033 1 1 2 104 88 192 18.6<br />
718 668 1,386 11 8 19 56 57 113 8.2<br />
Masasi 2,150 2,546 4,696 25 26 51 186 194 380 8.1<br />
Newala* 2,051 2,249 4,300 42 61 103 140 220 360 8.4<br />
Total 5,399 6,016 11,415 79 96 175 486 559 1,045 9.2<br />
* Includes Tandahimba district.<br />
Source: Regional Education Office, Mtwara, 1997.<br />
105
106
Fig. 33 (a): Examinees for Form I by district and sex, Mtwara <strong>region</strong>, 1996<br />
3000<br />
2500<br />
Boys<br />
Girls<br />
2000<br />
1500<br />
1000<br />
500<br />
0<br />
Mtwara/Mi<br />
kindani<br />
Mtwara<br />
Rural<br />
Masasi<br />
Newala*<br />
Fig. 33 (b): Selected for Form I by di strict and sex, Mtwara <strong>region</strong>, 1996<br />
250<br />
200<br />
Boys<br />
Girls<br />
150<br />
100<br />
50<br />
0<br />
Mtwara/Mi<br />
kindani<br />
Mtwara<br />
Rural<br />
Masasi<br />
Newala*<br />
About 20% of the Secondary Education schools and streams are<br />
private. The <strong>region</strong> has a total of 13 school and 124 streams.<br />
Given an estimated population of 991,323 for 1995 there is one<br />
secondary school for every 76,256 people. This ratio is<br />
107
unsatisfactorily high. It is borne out by the low figure of secondary<br />
school pupils per 10,000 population.<br />
TABLE III-23: NUMBER OF SCHOOLS AND STREAMS IN SECONDARY<br />
SCHOOL, BY LEVEL AND OWNERSHIP, MTWARA REGION,<br />
1995:<br />
Ownershi<br />
p<br />
Number<br />
Schools<br />
of<br />
Streams<br />
I II III IV V VI TOTAL<br />
Public 10 24 22 22 22 4 4 98<br />
Private 3 7 7 6 6 0 0 26<br />
Total 13 31 29 28 28 4 4 124<br />
Source: Basic Statistics in Education, Regional Data, 1995.<br />
TABLE III-24:<br />
Owner<br />
ship<br />
This is 42.0 ordinary level students and 1.6 advanced level<br />
students. See Table III-24 and III-25. The average number of<br />
pupils per stream is satisfactory. It is 36 for ordinary level and 20<br />
for advanced level.<br />
ENROLMENT IN SECONDARY SCHOOLS BY SEX, LEVEL<br />
AND OWNERSHIP, MTWARA REGION, 1995:<br />
I II III IV V VI<br />
Forms<br />
Boys<br />
Form I - IV<br />
Girl<br />
s<br />
Tota<br />
l<br />
Boy<br />
s<br />
Form V - VI<br />
Girl<br />
s<br />
Tota<br />
l<br />
Public 870 837 797 712 87 75 1,65<br />
4<br />
1,56<br />
2<br />
3,21<br />
6<br />
95 67 162<br />
Privat<br />
e<br />
244 254 204 225 0 0 473 454 927 0 0 0<br />
108
Total 1,11<br />
4<br />
1,09<br />
1<br />
1,00<br />
1<br />
937 87 75 2,12<br />
7<br />
2,01<br />
6<br />
4,14<br />
3<br />
95 67 162<br />
Source: Basic Statistics in Education, Regional Data, 1995.<br />
109
Fig. 34(a): Enrolment in secondary schools by ownership, Mtwara <strong>region</strong>, 1995:<br />
900<br />
800<br />
700<br />
600<br />
500<br />
400<br />
300<br />
200<br />
100<br />
0<br />
I II III IV V VI<br />
Public<br />
Private<br />
Fig. 34 (b):<br />
2000<br />
1500<br />
1000<br />
Enrolment in secondary schools (Form I - IV) by ownership and sex,<br />
Mtwara <strong>region</strong>, 1995<br />
500<br />
Boys<br />
Girls<br />
0<br />
Public<br />
Private<br />
Fig. 34 (c):<br />
Enrolment in secondary schools (Form V - VI) by ownership and<br />
sex, Mtwara <strong>region</strong>, 1995<br />
110
100<br />
80<br />
60<br />
Boys<br />
Girls<br />
40<br />
20<br />
0<br />
Public<br />
Private<br />
TABLE III-25: PUPILS PER STREAM AND PUPILS PER 10,000<br />
POPULATION, MTWARA REGION, 1995:<br />
Level<br />
Population<br />
(Est.)<br />
Total<br />
Enrolment<br />
Streams<br />
Pupils per<br />
Stream<br />
Pupils per<br />
10,000<br />
people<br />
Form I-IV 991,323 4,143 116 36 42.0<br />
Form V-VI 991,323 162 8 20 1.6<br />
Source: Compiled from Regional Education Office Data, Mtwara, 1997.<br />
Looking at Table III-26 the number of teachers in public<br />
secondary schools in 209 while that of private schools is 32. This<br />
works out at 16 pupils and 29 pupils per teacher for public and<br />
private secondary schools respectively. The private sector ratio is<br />
unsatisfactory.<br />
TABLE III-26: SECONDARY SCHOOL TEACHERS BY SEX,<br />
QUALIFICATION AND SCHOOL OWNERSHIP, MTWARA<br />
REGION, 1995:<br />
Teachers'<br />
Qualifications<br />
Male<br />
Public<br />
Femal<br />
e<br />
Private<br />
Total Male Femal<br />
e<br />
Total<br />
BSc. (Ed.) 10 8 18 0 0 0<br />
111
BSc. (Gen.) 1 0 1 1 0 1<br />
BA (Ed.) 6 3 9 1 0 1<br />
BA (Gen.) 0 1 1 0 0 0<br />
Dip. Science 64 21 85 5 0 5<br />
Dip. Arts 76 12 88 5 0 5<br />
Grade A 5 0 5 2 0 2<br />
Others 2 0 2 18 0 18<br />
Total 164 45 209 32 0 32<br />
Source: Basic Statistics in Education, Regional Data, 1995.<br />
3.2 HEALTH<br />
3.2.1 Introduction<br />
Although the three enemies of development: poverty, ignorance<br />
and disease are still with the <strong>region</strong>, a start has been made to<br />
eradicate them. The <strong>region</strong>'s GDP per capita of Tshs 59,533 for<br />
1994 is on the high side by <strong>Tanzania</strong> standards. Mtwara's 57.1%<br />
literacy by 1988 in middling by <strong>Tanzania</strong> standards. The status of<br />
the health of the <strong>region</strong>'s residents on the other hand judged by<br />
Life Expectancy (the ultimate health indicator) is not so good even<br />
by national standards.<br />
The health sector in Mtwara <strong>region</strong> is faced by a variety of basic<br />
problems which work against the development of a healthy and<br />
productive population. Poor communications, poor water<br />
supplies, poverty, poorly run health services and malnutrition are<br />
only some of the factors contributing towards ill-health. The<br />
112
elative isolation of the <strong>region</strong> from development centres in the<br />
north has also under developed the <strong>region</strong> and consequently its<br />
ability to deliver good health services.<br />
3.2.2 Morbidity and Mortality<br />
The decline in the economy nationwide in the eighties and nineties<br />
was reflected in the health sector by deterioration in the<br />
maintenance of health infrastructure, inadequate and unreliable<br />
supply of drugs. Consequently there has been widespread<br />
lowering of morale among health workers. The impact of all these<br />
factors has been an increase in the <strong>region</strong>'s morbidity and mortality<br />
from diseases.<br />
The ten most common causes of morbidity are shown in Table III-<br />
27<br />
TABLE III-27<br />
THE TEN MOST COMMON CAUSES OF MORBIDITY<br />
AS A PERCENTAGE OF CASES, MTWARA REGION 1991<br />
Disease<br />
% of all<br />
cases<br />
Ranking<br />
Malaria 26.0 1<br />
Diarrhoea 8.6 2<br />
Eye diseases 7.2 3<br />
Upper respiratory tract<br />
infections<br />
6.6 4<br />
Pneumonia 5.1 5<br />
Accidents 3.1 6<br />
Skin diseases 2.5 7<br />
113
Intestinal worms 1.6 8<br />
Gonorrhea 1.4 9<br />
Anaemia 1.3 10<br />
Other diagnoses 15.4 -<br />
Il defined symptoms 21.2 -<br />
Total 100 -<br />
Source: Regional Ministry of health Office, Mtwara 1997<br />
On the ten most common causes of illness the main culprits are in<br />
order of importances: Malaria, diarrhoea and upper respiratory<br />
tract infections.<br />
114
TABLE III-28<br />
Diseases<br />
THE NUMBER OF CASES OF MOST IMPORTANT REPORTED<br />
CAUSES OF MORBIDITY AND MORTALITY, MTWARA REGION<br />
1995 AND 1996<br />
Reported<br />
cases<br />
Report<br />
ed<br />
deaths<br />
Top 10<br />
ranking<br />
1995 1996 1995 1996 1995 1996<br />
Malaria 236,673 236,713 850 271 1 1<br />
Diarrhoea 41,844 211,441 124 124 5 2<br />
Bloody<br />
Dysentery<br />
1,210 20,286 33 41 - 8<br />
Measles 42 33 0 0 - -<br />
Intestinal<br />
Worms<br />
20,225 33,189 0 0 6 6<br />
Skins Diseases 45,415 134,347 0 0 4 4<br />
Gonorrhoea 13,395 26,039 0 0 7 7<br />
ARI 71,157 45,958 0 0 2 5<br />
Schistosomiasis 10,181 10,443 0 0 9 9<br />
Eye Disease 46,930 139,626 0 0 3 3<br />
Syphilis 11,996 0 0 0 8 -<br />
Meningitis 1,082 803 158 165 10 10<br />
Typhoid 8 0 0 0 - -<br />
AIDS 311 142 0 78 - -<br />
TB 1,592 137 0 99 - -<br />
Source: Taarifa ya Huduma za Afya Kinga Mkoa wa Mtwara, 1996<br />
According to Table III-28 the list of the ten most important causes of<br />
illness had changed to some extent between 1991 and 1996. Anaemia<br />
and accidents were no longer among the top ten. Their place was taken<br />
over by meningitis, syphilis and bloody dysentery.<br />
115
Communicable diseases form a different class of diseases which tend to<br />
come and go. But when in existence spread quick sometimes manage to<br />
reach epidemic proportions. Table III 29 and III-30 show the situation<br />
with respect to 1994 and 1995.<br />
TABLE III-29 DISTRIBUTION OF COMMUNICABLE DISEASE CASES IN<br />
MTWARA AND NEIGHBORING REGIONS, 1994 and 1995<br />
Region Cholera Meningitis Dysentery Rabies Plague<br />
1994 1995 1994 1995 1994 1995 1994 1995 1994 1995<br />
Mtwara 33 0 191 1065 993 560 14 23 0 0<br />
Lindi 129 0 657 343 238 187 0 0 0 0<br />
Ruvuma 0 0 15 114 159 179 1 121 0 0<br />
Iringa 0 0 11 18 4,19<br />
7<br />
147 0 50 0 0<br />
Morogor<br />
o<br />
0 0 99 177 586 77 267 134 0 0<br />
Coast 0 0 0 14 2,25<br />
0<br />
DSM 3 11 0 1,86<br />
7<br />
304 0 87 0 0<br />
0 2 1 0 0<br />
Source: Health Statistics Abstract, 1997<br />
TABLE III-30 DISTRIBUTION OF DEATHS CAUSED BY COMMUNICABLE<br />
DISEASES IN MTWARA AND NEIGHBORING REGIONS, 1994<br />
AND 1995<br />
Region Cholera Meningitis Dysentery Rabies Plague<br />
1994 1995 1994 1995 1994 1995 1994 1995 1994 1994<br />
Mtwara 1 0 17 139 34 20 0 1 0 0<br />
Lindi 7 0 68 39 5 0 0 0 0 0<br />
Ruvuma 0 0 1 29 12 4 1 4 0 0<br />
116
Iringa 0 0 5 4 10 0 0 0 0 0<br />
Morogor<br />
o<br />
0 0 9 9 12 1 21 2 0 0<br />
Coast 0 0 0 3 23 8 0 1 0 0<br />
DSM 2 0 0 0 15 0 0 1 0 0<br />
Source: Health Statistics Abstract, 1997<br />
TABLE III-31<br />
The tables show that for Mtwara <strong>region</strong> the major communicable<br />
disease problems were meningitis and dysentry. In fact the <strong>region</strong><br />
accounted for most of the meningitis cases and deaths in 1995<br />
among the neighbours. Among the seven neighboring <strong>region</strong>s<br />
Mtwara accounted for 42% of all fatalities from the communicable<br />
diseases in the two years. Mtwara was then a high risk <strong>region</strong>.<br />
Aids, Tuberculosis and leprosy are the <strong>region</strong>s added health<br />
hazards.<br />
On top of the above problems, young children have to contend<br />
with measles, pertussis, diphtheria, tetanus and polio. Malnutrition<br />
is the ever present underlying cause which exacerbates the risks<br />
from these diseases. Table III-3 shows just how serious was<br />
measles in Mtwara and its neighboring <strong>region</strong>s. At number 4<br />
ranking Mtwara is a medium risk <strong>region</strong> among the seven<br />
neighbours, at least for 1992, 1993 and 1994.<br />
DISTRIBUTION OF REPORTED CASES OF MEASLES IN<br />
MTWARA AND NEIGHBORING REGIONS 1992-1994<br />
Region Number of Cases Ranking<br />
1992 1993 1994 Total<br />
Mtwara 232 819 222 1,273 4<br />
117
Lindi 98 770 37 905 7<br />
Ruvuma 1,379 497 208 2,084 2<br />
Iringa 811 1,367 1,283 3,461 1<br />
Morogoro 672 660 154 1,486 3<br />
Coast 238 702 98 1,038 6<br />
Dar-es-<br />
Salaam<br />
437 725 66 1,228 5<br />
Source: Health Statistics Abstract, 1997<br />
3.2.3 Health Facilities<br />
The distribution of health facilities between districts is shown in<br />
Table III-32. The majority of facilities are in Newala and Masasi<br />
which districts also have the largest populations. Distribution by<br />
ownership is a Table III-33. The pace of privatisation of the health<br />
delivery system is very slow in the <strong>region</strong> compared to the rest of<br />
the country.<br />
TABLE III-32 DISTRIBUTION OF HEALTH FACILITIES, BY DISTRICT<br />
MTWARA REGION 1996<br />
District Hospitals Health<br />
centres<br />
Dispensarie<br />
s<br />
MCH Clinics<br />
Mtwara/Mikindani 1 0 17 11<br />
Mtwara Rural 0 4 28 33<br />
Newala* 1 6 39 46<br />
Masasi 2 4 42 43<br />
Total 4 14 126 133<br />
118
* Included tandahimba district<br />
Source: Regional Ministry of Health office, Mtwara 1997<br />
The coverage of the <strong>region</strong>'s population by the existing health<br />
facilities as shown in Tables III-34 and III-35 show improvement<br />
over the corresponding values given by the 1978 population<br />
census.<br />
119
TABLE III-33<br />
Facility<br />
DISTRIBUTION OF HEALTH FACILITIES BY<br />
OWNERSHIP, MTWARA REGION 1996<br />
Ownership<br />
Public private Total<br />
Hospitals 3 1 4<br />
Health Centres 12 2 14<br />
Dispensaries 108 18 126<br />
Source: Regional Ministry of Health office, Mtwara 1992<br />
Whereas in 1996 the population per dispensary was 7,979 it was<br />
8,039 in 1978. In 1978 the average population per hospital bed<br />
in the <strong>region</strong> was 844, this had improved to 690 by 1996. The<br />
number of dispensaries had increased by 31% from 96 to 126.<br />
Likewise the number of hospital beds increased by 50% from 914<br />
to 1457. Districtwise both Masasi and Newala are poorly<br />
covered compared to the other two districts.<br />
TABLE III-34: POPULATION COVERAGE OF HOSPITALS AND<br />
DISPENSARIES BY DISTRICT, MTWARA REGION, 1996<br />
District Pop 1996<br />
(Est)<br />
Number of<br />
hospitals<br />
Pop per<br />
hospital<br />
Number of<br />
Dispensarie<br />
s<br />
Pop per<br />
Dispensary<br />
Mtwara/Miki<br />
ndani<br />
103,815 1 103,815 17 6,107<br />
Mtwara Rural 190,962 0 0 28 6,820<br />
Newala* 326,207 1 326,207 39 8,364<br />
Masasi 384,421 2 192,211 42 9,153<br />
Total 1005,405 4 251,351 126 7.979<br />
* Included Tandahimba<br />
120
Source:<br />
Compiled from data supplied by Ministry of Health and 1988 Population Census<br />
121
TABLE III-35: DISTRIBUTION OF HOSPITAL/HEALTH CENTRE BEDS AND<br />
POPULATION COVERAGE OF HEALTH FACILITIES MTWARA REGION<br />
1996<br />
District Pop 1996<br />
(Est)<br />
No of<br />
hospital/<br />
H.C.<br />
Beds<br />
No of<br />
Health<br />
facilities<br />
Populati<br />
on per<br />
bed<br />
Populati<br />
on per<br />
facility<br />
Facilities<br />
per<br />
10,000<br />
people<br />
Mtwara/M<br />
ikindani<br />
103,815 n.a 18 n.a 5,768 1.7<br />
Mtwara<br />
Rural<br />
190,962 n.a 32 n.a 5,968 1.7<br />
Newala* 326,207 n.a 46 n.a 7,091 1.4<br />
Masasi 384,421 n.a. 48 n.a 8,009 1.2<br />
Total 1,005,405 1457 144 690 6982 1.4<br />
* Included :Tandahimba district<br />
Note: :Health Facilities are hospitals, health Centres and dispensaries<br />
Source: :Compiled from 1988 Population Census and Table III-32<br />
:Health Statistics Abstract, 1997,<br />
According to covered population per bed in Table III-36 Mtwara<br />
<strong>region</strong> is the best served after Ruvuma and Kilimanjaro, However<br />
when viewed in terms of the number of health facilities is not so<br />
well endowed. It ranks 16 th . It is only better provided for than<br />
Mwanza, Kagera, Tabora and Shinyanga<br />
122
TABLE III-36 NUMBER OF POPULATION PER BED BY REGION 1995<br />
Region Pop 1995 (Est) Number of beds Pop per bed Ranking<br />
Mtwara 991,801 1,457 681 3<br />
Arusha 1,776,799 1,535 1,158 16<br />
Coast 737,178 795 927 13<br />
DSM 1,856,661 2,141 867 10<br />
Dodoma 1,487,139 1,711 869 11<br />
Iringa 1,460,498 2,005 728 5<br />
Kagera 1,641,104 2,074 791 8<br />
Kigoma 1,030,691 832 1,239 18<br />
K'njaro 1,556,928 2,289 680 2<br />
Lindi 741,479 980 757 7<br />
Mara 1,232,112 1,072 1,149 15<br />
Mbeya 1,759,814 1,854 949 14<br />
Morogoro 1,475,604 2,088 707 4<br />
Mwanza 2,351,233 2,867 820 9<br />
Rukwa 996,903 861 1,158 17<br />
Ruvuma 987,223 1,635 604 1<br />
Shinyanga 2,225,069 1,537 1,448 20<br />
Singida 961,038 696 1,381 19<br />
Tabora 1,214,073 1,322 918 12<br />
Tanga 1,457,756 1,935 753 6<br />
Total 27,941,103 31,686 882 -<br />
Source: Health Statistics Abstract, 1997.<br />
123
TABLE III-37:<br />
Region<br />
POPULATION PER HEALTH FACILITY AND NUMBER OF HEALTH<br />
FACILITIES PER 10,000 POPULATION BY REGION, 1995:<br />
Population Number of Population Number of<br />
Estimate Health per Facility Facilities Rankin<br />
1995 Facilities<br />
Per 10,000 g<br />
Pop.<br />
Mtwara 991,801 139 7,135 1.4 16<br />
Arusha 1,776,799 285 6,234 1.6 14<br />
Coast 737,178 192 3,839 2.6 1<br />
DSM 1,856,661 430 4,318 2.3 3<br />
Dodoma 1,487,139 244 6,095 1.6 13<br />
Iringa 1,460,498 285 5,125 2.0 5<br />
Kagera 1,641,104 220 7,460 1.3 18<br />
Kigoma 1,030,691 181 5,694 1.8 10<br />
Kilimanjaro 1,556,928 395 3,942 2.5 2<br />
Lindi 741,479 139 5,334 1.9 8<br />
Mara 1,232,112 233 5,288 1.9 7<br />
Mbeya 1,759,814 292 6,027 1.7 12<br />
Morogoro 1,475,604 280 5,270 1.9 6<br />
Mwanza 2,351,233 317 7,417 1.3 17<br />
Rukwa 996,903 147 6,782 1.5 15<br />
Ruvuma 987,223 195 5,063 2.0 4<br />
Shinyanga 2,225,069 275 8,091 1.2 20<br />
Singida 961,038 163 5,896 1.7 11<br />
Tabora 1,214,073 161 7,541 1.3 19<br />
Tanga 1,457,756 271 5,379 1.9 9<br />
Total 27,941,103 4,844 5,768 1.7 -<br />
Source: Compiled from 1988 Population Census data and Health Statistics Abstract (1997)<br />
data.<br />
124
2.4 Child Immunization:<br />
There are six early childhood diseases against which immunization<br />
can be given. They are tuberculosis, pertussis, diphtheria, tetanus,<br />
polio and measles. The number one target group for such<br />
immunization consist of new born children before they reach one<br />
year. The secondary target group are the under fives. The <strong>region</strong><br />
expects to reach 100% immunization of one year olds by 1999.<br />
The immunization of children under one year had by 1996 reached<br />
a very good coverage of 88.3% for BCG, 82.2% for DPT3,<br />
83.1% for Polio3 and 83.5% for Measles.<br />
TABLE III-38:<br />
DISTRIBUTION OF COVERAGE BY IMMUNIZATION OF<br />
CHILDREN UNDER ONE YEAR, BY DISTRICT, MTWARA<br />
REGION, 1996:<br />
District<br />
Mtwara/Miki<br />
ndani<br />
Target<br />
No.<br />
Children<br />
BCG DPT3 Polio 3 Measles<br />
No. % No. % No. % No. %<br />
3,426 2,623 76.6 2,375 69.3 2,399 70 2,454 71.6<br />
Mtwara Rural 7,699 7,000 90.9 5,629 73.1 5,869 76.2 5,502 71.5<br />
Newala 12,340 10,569 85.5 11,973 97.0 11,870 96.2 11,997 97.2<br />
Masasi 15,438 14,145 91.6 12,004 78.0 12,196 80.0 12,543 81.2<br />
Total (1996) 38,903 34,337 88.3 31,981 82.2 32,334 83.1 32,496 83.5<br />
Total (1995) 39,765 34,855 87.7 38,341 96.4 32,633 82.1 32,087 80.7<br />
Source: Regional MCHCO Annual Report, Mtwara, 1996.<br />
125
TABLE III-39: DISTRIBUTION OF COVERAGE BY IMMUNIZATION OF<br />
UNDER FIVE CHILDREN, BY DISTRICT, MTWARA REGION,<br />
1996:<br />
District<br />
Target<br />
Number<br />
Registered<br />
Complete<br />
Immunization<br />
Continuing with<br />
Immunization<br />
Number % Number % Number %<br />
Mtwara/Mikind<br />
ani<br />
17,129 9,707 56.7 9,028 52.7 372 2.2<br />
Mtwara Rural 38,521 27,486 71.4 21,789 56.6 5,699 14.8<br />
Newala 61,695 39,129 63.4 31,922 51.8 7,207 11.7<br />
Masasi 77,190 71,320 92.4 69,870 90.5 7,320 9.5<br />
Total (1996) 194,535 147,642 75.9 132,609 68.2 20,598 10.6<br />
Total (1995) 195,647 166,805 85.3 146,360 74.8 29,732 15.2<br />
Source: Taarifa ya Huduma za Afya Kinga Mkoa wa Mtwara, 1996.<br />
Fig. 35: Distribution coverage of number registred and complete immunization of<br />
under five children by district, Mtwara <strong>region</strong>, 1996<br />
126
80,000<br />
70,000<br />
60,000<br />
50,000<br />
40,000<br />
30,000<br />
20,000<br />
10,000<br />
0<br />
Mtwara /<br />
Mikindani<br />
Mtwara<br />
Rural<br />
Newala<br />
Masasi<br />
Registered<br />
Complete Immunization<br />
These percentages showed an improvement of over 1995 except<br />
for DPT3 which was 96.4% in 1995. But at this rate of<br />
improvement there is little hope that the target of 100% by 1999<br />
will be attained. See Table III-38. The exception is Newala<br />
district which did extremely well in 1996.<br />
With regard to the immunization of under fives Masasi district<br />
alone is performing well at 90.5 coverage by 1996. The other<br />
three districts are doing badly. The coverage of<br />
Mtwara/Mikindani, Mtwara Rural and Newala districts are<br />
52.7%, 56.6% and 51.8% respectively. The 1996 performance<br />
is generally down from 1995.<br />
3.2.5 Child Nutrition:<br />
127
Under the section on "Food Adequacy" Mtwara <strong>region</strong> is<br />
compared to Singida <strong>region</strong>. The two <strong>region</strong>s have more or less<br />
an identical human population size and are not far apart in the<br />
quantity of pulses and oil seeds produced annually. Also neither<br />
<strong>region</strong> have a significant wildlife population. Yet the number of<br />
livestock units per 1,000 people is 52 for Mtwara and 1,656 for<br />
Singida. This means that expectant mothers and young children<br />
have better access to animal protein (milk, meat etc.) in Singida<br />
than their counterparts in Mtwara <strong>region</strong>. Availability or nonavailability<br />
of protein has implications on the weight of babies<br />
born, nutritional status of under fives, the average height and<br />
general well being of a population. With the help of UNICEF a<br />
CSDP exercise was undertaken in various selected <strong>region</strong>s to<br />
monitor children nutritional status and educate mothers on child<br />
nutrition. Table III-40 shows the results of this intervention in the<br />
<strong>region</strong>s, Mtwara and Singida included.<br />
TABLE III-40: PERCENTAGE OF CHILDREN BORN SEVERELY<br />
UNDERWEIGHT IN CSPD REGIONS, 1990 - 1994:<br />
Region 1990 1991 1992 1993 1994<br />
Mtwara 6.3 5.5 1.8 1.9 2.0<br />
Singida 3.5 1.4 1.5 1.1 1.1<br />
Coast - - - 7.1 4.4<br />
Morogoro 3.2 3.3 2.2 1.6 1.4<br />
Iringa 1.7 1.4 1.3 1.1 1.1<br />
Ruvuma 3.9 3.7 2.3 1.6 1.5<br />
Kagera 2.0 2.1 1.6 1.2 1.2<br />
Kilimanjaro 0.6 0.4 0.3 0.2 0.2<br />
Mara 6.9 3.0 2.8 1.6 1.4<br />
Mwanza - - - 3.2 2.3<br />
Shinyanga 2.0 1.4 1.5 1.1 1.1<br />
128
Total 2.8 2.5 1.6 1.6 1.4<br />
Source: UNICEF Dar-es-Salaam Office, 1997.<br />
Mtwara and Singida started in 1990 with 6.3% and 3.5% severe<br />
underweight respectively. Each <strong>region</strong> progressively reduced this<br />
ratio to reach 2.0% and 1.1% respectively by 1994.<br />
129
TABLE III-41: NUTRITION STATUS OF CHILDREN AT BIRTH IN<br />
TANZANIA MAINLAND, BY REGION, 1995:<br />
Number<br />
Children Under Nutrition<br />
Region weighed<br />
Weight Total %<br />
underweight children which accounted for 3.7% of all children<br />
weighed.<br />
3.2.6 Infant and Under five Mortality:<br />
Infant and Under five Mortality rates are a measure of the success<br />
of all those interventions which affect the health of infants and<br />
young children. Mtwara <strong>region</strong>'s IMR and U5MR as reflected in<br />
Tables III-42 and III-43.<br />
TABLE III-42:<br />
Region<br />
IMR AND U5MR IN TANZANIA MAINLAND BY REGIONS,<br />
1975, 1985 AND 1995 (Est.)<br />
IMR<br />
1975 1985 1995<br />
(est)<br />
U5MR<br />
1975 1985 1995<br />
(est)<br />
Mtwara 161 138 119 267 233 202<br />
Lindi 151 140 129 255 236 218<br />
Ruvuma 145 113 88 245 188 143<br />
Morogoro 140 124 96 267 209 163<br />
Coast 121 113 105 204 189 174<br />
Dar es Salaam 108 105 102 179 173 168<br />
Iringa 152 130 111 257 220 189<br />
Dodoma 133 132 130 225 222 220<br />
Arusha 108 75 52 179 129 78<br />
Kagera 133 130 127 225 219 212<br />
Kigoma 163 115 81 269 192 137<br />
Kilimanjaro 76 67 59 119 104 90<br />
131
Mara 140 125 112 236 211 189<br />
Mbeya 161 124 96 267 209 163<br />
Mwanza 139 115 95 233 192 157<br />
Rukwa 170 131 101 283 221 172<br />
Shinyanga 150 110 81 252 183 131<br />
Singida 137 96 67 231 157 106<br />
Tabora 140 101 73 236 166 116<br />
Tanga 112 106 100 187 176 166<br />
Source: Health Statistics Abstract 1997.<br />
Fig. 36: IMR and U5MR in Mtwara <strong>region</strong>, 1975, 1985 and 1995 (Est.)<br />
300<br />
250<br />
200<br />
150<br />
U5MR<br />
100<br />
IMR<br />
50<br />
0<br />
1975 1985 1995 1975 1985 1995<br />
The <strong>region</strong> ranks at the bottom along with Lindi <strong>region</strong>. The two<br />
<strong>region</strong>s have the worst IMR and U5MR. Another factor which<br />
becomes clear in studying Table III-43 is that urban areas have a<br />
lower IMR and U5MR than rural areas in Mtwara, as indeed in<br />
132
TABLE III-43:<br />
most of <strong>Tanzania</strong>. Rural areas are more risky healthwise for the<br />
young child.<br />
Region<br />
IMR AND U5MR IN TANZANIA MAINLAND, BY REGIONS<br />
AND URBAN/RURAL CONFIGURATION, 1988:<br />
IMR<br />
U5MR<br />
Rural Urban Averag<br />
e<br />
Rural Urban Average<br />
Mtwara 143 108 138 241 180 233<br />
Lindi 143 121 129 241 204 236<br />
Ruvuma 114 107 113 190 177 188<br />
Morogoro 134 94 125 226 153 211<br />
Coast 115 104 113 193 172 189<br />
Dar es Salaam 121 103 105 203 169 173<br />
Iringa 130 135 130 219 229 220<br />
Dodoma 136 94 132 230 154 222<br />
Arusha 76 72 75 120 114 129<br />
Kagera 130 116 130 220 193 219<br />
Kigoma 116 109 115 194 181 192<br />
Kilimanjaro 66 73 67 102 115 104<br />
Mara 128 101 125 216 116 211<br />
Mbeya 128 107 124 216 177 209<br />
Mwanza 119 97 115 200 158 192<br />
Rukwa 134 112 131 227 186 221<br />
Shinyanga 112 92 110 186 150 183<br />
Singida 99 81 96 161 129 157<br />
Tabora 101 103 101 165 169 166<br />
Tanga 109 89 106 182 144 176<br />
133
Source:<br />
1988 Population Census.<br />
Fig. 37: IMR and U5MR in Mtwara <strong>region</strong> Rural/Urban configuration, 1988<br />
250<br />
200<br />
150<br />
100<br />
50<br />
IMR<br />
U5MR<br />
0<br />
Rural Urban Rural Urban<br />
From Table III-44 a similar picture to the Urban/Rural set up<br />
appears with respect to the sex of a child. Female children in<br />
Mtwara and most of <strong>Tanzania</strong> are less at risk from death than their<br />
male counterparts. They have a lower IMR and U5MR as a<br />
population than the male population.<br />
TABLE III-44:<br />
Region<br />
IMR AND U5MR IN TANZANIA MAINLAND BY REGION AND<br />
BY SEX, 1988:<br />
IMR<br />
Male Female Averag<br />
e<br />
U5MR<br />
Male Female Averag<br />
e<br />
Mtwara 141 134 138 238 227 233<br />
Lindi 140 139 140 237 235 236<br />
Ruvuma 115 110 113 193 183 188<br />
Morogoro 133 118 125 224 197 211<br />
134
Coast 118 109 113 199 180 189<br />
Dar es Salaam 109 100 105 181 165 173<br />
Iringa 137 124 130 231 209 220<br />
Arusha 79 82 75 126 131 129<br />
Dodoma 136 127 132 230 114 222<br />
Kagera 133 127 130 224 213 219<br />
Kigoma 119 111 115 200 184 192<br />
Mara 128 122 125 216 205 211<br />
Kilimanjaro 67 67 67 104 104 104<br />
Mbeya 130 118 124 220 197 209<br />
Mwanza 122 108 115 204 178 192<br />
Rukwa 137 125 131 232 211 221<br />
Shinyanga 114 106 110 191 175 183<br />
Singida 98 94 96 161 152 157<br />
Tabora 103 99 101 169 163 166<br />
Tanga 110 102 106 183 168 176<br />
Source:<br />
1988 Population Census.<br />
3.2.7 Maternal Mortality:<br />
Death of women directly connected with child bearing is still a<br />
problem in developing countries and certainly in Mtwara <strong>region</strong>.<br />
Unlike for IMR and U5MR the Maternal Mortality Rate for<br />
Mtwara is average for the country. Since 1992 MMR has shown<br />
signs of some slight improvement.<br />
135
136
TABLE IV-45:<br />
MATERNAL MORTALITY RATE IN TANZANIA MAINLAND<br />
BY REGIONS FOR 1992 TO 1995:<br />
Region 1992 1993 1994 1995 Rankin<br />
g<br />
Mtwara 264 212 161 252 10<br />
Lindi 262 289 193 264 14<br />
Ruvuma 225 189 186 177 8<br />
Morogoro 289 172 190 153 6<br />
Coast 209 111 70 187 5<br />
Dar es Salaam 220 398 237 328 19<br />
Iringa 311 321 276 281 18<br />
Arusha 102 158 114 159 4<br />
Shinyanga 143 188 199 184 9<br />
Singida 242 171 238 207 13<br />
Dodoma 197 214 208 266 16<br />
Kagera 304 343 190 242 12<br />
Kigoma 144 155 105 87 2<br />
Kilimanjaro 126 46 107 63 1<br />
Mara 67 59 106 124 3<br />
Mbeya 67 361 436 264 20<br />
Mwanza 221 186 266 207 15<br />
Rukwa 172 294 243 267 17<br />
Tabora 151 185 130 216 7<br />
Tanga 255 172 220 195 11<br />
Total 199 211 197 208 -<br />
137
Source: Health Statistics Abstract, 1997.<br />
138
Fig. 38: Maternal mortality rate in Mtwara <strong>region</strong> to Total Mainland for 1992 to 1995<br />
300<br />
250<br />
200<br />
150<br />
Mtwara Region<br />
Total Mainland<br />
100<br />
50<br />
0<br />
1992 1993 1994 1995<br />
One way to reduce MMR is to ensure that all women of child<br />
bearing age are immunised against tetanus. Table III-46 shows<br />
how this exercise fared in 1996. A total 39.8% of this group of<br />
women had two or more vaccinations rendering them nominally<br />
immune. The rate for 1995 was 42.2%. Further efforts are<br />
required particularly in the district of Mtwara/Mikindani and<br />
Mtwara Rural, which districts scored rates of 24.4% and 26.2%<br />
respectively. This means only one quarter of women of the target<br />
group were immunised against tetanus in these two districts.<br />
139
TABLE III-46:<br />
District<br />
TETANUS VACCINATION OF WOMEN WITHIN THE CHILD<br />
BEARING AGE GROUP, MTWARA REGION, BY DISTRICTS,<br />
1996:<br />
Mtwara/Mi<br />
kindani<br />
Mtwara<br />
Rural<br />
Newala Masasi Total<br />
1996 1995<br />
Target Number 17,129 38,493 61,695 77,190 194,507 198,829<br />
1st Vaccination:Number 2,865 6,138 14,720 11,415 35,138 55,495<br />
:Percent 16.7 15.9 23.9 14.8 18.1 27.9<br />
2nd<br />
2,261 4,208 13,200 9,631 29,300 41,649<br />
Vaccination:Number<br />
13.2 10.9 21.4 12.5 15.1 20.9<br />
:Percent<br />
3rd<br />
1,138 2,876 11,483 10,965 26,462 25,466<br />
Vaccination:Number<br />
:Percent 6.6 7.5 18.6 14.2 13.6 12.8<br />
4th<br />
Vaccination:Number<br />
:Percent<br />
5th<br />
Vaccination:Number<br />
:Percent<br />
Two or More<br />
Vaccination: Number<br />
:Percent<br />
525 1,970 7,292 5,013 14,800 12,490<br />
3 5.1 11.8 6.5 7.6 6.3<br />
248 1,021 3,596 1,921 6,786 4,253<br />
1.4 2.7 5.8 2.5 3.5 2.1<br />
4,172 10,075 35,571 27,530 77,348 83,858<br />
24.4 26.2 57.7 35.7 39.8 42.2<br />
Source: Taarifa ya Huduma za Afya Kinga Mkoa wa Mtwara, 1996.<br />
3.2.8 AIDS:<br />
Acquired Immunity Deficiency Syndrome (AIDS) is gaining importance as<br />
a cause of death in the <strong>region</strong>. The first case of AIDS in the <strong>region</strong> was<br />
discovered in 1985. By 1996 the cumulative total of AIDS cases was<br />
2,244 or 242 in every 100,000 population. See Table III-47 and III-48.<br />
140
Compared to its neighbours the <strong>region</strong> has the least number of cases. Its<br />
ranking as number 13 on the national scale shows that its situation<br />
AIDSwise is better than average.<br />
TABLE III-47<br />
CUMULATIVE AIDS CASES BY REGION IN SELECTED<br />
NEIGHBORING REGIONS 1991-1996<br />
Region 1991 1992 1993 1994 1995 1996<br />
Mtwara 1361 1962 2090 2201 2267 2244<br />
Lindi 842 1211 1691 1966 2173 2480<br />
Ruvuma 1197 1807 2480 2847 3087 3345<br />
Morogoro 2398 3598 4328 4575 4605 4605<br />
Coast 1676 2215 2740 3023 3268 3373<br />
DSM 8834 9295 10406 11050 11302 12983<br />
Iringa 2281 3334 4462 4674 4785 4883<br />
Dodoma 536 762 1028 1071 1090 1096<br />
Total<br />
Mainland<br />
44195 60066 73572 79445 83351 88467<br />
Source: Health Statistics Abstract 1997<br />
TABLE III-48 RATE OF AIDS PER 100,000 POPULATION BASED ON<br />
CUMULATIVE CASES IN SELECTED NEIGHBORING<br />
REGIONS 1992,1993 AND 1996<br />
Region 1992 1993 1996 1996<br />
Ranking in<br />
<strong>Tanzania</strong><br />
Mainland<br />
Mtwara 106 110 242 13<br />
Lindi 95 112 328 7<br />
Ruvuma 111 128 328 6<br />
Morogoro 160 164 305 9<br />
141
Coast 189 206 446 4<br />
DSM 538 531 678 1<br />
Iringa 144 161 325 8<br />
Source: Health Statistics Abstract, 1997<br />
The rate of new cases per year has slowed down possibly<br />
because health education is becoming effective. At 2244<br />
cumulative cases the <strong>region</strong> has only 2.5% of the cumulative cases<br />
in the Mainland, although it has some 3.8% of the country's<br />
population.<br />
3.2.9 Life Expectancy<br />
Life expectancy is the ultimate measure of a <strong>region</strong>'s health<br />
environment. In the case of Mtwara <strong>region</strong> life expectancy at birth<br />
averaged 40 years. That was in 1978. In 1988 this had increased<br />
to 44 and 48 for males and females respectively. These figures<br />
are below the national averages, and ranks Mtwara a low of<br />
number 16 being only better than Rukwa, Dodoma, Iringa and<br />
Kagera.<br />
TABLE III-49<br />
LIFE EXPECTANCY AT BIRTH TANZANIA MAINLAND BY<br />
SEX AND BY REGION 1978 AND 1988 IN YEARS<br />
Region Average 1978 1988 Ranking<br />
Average Male Female<br />
Mtwara 40 46 44 48 16<br />
Lindi 42 47 46 48 13<br />
Ruvuma 43 49 48 50 8<br />
Morogoro 44 46 45 48 15<br />
142
Coast 47 48 46 51 9<br />
DSM 50 50 50 50 5<br />
Iringa 41 45 44 47 19<br />
Arusha 50 57 57 58 2<br />
Dodoma 45 46 45 47 18<br />
Kagera 45 45 44 45 20<br />
Kigoma 40 48 47 49 11<br />
Kilimanjaro 58 59 57 62 1<br />
Mara 44 47 46 48 12<br />
Mbeya 41 47 45 48 14<br />
Mwanza 44 48 46 50 10<br />
Rukwa 40 45 44 47 17<br />
Shinyanga 42 50 48 51 6<br />
Singida 44 55 54 55 3<br />
Tabora 44 53 53 54 4<br />
Tanga 49 49 48 51 7<br />
Mainland 44 49 51 -<br />
Source: 1988 Population Census<br />
3.2.10 Other Health Issues<br />
3.2.10.1 Tuberculosis and Leprosy<br />
These two scourges are still with the <strong>region</strong>. The onset of AIDS<br />
has strengthened the spread of tuberculosis so much so that it is<br />
143
on the increase. Table III-50 figures for TB rates are misleading,<br />
the slight decline in 1993 was only temporary since elsewhere in<br />
the country the disease has increased. The leprosy rates reflect<br />
the true trend consistent with the rest of the country. Leprosy is<br />
on the decline.<br />
144
TABLE III-50<br />
SWEAR POSITIVE PULMONARY TB AND LEPROSY CASE<br />
DETECTION RATE PER 100,000 POPULATION IN MTWARA<br />
AND NEIGHBORING REGIONS 1992 AND 1993<br />
Region TB Rates Leprosy Rates<br />
1992 1993 1992 1993<br />
Mtwara 96 94 53.0 39.8<br />
Lindi 61 64 24.0 18.3<br />
Morogoro 47 58 27.0 15.4<br />
Coast 58 78 11.0 17.0<br />
DSM 126 213 0.0 10.4<br />
Iringa 51 65 1.8 2.7<br />
Total<br />
Mainland<br />
48 57 13 11<br />
Source: Health Statistics Abstract, 1997<br />
Mtwara <strong>region</strong> has the highest case detection rate for leprosy in<br />
the country not only among neighboring <strong>region</strong>s. The <strong>region</strong>'s<br />
rates are about four times the national averages.<br />
3.2.10.2 Cost Sharing<br />
Given the high cost of running health services by the public sector,<br />
and at the same time given the fiscal constraints, the government<br />
since 1994 has encouraged the public to share in the cost of<br />
running public facilities. It involves a change in attitude, so it is<br />
only slowly that people are coming to accept this reality. During<br />
1994/95 and 1995/96 Mtwara residents paid user charges to the<br />
145
tune of TShs 10.7 million and TShs 7.5 million respectively. A<br />
start has been made. Asking households to take care of part of<br />
health care bills is in line with government efforts to encourage the<br />
privatisation of the health sector.<br />
3.3 WATER SUPPLY<br />
3.3.1 Introduction<br />
The sources of water in the <strong>region</strong> are dominated by rivers<br />
Ruvuma, Mbuo, Mambi and Mbangala and lakes Kitere and<br />
Chidya. But in order to supply the much scattered population<br />
ground water is also exploited as well as some harvesting of rain<br />
water.<br />
Environmental degradation through uncontrolled cultivation and<br />
deforestation have taken their toll on water availability.<br />
Destruction of tree cover over spring water sources have dried up<br />
such sources. Twenty three water schemes out of 53 constructed<br />
between 1970 and 1980 have dried up this way.<br />
3.3.2 Rural Water Supplies<br />
The kinds of rural water supply facilities varies a lot from district<br />
to district. Mtwara rural has a rich mixture of piped system,<br />
boreholdes, shallow wells and dams.<br />
146
District Status Piped<br />
systems<br />
Bore<br />
Holes<br />
Shallow<br />
wells<br />
Dams<br />
Mtwara<br />
Rural<br />
working<br />
not workers<br />
total<br />
% not working<br />
4<br />
16<br />
20<br />
80<br />
19<br />
26<br />
45<br />
58<br />
206<br />
134<br />
340<br />
39<br />
4<br />
2<br />
6<br />
33<br />
Masasi<br />
working<br />
not working<br />
total<br />
% not working<br />
-<br />
-<br />
-<br />
-<br />
-<br />
-<br />
-<br />
-<br />
415<br />
150<br />
565<br />
27<br />
-<br />
-<br />
-<br />
-<br />
Newala*<br />
working<br />
not working<br />
total<br />
40%<br />
60%<br />
100%<br />
-<br />
-<br />
-<br />
-<br />
-<br />
-<br />
-<br />
-<br />
-<br />
* Includes Tandahimba District<br />
Source: Regional Water Engineer, Mtwara 1997<br />
Masasi on the other hand relies only on shallow wells and Newala<br />
on piped systems using electricity. See Table III-51<br />
The water supply needs of the districts were met at the following<br />
level in 1996:-<br />
Mtwara Rural - 44%<br />
Masasi - 41%<br />
Newala/Tandahimba - 40%<br />
Although 87% of the villages are covered by one or more safe<br />
water supply system, the quickest way to increase coverage in the<br />
future is the rehabilitation of systems now out of use. The general<br />
147
deterioration of the nation's economy has also affected water<br />
supplies in Mtwara <strong>region</strong>.<br />
In an effort to break away from reliance on government budgetary<br />
allocations for operating and maintenance of water systems village<br />
water committees have been set up. See Table III-52. Some 134<br />
water committees have been set up among 24% of the <strong>region</strong>'s<br />
villages. Water funds are in 102 or 19% of all villages are<br />
covered.<br />
TABLE III-52<br />
District<br />
DISTRIBUTION OF VILLAGE WATER COMMITTEES AND VILLAGE<br />
WATER FUNDS, BY DISTRICT, MTWARA REGION 1996<br />
Number<br />
of<br />
villages<br />
Village water<br />
Committees<br />
Village water Funds<br />
Number % Number %<br />
Mtwara Rural 101 41 41 26 26<br />
Masasi 214 47 22 47 22<br />
Newala<br />
Tandahimba<br />
and<br />
233 46 20 29 12<br />
Total 548 134 24 102 19<br />
Source: Regional Water Engineer, Mtwara 1997<br />
3.3.3 Urban Water Supplies<br />
Masasi town is dependent on four water sources: Mchema dam, 5<br />
deep wells at Magumchila, 50 shallow wells dug within the town<br />
area and water catchment from Mwena and Mwili springs. A<br />
variety of sources also supply Mtwara and Mikindani townships.<br />
These are: 7 deep wells in Mtawanya valley, 2 deep wells within<br />
the Mikindani area and lastly the spring at Mchuchu. Newala<br />
148
TABLE III-53<br />
town is served by the extensive Makonde plateau piped water<br />
system which relies on electricity.<br />
These four major towns of the <strong>region</strong>, i.e. Mtwara, Mikindani,<br />
Masai and Newala need 12.2 million litres of water each day. So<br />
far by 1996 only 6.0 million litres could be supplied. This is 49%<br />
of the demand. Once again fiscal constraints are to blame for this<br />
low coverage. See Table III-53.<br />
DEMAND AND SUPPLY OF SAFE WATER BY TOWNS,<br />
MTWARA REGION 1996 ('000 litres per day)<br />
Township Demand Supply Shortage<br />
litres litres Litres %<br />
Mtwara 8000 4500 3500 44<br />
Mikindani 200 54 146 73<br />
Masasi 2000 900 1100 55<br />
Newala 2000 500 1500 75<br />
Total 12200 5954 6246 51<br />
Source: Regional water Engineer, Mtwara, 1997<br />
Fig. 39: Demand and supply of safe water by towns, Mtwara <strong>region</strong> 1996 ('000 litres<br />
per day)<br />
149
Newala<br />
Masasi<br />
Supply<br />
Demand<br />
Mikindani<br />
Mtwara<br />
0 1000 2000 3000 4000 5000 6000 7000 8000<br />
150
3.3.4 Sanitation<br />
TABLE III-54<br />
The 1988 Population Census gave for the first time a<br />
comprehensive picture of the sanitation situation in the <strong>region</strong>. The<br />
census revealed that 86.5% of all households or 89% of the<br />
<strong>region</strong>'s population had access to toilet facilities.<br />
ACCESS TO TOILETS BY HOUSEHOLD AND<br />
POPULATION MTWARA REGION 1988<br />
Type of Facility Household Population<br />
Number % Number %<br />
with flush inside 2313 1.2 10,528 1.2<br />
with<br />
outside/shared<br />
flush<br />
1518 0.8 6318 0.7<br />
with pit latrine 168,026 84.5 762,662 87.1<br />
no toilet 26,974 13.5 96,430 11.0<br />
not stated 9 0.0 44 0.0<br />
Total 198,840 100 875,982 100<br />
Source: 1988 Population Census<br />
According to Table III-55 the district of Newala leads in having<br />
the least percentage of people without toilet facilities closely<br />
followed by Masasi. This is with respect to rural areas. The<br />
<strong>region</strong>al percentage of those without toilets is 11.9.<br />
151
TABLE III-55 ACCESS TO TOILETS BY DISTRICT AND POPULATION<br />
MTWARA REGION RURAL AREAS 1988<br />
District<br />
Total<br />
Populatio<br />
n<br />
Flush Toilet Pit latrine No Toilet N.S<br />
Pop % Pop % Pop % Po<br />
p<br />
Mtwara/Mikindani 9405 339 3.6 7581 80.<br />
6<br />
1485 15.<br />
8<br />
o<br />
Mtwara Rural 161,576 1580 1.0 123,78<br />
6<br />
76.<br />
6<br />
36210 22.<br />
4<br />
0<br />
Masasi 304,274 2306 0.8 269,80<br />
9<br />
88.<br />
7<br />
32115 10.<br />
5<br />
44<br />
Newala* 275,595 2884 1.0 253,17<br />
2<br />
91.<br />
9<br />
19,539 7.1 0<br />
Total 750,850 7109 1.0 654,34<br />
8<br />
87.<br />
1<br />
89,349 11.<br />
9<br />
44<br />
* Included Tandahimba District<br />
Source: 1988 Population Census<br />
In urban areas, the percent age of people without toilets is 5.6%<br />
for the <strong>region</strong>. As expected this figure is smaller than that of rural<br />
areas. Mtwara/ Mikindani has the largest proportion of its urban<br />
population without toilets. It is 7.7%.<br />
TABLE III-56:<br />
District<br />
Mtwara/Mikinda<br />
ni<br />
ACCESS TO TOILET FACILITIES BY DISTRICT AND<br />
POPULATION, MTWARA REGION URBAN AREAS 1988:<br />
Total<br />
Populatio<br />
n<br />
Flush Toilets Pit Latrines No Toilets N.S.<br />
Popul<br />
ation<br />
% Populat<br />
ion<br />
% Popul<br />
ation<br />
% Pop.<br />
66,455 7,789 11.7 53,563 80.6 5,103 7.7 0<br />
152
Mtwara Rural 6,613 54 0.8 6,321 95.6 238 3.6 0<br />
Newala* 25,652 369 1.4 24,369 95.0 914 3.6 0<br />
Masasi 26,412 1,525 5.8 24,061 91.1 826 3.1 0<br />
Total 125,132 9,737 7.8 108,31<br />
4<br />
86.6 7,081 5.6 0<br />
* Includes Tandahimba<br />
Source: 1988 Population Census.<br />
The combined rural plus urban access coverage for the <strong>region</strong> is<br />
89%. Only 11% of Mtwara's population have no toilets or have<br />
no access to one. Mtwara Rural district has the worst record of a<br />
district. Some 21.6% of the district's population do not have<br />
access to toilet facilities. See Table III-57.<br />
District<br />
Mtwara/Mik<br />
indani<br />
Mtwara<br />
Rural<br />
DISTRICT, MTWARA REGION 1988:<br />
Total<br />
Populatio<br />
n<br />
Flush Toilets Pit Latrines No Toilets N.S.<br />
Populatio<br />
n<br />
% Populatio<br />
n<br />
% Populatio<br />
n<br />
% Pop.<br />
75,860 8,128 10.7 61,144 80.6 6,588 8.7 0<br />
168,189 1,634 1.0 130,107 77.4 36,448 21.6 0<br />
Newala* 301,247 3,253 1.1 277,544 92.1 20,453 6.8 0<br />
Masasi 330,686 3,831 1.2 293,870 88.9 32,941 9.9 44<br />
Total 875,982 16,846 1.9 762,665 87.1 96,430 11.0 0<br />
* Included Tandahimba District.<br />
Source: 1988 Population Census.<br />
153
SECTION IV<br />
ECONOMIC INFRASTRUCTURE<br />
4.1 Introduction<br />
4.2 Roads<br />
Economic development is not possible without an adequate<br />
supporting <strong>economic</strong> infrastructure. Mtwara <strong>region</strong> has a lot of<br />
potential for development but it is also an open secret that the<br />
<strong>region</strong>s <strong>economic</strong> infrastructure is grossly underdeveloped. Take<br />
the example of communications. The <strong>region</strong>'s communication links<br />
with the outside are rudimentary and tend to be seasonal. Within<br />
the <strong>region</strong>, the lack of maintenance make road transport between<br />
one corner of the <strong>region</strong> and another, both uncertain and<br />
hazardous. Inspite of these set backs the <strong>region</strong>'s average<br />
contribution to the national GDP is 3.27% way ahead of Rukwa,<br />
Dodoma, Singida, Kigoma and Coast <strong>region</strong>s. Improvement in<br />
the <strong>region</strong>'s infrastructure will enhance the <strong>region</strong>'s contribution to<br />
the national economy.<br />
The <strong>region</strong> is connected to the outside by the following roads<br />
outlets:-<br />
- The Mtwara, Lindi, Kilwa, Dar es Salaam, Coastal trunk road.<br />
- The Mtwara,Songea, Makambako round about link to the<br />
Tanzam highway.<br />
154
The friendship bridge over the Ruvuma river to Mozambique has<br />
still to be built.<br />
155
ROAD NETWORK - MTWARA REGION MAP<br />
MTWARA REGON ADMIN MAP<br />
LINDI<br />
Indian Ocean<br />
Mtwara<br />
Masasi<br />
MASASI<br />
NEWALA<br />
MTWARA<br />
Newala<br />
MTWARA<br />
MOZAMBIQUE<br />
Computer Graphic design & Cartography by: L.V.Mtaroni (97).<br />
LEGEND<br />
Regional boundary<br />
District boundaries<br />
Road network<br />
Ocean Water bourder<br />
Background Mtwara<br />
District Urban centers.<br />
Other Urban centers.<br />
156
TABLE IV-I;<br />
All these links are subject to the vagaries of the weather so that<br />
they are nearly always impassable during the rainy season. Even<br />
during the dry season they are used with difficulty and are<br />
expensive of spares, fuel and time.<br />
Intra-<strong>region</strong>al road links exist but suffer from maintenance. Hence,<br />
these too are travelled by road users at their own risk. Unlike their<br />
counterparts in Sukuma land who use bicycles as alternatives for<br />
light loads, the sandy terrain which predominates the <strong>region</strong><br />
excludes this.<br />
The absence of a sizeable cattle herd also excludes the use of<br />
oxcarts for the movement of farm inputs and crop produce. In<br />
many parts of the <strong>region</strong> walking with your load is the only<br />
alternative to car transport.<br />
Mtwara <strong>region</strong> has 5,596 kms of roads which works out at a road<br />
density level of 0.335 kms per sq km of land. Table IV-I compares<br />
Mtwara <strong>region</strong> with certain selected <strong>region</strong>s.<br />
Region Total Roads<br />
(Kms)<br />
STATUS ROAD TRANSPORT IN MTWARA REGION AND<br />
SOME SELECTED REGIONS<br />
Earth<br />
(Kms)<br />
Roads<br />
% Earth<br />
Roads<br />
Road<br />
Km/Km 2<br />
density<br />
Mtwara 5596 5401 97 0.335<br />
Lindi 6686 6444 96 0.100<br />
Mwanza 6349 5147 81 0.315<br />
Dodoma 4236 3384 80 0.103<br />
Shinyanga 5670 4852 86 0.112<br />
Morogoro 3742 - - 0.315<br />
Tanga 2778 1382 50 0.102<br />
Mbeya 4831 3765 78 0.076<br />
157
Source: Compiled from data supplied by Regional Engineer, Mtwara, 1997<br />
:Regional Socio-Economic Profiles, Lindi, Mwanza, Dodoma, Shinyanga, Morogoro, Tanga and<br />
Mbeya<br />
TABLE IV-2<br />
DISTRIBUTION ROADS BY DISTRICT AND BY TYPE OF<br />
SURFACE MTWARA REGION 1997<br />
District Type of Surface (Kms) Total Road<br />
Density<br />
Km/Km 2<br />
Tarmac Gravel Earth<br />
Mtwara 53 20 880 953 0.253<br />
Newala 1.5 - 1,081 1,082.5 0.269<br />
Masasi 80 40 3,440 3,560 0.398<br />
Total 134.5 60 5,401 5,595.5 0.335<br />
Source: Taarifa fupi ya hali ya maendeleo Mkoa wa Mtwara, April 1995<br />
It is clear from table IV-I that in terms of road density Mtwara<br />
<strong>region</strong> has a better than average development. However table<br />
IV-2 shows that only some 200 kms of Mtwara <strong>region</strong> roads are<br />
either gravel or tarmac surfaced. That is only 3% of total road<br />
length. Some 97% of the roads are earth surfaced with the<br />
implication that they are generally impassable during the rainy<br />
season. By the time the rains stop and repairs are undertaken it<br />
leaves only 3 to 4 months of passable use. Three quarters of the<br />
time the roads are impassable or barely so because of rains or<br />
because they have yet to be repaired.<br />
According to responsibility, trunk and <strong>region</strong>al roads are the<br />
responsibility of the Regional Engineer while district and feeder<br />
roads belong to district authorities. See Table IV-3. District<br />
councils throughout the country have showed little aptitude in<br />
158
maintaining roads they are responsible for. Hence these feeder<br />
and district roads in Mtwara go largely impaired from one year to<br />
the next. Trunk and <strong>region</strong>al roads have a better track record for<br />
maintenances.<br />
TABLE IV-3<br />
Class<br />
CLASSIFICATION OF ROADS,<br />
MTWARA REGION, 1997<br />
Kilometres<br />
Trunk 395<br />
Regional 778<br />
District 1592<br />
Feeder 2831<br />
Total 5596<br />
Source: Regional Engineer, Mtwara 1997:<br />
Utekelezaji wa irani za CCM za Uchaguzi wa madiwani 1994 na Wabunge 1995<br />
4.3. Air Services<br />
Air transport for some months in the year is the only reliable link<br />
with the outside world that Mtwara <strong>region</strong> possesses. The only<br />
other alternative is marine transport. The rainy season renders<br />
most of road transport impassable. Of course, air transport can<br />
only cater for urgent or high value cargo and V.I.P. passengers.<br />
It is too expensive for ordinary use. Competition for space on<br />
marine boats is restrictive.<br />
159
The <strong>region</strong> has the benefit of three aerodromes; one major airport,<br />
one minor airport and one airstrip. Mtwara is the major airport<br />
capable of handling Boeing 737 aircraft and regular commercial<br />
traffic. Masasi is a minor airport while Newala is a mere airstrip<br />
for use by light, non-commercial aircraft at irregular intervals.<br />
According to Table IV-4 the general decline in the country's<br />
economy has also affected adversely the volume of air cargo and<br />
air passengers handled by Masasi and Mtwara airports in recent<br />
years. Nevertheless, the importance especially of Mtwara airport<br />
in <strong>Tanzania</strong> is still evident. It is the most busy airport after Dar es<br />
salaam, Kilimanjaro, Mwanza and Zanzibar. In terms of air cargo<br />
Mtwara was ahead of Zanzibar in 1991,1992 and 1993. See<br />
Table IV-5 and IV-6.<br />
TABLE IV-4<br />
THE TREND OF SCHEDULED COMMERCIAL AIR<br />
FREIGHT (TONS) AND SCHEDULED COMMERCIAL<br />
AND NON-COMMERCIAL AIR PASSENGERS<br />
HANDLED AT MTWARA AND MASASI AIRPORTS<br />
1986-1993<br />
Year Mtwara Masasi<br />
Freight<br />
Passenge<br />
rs<br />
Freight<br />
Passengers<br />
1986 301.0 28,607 - -<br />
1987 329.3 28,918 - -<br />
1988 311.1 24,820 - 1,986<br />
1989 322.6 19,950 - 668<br />
1990 318.4 17,445 - 103<br />
1991 235.0 20,138 - 72<br />
160
1992 170.5 16,489 - -<br />
1993 156.7 18,886 - 1,842<br />
Source: Transport Statistics 1993<br />
161
Fig. 40: The trend of scheduled commercial Air Freight (tons) and scheduled<br />
commercial<br />
and non-commercial Air Passengers handled at Mtwara Airport 1986-1993<br />
30000<br />
25000<br />
20000<br />
15000<br />
10000<br />
5000<br />
0<br />
1986 1987 1988 1989 1990 1991 1992 1993<br />
Freight<br />
Passengers<br />
TABLE IV-5<br />
COMMERCIAL AND NON-COMMERCIAL AIR TRAFFIC<br />
PASSENGERS HANDLED AT MAJOR AIR PORTS IN<br />
TANZANIA 1986-1993<br />
Year D’Salaam K'njaro Mwanza *Zanzibar Mtwara<br />
1986 572,257 194,630 52,752 139,194 28,607<br />
1987 580,591 206,476 74,840 133,981 28,918<br />
1988 569,796 191,931 86,210 174,289 24,820<br />
1989 471,163 175,409 56,151 81,225 19,950<br />
1990 504,838 190,630 55,597 119,893 17,445<br />
1991 510,716 195,171 71,743 129,200 20,138<br />
1992 437,165 212,262 71,181 115,001 16,489<br />
1993 *272,753 191,139 59,504 79,214 18,886<br />
Source: Transport Statistics 1993<br />
* Scheduled Commercial Traffic only<br />
162
TABLE IV-6 COMMERCIAL AIR TRAFFIC FREIGHT HANDLED AT<br />
MAJOR AIR PORTS IN TANZANIA 1986-1993<br />
Year *DSM K'njar<br />
o<br />
Mwanza<br />
Zanziba<br />
r<br />
Mtwara<br />
1986 7,047.9 841.7 236.4 474.9 301.0<br />
1987 5,798.0 708.7 426.8 499.9 329.3<br />
1988 8,225.4 1,287.5 837.4 1,202.9 311.1<br />
1989 5,236.8 1,246.3 669.2 660.8 232.6<br />
1990 7,657.9 1,348.2 627.6 319.2 318.4<br />
1991 8,442.7 1,348.2 1,102.1 200.2 235.0<br />
1992 5,517.2 683.1 737.7 69.2 170.5<br />
1993 5,730.2 2,029.2 1,065.6 123.6 156.7<br />
Source: Transport Statistics, 1993<br />
* Scheduled commercial traffic only<br />
4.4. Marine Services<br />
Mtwara <strong>region</strong> has one major harbour and that is Mtwara port.<br />
This port is so strategically well placed that it could serve as an<br />
outlet for cargo to and from the southern <strong>region</strong>s of Mtwara,<br />
Ruvuma and Lindi as well as the countries of Malawi and Zambia.<br />
Lack of good communication links with its hinterland has dimmed<br />
the development of this port's potential.<br />
The harbour was built as long back as the pre-Independence<br />
years of 1950's primarily to service the British Overseas Food<br />
Corporation. O.F.C. was an ambitious colonial oil seed<br />
production scheme. This venture failed leaving the harbour with<br />
excess capacity. The harbour can accommodate two ships at a<br />
163
time at its deep water berth as well as another three ships within<br />
the harbour and at its entrance channel. It has covered storage<br />
capacity of 15,000 tons and a 15,000 square meters of open yard<br />
that could be used for container storage. All in all the port can<br />
handle 400,000 tons of cargo a year. This can be extended to<br />
750,000 tons if containerization is opted for. Actual utilization,<br />
however, has averaged 90,000 tons per annum over the last five<br />
years. Thus only one quarter of the harbour's capacity is utilized.<br />
Mtwara port is connected to Dar es Salaam port by some regular<br />
commercial freight and passenger services which need a lot of<br />
improvement. Such marine transport services do not offer a viable<br />
alternative to the road link between the northern and southern<br />
zones of the country. But they provide along with air services a<br />
crucial safety valve especially during the rainy season.<br />
4.5 Telecommunication Network<br />
Apart from Radio <strong>Tanzania</strong> services which are widely used and<br />
listened to, the <strong>Tanzania</strong> Telecommunications Company offers<br />
telephone and fax services. Some 900 customers in Mtwara town<br />
and 400 others in the districts are directly connected to the<br />
network. The total capacity is for 1550 telephone lines.<br />
Radio calls and Postal mail services also exist and are widely<br />
used.<br />
4.6 Energy<br />
4.6.1 Electricity:<br />
164
TANESCO provides commercial electricity services to Mtwara<br />
urban area and to Masasi and Newala towns. For Mtwara town<br />
the company generates 1.13 MWs though the demand is as high<br />
as 3.5 MWs. The Masasi power station produces only 3.0 MWs<br />
for Masasi and Newala since one of its generators capable of<br />
producing another 1.5 MWs broke down. The three towns are<br />
currently under supplied.<br />
TABLE IV-7:<br />
District<br />
ACCESS TO ELECTRICITY BY URBAN AREAS, BY<br />
DISTRICT, MTWARA REGION 1988<br />
Total<br />
Pop.<br />
Total<br />
Househol<br />
d<br />
Pop<br />
covered<br />
H/Holds<br />
covered<br />
% Pop<br />
covered<br />
%<br />
H/Holds<br />
covered<br />
Mtwara/Mi<br />
kindani<br />
Mtwara<br />
Rural<br />
66,452 15,705 15,451 3,410 23.3 21.7<br />
6,613 1,542 39 9 0.6 0.6<br />
Masasi 26,411 6,289 2,042 440 7.7 7.0<br />
Newala 25,648 5,830 638 122 2.5 2.1<br />
Total 125,12<br />
4<br />
29,366 18,170 3,981 14.5 13.6<br />
Source: 1988 Population census<br />
TABLE IV-8:<br />
ACCESS TO ELECTRICITY BY RURAL AREAS MTWARA<br />
REGION, 1988<br />
Total Population Total h/Holds %<br />
Population<br />
% H/Holds<br />
With Electricity 3,745 285 0.5 0.2<br />
No Electricity 747,064 168,588 99.5 99.8<br />
Not stated 44 9 - -<br />
165
Total 750,853 169,482 100 100<br />
Source: 1988 Population census<br />
Table IV - 7 reveals Mtwara Urban has the best coverage of any urban<br />
centre at 23.3% of population followed by Masasi at 7.7%. The average<br />
for urban areas is 14.5% of population and 13.6% of households have<br />
access to electricity. According to Table IV - 8 in rural areas only 0.5%<br />
of the population or 0.2% of households have electricity.<br />
TABLE IV - 9: ACCESS TO ELECTRICITY MTWARA REGION, 1988<br />
Total<br />
Population<br />
Total<br />
households<br />
% of<br />
population<br />
% of<br />
households<br />
With<br />
21,915 4,266 2.5 2.2<br />
electricity<br />
No electricity 854,018 193,973 97.5 97.8<br />
Not stated - 9 - -<br />
Total 875,933 198,248 100 100<br />
Source: 1988 Population Census<br />
TABLE IV-10<br />
Region<br />
ACCESS TO ELECTRICITY IN SELECTED REGIONS<br />
Number of h/holds with<br />
electricity<br />
% of h/holds with<br />
electricity<br />
Mtwara 4.266 2.2<br />
Shinyanga 8.503 3.0<br />
Iringa 6,032 2.4<br />
Morogoro 16,883 7.4<br />
Source: Shinyanga, Iringa, Morogoro Socio Economic Profiles.<br />
Tables IV-9 and IV-10 shows that the number and proportion of<br />
households with access to electricity in the <strong>region</strong> is low even<br />
compared to some selected <strong>region</strong>s.<br />
166
4.6.2 Fuelwood<br />
The use of firewood in rural areas and charcoal in urban areas is<br />
the traditional way to the preparation of food, heating water etc.<br />
With only 2.2% the <strong>region</strong>'s household gaining access to<br />
electricity, fuelwood is indeed the predominant energy source for<br />
domestic purposes. Intensive and extensive use of fuelwood is<br />
depleting the <strong>region</strong>'s forest slowly but surely.<br />
4.6.3 Other forms of Energy<br />
Fossil fuels are important in that for domestic lighting purposes,<br />
kerosene is the number one source in both rural and urban areas.<br />
Secondly, exploration for natural gas in Msimbati bay could yield<br />
the <strong>region</strong> and its neighbours with an abundant alternative source<br />
of domestic energy. The potential is there, hopefully.<br />
4.7 Land development<br />
TABLE IV-II :<br />
The focus for land development has always been directed to<br />
urban areas where according to the 1988 census only 14.3% of<br />
the <strong>region</strong>al population live. This is a direct consequent of current<br />
land policy which is clear with respect to urban areas only and<br />
secondly, scarcity has created a market for the land in urban<br />
centres. Table IV-11 shows activities undertaken since 1995 to<br />
help along the process of land development in urban areas.<br />
LAND DEVELOPMENT SERVICES FOR URBAN<br />
AREAS, MTWARA REGION 1995/96 AND 1996/97<br />
Services 1995/96 1996/97 TOTAL<br />
167
Townships,<br />
- Town Planning Maps<br />
- Plots<br />
6<br />
785<br />
2<br />
272<br />
8<br />
1057<br />
Surveys<br />
- Plots 138 181 319<br />
Tittle deeds<br />
Evaluation land Property and<br />
houses<br />
- Institutions<br />
- private<br />
140<br />
3<br />
22<br />
Source: Regional Land Development Office, Mtwara, 1997<br />
107<br />
1<br />
13<br />
247<br />
4<br />
35<br />
168
SECTION V<br />
OTHER DEVELOPMENT ISSUES:<br />
5.1 Women in Development:<br />
5.1.1 Women at Household Level:<br />
Mtwara along with its southern neighbour Lindi has a very high<br />
population of women compared to men. In both <strong>region</strong>s there<br />
52.3 women for every 47.7 men; say roughly 52:48. This is high<br />
by <strong>Tanzania</strong> standards. The average women to men ratio is<br />
51:49 for the Mainland. This means women are even more vitally<br />
important for the <strong>economic</strong> and social welfare of Mtwara <strong>region</strong><br />
than many other places in the country. Added to this the majority<br />
of indigenous residents of the <strong>region</strong> are by culture matrilineal.<br />
Such customs place the woman at the centre stage socially.<br />
According to the National Sample Census of Agricultural 1994/95<br />
the proportion of agricultural household which are headed by<br />
females in the <strong>region</strong> is 23.0%. Only the <strong>region</strong>s of Dodoma,<br />
Coast/DSM, Iringa and Singida have higher proportions at<br />
25.5%, 27.8%, 30.2% and 23.2% respectively. In these<br />
households women are exposed to leadership challenges and<br />
consequently to the decision making process they cannot duck.<br />
Mtwara women as producers of wealth, and food for households<br />
are as active in the <strong>region</strong> as their counterparts elsewhere in<br />
<strong>Tanzania</strong>. This means most work in the fields and at home is done<br />
by women. The same Sample Census reported that <strong>Tanzania</strong><br />
women handle:<br />
169
64% of filling<br />
70% of sowing<br />
71% of weeding<br />
73% of harvesting<br />
56% of marketing.<br />
These duties are in addition to searching for fuelwood, fetching<br />
water for the family, cooking and of course child bearing and<br />
rearing.<br />
5.1.2 Women leadership at above household level:<br />
Women like men have to be trained for and exposed to leadership<br />
situations right from childhood if they are to assume positions of<br />
responsibility in society. Recruitment of female children for<br />
primary and secondary education are just two such example.<br />
During this stage equity to men in terms of opportunity is the<br />
guiding principle. See Table V-1.<br />
TABLE V-1:<br />
THE POSITION OF WOMEN TRAINING FOR AND IN<br />
LEADERSHIP IN MTWARA REGION, BY DISTRICT, 1996:<br />
District<br />
Mtwara/M<br />
ikindani<br />
Mtwara<br />
Rural<br />
Masasi Newala* Total<br />
Primary School Enrolment<br />
STD I Female 1,014 1,431 5,119 3,899 11,463<br />
Male 1,051 1,582 4,865 4,044 11,542<br />
Primary School Enrollment<br />
(1995) (Total) Female n.a n.a n.a n.a 65,734<br />
Male n.a n.a n.a n.a 64,664<br />
Pupils Selected for Form I Female 88 57 194 220 559<br />
170
Male 104 56 186 140 486<br />
Secondary School Total<br />
Enrolment (1995): Form I-IV Female n.a n.a n.a n.a 2,016<br />
Male n.a n.a n.a n.a 2,127<br />
Form V - VI Female n.a n.a n.a n.a 67<br />
Male n.a n.a n.a n.a 95<br />
Adult Literacy % 1978<br />
Adult Literacy % 1988<br />
Female<br />
urban<br />
Male<br />
urban<br />
Female<br />
rural<br />
Male<br />
rural<br />
Female<br />
urban<br />
Male<br />
urban<br />
Female<br />
rural<br />
Male<br />
rural<br />
n.a n.a n.a n.a 47.6<br />
n.a n.a n.a n.a 75.4<br />
n.a n.a n.a n.a 38.2<br />
n.a n.a n.a n.a 63.1<br />
n.a n.a n.a n.a 61.6<br />
n.a n.a n.a n.a 77.9<br />
n.a n.a n.a n.a 46.3<br />
n.a n.a n.a n.a 65.5<br />
Primary School Teachers Female 231 111 335 438 1,115<br />
Male 113 471 1,245 1,211 3,040<br />
Secondary School Teachers<br />
(1995)<br />
Female n.a n.a n.a n.a 45<br />
Male n.a n.a n.a n.a 196<br />
District Councillor Female 4 5 10 10 29<br />
Male 13 17 31 51 112<br />
Member of National Assembly Female 0 0 1 0 1<br />
Male 1 1 2 3 7<br />
171
* Includes Tandahimba District.<br />
Source: Basic Statistics in Education, Regional Data, 1995.<br />
Regional Education Office, Mtwara, 1997.<br />
Regional Commissioners office, Mtwara, 1997.<br />
From this table the following facts can be deduced. Recruitment<br />
of pupils into primary schools gives equal opportunities to female<br />
and male children. When it comes to recruitment into Secondary<br />
Schools a deliberate policy of favouring female pupils comes into<br />
play to help reduce existing imbalance. A deliberate effort needs<br />
to be made to increase the adult literacy of women in both rural<br />
and urban areas to bring it to par with that of men. Although a<br />
good start has been made in increasing the number of women in<br />
junior positions e.g. teachers, further efforts are needed to redress<br />
existing inequality. Lastly, the elective process now recognises the<br />
potential women have as district councillor, members of the<br />
National Assembly etc.. but a lot remains to be done to achieve<br />
equity between the sexes.<br />
5.1.3 Gender Issues and the Alleviation of Poverty:<br />
Women especially in rural areas if left on their own are not<br />
capable of having an impact on the issue of redressing the<br />
inequalities between men and women. Committed individuals,<br />
non-governmental organisations, the government itself and others<br />
need to come forward and educate women of all walks of life to<br />
awaken them to take note of these injustices. Since this involves a<br />
change of attitude, it is a slow process. Nevertheless, a start has<br />
to be made.<br />
172
In Mtwara <strong>region</strong> a start has been made. Women are encouraged<br />
to come together in groups. Further, members of these groups<br />
are exposed to discussions in gender equality and equity. Issues<br />
of poverty are discussed also. The end result of membership in<br />
these groups is to prepare the woman to awaken and do<br />
something about these two major concerns. This way then<br />
women start to come forward to contest leadership positions in<br />
society or get involved in income generating activities along with<br />
like minded colleagues. Table V-2 expresses how far the <strong>region</strong><br />
has got in stimulating women towards these causes. Altogether,<br />
there are 459 women groups in <strong>region</strong> with 6,452 members<br />
involved in a variety of income generating activities including<br />
services, production, trading and processing.<br />
TABLE V-2:<br />
District<br />
DISTRIBUTION OF WOMEN INCOME GENERATING GROUPS<br />
BY DISTRICT, MTWARA REGION, MARCH 1997:<br />
Number<br />
of<br />
Groups<br />
Total<br />
Number of<br />
Members<br />
Type of Economic Activity<br />
Mtwara/Mikin<br />
dani<br />
113 1453 Tea rooms, salt processing, bread<br />
baking, rearing goats and cows,<br />
tailoring, porcelain making,<br />
fuelwood trading etc.<br />
Mtwara Rural 52 1225 Flour milling, goat keeping, shop<br />
keeping, tea rooms, farming,<br />
tailoring, hair plaiting, porcelain<br />
making, beekeeping.<br />
Newala 141 1215 Goat and poultry keeping,<br />
beekeeping, farming, hair salons,<br />
tailoring,<br />
cashewnuts<br />
decortication, flour milling, oil<br />
milling.<br />
173
Tandahimba 87 610 Goat rearing, making porcelain<br />
articles, hair salons, tea rooms,<br />
farming.<br />
Masasi 66 1949 Keeping goats, bees, poultry and<br />
fish. sorghum farming, hair salons,<br />
porcelain articles, flour milling, tea<br />
rooms, oil milling.<br />
Total 459 6452<br />
Source: Regional Commissioner's Office, Mtwara, 1997.<br />
Given that the <strong>region</strong> had 219,267 women of 15-44 years in<br />
1996, the number of women now members of the women groups<br />
is very small. It works out at 2.9% of women in this age group.<br />
There are too many potential members now out in the cold.<br />
Some of these groups have gone one step further. They have<br />
taken advantage of group security to obtain loans from various<br />
sources to improve their incomes. With respect to the Women's<br />
Fund 31 groups have so far benefited to the total of T.shs. 11<br />
million in the course of 1995/96. Of this loan T.sh. 4 million has<br />
been paid back leaving a balance of T.sh. 9 million yet to be paid<br />
back as of 31 March 1997. The details are shown in Table V-3.<br />
TABLE V-3:<br />
District<br />
LOANS FROM WOMEN'S FUND TO WOMEN GROUPS, BY<br />
DISTRICT, MTWARA REGION, MARCH 1997:<br />
Number of<br />
groups<br />
benefited<br />
Purpose<br />
Loan<br />
T.Shs.<br />
"000"<br />
Paid Back<br />
December<br />
1996<br />
Balance<br />
to pay<br />
back<br />
"000"<br />
174
Mtwara/Mi<br />
kindani<br />
6 Cattle<br />
keeping (1)<br />
Fuelwood<br />
trading (1)<br />
Tea rooms<br />
(4)<br />
900<br />
580<br />
1,400<br />
-<br />
206.7<br />
930<br />
1,116<br />
413<br />
866<br />
Sub Total 6 2,800 1,136.7 2,395.3<br />
Mtwara<br />
Rural<br />
12 Second<br />
hand clothy<br />
(1)<br />
Charcoal (1)<br />
Shopkeepin<br />
g (1)<br />
Tea rooms<br />
(2)<br />
Farming (6)<br />
Other (1)<br />
250<br />
100<br />
250<br />
500<br />
1,500<br />
250<br />
140<br />
-<br />
180<br />
154<br />
900<br />
-<br />
170<br />
124<br />
130<br />
466<br />
959<br />
310<br />
Sub Total 12 2,850 1,374 2,159<br />
Newala/Ta<br />
ndahimba<br />
2 Farming 2,580 620 2,579.2<br />
Masasi 11 Vegetable<br />
gardening<br />
Tea Rooms<br />
Club<br />
Others<br />
250<br />
1,000<br />
250<br />
1,250<br />
71<br />
452<br />
-<br />
474<br />
239<br />
788<br />
310<br />
1,076<br />
Sub Total 11 2,750 997 2,413<br />
Grand<br />
Total<br />
31 10,980 4,127.7 9,546.5<br />
Source: Regional Commissioner's Office, Mtwara, 1997.<br />
5.2 Environmental Conservation:<br />
175
Mtwara <strong>region</strong> is the most densely populated <strong>region</strong> in the<br />
southern zone. In comparison with its neighbours, population per<br />
sq.km. is as follows for 1996:<br />
Mtwara <strong>region</strong> - 53.2<br />
Lindi <strong>region</strong> - 9.6<br />
Morogoro <strong>region</strong> - 17.0<br />
Ruvuma <strong>region</strong> - 12.0<br />
Iringa <strong>region</strong> - 21.3<br />
Such density inevitably puts a lot of pressure on the environment.<br />
Forests in the <strong>region</strong> are getting depleted as people's demand for<br />
firewood and charcoal increase with each passing year. Demand<br />
for more land to put under the hoe pushes forests further and<br />
further away from settlements and the task of searching and<br />
fetching firewood gets more and more arduous. Uncontrolled<br />
cultivation especially on the Makonde Plateau has lead to erosion<br />
so that the floods in 1990 were rendered more damaging to soils,<br />
vegetation and communications. The search for protein in the<br />
absence of reasonably sized <strong>region</strong>al livestock herd puts pressure<br />
on wildlife. So much so that in recent years wildlife has been<br />
hunted to near extinction. The only wildlife can now be found in<br />
two game reserves totalling a mere 4% of the <strong>region</strong>'s land area.<br />
Population pressure on land has also affected water supplies.<br />
Uncontrolled deforestation especially of vegetation around water<br />
catchment areas and water sources has resulted in the silting of<br />
dams and drying up wells. Twenty three water schemes out of<br />
fifty three constructed between 1970 and 1980 have dried up. It<br />
would appear others are to follow suit.<br />
176
Small scale mining has come to the <strong>region</strong>. This of course, brings<br />
wealth to the <strong>region</strong>. But it has got to be monitored for such<br />
environmental damage like scarring of the countryside and the<br />
pollution of rivers and other water sources.<br />
On the coast, dynamite fishing is on the increase. Dynamite<br />
damage to corals on the continental shelf is more or less<br />
permanent. It is a scenic disaster and destroys the breeding<br />
environment of thousands of useful marine species. Lastly, the<br />
mangrove forest belt also needs looking after to prevent over<br />
exploitation for poles. It is also the breeding ground for prawns.<br />
177
5.3 Tourism:<br />
Although this industry is still undeveloped, it can be transformed<br />
into a significant employment and foreign exchange earning sector.<br />
The <strong>region</strong> has the necessary attractions. The two game reserves<br />
of Msanjesi and Lukwika/Lumesule are rich in such wildlife<br />
species as elephant, lions, leopards, greater kudu, zebra, water<br />
bucks, sable antelopes, wildebeest, impala, buffaloes, wild dogs<br />
and pig types. The Ruvuma river offers hippos and crocodiles.<br />
The <strong>region</strong> also has 125 kms. of coast line where sandy beaches<br />
abound. In addition Msambati bay offers a unique scenic beauty<br />
ideal for photography tourism. The historical moments in<br />
Mikindani offers a glimpse into the past civilization along the coast.<br />
So, the attractions are there what is needed is improvement of<br />
infrastructure such as suitable hotel accommodation, appropriate<br />
transport and communications. Promotion and the provision of<br />
the right entertainment follow automatically once the above are in<br />
place.<br />
Lastly, cultural tourism could be given a try. The rich cultures of<br />
the Makonde, Makua, Yao and others provide opportunities<br />
which could prove appropriate. It should not be forgotten that<br />
Mtwara is the home of the now world, famous "Makonde<br />
Carvings". A lot can be built on that.<br />
178
SECTION VI<br />
POTENTIAL INVESTMENT AREAS:<br />
6.1 Agriculture:<br />
The general trend in food production and some years of food<br />
inadequacies clearly indicates how the performance of agriculture<br />
in the <strong>region</strong> has been below expectations. Production of starch<br />
foods, cassava and sorghum have generally been encouraging but<br />
more could have been done to encourage surplus production of<br />
these two crops. More serious problems in agriculture in the<br />
<strong>region</strong> lie in the very low production of leguminous crops more<br />
specifically pigeon peas and cowpeas. The two are well adapted<br />
to Mtwara conditions. The importance of these pulses in diet<br />
formulation as sources of protein cannot be over emphasized.<br />
Good nutrition status of the expectant mothers depend more on<br />
sufficient intake of protein as the case is with young children. It is<br />
clear that production of these legumes is lagging behind <strong>region</strong>al<br />
requirement.<br />
As a result the <strong>region</strong> has been experiencing protein food scarcity<br />
in most times. This scarcity of legumes could be attributed to<br />
various limitations. It is proposed therefore that the <strong>region</strong> through<br />
its already established district programmes such as Onjama,<br />
Tutumane etc. meant to solve the problem of food in the <strong>region</strong><br />
and to raise the standard of living of the people should give special<br />
campaign on production of these legumes because of their<br />
importance as sources of protein food in the human diet.<br />
179
Rice production in the <strong>region</strong> is contributing between 4-9 percent<br />
out of the total food crops produced. More people in the <strong>region</strong><br />
are becoming consumers of rice as a staple food. However<br />
<strong>region</strong>al production of this crop is very low. Rice has had to be<br />
imported in the <strong>region</strong> to meet the demand. To attain self<br />
sufficiency in rice production in the <strong>region</strong> can only be achieved if<br />
small scale irrigation schemes complement the present production<br />
level.<br />
Mtwara <strong>region</strong>'s economy depends heavily on cashewnut<br />
production. Stabilization of the <strong>region</strong>al economy so as to<br />
increase per capita income depends much on the development of<br />
the cashewnut industry. To do this will depend on the<br />
improvement of old cashewnut trees and the planting of new and<br />
better trees. Hence investment in agricultural production inputs to<br />
improve the existing cashewnut trees and establish new plantations<br />
will stimulate the <strong>region</strong>al economy.<br />
6.2 Livestock:<br />
Given the low livestock population in the <strong>region</strong>, serious planning<br />
and determination by the <strong>region</strong> is needed in investing in this<br />
sector. There is ample room for investment opportunities in<br />
livestock through stocking up with single purpose or dual purpose<br />
cattle for meat and milk. This proposal could best be<br />
implemented and most effectively through the establishment of<br />
cattle ranches in suitable areas in the districts. Livestock<br />
expansion in the <strong>region</strong> must go hand in hand with tsetse fly<br />
control programmes aimed at reducing their number so as to give<br />
cattle greater access to pasture areas.<br />
180
181
6.3 Forestry:<br />
Forest product demand in the <strong>region</strong> is very high compared to<br />
what the <strong>region</strong> is able to supply. This include demand for<br />
fuelwood, timber and building poles. This fact implies that if no<br />
proper actions are taken to control this situation the <strong>region</strong> is<br />
bound to experience environmental destruction. The <strong>region</strong> is<br />
therefore faced with the challenge of finding a balance between the<br />
exploitation of the forest resources and their replacement.<br />
Management plans for forest resources in every district should be<br />
formulated to provide guidance required to keep exploitation<br />
within sustainable limits. Afforestation needs to go hand in hand<br />
with forest utilization.<br />
6.4 Beekeeping:<br />
Beekeeping being a tradition in Mtwara <strong>region</strong> has proved to be<br />
the kind of industry that lends itself well to self employment. More<br />
peasant farmers should be encouraged, motivated and trained for<br />
profitable beekeeping.<br />
Market research for the honey and beeswax products should<br />
be carried out in an effort to provide easy access to markets by<br />
the beekeeping households. Proper processing could be the<br />
bottleneck.<br />
6.5 Mining:<br />
182
Full mineral exploitation in Mtwara <strong>region</strong> has not been achieved<br />
as yet. Availability of full information on mineral status through<br />
proper exploration is a prerequisite. Investors in the mine sector<br />
cannot afford to over gamble. Availability of a certain level of<br />
reliable data on deposits is paramount. For this reason, in order<br />
for the <strong>region</strong> to attract investors in this sector indicative<br />
exploration needs to be carried out soonest.<br />
6.6 Industrial Development:<br />
The privatisation of cashewnut processing factories is a logical<br />
step following the wind of change from public entrepreneurship to<br />
private enterprise. The raw material is there and the market for<br />
processed nuts is good. A search for the right technology could<br />
all that is required to make cashewnut processing on factory scale<br />
profitable. Other agro-based industries such as oil milling and<br />
flour milling are suitable areas of investment especially at village<br />
level to encourage income generation and lighten the burden on<br />
women. Now that gemstone mining is gaining importance<br />
mechanisation of the mining process opens a new venue for<br />
industrialisation.<br />
6.7 Transport:<br />
Road development especially the development of a national road<br />
highway connecting the <strong>region</strong>s of Lindi and Mtwara to the capital<br />
Dar-es-Salaam is perhaps the most felt need of the southern zone.<br />
Second to this priority is the upgrading of the whole road system.<br />
Tarmac could be better, gravel roads should be extended. Earth<br />
roads should progressively be transformed to gravel standard. As<br />
183
it is now, all earth surfaced roads are impassable during the rainy<br />
season which means for 50% of the year. Road density is<br />
adequate but road quality is appalling. This jeopardises the<br />
movement of farm produce, goods, people and services between<br />
different points in the <strong>region</strong>.<br />
For the future, the development another highway to Lake Nyasa<br />
could connect up Malawi with the Mtwara port which latter is<br />
currently grossly underutilised. The construction of a bridge<br />
connecting <strong>Tanzania</strong> and Mozambique at Nengomano<br />
(Mozambique) and Mtambaswala/Masunguru (<strong>Tanzania</strong>) needs<br />
capital to open up the big potential for trade between these two<br />
countries. Investment in ferries along the Ruvuma river especial<br />
the Kilambo (<strong>Tanzania</strong>)/Namoto (Mozambique) and Maparawe<br />
(<strong>Tanzania</strong>)/Namatili (Mozambique) crossing could also boost the<br />
commercial links.<br />
6.8 Energy:<br />
The supply of electricity is much below demand. Further<br />
investment in needed to boost up the supply of electricity if the<br />
<strong>region</strong> is to attract industries and provide enough power for water<br />
supplies and other domestic needs. In the long run Mtwara and<br />
Lindi <strong>region</strong>s have to be connected to the National Grid to solve<br />
the <strong>region</strong>s' long term energy problems. The existence of gas<br />
deposits at Songo Songo in Lindi <strong>region</strong> could provide the<br />
opportunity.<br />
Oil exploration could be extended to Mtwara <strong>region</strong> especially the<br />
Msimbati bay area.<br />
184
6.9 Health:<br />
The health sector is already open for private investment. A start<br />
has been made but the pace is very slow compared to other areas<br />
in the country. In the long run this country's delivery of health care<br />
will be predominantly in the private sector. Hence, individuals,<br />
NGO's, companies and other private sector organisations are<br />
welcome to invest in the establishment and running of clinics,<br />
dispensaries, health centres and hospitals in the <strong>region</strong>. Other<br />
investment areas in the health sector are:<br />
- The training of health personnel to boost the number of<br />
trained personnel or even short courses to improve<br />
productivity of existing personnel.<br />
- The supply of drugs, vaccines, equipment and other<br />
medical supplies in order to improve the quality of medical<br />
care and so contain health problems. This is the area<br />
where even the small investor or donor can provide what<br />
little there is to give.<br />
- Technical assistance is vital particularly in the initial stages<br />
of privatisation or establishment of a major health facility<br />
or health care system.<br />
The containment of AIDS and HIV infection is a task for every<br />
one. The problem is gaining ground in Mtwara <strong>region</strong>. Health<br />
education and other preventive measures are desperately required<br />
185
now. Well wishers are welcome to play their part alongside<br />
others already on the front line.<br />
Parallel to AIDS are STDs. The <strong>region</strong> has a higher than normal<br />
level of infection of STDs. An easy access to appropriate drugs<br />
administered by qualified personnel could also have a positive<br />
impact on HIV infection. The supply of STD drugs at affordable<br />
prices or even the establishment of STD treatment centres in each<br />
ward could be the answer.<br />
6.10 Education:<br />
Like health, investment in the education sector at all levels from<br />
pre-school education to University is now open to all well wishers.<br />
There is still quite a significant portion of children of school going<br />
age who are not going to school because of distances and the<br />
quality of primary education. The average for Mtwara of the<br />
number of pupils per 1,000 population is 140 only. This means<br />
up to 100 children per 1,000 population are not going to school.<br />
The enrolment at secondary level is very, very low. Vocational<br />
training centres for youths are virtually non existent. The number<br />
and quality of primary school teachers is unsatisfactory. So there<br />
is indeed a very large area in education for an investor to choose<br />
from. The quality of primary and secondary education is low.<br />
Even assistance to existing establishment in terms of infrastructure<br />
or teaching materials will have impact in raising the standard of<br />
education.<br />
6.11 Water Supply:<br />
186
Supply against demand for safe water is quite low for both urban<br />
and rural areas. It is about 40% for rural areas and 51% for<br />
towns. The giant Makonde Plateau Water Supply system is ailing<br />
through aging pipes, equipment and a shortage of electricity. So<br />
there is little hope of raising the supply of safe water unless new<br />
investment in terms of pipes and equipment for existing piped<br />
systems and pumping equipment for deep holes and shallow wells<br />
is forthcoming. Better still investment in the development of new<br />
water systems to supplement existing' systems would do a lot of<br />
good.<br />
Shallow wells lend themselves very well for assistance even by the<br />
smaller investor.<br />
Sanitation and sewerage is critical in urban areas because of<br />
overcrowding. A look at all Mtwara towns would reveal that all<br />
are in need of investment in the field of planned central disposal of<br />
water run off and domestic sewerage.<br />
6.12 Environmental Protection:<br />
Like elsewhere in <strong>Tanzania</strong> the forest resources of Mtwara <strong>region</strong><br />
are taking a beating from demand for fuel by an increasing<br />
population. Given that Mtwara even by <strong>Tanzania</strong> standards is one<br />
of the more heavily populated <strong>region</strong>s, this pressure on the forests<br />
is more than normally damaging. Investment in afforestation is the<br />
most feasible alternative to the real threat of desertification.<br />
Increasing the access to electricity by the population can relieve<br />
some pressure on the forests. With regard to dynamite fishing<br />
damage to the coral reefs, a vigorous law enforcement regime is<br />
187
the only answer, tempered by public education backed by patrol<br />
boats.<br />
6.13 Women Development:<br />
Though a start has been made further efforts are called for to<br />
increase awareness among the <strong>region</strong>'s women population<br />
regarding gender issues and poverty alleviation. This can only be<br />
done by investment in more women groups to reach more women.<br />
The use of income generation as a motivation tool means further<br />
and more loans and training to women.<br />
6.14 Tourism and Wildlife:<br />
For optimum effect tourism and wildlife development go hand in<br />
hand. Investment in wildlife protection benefits the tourism<br />
industry. On the other hand a booming tourist trade is ample<br />
justification for wildlife protection. Mtwara <strong>region</strong> has the<br />
attractions of two wildlife rich game reserves, virgin beaches on a<br />
125 km. coast line, scenic Msimbati bay and the Mikindani<br />
historical monuments. But it needs investment in hotel<br />
accommodation, transport and access roads of acceptable<br />
standard. Cultural Tourism is another potential area for<br />
investment.<br />
188
ANNEX A<br />
MTWARA REGION IN A NUTSHELL<br />
1.0 GENERAL:<br />
1.1 Location:<br />
Southern most part of <strong>Tanzania</strong> between longitudes 38 o and<br />
40 o 30" east Greenwich, latitudes 10 o 05" and 11 o 25" south<br />
of the Equator.<br />
1.2 Land Frontiers:<br />
North - Lindi Region<br />
East - Indian Ocean<br />
South - Mozambique<br />
West - Ruvuma Region<br />
1.3 Land Area:<br />
Land area 16,720 sq. kms. or 1.9% of <strong>Tanzania</strong> Mainland.<br />
Smallest <strong>region</strong> of <strong>Tanzania</strong> Mainland after Kilimanjaro.<br />
Some minor lakes.<br />
1.4 Administrative Units:<br />
- 5 districts of Mtwara/Mikindani Urban, Mtwara<br />
Rural, Masasi, Newala, Tandahimba.<br />
- 21 divisions<br />
- 98 wards<br />
- 554 villages.<br />
189
190
1.5 Population:<br />
(a)<br />
Population 1988 Census<br />
Total = 875,977<br />
Sex ratio = 91.9<br />
Growth rate = 1.4%<br />
Population density = 52.4 per sq. km.<br />
Average household size = 4.4<br />
Net lifetime Migration = -98,689<br />
Urbanization = 14.3%<br />
(b)<br />
Population Projections<br />
1996 A.D. 2000 A.D.<br />
Total = 1,005,405 1,078,848<br />
Density = 60.1/km 2 64.5/km 2<br />
(c)<br />
Other Censuses<br />
1.6 Ethnicity:<br />
1978 - Total Population: 771,818<br />
1967 - Total Population: 621,293<br />
Bantu groups indigenous to area:<br />
Makonde = Newala, Tandahimba, Masasi and<br />
Mtwara Rural.<br />
Makua = Masasi and Mtwara Rural.<br />
Yao = Masasi.<br />
191
1.7 Climate:<br />
Rainfall November/December to April/May. Single peaked<br />
in January. 830 mm. to 1120 mm per annum rising with<br />
elevation. Temperatures moderated by Indian Ocean.<br />
High of 27 o C at Coast in December down to 23 o C in July.<br />
1.8 Agro-Ecological Zones:<br />
Zone I: South half of Mtwara Rural and South-East of<br />
Newala<br />
1000 mm rainfall. Monomodal. 6 months<br />
growing season. Low altitude, Soils of low<br />
fertility.<br />
Zone II:<br />
North half of Mtwara Rural<br />
600 mm. rainfall. Monomodal. 6 months<br />
growing season. Mid altitude. Soils of low<br />
fertility but with medium moisture retaining<br />
capacity.<br />
Zone III:<br />
The Whole of Masasi (except northern<br />
part) North and West parts of Newala<br />
600 mm to 1000 mm. rainfall. Monomodal.<br />
5 months growing season. Low altitude.<br />
Soils of low fertility.<br />
Zone IV:<br />
The South - East of Mtwara Rural<br />
192
Over 600 mm rainfall. Bimodal. 7 months<br />
growing season. Low altitude. Soils of<br />
high fertility and alluvial origin.<br />
2.0 ECONOMIC INFRASTRUCTURE:<br />
2.1 Roads:<br />
= 5,596 kms: 135 kms. tarmac, 60 kms gravel and 5401 kms<br />
earth<br />
= Road density: 0.335 km/km 2 .<br />
= Seasonal.<br />
2.2 Airservices:<br />
= Major airport at Mtwara capable Boeing 737 commercial<br />
traffic.<br />
= One other airport at Masasi and an airstrip at Newala.<br />
2.3 Marine Transport:<br />
= One major port with deep water berths, capable of<br />
400,000 tons per year.<br />
= Regular boat services to Dar-es-Salaam of doubtful<br />
reliability.<br />
2.4 Electricity (1988):<br />
Urban areas: Coverage 18,170 people of 14.5% of urban<br />
population.<br />
Rural areas: Coverage 3,745 people or 0.5% of rural<br />
population.<br />
3.0 BASIC SOCIAL FACILITIES<br />
193
3.1 Health 1996<br />
Hospital: 3 public 1 Private Total 4<br />
Health Centres: 12 public 2 private Total 14<br />
Dispensaries: 108 public 18 private Total 126.<br />
MCH Clinics: 133 all public.<br />
3.2 Education (1996):<br />
Pre-Schools Number:<br />
Enrolment:<br />
117 all private<br />
2,922 boys<br />
2,996 girls<br />
5,918 total.<br />
Primary Schools Number: 493<br />
Enrolment: 141,167<br />
Secondary Schools Number: 13<br />
Enrolment: I-IV: 4,143<br />
V-VI: 162<br />
3.3. Water:<br />
(a)<br />
(b)<br />
Rural Water Supplies<br />
Working Not working Total<br />
Piped Systems 4 16 20<br />
Makonde Plateau<br />
System for Newala 40% 60% 100%<br />
and Tandahimba.<br />
Bore holes 19 26 45<br />
Shallow Wells 621 284 905<br />
Dams 4 2 6<br />
Urban Water Supplies<br />
Bore holes 14 - 14<br />
194
Shallow Wells 50 - 50<br />
Springs 3 -<br />
Dams 1 -<br />
3<br />
1<br />
195
4.0 PRODUCTIVE SECTOR FACILITIES<br />
4.1 Agriculture (1996)<br />
600,000 ha. arable land<br />
270,300 ha. under cultivation.<br />
4.2 Livestock<br />
a) Livestock Units (1994)<br />
Cattle = 19,700<br />
goats/sheep = 164,000<br />
Pigs = 6,000<br />
Poultry = 3.2 million<br />
b) Livestock facilities (1985)<br />
= 30 dips<br />
= 20 crushes<br />
= 1 livestock research centre<br />
5.0 SELECTED SOCIAL/ECONOMIC/INDICATORS (1996)<br />
5.1 Education (Primary)<br />
Population 2,039<br />
Pupils per 1,000 population 140<br />
Pupils per school 286<br />
Pupils per classroom 48<br />
Pupils per teacher 35<br />
Pupils per stream 33<br />
% shortage of teacher to requirements 13<br />
% shortage of teacher homes to<br />
requirements 87<br />
% shortage of school toilets to<br />
requirements 91<br />
196
% shortage of classrooms to<br />
requirements 68<br />
5.2 Education (Secondary)<br />
Population per school 76,256<br />
Pupils per 10,000 people<br />
"O" level 42.0<br />
"A" level 1.6<br />
Pupils per teacher<br />
Public schools 16<br />
Private schools 29<br />
5.3 Adult literacy<br />
1967 28%<br />
1978 51.4%<br />
1988 57.1%<br />
5.4 Health<br />
a) Facilities<br />
Population per hospital 251,351<br />
Population per dispensary 7,979<br />
Population per hospital bed 690<br />
Population per facility 6,982<br />
Facilities per 10,000 people 1.7<br />
b) Services<br />
< 1 Child Immunisation Coverage<br />
BCG = 88.3%<br />
DTP 3 = 82.2%<br />
Polio 3 = 83.1%<br />
Measles = 83.5%<br />
< 5 Child Immunisation Coverage: 68.2%<br />
Two or more T.T. vaccinations for women 39.8%<br />
197
c) Basic Indicators<br />
Infant Mortality Rate (IMR)<br />
1978 161<br />
1988 138<br />
1995 (Est) 119<br />
1988 IMR<br />
Rural 143<br />
Urban 108<br />
Male 141<br />
Female 134<br />
Underfive Mortality Rate (U5MR)<br />
1978 269<br />
1988 233<br />
1995 (Est) 202<br />
1988 U5MR<br />
Rural 241<br />
Urban 180<br />
Male 238<br />
Female 227<br />
Maternal Mortality Rate (MMR)<br />
1992 264<br />
1993 212<br />
1994 161<br />
1995 252<br />
Life Expectancy<br />
1978 male 40 years<br />
1978 female 46 years<br />
1988 male 45 years<br />
1988 female 48 years<br />
Aacquired Immunity Defficiency Syndrom (AIDS)<br />
198
Rate of AIDS per 100,000 population = 242<br />
5.5 Water<br />
Supply of safe water against demand:<br />
Rural areas<br />
Mtwara Rural district 44%<br />
Masasi district 41%<br />
Newala/Tandahimba district 40%<br />
Urban areas<br />
Mtwara town 56%<br />
Mikindani town 27%<br />
Masasi town 45%<br />
Newala town 25%<br />
Regional Total 49%<br />
5.6 Sanitation (1988)<br />
Population covered with toilet facilities:<br />
Rural Areas = 88.1%<br />
Urban Areas = 94.4%<br />
Regional average = 89.0%<br />
5.7 Regional Economy<br />
a) Regional GDP at current Prices (Millions)<br />
Tshs. US$<br />
1980 1,099 134<br />
1985 2,890 175<br />
1990 22,975 117<br />
1994 62,491 113<br />
b) Regional GDP per Capita (Current Prices)<br />
Tshs. US$<br />
1980 1,385 168<br />
1985 3,397 206<br />
199
1990 24,481 124<br />
1994 59,533 108<br />
6.0 OTHER ISSUES<br />
a) Women Income Generation/Gender Issue<br />
Groups<br />
Groups 459<br />
Members 6,452<br />
b) Youth <strong>economic</strong> groups<br />
Groups 94<br />
c) Tourist attractions<br />
= Msanjesi Game Reserve<br />
= Lukwika/Lumesule Game Reserve<br />
= Ruvuma River<br />
= 125 kms. coast line<br />
= Msimbati bay<br />
= Mikindani Historical Monuments.<br />
200
ANNEX B<br />
MTWARA/MIKINDANI DISTRICT SUMMARY (1996)<br />
1.0 GENERAL:<br />
1.1 Location/Borders<br />
An eastern enclave on Indian Ocean Coast.<br />
North and East - Indian Ocean<br />
West, South, North - Mtwara Rural.<br />
1.2 Land Area<br />
Land = 163 sq. kms.<br />
= No large water body.<br />
= 1.0% <strong>region</strong>al land area.<br />
1.3 Administrative Units<br />
Division = 2<br />
Wards = 13<br />
Villages = 6<br />
1.4 Population<br />
(a) Population 1988 Census<br />
Total = 75,857<br />
Sex Ratio = 103.8<br />
Growth rate = See Mtwara Rural<br />
Population density = 745.1/km 2<br />
% Urban Population = 87.6<br />
Average household size:<br />
Urban = 4.2<br />
Rural = 4.5<br />
District = 4.3<br />
201
(b)<br />
Population Projections<br />
1996 A.D. 2000 A.D.<br />
Total 103,815 121,449<br />
Density 636.9/Km 2 745.1/km 2<br />
(c)<br />
Other Census<br />
1967 1978<br />
Total Population = 48,491<br />
Growth Rate 1967/78 (See Mtwara Rural)<br />
Sex Ratio = 102.8<br />
% Urban Population = 100<br />
1.5 Ethnicity (indigenous)<br />
Bantu mainly but mixed including Makonde, Makua and<br />
Yao.<br />
2.0 ECONOMIC INFRASTRUCTURE:<br />
(a)<br />
(b)<br />
Roads<br />
See Mtwara Rural District.<br />
Marine/Air Transport Services<br />
One major Marine port<br />
One major Air port<br />
One minor port at Mikindani<br />
(c) Electricity (1988)<br />
Access to Electricity:<br />
Households = 21.7%<br />
Population = 23.3%<br />
202
3.0 BASIC SOCIAL FACILITIES:<br />
3.1 Health<br />
Hospitals = 1<br />
Health Centres = Nil<br />
Dispensaries = 17<br />
MCH Clinics = 11<br />
3.2 Education<br />
Pre-Schools<br />
Number = 10<br />
Total emolment = 467<br />
Primary Schools<br />
Number = 19<br />
Total emolment = 10,461<br />
3.3 Water<br />
Urban Water Supplies<br />
9 deep wells<br />
1 spring.<br />
4.0 SELECTED SOCIAL/ECONOMIC INDICATORS<br />
4.1 Education (Primary)<br />
Population per school : 5,464<br />
Pupils per 1000 population : 101<br />
Pupils per school : 551<br />
Pupils per classroom : 64<br />
Pupils per stream : 43<br />
Pupils per teacher : 31<br />
% Surplus of teachers to requirements: 6<br />
% Shortage of teacher houses to requirements: 90<br />
% Shortage of classrooms to requirements: 28<br />
4.2 Health<br />
203
(a)<br />
(b)<br />
Facilities<br />
Population per dispensary 6,107<br />
Population per facility 5,768<br />
Facilities per 10,000 people 1.7<br />
Services<br />
Under One Children Immunisation Coverage<br />
BCG = 76.6%<br />
DPT3 = 69.3%<br />
Polio 3 = 70.0%<br />
Measles = 71.6%<br />
Under Five Children Immunisation Coverage = 52.7%<br />
Two or more T.T. Vaccinations for Women = 24.4%<br />
4.3 Water<br />
Supply of water against demand<br />
Mtwara town = 56%<br />
Mikindani town = 27%<br />
4.4. Sanitation<br />
Population Covered by Toilet Facilities (1988)<br />
Rural areas = 84.2%<br />
Urban areas = 92.3%<br />
District average = 91.3%<br />
5.0 OTHER ISSUES:<br />
(a) Women Groups<br />
Number = 113<br />
Members = 1,453<br />
(b)<br />
(c)<br />
Youth Groups<br />
Number = 14<br />
Tourist Attractions<br />
204
= Msimbati bay<br />
= Mikindani Historical Monuments<br />
= Coast Line.<br />
205
ANNEX C<br />
MTWARA RURAL DISTRICT SUMMARY (1996)<br />
1.0 GENERAL<br />
1.1 Location/borders<br />
Eastern part of the <strong>region</strong><br />
North - Lindi <strong>region</strong><br />
East - Indian Ocean<br />
- Mtwara/Mikindani district<br />
South - Ruvuma River/Mozambique<br />
West - Newala district.<br />
1.2 Land Area<br />
Land = 3,597 sq.kms.<br />
= No large water body<br />
= 21.5% <strong>region</strong>al land area.<br />
1.3 Administrative Units<br />
Divisions = 6<br />
Wards = 17<br />
Villages = 101<br />
1.4 Population<br />
(a) Population 1988 Census<br />
Total = 168,189<br />
Sex Ratio = 91.4<br />
Growth Rate = 2.4%(includes Mtwara/Mikindani)<br />
Population density = 56.6/km 2<br />
% Urban population = 3.9<br />
Average household size<br />
Urban = 4.3<br />
Rural = 4.5<br />
206
(b)<br />
(c)<br />
District = 4.5<br />
Population Projections<br />
1996 A.D. 2000 A.D<br />
Total 190.962 203,480<br />
Density 53.1/km 2 56.6/km 2<br />
Other Censuses<br />
1967 1978<br />
Total Population = 144,033<br />
Growth Rate 67/78 (Includes Mtwara/<br />
Mikindani) = 2.2%<br />
Sex Ratio = 94.8<br />
% Urban Population = 0.0%<br />
1.5 Ethnicity (indigenous)<br />
Bantu mainly : Makonde and Makua.<br />
2.0 ECONOMIC INFRASTRUCTURE<br />
(a)<br />
(b)<br />
Roads (Includes Mtwara/Mikindani)<br />
53 kms Tarmac<br />
20 kms Gravel<br />
880 kms Earth<br />
953 kms Total<br />
Road density - 0.253 km/km 2 .<br />
Marine/Air Transport Services<br />
None<br />
(c) Electricity (1988)<br />
Access to electricity:<br />
Households - 0.6%<br />
Population - 0.6%<br />
207
208
3.0 BASIC SOCIAL FACILITIES<br />
3.1 Health<br />
Hospitals - Nil<br />
Health Centres - 4<br />
dispensaries - 28<br />
MCH clinics - 33<br />
3.2 Education<br />
Pre-Schools<br />
Number - 20<br />
Total enrolment - 1004<br />
Primary Schools<br />
number - 82<br />
total enrolment - 19,785<br />
3.3. Water<br />
Rural Water Supplies<br />
Working notworking Total<br />
Piped Systems 4 16 20<br />
Bore Holes 19 26 45<br />
Shallow wells 206 134 340<br />
4.0 PRODUCTIVE SECTOR FACILITIES<br />
Livestock Units (1985) includes Mtwara/Mikindani<br />
cattle - 2,820<br />
Goats - 14,919<br />
Sheep - 3,382<br />
Pigs - 151<br />
Poultry - 106,000<br />
209
5.0 SELECTED SOCIAL/ECONOMIC INDICATORS<br />
5.1 Education (Primary)<br />
Poppulation per school : 2,329<br />
Pupils per 100 population : 104<br />
Pupils per school : 241<br />
Pupils per classroom : 45<br />
Pupils per stream : 33<br />
Pupils per teacher : 35<br />
% shortage of teachers to requirements : 5<br />
% shortage of teacher houses to requirements 90<br />
% shortage of classrooms to requirements: 59<br />
5.2 Health<br />
a) Facilities<br />
Popualtion per dispensary: 6,820<br />
Population per facility 5,968<br />
Facilities per 10,000 people 1.7<br />
b) Services<br />
Under one children immunisation coverage<br />
BCG - 90<br />
DPT3 - 73.1%<br />
PORIO - 76.2%<br />
Measles - 71.5%<br />
Under five children Immunization Coverage 56.6%<br />
Two or more T.T. Vaccinations for women 26.2%<br />
5.3 Water<br />
Supply of water against demand<br />
Mtwara rural district 44%<br />
210
5.4 Sanitation<br />
Population covered by toilet facilities (1988)<br />
Rural areas = 77.6%<br />
Urban areas = 96.4%<br />
District average = 78.4%<br />
6.0 OTHER ISSUES<br />
(a)<br />
(b)<br />
(c)<br />
Women groups<br />
Number = 52<br />
Members = 1,225<br />
Youth groups<br />
Number = 22<br />
Tourist Attractions<br />
= Ruvuma River<br />
= Coast line.<br />
211
1.0 GENERAL<br />
ANNEX D<br />
NEWALA DISTRICT SUMMARY<br />
(Including Tandahimba 1996)<br />
1.1 Location/Borders<br />
Middle of the <strong>region</strong>:<br />
North East - Lindi Region<br />
North West - Masasi District<br />
East - Mtwara Rural District<br />
South - Ruvuma River/Mozambique<br />
West - Masasi District.<br />
1.2 Land Area<br />
Land = 4,020 sq. kms.<br />
= No large water body<br />
= 24.0% of <strong>region</strong>al land area.<br />
1.3 Administrative Units<br />
Division = 6<br />
Wards = 38<br />
Villages = 233<br />
1.4 Population<br />
(a)<br />
Population 1988 Census<br />
Total = 301,247<br />
Sex Ratio = 85.5<br />
Growth Rate = 1.0%<br />
Population density = 74.9/km 2<br />
212
% Urban population = 8.5<br />
Average household size<br />
Urban = 4.4<br />
Rural = 4.5<br />
District = 4.5<br />
(b)<br />
(c)<br />
Population Projections<br />
1996 A.D. 2000 A.D.<br />
Total 326,207 339,439<br />
Density 81.1/km 2 84.4/km 2<br />
Other Censuses<br />
1967 1978<br />
Total Population = 307,385<br />
Growth Rate 67/68 = 1.1<br />
Sex Ratio = 94.8<br />
%Urban Population = 10.0<br />
1.5 Ethnicity (indigenous):<br />
Bantu mainly: Makonde.<br />
2.0 ECONOMIC INFRASTRUCTURE<br />
(a) Roads<br />
1.5 kms Tarmac<br />
1081 kms Earth<br />
1082.5 kms Total<br />
Road density = 0.269 kms/km 2<br />
(b)<br />
Marine/Air Transport Services<br />
One airstrip.<br />
(c) Electricity (1988)<br />
213
Access to electricity<br />
Households = 2.1%<br />
Population = 2.5%<br />
3.0 BASIC SOCIAL FACILITIES<br />
3.1 Health<br />
Hospitals = 1<br />
Health Centres = 6<br />
Dispensaries = 39<br />
MCH Clinics = 46<br />
3.2 Education<br />
Pre-Schools<br />
Number = 50<br />
Total enrolment = 2,093<br />
Primary Schools<br />
Number = 199<br />
Total emolment = 49,348<br />
3.3 Water<br />
Both rural and urban areas supplied from electricity<br />
powered Makonde Plateau Water Supply system.<br />
4.0 PRODUCTIVE SECTOR FACILITIES<br />
Livestock Units (1985)<br />
Cattle = 2,621<br />
Goats = 67,947<br />
Sheep = 2,346<br />
Pigs = 186<br />
214
Poultry 1.2 million<br />
215
5.0 SELECTED SOCIAL/ECONOMIC INDICATORS<br />
5.1 Education (Primary)<br />
Population per school - 1,639<br />
Pupils per 1,000 population - 151<br />
Pupils per school - 248<br />
Pupils per classroom - 64<br />
Pupils per stream - 32<br />
Pupils per teacher - 31<br />
% shortage of teachers to requirement :4<br />
% shortage teacher houses to requirements :81<br />
% shortage of classrooms to requirements :78<br />
5.2 Health<br />
a) Facilities<br />
Population per dispensary : 8,364<br />
Population per facility : 7,091<br />
Facilities per 10,000 people : 1.4<br />
b) Services<br />
Under one children Immunization Coverage<br />
BCG - 85.6%<br />
DPT3 - 97.0%<br />
Polio3 - 96.2%<br />
Measles 97.2%<br />
Under five children Immunization Coverage - 51.8%<br />
Two or more T.T. vaccination for women -<br />
5<br />
7<br />
.<br />
7<br />
%<br />
216
5.3 Water<br />
Supply of water against demand<br />
rural areas - 40%<br />
Newala town - 25%<br />
5.4 Sanitation<br />
Population covered by toilet facilities (1988)<br />
rural areas - 92.9%<br />
urban areas - 96.4%<br />
District average 93.2%<br />
6.0 OTHER ISSUES<br />
a) Women Groups<br />
member - 228<br />
members - 1,825<br />
b) Youth groups<br />
number - 30<br />
c) Tourist Attractions<br />
Ruvuma river<br />
217
ANNEX E<br />
MASASI DISTRICT SUMMARY<br />
1.0 GENERAL<br />
1.1. Location/borders<br />
Western area of the <strong>region</strong><br />
North-Lindi <strong>region</strong><br />
East-newala district<br />
South-Ruvuma River/Mozambique<br />
West-Ruvuma <strong>region</strong><br />
1.2 Land Area<br />
Land - 8,940 sq km<br />
- no large water body<br />
- 53.5 of <strong>region</strong>al land area<br />
1.3 Administrative Units<br />
Divisions - 7<br />
Wards - 30<br />
Villages - 214<br />
1.4 Population<br />
Population 1988 Census<br />
Total - 330,684<br />
Sex Ratio 93.6<br />
Population density 46.4 /km 2 .<br />
% urban population 8.0<br />
Average household size<br />
Urban - 4.2<br />
Rural - 4.3<br />
District - 4.3<br />
218
) Population projections<br />
1996 A.D. 2000 A.D.<br />
Total 384,421 414,480<br />
Density 43.0 / km 2 46.4/km 2<br />
(c)<br />
Other Censuses<br />
1967 1978<br />
Total Population = 271,909<br />
Growth Rate 67/78 = 2.2%<br />
Sex Ratio = 95.4<br />
% Urban Population = 4.8<br />
1.5 Ethnicity (indigenous)<br />
Bantu mainly: Makua and Yao.<br />
2.0 ECONOMIC INFRASTRUCTURE:<br />
(a)<br />
(b)<br />
Roads<br />
80 kms Tarmac<br />
40 kms Gravel<br />
3,440 kms Earth<br />
3,560 kms. Total<br />
Road density = 0.398 kms/km 2<br />
Marine/Air Transport Services<br />
One air port.<br />
(c) Electricity (1988)<br />
Access to electricity:<br />
Households = 7.0%<br />
Population = 7.7%<br />
219
3.0 BASIC SOCIAL FACILITIES:<br />
3.1 Health<br />
Hospitals = 2<br />
Health Centres = 4<br />
Dispensaries = 42<br />
MCH Clinics = 43<br />
3.2 Education<br />
3.3 Water<br />
Pre-Schools<br />
Number = 37<br />
Total enrolment = 2,354<br />
Primary Schools<br />
Number = 193<br />
Total enrolment = 61,573<br />
(a)<br />
Rural Water Supplies<br />
Working Not Working Total<br />
Piped systems - - -<br />
Boreholes - - -<br />
Shallow wells 415 150 565<br />
Dams - - -<br />
(b)<br />
Urban Water Supplies (Masasi town)<br />
1 Dam<br />
5 Deep wells<br />
50 Shallow wells.<br />
220
221
4.0 PRODUCTIVE SECTOR FACILITIES<br />
Livestock Units (1985)<br />
Cattle = 9,022<br />
Goats = 4,598<br />
Sheep = 7,746<br />
Pigs = 4,252<br />
Poultry = 1.3 million.<br />
5.0 SELECTED SOCIAL/ECONOMIC INDICATORS<br />
5.1 Education (Primary)<br />
Population per school: 1,992<br />
Pupils per 1000 population: 160<br />
Pupils per school: 319<br />
Pupils per classroom: 53<br />
Pupils per stream: 33<br />
Pupils per teacher: 39<br />
% Shortage of teachers to requirements: 13<br />
% Shortage of teacher houses to requirements: 92<br />
% Shortage of classrooms to requirements: 68<br />
5.2 Health:<br />
a) Facilities<br />
Population per dispensary: 9,153<br />
Population per facility: 8,009<br />
Facility per 10,000 people: 1.2<br />
(b)<br />
Services<br />
Under One Children Immunisation Coverage<br />
BCG = 91.6%<br />
DPT3 = 78.0%<br />
Polio 3 = 80.0%<br />
Measles = 81.2%<br />
222
Under Five Children Immunisation Coverage = 90.5%<br />
Two or More T.T. Vaccinations for Women = 35.7%<br />
5.3 Water:<br />
Supply of water against demand.<br />
Rural areas: 41%<br />
Masasi town: 45%<br />
5.4 Sanitation:<br />
Population Coverage by toilet facilities (1988)<br />
Rural areas = 89.5%<br />
Urban areas = 96.9%<br />
District average = 90.1%<br />
6.0 OTHER ISSUES:<br />
(a)<br />
(b)<br />
(c)<br />
Women groups<br />
Number = 66<br />
Members = 1,949<br />
Youth groups<br />
Number = 28<br />
Tourist Attractions<br />
= Msanje Game Reserve<br />
= Lukwika/Lumesule Game Reserve<br />
= Ruvuma river.<br />
223
ANNEX H<br />
1.0 GENERAL INFORMATION ABOUT TANZANIA<br />
Location: (29 0 E-41 0 ; 1 0 S - 12 0 S)<br />
Land Frontiers:<br />
To the North:<br />
To West:<br />
To South:<br />
To East:<br />
Kenya and Uganda<br />
Burundi, Rwanda and Zaire<br />
Zambia, Malawi and Mozambique<br />
Indian Ocean<br />
AREA OF MAINLAND<br />
Land area<br />
881,289 Sq.Km.<br />
Water area (Inland) 61,495 Sq.Km.<br />
<strong>Tanzania</strong> area 942,784 Sq.Km.<br />
TANZANIA MAINLAND AREA BY REGIONS (SQ KM)<br />
Total 942,784<br />
Arusha 84,567 Morogoro 70,799<br />
Coast 32,407 Mwanza 35,248<br />
Dodoma 41,311 Lindi 66,046<br />
Iringa 58,936 D'Salaam 1,393<br />
Kigoma 45,066 Rukwa 75,240<br />
Kagera 39,627 Ruvuma 66,477<br />
Kilimanjaro 13,309 Shinyanga 50,781<br />
Mara 30,150 Singida 49,341<br />
Mbeya 62,420 Tabora 76,151<br />
224
Population<br />
Mtwara 16,707 Tanga 26,808<br />
TOTAL POPULATION AND LIFE EXPECTANCY FOR TANZANIA - BY<br />
REGIONS, 1967, 1978, 1988, 1996:<br />
REGION<br />
TOTAL POPULATION LIFE EXP. 1988<br />
1967 (No.) 1978 (No.) 1988<br />
('000)<br />
1996**<br />
('000)<br />
M<br />
Yrs<br />
W Yrs<br />
Dodoma<br />
Arusha<br />
Kilimanjaro<br />
Tanga<br />
Morogoro<br />
Coast<br />
Dar es Salaam<br />
Lindi<br />
Mtwara<br />
Ruvuma<br />
Iringa<br />
Mbeya<br />
Singida<br />
Tabora<br />
Rukwa<br />
Kigoma<br />
Shinyanga<br />
Kagera<br />
Mwanza<br />
Mara<br />
709,380<br />
610,474<br />
652,722<br />
771,060<br />
682,700<br />
428,041<br />
356,286<br />
419,853<br />
621,293<br />
395,447<br />
689,905<br />
753,765<br />
457,938<br />
502,068<br />
276,091<br />
473,443<br />
899,468<br />
658,712<br />
1,055,883<br />
544,125<br />
972,005<br />
926,223<br />
902,437<br />
1,037,767<br />
939,264<br />
516,586<br />
843,090<br />
527,624<br />
771,818<br />
561,575<br />
925,044<br />
1,079,864<br />
613,949<br />
817,907<br />
451,897<br />
648,941<br />
1,323,535<br />
1,009,767<br />
1,443,379<br />
723,827<br />
1,234.9<br />
1,348.4<br />
1,106.0<br />
1,307.3<br />
1,254.0<br />
636.5<br />
1,357.6<br />
645.0<br />
887.4<br />
781.4<br />
1,206.0<br />
1,472.7<br />
789.9<br />
1,033.8<br />
693.3<br />
857.8<br />
1,768.6<br />
1,358.8<br />
1,874.4<br />
968.6<br />
1,472.5<br />
1,784.0<br />
1,703.5<br />
1,521.8<br />
1,519.4<br />
740.9<br />
1,945.7<br />
744.8<br />
976.7<br />
1,001.3<br />
1,472.9<br />
1,857.0<br />
949.4<br />
1,232.6<br />
954.7<br />
1,047.6<br />
2,194.83<br />
1,659.5<br />
2,270.9<br />
1,202.0<br />
57<br />
46<br />
50<br />
45<br />
44<br />
44<br />
47<br />
57<br />
46<br />
46<br />
45<br />
45<br />
44<br />
46<br />
44<br />
48<br />
48<br />
54<br />
53<br />
48<br />
58<br />
51<br />
50<br />
47<br />
47<br />
45<br />
49<br />
62<br />
48<br />
48<br />
48<br />
48<br />
48<br />
50<br />
47<br />
50<br />
51<br />
55<br />
54<br />
51<br />
<strong>Tanzania</strong> Mainland 11,958,654 17,036,499 22,582.4 28,252.2 49 51<br />
Zanzibar North<br />
Zanzibar South<br />
Zanzibar Urban<br />
Pemba<br />
Pemba<br />
56,360<br />
39,087<br />
95,047<br />
72,015<br />
92,306<br />
77,017<br />
51,749<br />
142,041<br />
106,290<br />
99,014<br />
97.1<br />
70.2<br />
208.4<br />
137.4<br />
127.7<br />
119.0<br />
91.8<br />
290.4<br />
172.6<br />
160.4<br />
46<br />
45<br />
46<br />
46<br />
45<br />
47<br />
50<br />
52<br />
48<br />
50<br />
Zanzibal Is. 354,815 476,111 640.7 834.2 46 49<br />
<strong>Tanzania</strong> United Rep. 12,313,469 17,512,610 23,223.1 29,086.4 47 50<br />
225
Note: The projections are based on the national Population Census of 1988, and the<br />
calculated growth rates since the 1978 census.<br />
Source: Bureau of Statistics.<br />
Land Use<br />
(Ha. millions) Proportion<br />
Small holder cultivation 4.1 5%<br />
Large scale agriculture 1.1 1%<br />
Grazing Land 35.0 39%<br />
Forest and Wood Lands 44.0 50%<br />
Other Lands 4.4 5%<br />
Total 88.6 100%<br />
Arable Land:<br />
Arable Land (Ha) 3,634,000<br />
Lakes<br />
Victoria<br />
Tanganyika<br />
Nyasa<br />
Rukwa<br />
Eyasi<br />
Natron<br />
Manyara<br />
34,850 sq km<br />
13,350 sq km<br />
5,600 sq km<br />
2,850 sq km<br />
1,050 sq km<br />
900 sq km<br />
320 sq km<br />
Mountain summits (metres above sea level)<br />
Kilimanjaro 5,895<br />
Meru 4,566<br />
226
Climate<br />
(a)<br />
Rainfall<br />
Main rain season on the coast is between March and May<br />
and the second season is between October and<br />
December. Rainfall is well distributed throughout the year<br />
but there is a peak during March and May.<br />
Average maximum temperature (degrees centigrade)<br />
Jan. Apr. July October<br />
Dar es Salaam 31.6 30.1 28.6 31.3<br />
Arusha 28.9 25.3 21.1 27.3<br />
Dodoma 31.4 28.4 26.0 30.2<br />
Average manimum tempereture (degrees centigrade)<br />
Jan. Apr. July October<br />
Dar es Salaam 23.3 22.9 18.3 31.3<br />
Arusha 12.2 16.9 12.6 27.3<br />
Dodoma 19.2 13.5 16.2 30.2<br />
Gross Domestic Product at factor cost (billion Shs.) 1992.<br />
At current price 688.0<br />
At constant prices 32.2<br />
GDP growth rate at 1976 prices 1985-92 3.69%<br />
Per capita 27,355<br />
At current price 27,355<br />
At constant price 1,280<br />
227
1.2 SOCIAL SERVICES<br />
HEALTH FACILITIES<br />
YEAR HOSPITALS RHC DISPENSARIES<br />
1960 98 22 975<br />
1980 149 239 2,600<br />
1990 173 276 3,014<br />
Education: Enrollment rates 1995 compared with<br />
other East Africa countries<br />
COUNTRY<br />
GROSS ENROLLMENT<br />
PRIMARY<br />
SECONDARY<br />
KENYA<br />
UGANDA<br />
TANZANIA<br />
94<br />
76<br />
67<br />
28<br />
20<br />
13<br />
228
NATIONAL PARKS<br />
National Parks (area in sq km)<br />
PARK<br />
(i) SERENGETI<br />
NATIONAL<br />
PARK<br />
LOCATION AND PARTICULARS<br />
LOCATION: At the border of Arusha & Mara Region, about<br />
32 km from Arusha town<br />
AREA SIZE: 14,763 square km. It is the largest and oldest<br />
Park in <strong>Tanzania</strong> having been established under the British<br />
Colony in 195l. It contains the greatest and most spectacular<br />
concentration of plain animals left any where in Africa.<br />
MAJOR ATTRACTIONS: Wildebeest about 1.7 million,<br />
Lions 3,000. About 35 species of animals and 500 species of<br />
birds, Buffalos, Chetah, Leopards etc.<br />
(ii) LAKE<br />
MANYARA<br />
NATIONAL<br />
PARK<br />
LOCATION: Some 125 Kilometres South West of Arusha<br />
town. It was officially established and gazzetted as a National<br />
Park in 1960.<br />
AREA: Lake Manyara National Park covers a total area of<br />
320 square kilometres, 230 kilometres constituting Lake<br />
Manyara itself.<br />
MAJOR ATTRACTIONS: The Rift Valley edge on the West<br />
with the vast lake underneath. Natural forest with many<br />
natural rivers and springs.<br />
Tree-climbing lions, various species of animals plus about 360<br />
species of birds, Elephants, Hippos, Leopards, Baboons etc.<br />
(iii) TARANGIRE<br />
NATIONAL<br />
PARK<br />
LOCATION: South of Arusha town along the Dodoma<br />
Highway. It was established in l970.<br />
AREA: Tarangire National Park covers some 2,600 Square<br />
kilometres.<br />
MAJOR ATTRACTIONS: Tree climbing pythons, zebra,<br />
kongoni, elephant, buffalo, waterbuck, gazettes and oryx.<br />
229
(iv)ARUSHA<br />
NATIONAL<br />
PARK<br />
(MOMELA)<br />
LOCATION: The Park is located between Mount Meru and<br />
Mount Kilimanjaro. Formally Ngudoto National Park until<br />
1967. Was commissioned as National Park in 1960.<br />
AREA: The park covers some 137 square Kilometres.<br />
MAJOR ATTRACTIONS: Ngurdoto Crater, Lake Momella,<br />
Mount Meru and the Natural Momela Forests. There are<br />
many species of Animals and birds. The most common being<br />
African elephant, colobus and velvet monkey, hippo, duicker<br />
and a number of bird species.<br />
(v)KILIMANJAR<br />
O NATIONAL<br />
PARK<br />
LOCATION: The Kilimanjaro National Park which derived<br />
its name from Mount Kilimanjaro is part and parcel of the<br />
Mountain. It was established in 1973.<br />
AREA: The bounderies of the Park include the natural forest<br />
under and around the Mountain. It covers some 760 square<br />
Kilometres.<br />
MAJOR ATTRACTIONS: Mount Kilimanjaro with its three<br />
peaks Shira (3,962 metres) Mawenzi and Kibo (5,149 and<br />
5,895 metres respectively) above sea level form the largest<br />
part of the Park's attraction. There are also various species of<br />
Animals, plants and birds.<br />
(vi)MIKUMI<br />
NATIONAL<br />
PARK<br />
LOCATION: It is situated some 216 km along the Dar -<br />
Zambia Highway. It was established in 1964.<br />
AREA: Mikumi National Park which borders with Africa's<br />
largest Game reserve, the Selous is the third biggest National<br />
Park after Serengeti and Ruaha National Park and covers 3230<br />
sq km.<br />
MAJOR ATTRACTIONS: The plains sorrounding River<br />
Mkata which are rich in flora and fauna are by themselves a<br />
wonderful scenarial. The common animals found in the park<br />
include zebra, buffalos, elephants, Hippos, lions and the<br />
Impalas.<br />
230
(vii)UDZUNGWA<br />
NATIONAL<br />
PARK<br />
LOCATION: This Park is located South of Mikumi National<br />
Park along the Mikumi-Ifakara Highway. The Park was<br />
established in 1992.<br />
AREA: The Park which derives its identity from the famous<br />
Udzungwa mountain has an area of 1990 square kilometres.<br />
MAJOR ATTRACTIONS: Its unique species of Fauna and<br />
Flora which called for its declaration as a National Park. The<br />
Udzungwa Mountains and Forests are a good source of Rivers<br />
and springs, one of them being the famous Kilombero River,<br />
which constitutes the essential part of the multi-hactoral its<br />
total Kilombero Sugar Plantations. Additional attractions:<br />
Lions, Buffalos, Giraffes etc.<br />
(viii)RUAHA<br />
NATIONAL PARK<br />
LOCATION: The name Ruaha, is derived from the Hehe word<br />
"Luvaha" meaning a river.<br />
AREA: Park covers an area of 12,950 square kilometres, the<br />
second largest in the country. Ruaha National Park which was<br />
established in 1964 is situated some 130 km west of Iringa<br />
town.<br />
MAJOR ATTRACTIONS: The Ruaha River by itself is an<br />
attraction, leave alone some hundreds of species of Flora<br />
which sorround it. Besides there are a lot of Crocodiles,<br />
Hippos, Elephants etc.<br />
(ix) KATAVI<br />
NATIONAL<br />
PARK *<br />
LOCATION: It is located in Mpanda District, Rukwa Region.<br />
It was established in 1974.<br />
AREA: The Katavi National Park which is about 40<br />
kilometres South -East of Mpanda town covers an area of<br />
2,253 square kilometres.<br />
MAJOR ATTRACTION: Lakes Chala and Chada plus other<br />
springs and rivers whose waters feed into lake Rukwa<br />
constitute a unique environment. Animals in the park include<br />
zebra, sable, eland, leopard, buffalo, lion, antelops etc.<br />
Animals like, Buffalos, Elephants, Zebras and BushBucks are a<br />
good attraction to visitors.<br />
231
(x)MAHALE<br />
NATIONAL<br />
PARK<br />
LOCATION Located some 120 south of Kigoma town along<br />
the shores of lake Tanganyika, Mahale National Park is yet<br />
another attraction in <strong>Tanzania</strong>'s Natural Heritages.<br />
AREA: Mahale nation Park has about 1,613 square kilometres<br />
and was gazzetted in 1948.<br />
MAJOR ATTRACTIONS:Chimpanzees are a major attraction.<br />
Also there is a good number of monkey species including red<br />
colobus monkeys. It is estimated that there are 700<br />
Chimpanzees in Mahale and 15 species of monkeys whose<br />
habits tally with those of the Chimps.<br />
(xi) GOMBE<br />
NATIONAL<br />
PARK<br />
LOCATION Gombe National Park is situated 16 km north of<br />
Kigoma town in western <strong>Tanzania</strong>. It is a narrow strip of<br />
mountainous country bounded in the east by the eastern rift<br />
valley escarpment and by lake Tanganyika in the west<br />
AREA: Covering some 52 square kilometres. National park,<br />
was commssioned in 1968.<br />
MAJOR ATTRACTIONS:Ever green forests and primates.<br />
These include Chimpanzees, Baboons, blue monkey red tails<br />
and red colobus.<br />
(xii) RUBONDO<br />
NATIONAL<br />
PARK<br />
LOCATION: The Park which form park of a number of<br />
archipelagos in Lake Victoria covers some 240 square<br />
Kilometres. it was established in 1977<br />
MAJOR ATTRACTIONS: The Chimpanzees. But other<br />
attractions include, Hippos, Giraffes, and Elephants. the<br />
absence of man-eaters such as Lions & Leopards ensures a safe<br />
walk in Rubondo Park even some fishing activities with boats<br />
under Park wardens are carried out.<br />
(xiii)<br />
NGORONGORO<br />
LOCATION: It is situated west of Arusha town some 230 kms.<br />
AREA: The park covers 8320 sq km<br />
MAJOR ATTRACTION: Wildebeest, Lions, Buffalos,<br />
Leopards, Variety of birds species, Giraffes, elephans etc<br />
232
233