Annual report - HSE
Annual report - HSE
Annual report - HSE

You also want an ePaper? Increase the reach of your titles
YUMPU automatically turns print PDFs into web optimized ePapers that Google loves.
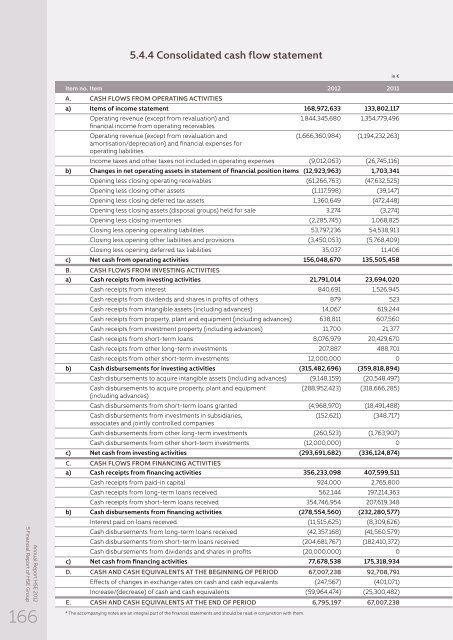
5.4.4 Consolidated cash flow statement<br />
in €<br />
5 Financial Report of <strong>HSE</strong> Group<br />
<strong>Annual</strong> Report <strong>HSE</strong> 2012<br />
166<br />
Item no. Item 2012 2011<br />
A. CASH FLOWS FROM OPERATING ACTIVITIES<br />
a) Items of income statement 168,972,633 133,802,117<br />
Operating revenue (except from revaluation) and 1,844,345,680 1,354,779,496<br />
financial income from operating receivables<br />
Operating revenue (except from revaluation and (1,666,360,984) (1,194,232,263)<br />
amortisation/depreciation) and financial expenses for<br />
operating liabilities<br />
Income taxes and other taxes not included in operating expenses (9,012,063) (26,745,116)<br />
b) Changes in net operating assets in statement of financial position items (12,923,963) 1,703,341<br />
Opening less closing operating receivables (61,266,763) (47,632,525)<br />
Opening less closing other assets (1,117,598) (39,147)<br />
Opening less closing deferred tax assets 1,360,649 (472,448)<br />
Opening less closing assets (disposal groups) held for sale 3,274 (3,274)<br />
Opening less closing inventories (2,285,745) 1,068,825<br />
Closing less opening operating liabilities 53,797,236 54,538,913<br />
Closing less opening other liabilities and provisions (3,450,053) (5,768,409)<br />
Closing less opening deferred tax liabilities 35,037 11,406<br />
c) Net cash from operating activities 156,048,670 135,505,458<br />
B. CASH FLOWS FROM INVESTING ACTIVITIES<br />
a) Cash receipts from investing activities 21,791,014 23,694,020<br />
Cash receipts from interest 840,691 1,526,945<br />
Cash receipts from dividends and shares in profits of others 879 523<br />
Cash receipts from intangible assets (including advances) 14,067 619,244<br />
Cash receipts from property, plant and equipment (including advances) 638,811 607,560<br />
Cash receipts from investment property (including advances) 11,700 21,377<br />
Cash receipts from short-term loans 8,076,979 20,429,670<br />
Cash receipts from other long-term investments 207,887 488,701<br />
Cash receipts from other short-term investments 12,000,000 0<br />
b) Cash disbursements for investing activities (315,482,696) (359,818,894)<br />
Cash disbursements to acquire intangible assets (including advances) (9,148,159) (20,548,497)<br />
Cash disbursements to acquire property, plant and equipment (288,952,423) (318,666,285)<br />
(including advances)<br />
Cash disbursements from short-term loans granted (4,968,970) (18,491,488)<br />
Cash disbursements from investments in subsidiaries, (152,621) (348,717)<br />
associates and jointly controlled companies<br />
Cash disbursements from other long-term investments (260,523) (1,763,907)<br />
Cash disbursements from other short-term investments (12,000,000) 0<br />
c) Net cash from investing activities (293,691,682) (336,124,874)<br />
C. CASH FLOWS FROM FINANCING ACTIVITIES<br />
a) Cash receipts from financing activities 356,233,098 407,599,511<br />
Cash receipts from paid-in capital 924,000 2,765,800<br />
Cash receipts from long-term loans received 562,144 197,214,363<br />
Cash receipts from short-term loans received 354,746,954 207,619,348<br />
b) Cash disbursements from financing activities (278,554,560) (232,280,577)<br />
Interest paid on loans received (11,515,625) (8,309,626)<br />
Cash disbursements from long-term loans received (42,357,168) (41,560,579)<br />
Cash disbursements from short-term loans received (204,681,767) (182,410,372)<br />
Cash disbursements from dividends and shares in profits (20,000,000) 0<br />
c) Net cash from financing activities 77,678,538 175,318,934<br />
D. CASH AND CASH EQUIVALENTS AT THE BEGINNING OF PERIOD 67,007,238 92,708,791<br />
Effects of changes in exchange rates on cash and cash equivalents (247,567) (401,071)<br />
Increase/(decrease) of cash and cash equivalents (59,964,474) (25,300,482)<br />
E. CASH AND CASH EQUIVALENTS AT THE END OF PERIOD 6,795,197 67,007,238<br />
* The accompanying notes are an integral part of the financial statements and should be read in conjunction with them.