

Problem #3 - ncssm
Problem #3 - ncssm
Problem #3 - ncssm

Create successful ePaper yourself
Turn your PDF publications into a flip-book with our unique Google optimized e-Paper software.
NCAAPMT Calculus Challenge 2011‐2012<br />
Challenge <strong>#3</strong> Due: October 26, 2011<br />
A Model of Traffic Flow<br />
Everyone has at some time been on a multi-lane highway and encountered road<br />
construction that required the traffic to occupy only one lane each way. Naturally, the<br />
Department of Transportation would like to maximize the flow of traffic through this stretch<br />
of the highway. What speed limit should be set for such a stretch of road to ensure the<br />
greatest traffic flow while also maintaining safety<br />
When developing a mathematical model of a real-world situation, it is usually necessary<br />
to make some simplifying assumptions. In this model, we assume that all the cars are the<br />
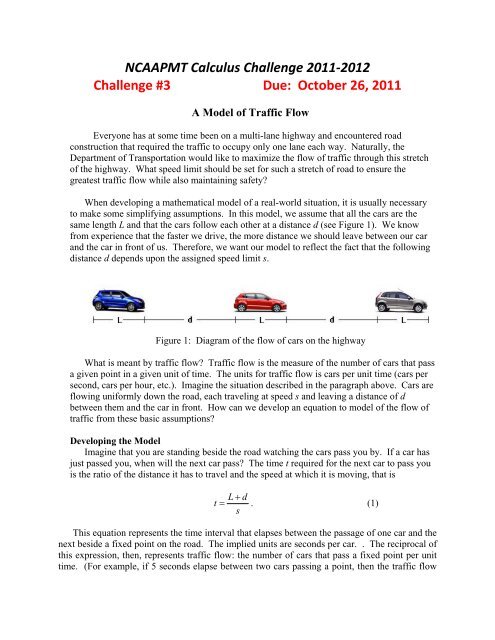
same length L and that the cars follow each other at a distance d (see Figure 1). We know<br />
from experience that the faster we drive, the more distance we should leave between our car<br />
and the car in front of us. Therefore, we want our model to reflect the fact that the following<br />
distance d depends upon the assigned speed limit s.<br />
Figure 1: Diagram of the flow of cars on the highway<br />
What is meant by traffic flow Traffic flow is the measure of the number of cars that pass<br />
a given point in a given unit of time. The units for traffic flow is cars per unit time (cars per<br />
second, cars per hour, etc.). Imagine the situation described in the paragraph above. Cars are<br />
flowing uniformly down the road, each traveling at speed s and leaving a distance of d<br />
between them and the car in front. How can we develop an equation to model of the flow of<br />
traffic from these basic assumptions<br />
Developing the Model<br />
Imagine that you are standing beside the road watching the cars pass you by. If a car has<br />
just passed you, when will the next car pass The time t required for the next car to pass you<br />
is the ratio of the distance it has to travel and the speed at which it is moving, that is<br />
L<br />
d<br />
t . (1)<br />
s<br />
This equation represents the time interval that elapses between the passage of one car and the<br />
next beside a fixed point on the road. The implied units are seconds per car. . The reciprocal of<br />
this expression, then, represents traffic flow: the number of cars that pass a fixed point per unit<br />
time. (For example, if 5 seconds elapse between two cars passing a point, then the traffic flow
must be 1/5 of a car per second—or equivalently, 12 cars per minute.) Thus, one simple model<br />
of traffic would be the equation<br />
s<br />
F . (2)<br />
L d<br />
We note now that while highway speed limits are typically given in miles per hour in the<br />
U.S., car lengths are not generally estimated in miles, but are given in feet. So a unit change is in<br />
order. Also, we all know that the following distance d, depends on the speed of the cars.<br />
Three different “rules of thumb” are commonly used to determine a safe following distance.<br />
You might want to check your state’s Driver’s Manual to see what is recommended. The faster<br />
you are going the greater the distance must be between you and the car in front of you to give<br />
you time and distance to safely stop if the car in front of you stops suddenly.<br />
a) Follow two car lengths for every 10 mph.<br />
b) Follow three seconds behind the car in front.<br />
c) The distance needed to stop varies at different speeds and includes thinking and<br />
braking distances. A table of stopping distances is often given.<br />
Table 1 is from a driver’s handbook and gives some typical distances.<br />
Speed (mph) Thinking Distance (ft) Braking Distance (ft) Stopping Distance (ft)<br />
20 20 20 40<br />
30 30 45 75<br />
40 40 80 120<br />
50 50 125 175<br />
60 60 180 240<br />
1. Modify equation (2) by replacing d with a function of s based on each of the three “rules<br />
of thumb”. For each, determine the speed that maximizes the flow of traffic in terms of the car<br />
length L.<br />
2. Select the model that best describes traffic flow and which has a maximum flow. Since<br />
this model is dependent on the length of the vehicle, the maximum traffic flow will also be<br />
dependent on the length. Graph traffic flow vs. speed and identify the ordered pair that<br />
represents maximum traffic flow for each of the following vehicles:<br />
a. Mini Cooper has length of 142.8 inches.<br />
b. Toyota Corolla has length of 178.3 inches.<br />
c. Hummer H2 has length of 189.9 inches.<br />
d. An eighteen-wheeler with average length between 70 and 80 feet
3. The web site<br />
http://www.thetruckersreport.com/truck_facts.shtml#Length%20of%20eighteen%20wheelers<br />
gives the statement that “The length of time to stop an eighteen wheeler is 40% greater than that<br />
of an automobile.” Apply this information to find the ordered pair that represents the speed for<br />
maximum traffic flow for an eighteen-wheeler.<br />
4. Our experience suggests that drivers do not leave as much space between cars as they<br />
should. Let p be the fraction of the required stopping distance that the drivers actually leave<br />
between cars. Assume 0.1<br />
p 1. Find the optimal speed and its corresponding traffic flow<br />
that maximizes traffic flow in terms of the parameters L and p. Which has a larger effect of the<br />
optimal speed, L or p<br />
5. Some might argue that the drivers would never drive so close to the car in front of them<br />
that they would not have sufficient time to react. These divers might (unconsciously, of course)<br />
leave all of the reaction distance but only a fraction of the braking distance. Adjust your model<br />
by multiplying braking distance by p, where 0.1<br />
p 1 to find the optimal speed and its<br />
corresponding traffic flow for the Corolla for p 0.1, p 0.5, and p 1.


