Lead in the Body â A Calculus Investigation Bones C(t) Tissue B(t ...
Lead in the Body â A Calculus Investigation Bones C(t) Tissue B(t ...
Lead in the Body â A Calculus Investigation Bones C(t) Tissue B(t ...

You also want an ePaper? Increase the reach of your titles
YUMPU automatically turns print PDFs into web optimized ePapers that Google loves.
<strong>Lead</strong> <strong>in</strong> <strong>the</strong> <strong>Body</strong> – A <strong>Calculus</strong> <strong>Investigation</strong><br />
Adapted from Duke University’s Connected Curriculum Project and Differential Equations, A Model<strong>in</strong>g<br />
Approach, Borrelli and Coleman, John Wiley and Sons Inc., 1996<br />
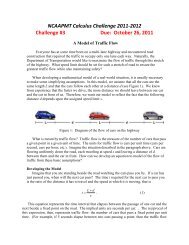
<strong>Lead</strong> can be absorbed <strong>in</strong> <strong>the</strong> body by <strong>in</strong>halation and <strong>in</strong>gestion. Once <strong>in</strong> your blood<br />
stream, lead accumulates <strong>in</strong> <strong>the</strong> blood, soft tissues and bones. <strong>Lead</strong> is excreted from <strong>the</strong><br />
body primarily through <strong>the</strong> ur<strong>in</strong>ary system and through hair, nails, and sweat (see figure).<br />
<strong>Lead</strong> Input<br />
food, air, water<br />
<strong>Bones</strong><br />
Compartment C<br />
C(t)<br />
k ca<br />
k ac<br />
Blood<br />
Compartment A<br />
A(t)<br />
k<br />
ab<br />
k<br />
ba<br />
<strong>Tissue</strong><br />
Compartment B<br />
B(t)<br />
k ur<strong>in</strong>e<br />
ad<br />
k<br />
bd<br />
hair,<br />
nails,<br />
sweat<br />
Compartment D – External Environment<br />
We model <strong>the</strong> flow of lead <strong>in</strong>to, through, and out of a body with separate compartments<br />
for blood, bones, and o<strong>the</strong>r tissues, plus a compartment for <strong>the</strong> external environment.<br />
We let A(t), B(t) and C(t) be <strong>the</strong> amount of lead <strong>in</strong> each compartment at time t, as<br />
shown above. We assume that <strong>the</strong> rate of transfer from compartment A to compartment<br />
B is proportional to <strong>the</strong> amount of lead <strong>in</strong> compartment A with proportionality constant<br />
k<br />
ab<br />
. Similarly, we assume that <strong>the</strong> rate of transfer from compartment B to compartment<br />
A is proportional to <strong>the</strong> amount of lead <strong>in</strong> compartment B with proportionality constant<br />
k<br />
ba<br />
, etc. We are not concerned with <strong>the</strong> lead <strong>in</strong> compartment D because we are not<br />
concerned with <strong>the</strong> quantity of lead outside <strong>the</strong> body. The body is not a closed system,<br />
but <strong>in</strong>clud<strong>in</strong>g an extra compartment <strong>in</strong> <strong>the</strong> model creates a closed system. We assume<br />
that exposure to lead <strong>in</strong> <strong>the</strong> environment results <strong>in</strong> <strong>in</strong>gestion of lead at a constant rate L,<br />
measured <strong>in</strong> micrograms (ug) per day . This external <strong>in</strong>put is called a “driv<strong>in</strong>g force”.<br />
1. Let dA be <strong>the</strong> rate of change of <strong>the</strong> level of lead <strong>in</strong> <strong>the</strong> blood, dB be <strong>the</strong> rate of<br />
dt<br />
dt<br />
change of <strong>the</strong> level of lead <strong>in</strong> <strong>the</strong> tissue and dC be <strong>the</strong> rate of change of <strong>the</strong> level of lead<br />
dt<br />
<strong>in</strong> <strong>the</strong> bones. Write a set of coupled differential equations represent<strong>in</strong>g <strong>the</strong> rates of<br />
change for <strong>the</strong> amount of lead <strong>in</strong> <strong>the</strong> blood, bones and tissue compartments of <strong>the</strong> body.
2. In a study published <strong>in</strong> 1973 (see reference), Rab<strong>in</strong>owitz and colleagues measured<br />
over an extended period of time <strong>the</strong> lead levels <strong>in</strong> bones, blood, and tissue of a healthy<br />
male volunteer liv<strong>in</strong>g <strong>in</strong> Los Angeles. Their measurements produced <strong>the</strong> follow<strong>in</strong>g<br />
transfer coefficients for movement of lead between various parts of <strong>the</strong> body and for<br />
excretion from <strong>the</strong> body. Note that, relatively speak<strong>in</strong>g, lead is somewhat slow to enter<br />
<strong>the</strong> bones and very slow to leave <strong>the</strong>m.<br />
<strong>Lead</strong> Transfer Coefficients (Rab<strong>in</strong>owitz, et al.)<br />
Units: days -1<br />
k<br />
ab<br />
= 0.0111 k<br />
ba<br />
= 0.0124 from blood to tissue and back<br />
k ac = 0.0039 k ca = 0.000035 from blood to bone and back<br />
k<br />
ad<br />
= 0.021 k<br />
bd<br />
= 0.016 excretion from blood and tissue<br />
The Rab<strong>in</strong>owitz study also showed that <strong>the</strong> average rate of <strong>in</strong>gestion of lead <strong>in</strong> Los<br />
Angeles over <strong>the</strong> period studied was 49.3 micrograms per day.<br />
Us<strong>in</strong>g <strong>the</strong> values given, write <strong>the</strong> Euler’s Method equations for <strong>the</strong> levels of lead <strong>in</strong> each<br />
of <strong>the</strong> compartments. Graph <strong>the</strong> level of lead <strong>in</strong> <strong>the</strong> blood, tissue and bones for <strong>the</strong><br />
volunteer for his first 400 days. You may assume that A(0)=0, B(0) = 0, C(0) = 0, and<br />
∆ t = 1. What do you notice about <strong>the</strong> levels of lead <strong>in</strong> each of <strong>the</strong> body’s<br />
compartments<br />
3. Now graph <strong>the</strong> level of lead <strong>in</strong> <strong>the</strong> blood, tissue and bones for 800 days. What do<br />
you notice about <strong>the</strong> levels of lead <strong>in</strong> each of <strong>the</strong> body’s compartments<br />
4. From your graphs <strong>in</strong> parts 2 and 3, we can see that <strong>the</strong> lead level <strong>in</strong> <strong>the</strong> blood and<br />
tissue compartments reaches an equilibrium level. Assume that <strong>the</strong> lead level <strong>in</strong> <strong>the</strong><br />
bones reaches an equilibrium value. Us<strong>in</strong>g analytic methods, f<strong>in</strong>d <strong>the</strong> equilibrium levels<br />
for all three compartments. Compare your analytic results to your numerical values for<br />
<strong>the</strong> blood and tissue compartments.<br />
Part II A <strong>Lead</strong>-Free Environment<br />
Suppose now that <strong>the</strong> volunteer has been placed <strong>in</strong> a totally lead-free environment after<br />
<strong>the</strong> 400 day exposure <strong>in</strong> Los Angeles. That is, <strong>the</strong> external driv<strong>in</strong>g force <strong>in</strong> <strong>the</strong> model is<br />
now set to 0.<br />
1. Modify your Euler’s Method equations to reflect this change <strong>in</strong> <strong>the</strong> model. Graph <strong>the</strong><br />
levels of lead <strong>in</strong> <strong>the</strong> blood, tissue and bones for <strong>the</strong> volunteer for his first 400 days and<br />
his next 400 lead-free days on <strong>the</strong> same graph. What do you notice about <strong>the</strong> levels of<br />
lead <strong>in</strong> each of <strong>the</strong> body’s compartments
2. Your plot should show that <strong>the</strong> lead level <strong>in</strong> <strong>the</strong> bones peaks at around 600 days.<br />
What is that peak amount If <strong>the</strong> volunteer rema<strong>in</strong>s <strong>in</strong> a lead-free environment, how<br />
long will it take for <strong>the</strong> lead level <strong>in</strong> his bones to reach half of its peak amount<br />
Part III A <strong>Lead</strong>-Free Environment with Anti-lead Medication<br />
Ano<strong>the</strong>r way to remove lead from <strong>the</strong> bones is to adm<strong>in</strong>ister an anti-lead medication that<br />
<strong>in</strong>creases <strong>the</strong> rate at which lead leaves <strong>the</strong> skeletal system. In particular, suppose that<br />
<strong>the</strong> rate coefficient k ac = 0.000035 <strong>in</strong>creases to k ac = 0.00035 with <strong>the</strong> anti-lead drug.<br />
Suppose that after 400 days of exposure to lead, <strong>the</strong> volunteer is placed <strong>in</strong> a lead-free<br />
environment and adm<strong>in</strong>istered <strong>the</strong> anti-lead drug. Modify your Euler’s Method equations<br />
to reflect this change <strong>in</strong> <strong>the</strong> model. Graph <strong>the</strong> level of lead <strong>in</strong> each compartment over<br />
<strong>the</strong> total 800 days. Approximately when will <strong>the</strong> level of lead <strong>in</strong> <strong>the</strong> bones reach its peak<br />
amount What is that peak amount How long will it take for <strong>the</strong> lead level <strong>in</strong> <strong>the</strong> bones<br />
to reach half of its peak amount<br />
Articles by Rab<strong>in</strong>owitz et al. <strong>in</strong> Science 182 (1973), 725-727, and by Batschelet et al. <strong>in</strong> Journal of<br />
Ma<strong>the</strong>matical Biology 8 (1979), 15-23.