Fact Sheet Master - MetLife Alico
Fact Sheet Master - MetLife Alico
Fact Sheet Master - MetLife Alico

You also want an ePaper? Increase the reach of your titles
YUMPU automatically turns print PDFs into web optimized ePapers that Google loves.
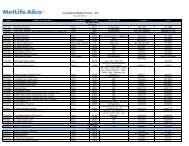
Global Fixed Income LU0170475585 31 December 2011<br />
Franklin Templeton Investment Funds<br />
Templeton Global Total Return Fund<br />
Fund Overview<br />
Base Currency for Fund<br />
Total Net Assets (USD)<br />
Summary of Investment Objectives<br />
The Fund aims to maximise total investment return<br />
consisting of a combination of interest income, capital<br />
appreciation, and currency gains by investing principally in<br />
a portfolio of fixed and/or floating rate debt securities and<br />
debt obligations issued by government and governmentrelated<br />
issuers or corporate entities worldwide as well as<br />
certain financial instruments for investment purposes. The<br />
Fund may also purchase mortgage and asset- backed<br />
securities, convertible bonds and debt obligations issued<br />
by supranational entities organised or supported by<br />
several national governments.<br />
EUSD Status - A(Mdis) USD<br />
Redemption<br />
Distribution<br />
Ratings - A(Mdis) USD<br />
S&P Fund Management Rating<br />
In Scope<br />
In Scope<br />
AA/V4<br />
Overall Morningstar Rating<br />
´ ´ ´ ´ ´<br />
Asset Allocation<br />
USD<br />
21,555 million<br />
Launch Date 29.08.2003<br />
Number of Holdings 527<br />
Benchmark<br />
Investment Style<br />
Fund Management<br />
Michael Hasenstab, PhD<br />
Sonal Desai, PhD<br />
Barclays Capital<br />
Multiverse Index<br />
Fixed Income - Total<br />
Return<br />
United States<br />
United States<br />
%<br />
Fixed Income 95.14<br />
Cash & Cash Equivalents 4.86<br />
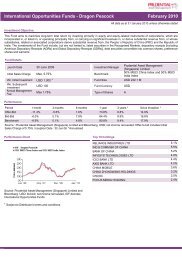
Performance<br />
Performance over 5 Years in EUR<br />
Templeton Global Total Return Fund A(Mdis) USD<br />
180<br />
160<br />
140<br />
120<br />
100<br />
Performance in EUR (%)<br />
Cumulative<br />
Calendar Year Performance in EUR (%)<br />
Barclays Capital Multiverse Index<br />
80<br />
12/06 06/07 12/07 06/08 12/08 06/09 12/09 06/10 12/10 06/11 12/11<br />
Annualised<br />
1 Yr 3 Yrs 5 Yrs 3 Yrs 5 Yrs<br />
A(Mdis) USD 2.22 64.65 66.66 18.10 10.76<br />
A(acc) EUR 2.29 64.78 66.73 18.13 10.77<br />
A(acc) EUR-H1 -1.32 51.33 N/A 14.82 N/A<br />
A(Mdis) EUR 2.22 64.71 66.69 18.11 10.76<br />
A(Mdis) EUR-H1 -1.20 50.79 N/A 14.68 N/A<br />
A(Ydis) EUR 2.26 64.90 N/A 18.16 N/A<br />
A(Ydis) EUR-H1 -1.35 N/A N/A N/A N/A<br />
Benchmark 9.08 29.23 38.95 8.93 6.80<br />
Past performance is no guarantee of future performance. The value of shares in the fund and income received from<br />
it can go down as well as up, and investors may not get back the full amount invested. All performance data shown is<br />
in the currency stated, include reinvested dividends and are net of management fees. Sales charges and other commissions,<br />
taxes and other relevant costs paid by the investor are not included in the calculations. Performance may also be affected by<br />
currency fluctuations. Up to date performance figures can be found on our local website. References to indices are made for<br />
comparative purposes only and are provided to represent the investment environment existing during the time periods shown.<br />
2011 2010 2009 2008 2007 2006 2005 2004<br />
A(Mdis) USD 2.22 23.54 30.38 1.49 -0.26 4.87 11.80 7.02<br />
Benchmark 9.08 13.20 4.67 9.14 -1.49 -4.36 10.46 1.56<br />
Share Class Information<br />
Top Holdings<br />
Security Name %<br />
Korea Treasury Bond, senior bond, 3.00%, 12/10/13 3.70<br />
Korea Treasury Bond, senior bond, 4.00%, 6/10/12 3.27<br />
Government of Sweden, 5.50%, 10/08/12 3.02<br />
Korea Treasury Bond, senior bond, 4.25%, 12/10/12 2.93<br />
Government of Uruguay, senior note, 4.375%,<br />
Fees Dividends Fund Identifiers<br />
Max. Sales Max. Annual<br />
Last Paid Last Paid<br />
Share Class Incept Date NAV TER (%) Charge (%) Charge (%) Frequency Date Amount Bloomberg ID ISIN<br />
A(Mdis) USD 29.08.2003 USD 16.09 1.40 3.00 1.05 M 15.12.2011 0.0470 TGTRFAD LX LU0170475585<br />
A(acc) EUR 01.09.2006 EUR 18.29 1.40 3.00 1.05 N/A N/A N/A TGTAACE LX LU0260870661<br />
A(acc) EUR-H1 10.04.2007 EUR 17.16 1.41 3.00 1.05 N/A N/A N/A TGRAACH LX LU0294221097<br />
A(Mdis) EUR 29.12.2005 EUR 12.48 1.40 3.00 1.05 M 15.12.2011 0.0350 TGTRADD LX LU0234926953<br />
A(Mdis) EUR-H1 16.06.2008 EUR 10.46 1.41 3.00 1.05 M 15.12.2011 0.0310 TGTAMDE LX LU0366773504<br />
A(Ydis) EUR 12.07.2007 EUR 12.72 1.40 3.00 1.05 Y 15.12.2011 0.5100 TGTAYDS LX LU0300745725<br />
A(Ydis) EUR-H1 21.06.2010 EUR 10.17 1.42 3.00 1.05 Y 15.12.2011 0.4240 TMGTAHE LX LU0517465034<br />
Contact Information<br />
Tel Fax E-Mail Web<br />
+352 46 66 671 +352 22 13 57 lucs@franklintempleton.com www.franklintempleton.lu<br />
2.42<br />
12/15/28<br />
Government of Iceland, Reg S, 4.875%, 6/16/16 2.17<br />
Government of Romania, senior note, 5.25%, 6/17/16 1.65<br />
Government of Ireland, 4.00%, 1/15/14 1.50<br />
Government of Hungary, D, 6.75%, 8/22/14 1.47<br />
Government of Ireland, 4.60%, 4/18/16 1.22<br />
Fund Measures<br />
Average Credit Quality<br />
BBB<br />
Average Duration<br />
2.78 Years<br />
Average Weighted Maturity<br />
4.41 Years<br />
Yield to Maturity 7.19%<br />
Standard Deviation (5 Yrs, USD) 11.53
Templeton Global Total Return Fund 31 December 2011<br />
Composition of Fund<br />
Templeton Global Total Return Fund<br />
Barclays Capital Multiverse Index<br />
Geographic<br />
% of Total<br />
South Korea 11.21 / 1.05<br />
United States 9.92 / 37.26<br />
Hungary 7.52 / 0.06<br />
Malaysia 6.23 / 0.23<br />
Ireland 6.16 / 0.35<br />
Poland 5.99 / 0.35<br />
ST Cash and Cash Equivalents 4.86 / 0.11<br />
Sweden 4.80 / 0.95<br />
Ukraine 4.03 / 0.03<br />
Other 39.26 / 59.54<br />
Currency<br />
% of Total<br />
US Dollar 32.36 / 42.54<br />
South Korean Won 14.51 / 0.88<br />
Swedish Krona 12.94 / 0.59<br />
Polish Zloty 11.31 / 0.23<br />
Malaysian Ringgit 10.99 / 0.19<br />
Australian Dollar 10.98 / 1.25<br />
Singapore Dollar 8.55 / 0.14<br />
Japanese Yen -11.22 / 20.12<br />
EURO -39.17 / 23.57<br />
Other 48.77 / 10.49<br />
Sector<br />
% of Total<br />
Intl Govt/Agency Bonds: Investment Grade 43.38 / 44.92<br />
Intl Govt/Agency Bonds: Non-Investment Grade 17.66 / 0.00<br />
Corporate Bonds: Non-Investment Grade 14.60 / 2.82<br />
Sovereign Bonds: Investment Grade 7.96 / 2.76<br />
Sovereign Bonds: Non-Investment Grade 7.36 / 0.60<br />
Cash & Cash Equivalents 4.86 / 0.00<br />
Corporate Bonds: Investment Grade 1.50 / 15.00<br />
Supranational 1.48 / 1.69<br />
Municipal 0.67 / 0.29<br />
Other 0.52 / 31.93
Templeton Global Total Return Fund 31 December 2011<br />
Composition of Fund (continued)<br />
Templeton Global Total Return Fund<br />
Barclays Capital Multiverse Index<br />
Ratings<br />
% of Total<br />
AAA 7.98 / 49.06<br />
AA+ 0.00 / 1.55<br />
AA 0.81 / 2.10<br />
AA- 0.05 / 23.97<br />
A+ 14.85 / 3.68<br />
A 12.52 / 6.37<br />
A- 0.77 / 3.18<br />
BBB+ 9.99 / 2.68<br />
BBB 3.95 / 2.40<br />
BBB- 6.00 / 1.47<br />
BB+ 19.09 / 0.59<br />
BB 0.55 / 0.64<br />
BB- 4.97 / 0.41<br />
B+ 2.18 / 0.51<br />
B 9.21 / 0.45<br />
B- 3.52 / 0.40<br />
CCC+ 2.84 / 0.23<br />
CCC 0.57 / 0.10<br />
CC+ 0.00 / 0.04<br />
CCC- 0.02 / 0.03<br />
CC 0.03 / 0.00<br />
C 0.01 / 0.00<br />
N/A 0.00 / 0.12<br />
NR 0.10 / 0.01<br />
Duration<br />
% of Total<br />
0 to 1 Year 31.46 / 0.86<br />
1 to 2 Years 19.90 / 15.80<br />
2 to 3 Years 4.46 / 17.19<br />
3 to 5 Years 14.62 / 25.02<br />
5 to 7 Years 15.01 / 13.27<br />
7 to 10 Years 3.76 / 12.36<br />
10 to 15 Years 2.97 / 8.24<br />
15 to 20 Years -0.76 / 5.75<br />
20 to 30 Years 0.69 / 1.52<br />
Offset Derivatives 7.02 / 0.00<br />
N/A 0.88 / 0.00<br />
Disclaimers<br />
Important Information: © 2012 Franklin Templeton Investments. All rights reserved. Issued by Franklin Templeton International Services S.A. Franklin Templeton Investment Funds (the “Fund”)<br />
is a Luxembourg registered SICAV. Source for data and information provided by Franklin Templeton Investments, as of the date of this document, unless otherwise noted. Benchmark related<br />
data provided by <strong>Fact</strong>Set, as of the date of this document, unless otherwise noted. This document does not constitute a legal or tax advice nor an investment advice or an offer for shares of the<br />
Fund. Subscriptions to shares of the Fund can only be made on the basis of the current full or simplified prospectus of the Fund, accompanied by the latest available audited annual report and<br />
semi-annual report accessible on our website at www.franklintempleton.lu or which can be obtained, free of charge, from Franklin Templeton International Services S.A., 26 Boulevard Royal,<br />
L-2449 Luxembourg. No shares of the Fund may be directly or indirectly offered or sold to nationals or residents of the United States of America. Shares of the Fund are not available for<br />
distribution in all jurisdictions and prospective investors should confirm availability with their local Franklin Templeton Investments representative before making any plans to invest. An<br />
investment in the Fund entails risks, which are described in the Fund’s prospectus. Special risks may be associated with a Fund’s investment in certain types of securities, asset classes,<br />
sectors, markets, currencies or countries and in the Fund’s possible use of derivatives. These risks are more fully described in the Fund’s prospectus and should be read closely before<br />
investing. Subject to any applicable regulatory requirements, the portfolio manager for the Fund reserves the right to withhold release of information with respect to holdings that would otherwise<br />
be included in the top 10 holdings list. Holdings of the same issuer have been combined. Information is historical and may not reflect current or future portfolio characteristics. All portfolio<br />
holdings are subject to change.<br />
STANDARD & POOR’S®, S&P® and S&P 500® are registered trademarks of Standard & Poor’s Financial Services LLC. Standard & Poor’s does not sponsor, endorse, sell or promote any<br />
S&P index-based product.
Templeton Global Total Return Fund 31 December 2011<br />
Disclaimers<br />
© Morningstar, Inc. All rights reserved. The information contained herein: (1) is proprietary to Morningstar and/or its content providers; (2) may not be copied or distributed; and (3) is not<br />
warranted to be accurate, complete or timely. Neither Morningstar nor its content providers are responsible for any damages or losses arising from any use of this information.<br />
EUSD Status: Any tax information provided is intended to be a general guide and should not be relied upon as a basis for calculating individual liabilities. The information does not take into<br />
consideration your personal circumstances and may be subject to change in the future. If you are in any doubt about the impact of tax on your investment you should consult a qualified tax<br />
adviser.<br />
Top Holdings: Top Holdings represent the largest holdings of the fund as of the date indicated. These securities do not represent all of the securities purchased, sold or recommended for<br />
advisory clients, and the reader should not assume that investment in the securities listed was or will be profitable.<br />
Fund Measures: The average credit quality (ACQ) rating may change over time. The portfolio itself has not been rated by an independent rating agency. The letter rating, which may be based<br />
on bond ratings from different agencies, is provided to indicate the average credit rating of the portfolio’s underlying bonds and generally ranges from AAA (highest) to D (lowest). The ACQ is<br />
determined by assigning a sequential integer to all credit ratings AAA to D, taking a simple, asset-weighted average of debt holdings by market value and rounding to the nearest rating. The risk<br />
of default increases as a bond’s rating decreases, so the ACQ provided is not a statistical measurement of the portfolio’s default risk because a simple, weighted average does not measure the<br />
increasing level of risk from lower rated bonds. The ACQ is provided for informational purposes only. Derivative positions and unrated securities are not reflected in the ACQ.<br />
Composition of Fund: Quality ratings shown are assigned by one or more Nationally Recognized Statistical Credit Rating Organizations (’NRSRO’), such as Standard & Poor’s, Moody’s and<br />
Fitch. The ratings are an indication of an issuer’s creditworthiness and typically range from AAA or Aaa (highest) to D (lowest). When ratings from all three agencies are available, the middle<br />
rating is used; when two are available, the lowest rating is used; and when only one is available, that rating is used. Foreign government bonds without a specific rating are assigned the country<br />
rating provided by an NRSRO, if available. The NR category consists of rateable securities that have not been rated by an NRSRO. The N/A category consists of nonrateable securities (e.g.,<br />
equities). Cash and equivalents (defined as bonds with stated maturities, or that can be redeemed at intervals, of seven days or less) as well as derivatives are excluded from this breakdown.<br />
As a result, the chart does not reflect the fund’s total net assets.