mag13.pdf (332 kB) - Acta Metallurgica Slovaca
mag13.pdf (332 kB) - Acta Metallurgica Slovaca
mag13.pdf (332 kB) - Acta Metallurgica Slovaca

You also want an ePaper? Increase the reach of your titles
YUMPU automatically turns print PDFs into web optimized ePapers that Google loves.
<strong>Acta</strong> <strong>Metallurgica</strong> <strong>Slovaca</strong>, 11, 2005, 3 (362 - 368) 362<br />
STATISTICAL COMPARISON OF DIFFERENT METHODS OF CALCULATION<br />
OF PARAMETERS DESCRIBING DYNAMIC RECRYSTALLIZATION<br />
Kubina T. 1 , Schindler I. 1 , Heger M. 1 , Plura J. 1 , Bořuta J. 2 , Dänemark J. 3 , Hadasik E. 4<br />
1 VŠB - Technical University of Ostrava, 17. listopadu 15, 708 33 Ostrava, Czech Republic,<br />
tomas.kubina@vsb.cz<br />
2 VÍTKOVICE - Research & Development, s.r.o., Pohraniční 31, 706 02 Ostrava, Czech<br />
Republic, josef.boruta@vitkovice.cz<br />
3 Třinecké železárny, a. s., Průmyslová 1000, 739 70 Třinec, Czech Republic,<br />
janusz.danemark@trz.cz<br />
4 Politechnika Śląska, Krasińskiego 8, 40-019 Katowice, Poland, eugeniusz.hadasik@polsl.pl<br />
STATISTICKÉ SROVNÁNÍ ROZDÍLNÝCH POSTUPŮ PŘI VÝPOČTU PARAMETRŮ<br />
POPISUJÍCÍCH DYNAMICKOU REKRYSTALIZACI<br />
Kubina T. 1 , Schindler I. 1 , Heger M. 1 , Plura J. 1 , Bořuta J. 2 , Dänemark J. 3 , Hadasik E. 4<br />
1 VŠB – Technická univerzita Ostrava, 17. listopadu 15, 708 33 Ostrava, Czech Republic,<br />
tomas.kubina@vsb.cz<br />
2 VÍTKOVICE - Výzkum a vývoj, s.r.o., Pohraniční 31, 706 02 Ostrava, Česká Republika,<br />
josef.boruta@vitkovice.cz<br />
3 Třinecké železárny, a. s., Průmyslová 1000, 739 70 Třinec, Česká Republika,<br />
janusz.danemark@trz.cz<br />
43 Politechnika Śląska, Krasińskiego 8, 40-019 Katowice, Polsko, eugeniusz.hadasik@polsl.pl<br />
Abstrakt<br />
V současné době program ENERGY 4.0, vyvinutý pro výpočet parametrů<br />
popisujících dynamickou rekrystalizaci (DRX), v sobě zahrnuje dvě metodiky výpočtu. Vstupní<br />
data pocházející z torzního plastometru SETARAM – VÍTKOVICE jsou nejdřív zpracovány<br />
konvenční metodou postupných lineárních regresí. V této fázi jsou vyloučeny teplotní hladiny<br />
při kterých není strukturní stav zkoušené oceli jednofázový. Následující automatický výpočet,<br />
využívající simplexní algoritmus nelineární regrese a, může jednotlivé parametry vyjádřit<br />
mnohem přesněji. Tento výpočet je více objektivnější a dosahuje menší statistické chyby,<br />
výsledné parametry ale ne vždy odpovídají fyzikálním předpokladům. V celkovém množství 22<br />
ocelí různého chemického složení od ocelí jednoduchého strukturního stavu přes mikrolegované<br />
oceli různých typů až k vysocelegovaným ocelím a korozivzdorným austenitickým ocelím.<br />
Klíčovým kritériem pro zařazení do vyhodnocované skupiny ocelí bylo zachování jednofázové<br />
struktury v celé oblasti zkušebních teplot. Máme tak možnost porovnat vliv obou metod na<br />
vypočtené parametry a taktéž přesnost obou metod na určení hodnot maximálního napětí a<br />
deformace v píku.<br />
Abstract<br />
Program ENERGY 4.0, developed for calculation of parameters describing dynamic<br />
recrystallization (DRX), includes now two ways of methodology of calculation. Input data<br />
coming from the torsion plastometer SETARAM - VÍTKOVICE is first processed by a<br />
conventional method of successive linear regressions. In this stage the exclusion of temperature
<strong>Acta</strong> <strong>Metallurgica</strong> <strong>Slovaca</strong>, 11, 2005, 3 (362 - 368) 363<br />
levels is carried out, in which a state featured by one phase of tested steels is not maintained.<br />
The following automatic computation using the simplex algorithm of non-linear regression can<br />
make particular parameters for a description of DRX more precise. Those calculations are<br />
entirely objective and yield in the least statistical errors but their results can not always match up<br />
the physical-based idea. In total 22 steels of different chemical composition - from simple<br />
structural steels, through microalloyed steels of various types, high alloyed tool steels up to<br />
corrosion-resisting (stainless) austenitic steels - were included in the analyzed data set. A key<br />
(decisive) criterion for including in an evaluated group of steels was maintaining of mono-phase<br />
structural state in the whole range of evaluated temperatures of testing. One can compare<br />
influence of both methods on calculated parameters, as well as accuracy of both methods in<br />
determination of values of the maximum stress and peak to strain.<br />
Key words: Activation energy, hot forming, steel, dynamic recrystallization<br />
1. Fundamental theory for description of actiavtion energy<br />
Activation energy Q [J·mol -1 ] is an important material constant dependent on the<br />
chemical composition and microstructure of the hot formed material, deformation behaviour of<br />
which is largely influenced by this variable. Knowledge of its value is very useful, e.g. for<br />
description of dynamic recrystallization kinetics as well as stress-strain curves in continuous<br />
deformation. For finding out the Q-value, it is suitable to use a solution of modified equation [1]:<br />
⎡ − Q ⎤<br />
e & = C. exp⎢<br />
.[ sinh( α.<br />
σ )] n<br />
max<br />
R.<br />
T<br />
⎥<br />
(1)<br />
⎣ ⎦<br />
where ė [s -1 ] is strain rate; C [s -1 ], a [MPa -1 ] and n are other material constants, T [K] is<br />
deformation temperature, R = 8.314 Jmol -1·K -1 , σ max [MPa] is deformation resistance associated<br />
with the peak stress. The traditional way of assessing the constants in Eq. 1 was given e.g. in [1].<br />
The principle lies in the application of specific characteristics of the hyperbolic sine function.<br />
We suppose that Eq. 1 can be converted to the relationship<br />
⎡ − Q ⎤ n<br />
e& = C1 . exp⎢<br />
. σ max<br />
R.<br />
T ⎥ (2)<br />
⎣ ⎦<br />
for low stress values (i.e. a particular high temperature level), or to the relationship<br />
⎡ − Q ⎤<br />
e& = C2 . exp⎢<br />
.exp( β.<br />
σ max )<br />
.<br />
⎥<br />
(3)<br />
⎣ R T ⎦<br />
for high stress values (i.e. a selected low temperature level). The constants n and β can be gained<br />
when applying Eqs. 2 and 3, respectively. The key constant β enables to find the α-value,<br />
assuming that α = β / n.<br />
2. Calculation DRX parameters by software ENERGY 4.0<br />
2.1 System of Linear Regressions<br />
The above mentioned equations can be solved by a graphic method using multiple<br />
linear regression analysis. The computing program ENERGY 4.0 was developed (in language
<strong>Acta</strong> <strong>Metallurgica</strong> <strong>Slovaca</strong>, 11, 2005, 3 (362 - 368) 364<br />
Delphi) [2,3] which has made more sophisticated work with the input data set possible. Such<br />
data table can be obtained from continuous torsion tests. In every row of that table, the<br />
calculated peak stress σ max [MPa] and strain to peak e p are given, depending on temperature and<br />
strain rate of individual torsion tests. Initially the experimental data is processed step-by-step<br />
using partial linear regressions after plotting the selected points in proper co-ordinates:<br />
• first the n-value is obtained as a slope of the regression line in co-ordinates ln σ - ln ė (a<br />
high temperature level);<br />
• then the β-value is determined in coordinates σ - ln ė (a low temperature level);<br />
• after calculation of the α-value, the final regression in complex co-ordinates 1/T – (ln ė<br />
- n·sinh(α·σ)) is realized utilizing all experimental data, and thus the constants Q and C<br />
can be obtained. Principles of work with the ENERGY 4.0 are described in work [4].<br />
2.2 Refining Calculations Using the Simplex Algorithm<br />
After elimination of the unfitting data, software Energy 4.0 enables to refine the<br />
calculations described above. Constants in Eq. 1 are determined by a non-linear regression<br />
considering two mutually independent variables - temperature and strain rate. The nonderivation<br />
methods of searching the extreme of proper function exhibited the best stability as<br />
well as agility of computation. Thus the simplex algorithm was adopted which gave results (i.e.<br />
values Q, C, a and n) in a few seconds [3]. Those calculations are entirely objective and yield in<br />
the least statistical errors but their results can not always match up the physical-based idea.<br />
Discussion of the results from both ways of calculation is included in part 3.<br />
2.3 Kinetics of Dynamic Recrystallization<br />
Peak strain e p is approximately linked up with the initiation of dynamic<br />
recrystallization. The e p -value depends very simply on the Zener-Hollomon's parameter Z [s -1 ]<br />
[5,6]:<br />
e<br />
p<br />
w<br />
= u ⋅ Z<br />
(4)<br />
The parameter Z involves the Q-value that represents the material factor (chemical<br />
composition, structure, etc.). It can be defined as the temperature-corrected strain rate [7]:<br />
⎛ Q ⎞<br />
Z = é ⋅exp ⎜ ⎟<br />
(5)<br />
⎝ R ⋅T<br />
⎠<br />
where T [K] is deformation temperature.<br />
ENERGY 4.0 using linear regression of Eq. 4 in logarithmic formulation computes<br />
constants u and w. These are determined in either case of previous calculations.<br />
3. Statistic evaluation of both computation methods<br />
Input data for calculation of kinematics of the dynamic recrystallization was measured<br />
on the torsion plastometer SETARAM. In total 22 steels of different chemical composition -<br />
from simple structural steels, through microalloyed steels of various types, high alloyed tool<br />
steels up to corrosion-resisting (stainless) austenitic steels - were included in the analyzed data<br />
set. Chemical composition of these steels is given in Tab. 1. A key (decisive) criterion for
<strong>Acta</strong> <strong>Metallurgica</strong> <strong>Slovaca</strong>, 11, 2005, 3 (362 - 368) 365<br />
including in an evaluated group of steels was maintaining of mono-phase structural state in the<br />
whole range of evaluated temperatures of testing.<br />
Table 1 Target chemical composition of tested steels in wt. %<br />
11375 0.10 C – 0.29 Mn – 0.15 Si – 0.05 Al<br />
11523 0.18 C – 1.10 Mn – 0.54 Si – 0.05 Al<br />
Free-Cutting 0.13 C – 1.45Mn – 0.03 Si – 0.30 S<br />
X52<br />
0.10 C – 1.25 Mn – 0.35 Si – 0.02 Nb<br />
X60<br />
0.11 C – 1.36 Mn – 0.29 Si – 0.04 Nb<br />
X70<br />
0.10 C – 1.40 Mn – 0.39 Si – 0.04 V – 0.02 Nb<br />
X80<br />
0.09 C – 2.04 Mn – 0.57 Si – 0.23 Mo – 0.04 V – 0.03 Nb<br />
S700MC 0.12 C – 1.76 Mn – 0.53 Si – 0.14 V – 0.03 Nb – 0.003 B<br />
WB36<br />
0.16 C – 1.10 Mn – 0.40 Si – 0.52 Cu – 1.18 Ni – 0.21 Cr – 0.36 Mo – 0.03 Nb<br />
11MnSi6 0.084 C – 1.40 Mn – 0.86 Si<br />
23MnB4 0.22 C – 0.91 Mn – 0.07 Si – 0.28 Cr – 0.003 B<br />
14209 0.98 C – 1.04 Mn – 0.51 Si – 1.49 Cr<br />
15260 0.50 C – 0.80 Mn – 0.35 Si – 1.07 Cr<br />
SA387GR11 0.17C – 0.57 Mn – 0.53 Si – 0.36 Ni – 1.44 Cr – 0.59 Mo<br />
SiCrMoCu 0.23 C – 1.06 Mn – 1.00 Si – 0.16 Cu – 1.31 Cr – 0.31 Mo<br />
Superferrite 0.01 C – 0.51 Mn – 0.49 Si – 0.50 Ni –17.42 Cr – 3.8 Mo – 0.03 V – 0.07 Al – 0.07 Nb<br />
CrNi<br />
0.06 C – 0.69 Mn – 0.47 Si – 9.7 Ni – 17.2 Cr – 0.57 Mo<br />
CrMn<br />
0.48 C – 16.6 Mn – 0.57 Si – 0.27 Ni – 15.4 Cr<br />
5H17G17 0.50 C – 17.1 Mn – 0.57 Si – 16.7 Cr<br />
CrNiMo 0.02C – 0.67 Mn – 0.52 Si – 15.0 Ni – 18.1 Cr – 5.9 Mo<br />
CrNiMoN 0.03 C – 1.56 Mn – 0.52 Si – 5.35 Ni – 22.4 Cr – 2.7 Mo – 0.06 V –0.192 N<br />
19830 0.81 C – 0.23 Mn – 0.27 Si – 0.25 Ni – 4.03 Cr – 4.4 Mo – 2.03 V –5.37 W – 1.01 Co<br />
3.1 Calculated parameters describing DRX<br />
The first of statistic results is a mean deviation ∆ for activation energy Q defined as<br />
follows:<br />
m<br />
∑<br />
M<br />
A<br />
Qi<br />
− Qi<br />
i=<br />
1<br />
∆Q<br />
=<br />
(6)<br />
m<br />
where upper index M means a value calculated by means of a system of linear regressions, index<br />
A is used for designation of the automatic simplex method of calculation. The results for specific<br />
parameters are summarized in Tab. 2.<br />
Table 2 Summary of statistic results<br />
Parameter ∆ T-test Correlation<br />
Mean value P-value<br />
Correlation<br />
coefficient r<br />
P-value<br />
Q -29.467 0.0020 0.9641 0.0000<br />
α -0.524 0.2780 0.5600 0.0082<br />
n 0.00074 0.0047 0.669 0.0010<br />
logC -1.077 0.0019 0.906 0.0000<br />
u 0.0006 0.0290 0.999 0.0000<br />
w 0.0085 0.00002 0.995 0.0000<br />
Further t-test was carried out for the case of a difference between dual values. Here<br />
statistical significance of the difference between values gained by linear regression and
<strong>Acta</strong> <strong>Metallurgica</strong> <strong>Slovaca</strong>, 11, 2005, 3 (362 - 368) 366<br />
automatic computation was monitored. It was tested whether the difference between these values<br />
equals zero for significance level α = 0,05. The less is the achieved significance level, so called<br />
P-value, the more unmaintainable, i.e. less credible, is the null hypothesis. The last test consisted<br />
in determination of correlation between both ways of calculation, again on the significance level<br />
α = 0,05. The values of correlation coefficient and P-value are shown in Tab. 2.<br />
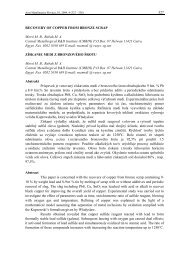
From the values in Tab. 2 and a graphic expression of relations between values<br />
obtained for both methods of calculation (see Fig. 1) we can define the following conclusions.<br />
The activation energy Q has always been evaluated by the automatic simplex method in smaller<br />
values. The same is given for parameter α and a logarithmic value of coefficient C. From the t-<br />
test follows that a difference between parameters is statistically significant in the case of all<br />
parameters monitored, except for parameter α. More significant is here a comparison of<br />
correlation between both computational methods. In case of parameter α and n the correlation is<br />
less significant, which results from a limitation of the method that uses a system of linear<br />
equations where these parameters are numbered for selected temperature levels and affected by a<br />
small number of points used for calculation. High values of the correlation coefficient in case of<br />
parameters u and w can be attributed to the fact that the calculation is based on values of<br />
activation energy Q which sufficiently correlate between each other.<br />
Fig.1 Relationships between constants Q, n, a, C calculated by the multiple linear regression (upper index M) and nonlinear<br />
simplex method (upper index A)
<strong>Acta</strong> <strong>Metallurgica</strong> <strong>Slovaca</strong>, 11, 2005, 3 (362 - 368) 367<br />
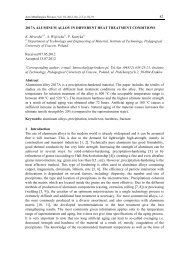
3.2 Comparison between measured and calculated values σ max and e p<br />
Relative deviations σ M max and σ A max from measured values of maximum stress of<br />
deformation σ max are positive and negative for both ways of calculation, their distribution is<br />
approximately symmetrical. In Fig. 2 is shown that ion case of automatic calculation the relative<br />
deviations from the value σ max are shifted to negative values. The arithmetic mean for relative<br />
deviations between the maximum stress of deformation calculated manually and the measured<br />
maximum stress of deformation equals 0.104 %.<br />
Correlation between measured and calculated values of the maximum stress is better<br />
for the automatic way of calculation (correlation coefficient r = 0.9969) than for the manual way<br />
of calculation (r = 0.9956). The same situation is in the case of variance (S M = 19369 against<br />
S A = 13343).<br />
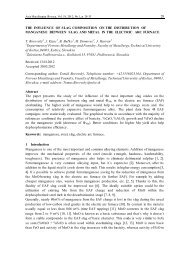
When similar results for a size of strain to peak are compared, it is found out that the<br />
distribution of relative deviations for both methods of calculation is approximately symmetrical<br />
(see Fig. 3). The correlation between calculated and measured values of strain to peak is in both<br />
cases less significant than for the maximum stress. Correlation coefficient r = 0.9714 is exactly<br />
the same for both methods of calculation. The variance values are only slightly different, for<br />
manual calculation a value of S M = 1.2098, for automatic computation S A = 1.2118.<br />
Fig.2 Histograms for distribution rate of relative<br />
deviations of maximum stress for manual (M)<br />
and automatic (A) calculation<br />
Fig.3 Histograms for distribution rate of relative<br />
deviations of strain to peak for manual (M)<br />
and automatic (A) calculation<br />
4. Conclusions<br />
Software ENERGY 4.0 developed in environment Delphi makes it possible to<br />
calculate the activation energy in hot forming, together with other parameters necessary for<br />
description of maximum stress of deformation and strain to peak necessary for the start of<br />
dynamic recrystallization by means of the given equations.<br />
Parameters defining DRX were calculated in two ways, based on the same set of input<br />
data. A conventional way of the multiple linear regression in combination with interactive work<br />
in ENERGY 4.0 enabled that temperature regions with signs of phase transformations could be
<strong>Acta</strong> <strong>Metallurgica</strong> <strong>Slovaca</strong>, 11, 2005, 3 (362 - 368) 368<br />
eliminated. The non-linear regression using simplex algorithm is very fast and gives more<br />
accurate results for the whole group of evaluated steels [8]. It is more advantageous as far as<br />
numbering of constants for calculation of maximum deformation resistance is concerned. As for<br />
accuracy of the strain to peak determination, both methods are comparable.<br />
The difference between methods is in approach to the parameters entering the<br />
equations. In case of use of the multiple linear regression the values of activation energy are in<br />
the foreseen conventional limits. When the non-linear regression is used, the activation energy<br />
for steel grades 23MnB4, 11523, 14209 is even below the value of activation energy for autodiffusion<br />
of iron 270 kJ.mol-1. Then the activation energy loses its physical essence [9,10] and it<br />
becomes only one of material constants. However, the result consists in a desirable decreased<br />
difference between measured and predicted data [e p ;σ max ].<br />
Acknowledgement<br />
This work was carried out under project number MSM 6198910015, funded by the<br />
Ministry of Education, Youth and Sports of the Czech Republic.<br />
Literature<br />
[1] Sellars C. M., Tegart W. J. McG.: International <strong>Metallurgica</strong>l Review, 1972, No. 158, p. 1.<br />
[2] Kopetschke I., Schindler I.: Transactions of the Institute of Mining and Metallurgy of<br />
Ostrava, <strong>Metallurgica</strong>l Series, 1991, No. 1, p. 229.<br />
[3] Podstuvka D.: Diploma thesis. VŠB - Technical University of Ostrava, Faculty of<br />
Metallurgy and Materials Engineering, 2003.<br />
[4] Schindler I., Podstuvka D., Bořuta J.: In: CO-MAT-TECH 2003, Trnava 2003, p. 925.<br />
[5] Kliber J. et al.: Steel research, 1989, No. 11, p. 503.<br />
[6] Schindler I., Kliber J., Bořuta J.: In: METAL '94. Ostrava 1994, p. 132.<br />
[7] Treatise on Materials Science and Technology. Vol. 6 - Plastic Deformation of Materials.<br />
Ed. Arsenault R. J., Academic Press, New York 1975.<br />
[8] Kubina T. et al: In: FORMING 2005. Lednice 2005, p. 145.<br />
[9] Kliber J., Schindler I., Bořuta J.: In: PLAST '96. Ustroń 1996, p. 17.<br />
[10] Gronostajski Z. J.: ibid., p. 23.