Annual Report - The European Equity Fund, Inc. - DWS Investments
Annual Report - The European Equity Fund, Inc. - DWS Investments
Annual Report - The European Equity Fund, Inc. - DWS Investments

Create successful ePaper yourself
Turn your PDF publications into a flip-book with our unique Google optimized e-Paper software.
SUMMARY OF GENERAL INFORMATION<br />
THE FUND<br />
<strong>The</strong> <strong>European</strong> <strong>Equity</strong> <strong>Fund</strong>, <strong>Inc</strong>. (the “<strong>Fund</strong>”) is a diversified,<br />
actively-managed closed-end fund listed on the New York<br />
Stock Exchange under the symbol “EEA.” <strong>The</strong> <strong>Fund</strong> seeks<br />
long-term capital appreciation primarily through investment<br />
in <strong>European</strong> equities. It is advised and administered by<br />
wholly owned subsidiaries of the Deutsche Bank Group.<br />
SHAREHOLDER INFORMATION<br />
Prices for the <strong>Fund</strong>’s shares are published weekly in the<br />
New York Stock Exchange Composite Transactions section<br />
of certain newspapers. Net asset value and market price<br />
information are published each Saturday in Barron’s and<br />
other newspapers in a table called “Closed End <strong>Fund</strong>s.”<br />
Daily information on the <strong>Fund</strong>’s net asset value is available<br />
from NASDAQ (symbol XEEAX). It is also available by<br />
calling: 1-800-349-4281 (in the U.S.) or 00-800-2287-2750<br />
(outside of the U.S.). In addition, a schedule of the <strong>Fund</strong>’s<br />
largest holdings, dividend data and general shareholder<br />
information may be obtained by calling these numbers.<br />
<strong>The</strong> foregoing information is also available on our web<br />
site: www.dws-investments.com.<br />
<strong>The</strong>re are three closed-end funds investing in<br />
<strong>European</strong> equities advised and administered by<br />
wholly owned subsidiaries of the Deutsche Bank<br />
Group:<br />
• <strong>The</strong> <strong>European</strong> <strong>Equity</strong> <strong>Fund</strong>, <strong>Inc</strong>.—investing primarily in equity<br />
or equity-linked securities of companies domiciled<br />
in countries utilizing the euro currency (with normally at<br />
least 80% in securities of issuers in such countries).<br />
• <strong>The</strong> New Germany <strong>Fund</strong>, <strong>Inc</strong>.—investing primarily in equity<br />
or equity-linked securities of middle market German companies<br />
with up to 20% in other Western <strong>European</strong> companies<br />
(with no more than 15% in any single country).<br />
• <strong>The</strong> Central Europe, Russia and Turkey <strong>Fund</strong>, <strong>Inc</strong>.—investing<br />
primarily in equity or equity-linked securities of issuers<br />
domiciled in Central Europe, Russia and Turkey (with normally<br />
at least 80% in securities of issuers in such countries).<br />
Please consult your broker for advice on any of the above or<br />
call 1-800-349-4281 (in the U.S.) or 00-800-2287-2750<br />
(outside of the U.S.). for shareholder reports.<br />
<strong>The</strong> <strong>European</strong> <strong>Equity</strong> <strong>Fund</strong>, <strong>Inc</strong>. is diversified and primarily<br />
focuses its investments in equity securities of issuers domiciled<br />
in <strong>European</strong> countries that utilize the euro currency,<br />
thereby increasing its vulnerability to developments in that region.<br />
Investing in foreign securities presents certain risks, such<br />
as currency fluctuations, political and economic changes, and<br />
market risks. Any fund that concentrates in a particular segment<br />
of the market will generally be more volatile than a fund<br />
that invests more broadly.<br />
<strong>The</strong> <strong>European</strong><br />
<strong>Equity</strong> <strong>Fund</strong>, <strong>Inc</strong>.<br />
<strong>Annual</strong> <strong>Report</strong><br />
December 31, 2013
<strong>The</strong> <strong>European</strong><br />
<strong>Equity</strong> <strong>Fund</strong>, <strong>Inc</strong>.<br />
LETTER TO THE SHAREHOLDERS<br />
Dear Shareholder,<br />
For the 12 months ended December 31, 2013, the<br />
<strong>European</strong> <strong>Equity</strong> <strong>Fund</strong>’s (the “<strong>Fund</strong>”) total return in U.S.<br />
dollars (“USD”) was 25.03% based on net asset value<br />
(“NAV”) and 27.17% based on market price. During the<br />
same period, the total return in USD of the <strong>Fund</strong>’s benchmark,<br />
the MSCI-EMU Index, was 28.93%. 1<br />
Performance for <strong>European</strong> equity markets as a whole, as<br />
measured by the MSCI-EMU Index, did not improve until<br />
the second half of the year. <strong>The</strong> first quarter was marked by<br />
a political standstill in Italy, a disappointing recovery in<br />
France, the shaky bailout plan for Cyprus and unsatisfactory<br />
economic data across Europe. <strong>The</strong>re was little improvement<br />
in the second quarter as investors focused on<br />
signals that the U.S. Federal Reserve Board (the Fed) would<br />
start tapering its quantitative easing program and on worries<br />
over a cash crunch in the Chinese financial system. 2<br />
<strong>The</strong> <strong>European</strong> Central Bank’s (“ECB”) first key interestrate<br />
cut for the year was 25 basis points in May 2013, which<br />
likely triggered the initial change in sentiment for <strong>European</strong><br />
investors. Subsequently, the third quarter resulted in the<br />
strongest equity market performance for the year.<br />
Political developments supported equity markets during<br />
the second half of the year. In Italy, Prime Minister Enrico<br />
Letta survived a confidence vote and the Senate expelled<br />
former prime minister Silvio Berlusconi. In Germany,<br />
politicians agreed on the long-awaited coalition deal between<br />
the country’s two major parties. <strong>The</strong> ECB also provided<br />
another positive catalyst for equity markets in the<br />
fourth quarter, as it unexpectedly cut its key interest rate to<br />
0.25% from 0.50% in November 2013 and extended its full<br />
liquidity operations until mid-2015. Statements from the<br />
ECB indicated the institution was considering the implementation<br />
of negative interest rates and/or the purchase of<br />
assets from banks, if needed, in order to lift inflation in the<br />
Eurozone as it fell to a four-year low of 0.7%. 3<br />
Two and a half years ago, we changed the investment<br />
strategy of the <strong>Fund</strong> to our more defensive “stability” strategy,<br />
with the goal of achieving market returns over a cycle<br />
with much lower volatility throughout the cycle. It was our<br />
observation that more stable returns are rewarded by<br />
closed-end fund investors with lower discounts.<br />
Given the conservative orientation of the <strong>Fund</strong>’s "stability"<br />
strategy, targeting a volatility of returns below that of<br />
the market, the portfolio performed well in the first half of<br />
the year ending December 31, 2013, achieving what it was<br />
designed to do: to outperform its benchmark during weak<br />
market phases (i.e. it is expected to fall less than the market),<br />
targeting a lower volatility. While the portfolio did not<br />
outperform its benchmark during the market run-up in the<br />
second half of the year, the <strong>Fund</strong>’s year-end performance<br />
was well above the 80% participation rate targeted under<br />
the strategy (i.e. the fund's performance was better than<br />
80% of the benchmark performance). Stock selection for<br />
the portfolio is classified into three buckets: high quality,<br />
value, and growth. <strong>The</strong> focus on high-quality stocks, while<br />
already reduced, detracted from performance in the final<br />
quarter. Portfolio management had previously undertaken a<br />
shift of focus, away from high quality stocks and more decidedly<br />
into value stocks. While the <strong>Fund</strong> employs a strict<br />
stock-picking strategy, country and sector weights are actively<br />
monitored.<br />
From a country perspective, the biggest contributors to<br />
performance were positions in the Netherlands and Spain.<br />
<strong>The</strong> Netherlands was driven mainly by a position in PostNL,<br />
which returned 94.8% since June 2013. Spain included two<br />
property and casualty insurance holdings that returned close<br />
to 55% on average, and a construction company that returned<br />
close to 45%. <strong>The</strong> biggest detractors to performance<br />
For additional information about the <strong>Fund</strong> including performance, dividends, presentations, press releases,<br />
market updates, daily NAV and shareholder reports, please visit www.dws-investments.com<br />
1
LETTER TO THE SHAREHOLDERS (continued)<br />
were DAX options purchased for the <strong>Fund</strong> to provide downside<br />
protection, in addition to an overweight position in<br />
Germany and an underweight in France. 4,5 From a sector perspective,<br />
the <strong>Fund</strong>’s overweight in consumer discretionary<br />
and information technology contributed most to performance,<br />
while the materials and health care sectors, both underweighted,<br />
were the biggest detractors.<br />
<strong>The</strong> <strong>Fund</strong>’s discount to NAV averaged 9.86% for the full<br />
year 2013, compared with 10.03% for the same period a<br />
year earlier. For the three months ended December 31,<br />
2013, the discount was 9.19%, compared with 10.21% for<br />
the same quarter a year earlier.<br />
Economic and Market Overview<br />
For 2014, we remain positive on <strong>European</strong> equity markets<br />
despite the run-up in valuations. Valuations based<br />
solely on company earnings can no longer be considered<br />
inexpensive. <strong>The</strong> year 2013 was a year of price/earnings<br />
multiple expansion given that earnings did not improve in<br />
Europe. In 2014 we expect earnings growth to be the primary<br />
driver of stock market returns. In this regard, Europe<br />
offers considerable catch-up potential vs. the United States.<br />
Investor sentiment is not excessive and investments into<br />
<strong>European</strong> equities only started to improve approximately<br />
six months ago, causing the <strong>European</strong> equity markets to<br />
rise significantly in the second half of the year.<br />
Risks ahead include the pace of structural reforms in<br />
countries such as Italy and France, both of which need to<br />
increase their pace. A failure to do so would pose a risk to<br />
a sustained recovery in Europe. Additionally, the risk of a<br />
renewed slowdown or financial crisis in China poses a considerable<br />
risk to many of our <strong>European</strong> portfolio holdings.<br />
Sincerely,<br />
Christian Strenger Rainer Vermehren Brian Binder<br />
Chairman Lead Portfolio Manager President and Chief<br />
Executive Officer<br />
<strong>The</strong> views expressed in the preceding discussion reflect<br />
those of the portfolio management team only through the<br />
end of the period of the report as stated on the cover. <strong>The</strong><br />
management team’s views are subject to change at any time<br />
based on market and other conditions and should not be<br />
construed as recommendations. Past performance is no<br />
guarantee of future results. Current and future portfolio<br />
holdings are subject to risk.<br />
1<br />
<strong>The</strong> MSCI-EMU Index is an unmanaged capitalization-weighted index<br />
that comprises approximately 300 stocks of companies domiciled in the<br />
countries utilizing the euro currency. MSCI indices are calculated using<br />
closing local market prices and translate into U.S. dollars using the<br />
London close foreign exchange rates. Index returns assume reinvestment<br />
of dividends and, unlike fund returns, do not reflect any fees or expenses.<br />
It is not possible to invest directly in the MSCI-EMU Index.<br />
2<br />
Quantitative easing entails the Fed’s purchase of government and other<br />
securities from the market in an effort to increase money supply.<br />
3<br />
<strong>The</strong> Eurozone refers to a currency union among the 17 members of the<br />
<strong>European</strong> Union states that have adopted the euro as their sole currency.<br />
4<br />
Dax options give the holder the right to buy or sell for a specified price<br />
based on the DAX Stock Index, which is a total-rate-of-return index of<br />
30 selected German blue chip stocks traded on the Frankfurt Stock<br />
Exchange.<br />
5<br />
“Underweight” means the <strong>Fund</strong> holds a lower weighting in a given sector<br />
or security than the benchmark. “Overweight” means the <strong>Fund</strong> holds<br />
a higher weighting.<br />
For additional information about the <strong>Fund</strong> including performance, dividends, presentations, press releases,<br />
market updates, daily NAV and shareholder reports, please visit www.dws-investments.com<br />
2
PERFORMANCE SUMMARY AS OF DECEMBER 31, 2013<br />
All performance shown is historical, assumes reinvestment of all dividend and capital gain distributions, and does not<br />
guarantee future results. Investment return and principal value fluctuate with changing market conditions so that,<br />
when sold, shares may be worth more or less than their original cost. Current performance may be lower or higher<br />
than the performance data quoted. Please visit www.dws-investments.com for the <strong>European</strong> <strong>Equity</strong> <strong>Fund</strong>’s (the<br />
“<strong>Fund</strong>”) most recent performance.<br />
TOTAL RETURNS:<br />
For the years ended December 31,<br />
2013 2012 2011 2010 2009<br />
Net Asset Value (a) . . . . . . . . . . . . . . . . . . . . . 25.03% 21.17% (17.52)% 1.99% 33.76%<br />
Market Value (a) . . . . . . . . . . . . . . . . . . . . . . . . 27.17% 23.44% (21.56)% 8.32% 36.84%<br />
Benchmark (b) . . . . . . . . . . . . . . . . . . . . . . . . . 28.93% 21.17% (17.64)% (4.25)% 31.41%<br />
(a)<br />
Total return based on net asset value reflects changes in the <strong>Fund</strong>’s net asset value during each period. Total return based<br />
on market value reflects changes in market value during each period. Each figure includes reinvestments of dividend and<br />
capital gain distributions, if any. <strong>The</strong>se figures will differ depending upon the level of any discount from or premium to<br />
net asset value at which the <strong>Fund</strong>’s shares trade during the period. Expenses of the <strong>Fund</strong> include investment advisory and<br />
administration fees and other fund expenses. Total returns shown take into account these fees and expenses. <strong>The</strong> annual<br />
expense ratio of the <strong>Fund</strong> for the year ended December 31, 2013 was 1.61%.<br />
(b)<br />
<strong>The</strong> MSCI-EMU Index is an unmanaged, capitalization-weighted index that is comprised of approximately 300 stocks of<br />
companies domiciled in the countries utilizing the euro currency. MSCI indices are calculated using closing local market<br />
prices and translate into U.S. dollars using the London close foreign exchange rates.<br />
Index returns assume reinvestment of dividends and, unlike <strong>Fund</strong> returns, do not reflect any fees or expenses. It is not possible to invest directly in the<br />
MSCI-EMU Index.<br />
<strong>Investments</strong> in funds involve risks, including the loss of principal.<br />
This <strong>Fund</strong> is diversified and primarily focuses its investments in equity securities of issuers domiciled in <strong>European</strong> countries<br />
that utilize the euro currency, thereby increasing its vulnerability to developments in that region. Investing in foreign<br />
securities presents certain risks, such as currency fluctuations, political and economic changes, and market risks. Any fund<br />
that concentrates in a particular segment of the market will generally be more volatile than a fund that invests more broadly.<br />
<strong>The</strong> shares of most closed-end funds, including the <strong>Fund</strong>, are not continuously offered. Once issued, shares of closed-end<br />
funds are bought and sold in the open market. Shares of closed-end funds frequently trade at a discount to net asset value.<br />
<strong>The</strong> price of the <strong>Fund</strong>’s shares is determined by a number of factors, several of which are beyond the control of the <strong>Fund</strong>.<br />
<strong>The</strong>refore, the <strong>Fund</strong> cannot predict whether its shares will trade at, below, or above net asset value.<br />
<strong>The</strong> <strong>Fund</strong> elected to be subject to the statutory calculation, notification and publication requirements of the German<br />
Investment Tax Act (<strong>Investments</strong>teuergesetz) (the “Act”) for the fiscal year ended December 31, 2013 and intends to elect<br />
to be subject to the Act for the fiscal year ending December 31, 2014. This election allows investors based in Germany to<br />
invest in the <strong>Fund</strong> without adverse tax consequences.<br />
3
FUND FACTS AND DIVIDEND AND CAP GAIN DISTRIBUTIONS AS OF DECEMBER 31, 2013<br />
FUND FACTS:<br />
Net Assets . . . . . . . . . . . . . . . . . . . . . . . . . . . . . . . . . . . . . . . . . . . . . . . . . . . . . . . . . . . . . . . . . . . . . . . . . . $94,468,168<br />
Shares Outstanding . . . . . . . . . . . . . . . . . . . . . . . . . . . . . . . . . . . . . . . . . . . . . . . . . . . . . . . . . . . . . . . . . . . 9,652,610<br />
Net Asset Value (NAV) Per Share . . . . . . . . . . . . . . . . . . . . . . . . . . . . . . . . . . . . . . . . . . . . . . . . . . . . . . . . $9.79<br />
OTHER INFORMATION:<br />
NYSE Ticker Symbol . . . . . . . . . . . . . . . . . . . . . . . . . . . . . . . . . . . . . . . . . . . . . . . . . . . . . . . . . . . . . . . . . EEA<br />
NASDAQ Symbol . . . . . . . . . . . . . . . . . . . . . . . . . . . . . . . . . . . . . . . . . . . . . . . . . . . . . . . . . . . . . . . . . . . . XEEAX<br />
Dividend Reinvestment Plan . . . . . . . . . . . . . . . . . . . . . . . . . . . . . . . . . . . . . . . . . . . . . . . . . . . . . . . . . . . .<br />
Yes<br />
Voluntary Cash Purchase Program . . . . . . . . . . . . . . . . . . . . . . . . . . . . . . . . . . . . . . . . . . . . . . . . . . . . . . .<br />
Yes<br />
<strong>Annual</strong> Expense Ratio (12/31/13) . . . . . . . . . . . . . . . . . . . . . . . . . . . . . . . . . . . . . . . . . . . . . . . . . . . . . . . 1.61%<br />
<strong>Fund</strong> Facts and expense ratio are subject to change.<br />
DIVIDEND AND CAPITAL GAIN DISTRIBUTIONS:*<br />
Record Payable Ordinary ST Capital LT Capital Total<br />
Date Date <strong>Inc</strong>ome Gain Gain Distribution<br />
12/31/12 01/28/13** . . . . . . . . . . . . . . . $0.1520 $0.0000 $0.0000 $0.1520<br />
05/21/12 06/22/12 . . . . . . . . . . . . . . . . . $0.1350 $0.0000 $0.0000 $0.1350<br />
05/19/11 05/31/11 . . . . . . . . . . . . . . . . . $0.0080 $0.0000 $0.0000 $0.0080<br />
12/31/10 01/28/11** . . . . . . . . . . . . . . . $0.0450 $0.0000 $0.0000 $0.0450<br />
04/30/10 05/10/10 . . . . . . . . . . . . . . . . . $0.0103 $0.0000 $0.0000 $0.0103<br />
12/31/09 01/28/10** . . . . . . . . . . . . . . . $0.0996 $0.0000 $0.0000 $0.0996<br />
05/11/09 06/05/09 . . . . . . . . . . . . . . . . . $0.2340 $0.0000 $0.0000 $0.2340<br />
05/06/08 05/15/08 . . . . . . . . . . . . . . . . . $0.0000 $0.1235 $0.4030 $0.5265<br />
12/21/07 12/31/07 . . . . . . . . . . . . . . . . . $0.0000 $0.0000 $1.0000 $1.0000<br />
05/03/07 05/15/07 . . . . . . . . . . . . . . . . . $0.2500 $0.0000 $0.0000 $0.2500<br />
12/21/06 12/28/06 . . . . . . . . . . . . . . . . . $0.2900 $0.0000 $0.0000 $0.2900<br />
05/05/06 05/15/06 . . . . . . . . . . . . . . . . . $0.0900 $0.0000 $0.0000 $0.0900<br />
12/22/05 12/30/05 . . . . . . . . . . . . . . . . . $0.0600 $0.0000 $0.0000 $0.0600<br />
12/22/04 12/31/04 . . . . . . . . . . . . . . . . . $0.0250 $0.0000 $0.0000 $0.0250<br />
05/06/04 05/14/04 . . . . . . . . . . . . . . . . . $0.0390 $0.0000 $0.0000 $0.0390<br />
11/19/02 11/29/02 . . . . . . . . . . . . . . . . . $0.0100 $0.0000 $0.0000 $0.0100<br />
11/19/01 11/29/01 . . . . . . . . . . . . . . . . . $0.0600 $0.0000 $0.0000 $0.0600<br />
09/03/01 09/17/01 . . . . . . . . . . . . . . . . . $0.0000 $0.0000 $0.0200 $0.0200<br />
Distributions are historical, will fluctuate and are not guaranteed. Distributions do not include return of capital or other nonincome<br />
sources.<br />
* This <strong>Fund</strong> posts estimated capital gain information to its web site: www.dws-investments.com.<br />
** Although this distribution was payable in January, it may have been taxable in the prior year.<br />
4
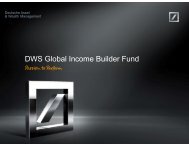
SECTOR DIVERSIFICATION AS OF DECEMBER 31, 2013 (As a % of <strong>Equity</strong> Securities)<br />
Health Care (4.7%)<br />
Telecommunication Services (6.0%)<br />
Energy (2.9%)<br />
Utilities (2.4%)<br />
Financials (21.5%)<br />
Consumer Staples (7.3%)<br />
Materials (8.9%)<br />
Consumer Discretionary (19.6%)<br />
Information Technology (10.8%)<br />
Industrials (15.9%)<br />
10 LARGEST EQUITY HOLDINGS AS OF DECEMBER 31, 2013 (27.7%, as a % of Net Assets)<br />
1. Daimler (Germany) 3.3%<br />
2. Sampo (Finland) 2.9%<br />
3. Allianz (Germany) 2.9%<br />
4. EADS (Netherlands) 2.8%<br />
5. Axel Springer (Germany) 2.7%<br />
6. Henkel & Co. (Germany) 2.7%<br />
7. Zodiac Aerospace (France) 2.6%<br />
8. Siemens (Germany) 2.6%<br />
9. Societe Generale (France) 2.6%<br />
10. Imerys (France) 2.6%<br />
Sector Diversification and 10 Largest <strong>Equity</strong> Holdings are subject to change and not indicative of future portfolio composition.<br />
For more complete details about the <strong>Fund</strong>’s Schedule of <strong>Investments</strong>, see page 12.<br />
Following the <strong>Fund</strong>’s fiscal first and third quarter-ends, a complete portfolio holdings listing is filed with the SEC on<br />
Form N-Q. This form is available on the SEC’s web site at www.sec.gov, and it also may be reviewed and copied at the<br />
SEC’s Public Reference Room in Washington, D.C. Information on the operation of the SEC’s Public Reference Room may<br />
be obtained by calling (800) SEC-0330. A complete list of the <strong>Fund</strong>’s portfolio holdings and the <strong>Fund</strong>’s sector breakdown<br />
compared to that of its benchmark as of the month end is posted on www.dws-investments.com on or after the last day of<br />
the following month. More frequent postings of portfolio holdings information may be made from time to time on<br />
www.dws-investments.com.<br />
5
INTERVIEW WITH PORTFOLIO MANAGEMENT TEAM — RAINER VERMEHREN AND<br />
GERD KIRSTEN<br />
Question: What is Europe’s role within the global<br />
economy for 2014<br />
Answer: Five and a half years after the onset of the<br />
global economic and financial crisis, we believe the global<br />
economy should start to post trend below-trend growth for<br />
the global economy of 3.5% to 4% again in 2014.<br />
Following several years during which hopes of an economic<br />
upturn in Europe have been dashed, two major drivers<br />
may finally affect the awaited turnaround for the<br />
Eurozone economy. First, fiscal policy in the Eurozone is<br />
generating little drag. <strong>The</strong> <strong>European</strong> Central Bank’s<br />
(“ECB”) commitment to provide potentially unlimited support<br />
in the problem countries has slowed the pace of fiscal<br />
consolidation slightly. In 2014 the structural deficit is likely<br />
to be trimmed by only about a quarter of a percentage point<br />
of gross domestic product (“GDP”). Second, individual<br />
countries have made progress towards a banking union,<br />
consolidating their banking systems, in no small measure,<br />
with an eye on the ECB’s comprehensive assessment of<br />
their major banks in 2014. This could relieve the pressure<br />
on banks to boost their capital ratios, which should also<br />
lead to a stabilization of lending. This would further relieve<br />
the negative cyclical impact of fiscal policy. <strong>The</strong>se factors,<br />
combined with a further pickup of the U.S. economy, a<br />
stronger U.S. dollar (“USD”) and reforms driving reaccelerated<br />
growth in China, may effectuate a return to growth<br />
for the Eurozone economy in 2014.<br />
Question: What can be expected from Europe’s recent<br />
update of the Markets in Financial Instruments<br />
Directive (MiFID) 1<br />
Answer: A new deal to overhaul the <strong>European</strong> Union’s<br />
(“EU”) rules for financial markets marks a major step in<br />
the <strong>European</strong> Parliament’s efforts to tighten financial regulation<br />
since the 2008 crisis. <strong>The</strong> new rules will push most<br />
trading in stocks, bonds and derivatives onto regulated venues<br />
such as exchanges, which must disclose a wealth of information<br />
to regulators about their trading activity. <strong>The</strong><br />
agreement will also impose limits on the size of positions<br />
that traders in a broad range of commodities are allowed to<br />
hold. Most commodity trading will be pushed onto regulated<br />
markets. <strong>The</strong> proposed law also sets out rules for<br />
high-frequency trading systems, which execute trades in<br />
fractions of a second. <strong>The</strong> agreement takes a step toward a<br />
goal long sought by policy makers in Brussels: preventing<br />
exchanges from requiring traders to use clearinghouses also<br />
owned by the exchange. Finally, the deal allows financial<br />
companies to operate their own trading platforms, known<br />
as “organized trading facilities.”<br />
Question: In 2013 the <strong>European</strong> Single Market<br />
turned 20. What further potential remains looking<br />
forward<br />
Answer: <strong>The</strong> Single Market is the core of Europe’s economic<br />
and integration architecture. It has guaranteed the<br />
free movement of people, goods, services and capital in the<br />
<strong>European</strong> Economic Area since 1993 and has been continuously<br />
modified since then to keep pace with more recent<br />
developments, such as the growing importance of the service<br />
sector. <strong>The</strong> Single Market has had substantial positive<br />
growth effects, estimated to have increased EU GDP by<br />
some 2% to 3% in the past, and which many argue have not<br />
yet fully materialized. <strong>The</strong> dismantling of trade barriers has<br />
created cost advantages, intensified competition in the<br />
Single Market and made companies more competitive in<br />
the global arena. <strong>The</strong> ongoing reduction of barriers to intra-<br />
EU trade has also made the countries in the EU more attractive<br />
for investment by foreign firms. Given the structural<br />
problems in the Eurozone, the continuing development of<br />
the Single Market is one absolutely essential element.<br />
Further development of the “four freedoms” of the Single<br />
Market is expected to unleash further potential-free movement<br />
of goods, free movement of people, free movement of<br />
services and free movement of capital and payments. <strong>The</strong><br />
standardization of cross-border payments (SEPA, Single<br />
Euro Payments Area) expected to be implemented successively<br />
across Europe from February 2014 onward is the latest<br />
prominent example of an additional reduction in friction<br />
for cross-border capital flows and greater financial integration,<br />
which make cross-border financial transactions easier<br />
and cheaper.<br />
1<br />
<strong>The</strong> Markets in Financial Derivatives Directive (MiFID) aims to integrate<br />
the <strong>European</strong> Union’s financial markets and to increase the<br />
amount of cross-border investment orders.<br />
6
DIRECTORS OF THE FUND<br />
Term of Office<br />
and Length of Principal Occupation(s)<br />
Other Directorships<br />
Name, Address, Age* Time Served† During Past Five Years Held by Director<br />
Dr. Wilhelm Bender,<br />
69 (1) Class I<br />
Since 2013<br />
Detlef Bierbaum, 71 (1)<br />
Class I<br />
Since 1986<br />
Senior Advisor of Advent International<br />
GmbH (private equity) (since 2009), of<br />
Norton Rose LLP (legal services) (since<br />
2010) and of Leonardo & Co. GmbH (financial<br />
advisory) (since 2012), and<br />
Chairman of the Supervisory Boards of<br />
Bombardier Transportation GmbH (railways)<br />
(since 2010) and Eintracht Frankfurt<br />
Fußball AG (soccer club) (since 2010), and<br />
a member of Supervisory Boards of MTU<br />
AG (aircraft engines) (since 2008) and<br />
Lufthansa Cargo AG (air freight) (since<br />
2008). He is also a member of the Advisory<br />
Boards of Deutsche Bank AG (since 1993)<br />
and IVG AG (since 2007) and holds a number<br />
of honorary positions including<br />
Honorary Professor of the Johann Wolfgang<br />
Goethe University in Frankfurt (since 2008).<br />
He is the former Chairman of the Executive<br />
Board (CEO) of Fraport AG, Germany (aviation<br />
industry) (1993-2009).<br />
Consultant (since 2010). He is also Vice<br />
Chairman of the Supervisory Board of<br />
Oppenheim KAG GmbH (asset management)<br />
and a member of the Supervisory<br />
Board of Deutsche Bank Österreich AG<br />
(private bank) for more than five years.<br />
Mr. Bierbaum also serves as a member of<br />
the Board or Supervisory Board of a number<br />
of non-U.S. investment companies and<br />
of companies in diverse businesses including<br />
insurance, reinsurance, real estate, and<br />
retailing. He is a former member of the<br />
Supervisory Board of Sal. Oppenheim Jr. &<br />
Cie. KGaA (private bank) (2008 to<br />
March 2010) and was formerly a partner of<br />
that firm. He is also a former member of the<br />
Supervisory Board of <strong>DWS</strong> Investment<br />
GmbH (asset management) (2005-2008).<br />
Director, <strong>The</strong> Central Europe,<br />
Russia and Turkey <strong>Fund</strong>, <strong>Inc</strong>.<br />
(since 2013) and <strong>The</strong> New<br />
Germany <strong>Fund</strong>, <strong>Inc</strong>. (since<br />
2013).<br />
Director, <strong>The</strong> Central Europe,<br />
Russia and Turkey <strong>Fund</strong>, <strong>Inc</strong>.<br />
(since 1990) and <strong>The</strong> New<br />
Germany <strong>Fund</strong>, <strong>Inc</strong>. (since<br />
2008).<br />
7
DIRECTORS OF THE FUND (continued)<br />
Term of Office<br />
and Length of Principal Occupation(s)<br />
Other Directorships<br />
Name, Address, Age* Time Served† During Past Five Years Held by Director<br />
Ambassador<br />
Richard R. Burt,<br />
66 (1) Class II<br />
Since 2000<br />
Managing Director, McLarty Associates (international<br />
strategic advisory) (since 2007).<br />
Formerly, Chairman, Diligence, <strong>Inc</strong>. (international<br />
information and risk management<br />
firm) (2002-2007); Chairman of the Board,<br />
Weirton Steel Corp. (1996-2004); Partner,<br />
McKinsey & Company (consulting firm)<br />
(1991-1994); State Department, Chief<br />
Negotiator in charge of negotiating the<br />
Arms Treaty with Russia (1989-1991); U.S.<br />
Ambassador to the Federal Republic of<br />
Germany (1985-1989). Mr. Burt is also<br />
Director, IGT, <strong>Inc</strong>. (gaming technology)<br />
(since 1995), and HCL Technologies, <strong>Inc</strong>.<br />
(information technology and product engineering)<br />
(since 1999) and member, Textron<br />
<strong>Inc</strong>. International Advisory Council (aviation,<br />
automotive, industrial operations and<br />
finance) (since 1996).<br />
Director, <strong>The</strong> Central Europe,<br />
Russia and Turkey <strong>Fund</strong>, <strong>Inc</strong>.<br />
(since 2000) and <strong>The</strong> New<br />
Germany <strong>Fund</strong>, <strong>Inc</strong>. (since<br />
2004). Director, UBS family of<br />
mutual funds (since 1995).<br />
Richard Karl Goeltz,<br />
71 (1) Class III<br />
Since 2008<br />
Retired. Formerly, Vice Chairman and Chief<br />
Financial Officer of American Express Co.<br />
(financial services) (1996-2000) and previously<br />
served as chief financial officer of<br />
two other major multi-national corporations.<br />
Mr Goeltz is a member of the Court of<br />
Governors of the London School of<br />
Economics and Political Science, and<br />
Trustee of the American Academy in Berlin.<br />
Director, <strong>The</strong> Central Europe,<br />
Russia and Turkey <strong>Fund</strong>, <strong>Inc</strong>.<br />
(since 2008) and <strong>The</strong> New<br />
Germany <strong>Fund</strong>, <strong>Inc</strong>. (since<br />
1990). Formerly Director of<br />
Aviva plc (financial services),<br />
Federal Home Loan Mortgage<br />
Corporation, Delta Air Lines,<br />
<strong>Inc</strong>. (air transport) and <strong>The</strong><br />
Warnaco Group <strong>Inc</strong>. (apparel).<br />
Dr. Franz Wilhelm<br />
Hopp, 71 (1)<br />
Class III<br />
Since 2008<br />
Partner of Laplace Finanzconsulting GmbH<br />
(asset management). Member of the<br />
Supervisory Board WAVE AG (asset management).<br />
Former member of the Board of<br />
Management of KarstadtQuelle Pension<br />
Trust e.V. (February 2007-September 2009).<br />
Director, <strong>The</strong> Central Europe,<br />
Russia and Turkey <strong>Fund</strong>, <strong>Inc</strong>.<br />
(since 2008) and <strong>The</strong> New<br />
Germany <strong>Fund</strong>, <strong>Inc</strong>. (since<br />
1993).<br />
8
DIRECTORS OF THE FUND (continued)<br />
Term of Office<br />
and Length of Principal Occupation(s)<br />
Other Directorships<br />
Name, Address, Age* Time Served† During Past Five Years Held by Director<br />
Dr. Friedbert H. Malt,<br />
72 (1) Class II<br />
Since 2007<br />
Retired. Formerly, Vice Chairman and<br />
Member of the Executive Committee of<br />
NOL Neptune Orient Lines Ltd., Singapore<br />
(“NOL”) from 2002 to 2011 and Director of<br />
NOL from 2000 to 2011. He currently is<br />
also a Director of TÜV Rheinland of North<br />
America, <strong>Inc</strong>., a company offering independent<br />
testing and assessment services.<br />
Formerly, Dr. Malt was a Member of the<br />
Executive Board of DG Bank (now DZ<br />
Bank), Frankfurt (until 2001).<br />
Director, <strong>The</strong> Central Europe,<br />
Russia and Turkey <strong>Fund</strong>, <strong>Inc</strong>.<br />
(since 2007) and <strong>The</strong> New<br />
Germany <strong>Fund</strong>, <strong>Inc</strong>. (since<br />
2007).<br />
Christian H. Strenger,<br />
70 (1)(2) Class III<br />
Since 1986<br />
Member of Supervisory Board (since 1999)<br />
and formerly Managing Director<br />
(1991-1999) of <strong>DWS</strong> Investment GmbH (investment<br />
management), a subsidiary of<br />
Deutsche Bank AG. Mr. Strenger is also<br />
Member, Supervisory Board, Fraport AG<br />
(international airport business) and TUI AG<br />
(travel business). He also is a member of the<br />
German Government’s Commission on<br />
Corporate Governance and other corporate<br />
governance organizations, and serves as<br />
Director of the Center for Corporate<br />
Governance at the Leipzig Graduate School<br />
of Management.<br />
Director and Chairman, <strong>The</strong><br />
Central Europe, Russia and<br />
Turkey <strong>Fund</strong>, <strong>Inc</strong>. (since 1990)<br />
and <strong>The</strong> New Germany <strong>Fund</strong>,<br />
<strong>Inc</strong>. (since 1990).<br />
Robert H. Wadsworth,<br />
73 (1)(3)<br />
Class I<br />
Since 1986<br />
President, Robert H. Wadsworth Associates,<br />
<strong>Inc</strong>. (consulting firm) (1983-present).<br />
Director, <strong>The</strong> Central Europe,<br />
Russia and Turkey <strong>Fund</strong>, <strong>Inc</strong>.<br />
(since 1990) and <strong>The</strong> New<br />
Germany <strong>Fund</strong>, <strong>Inc</strong>. (since<br />
1992), as well as other <strong>DWS</strong><br />
funds.<br />
9
DIRECTORS OF THE FUND (continued)<br />
Term of Office<br />
and Length of Principal Occupation(s)<br />
Other Directorships<br />
Name, Address, Age* Time Served† During Past Five Years Held by Director<br />
Joachim Wagner, 66 (1)<br />
Class II<br />
Since 2009<br />
Retired. Formerly, Chief Financial Officer,<br />
RAG Beteiligungs AG/Evonik Industries<br />
AG, Germany (chemical manufacturer)<br />
(2006-2009) and Chief Financial Officer,<br />
Degussa AG, Germany (chemical manufacturer)<br />
(2001-2006). Mr. Wagner is also a<br />
member of the Supervisory Board of a<br />
German retail bank and a member of the advisory<br />
board of a private German bank.<br />
Director, <strong>The</strong> Central Europe,<br />
Russia and Turkey <strong>Fund</strong>, <strong>Inc</strong>.<br />
(since 2012) and <strong>The</strong> New<br />
Germany <strong>Fund</strong>, <strong>Inc</strong>. (since<br />
2009).<br />
(1) Indicates that the Director also serves as a Director of <strong>The</strong> Central Europe, Russia and Turkey <strong>Fund</strong>, <strong>Inc</strong>. and <strong>The</strong> New Germany <strong>Fund</strong>, <strong>Inc</strong>., two other<br />
closed-end registered investment companies for which Deutsche Investment Management Americas <strong>Inc</strong>. acts as Administrator and Deutsche Asset &<br />
Wealth Management International GmbH acts as Investment Adviser.<br />
(2) Indicates “Interested Person”, as defined in the Investment Company Act of 1940, as amended (the “1940 Act”). Mr. Strenger is an “interested”<br />
Director because of his affiliation with <strong>DWS</strong>-Deutsche Gesellschaft für Werpapiersparen mbH (“<strong>DWS</strong>”), an indirect wholly-owned subsidiary of<br />
Deutsche Bank AG, and because of his ownership of Deutsche Bank AG shares.<br />
(3) Indicates that Mr. Wadsworth also serves as Director/Trustee of the <strong>DWS</strong> <strong>Investments</strong>’ open-end and closed-end investment companies. <strong>The</strong>se <strong>Fund</strong>s<br />
are advised by Deutsche Investment Management Americas <strong>Inc</strong>., an indirect wholly-owned subsidiary of Deutsche Bank AG.<br />
* <strong>The</strong> address of each Director is c/o Deutsche Investment Management Americas <strong>Inc</strong>., 345 Park Avenue, NYC 20-2799, New York, NY 10154.<br />
† <strong>The</strong> term of office for Directors in Class I expires at the 2015 <strong>Annual</strong> Meeting, Class II expires at the 2016 <strong>Annual</strong> Meeting and Class III expires at<br />
the 2014 <strong>Annual</strong> Meeting.<br />
10
OFFICERS OF THE FUND*<br />
Name, Age<br />
Brian E. Binder (1,2) , 41<br />
President and Chief<br />
Executive Officer<br />
Paul H. Schubert (4,13) , 50<br />
Chief Financial Officer and<br />
Treasurer<br />
Rainer Vermehren (5,6) , 45<br />
Vice President<br />
Melinda Morrow (7,13) , 43<br />
Vice President<br />
John Millette (8,9) , 51<br />
Secretary<br />
Hepsen Uzcan (9,12) , 39<br />
Assistant Secretary<br />
Caroline Pearson (9,10) , 51<br />
Chief Legal Officer<br />
Alexis Kuchinsky (11,13) , 37<br />
Chief Compliance Officer<br />
John Caruso (5,13) , 48<br />
Anti-Money Laundering<br />
Compliance Officer<br />
Principal Occupations During Past Five Years<br />
Managing Director (3) and Head of <strong>Fund</strong> Administration, Deutsche Asset & Wealth<br />
Management (2013-present). Formerly, Head of Business Management and<br />
Consulting at Invesco, Ltd. (2010-2012); Chief Administrative Officer, Van Kampen<br />
<strong>Fund</strong>s <strong>Inc</strong>. (2008-2010); and Chief Administrative Officer, Morgan Stanley<br />
Investment Management Americas Distribution (2003-2008).<br />
Managing Director (3) , Deutsche Asset & Wealth Management (since 2004). Formerly,<br />
Executive Director, Head of Mutual <strong>Fund</strong> Services and Treasurer for UBS Family of<br />
<strong>Fund</strong>s at UBS Global Asset Management (1998-2004).<br />
Director (3) , <strong>DWS</strong> Investment GmbH (since 2007). <strong>Fund</strong> Manager, <strong>DWS</strong> Investment<br />
GmbH (since 1997).<br />
Director (3) , Deutsche Asset & Wealth Management (since 2006).<br />
Director (3) , Deutsche Asset & Wealth Management (since 2002).<br />
Vice President, Deutsche Asset & Wealth Management.<br />
Managing Director (3) , Deutsche Asset & Wealth Management. Formerly, Assistant<br />
Secretary for <strong>DWS</strong> family of funds (1997-2010).<br />
Vice President, Deutsche Asset & Wealth Management (since 2002); Head of<br />
Compliance Program Oversight of Deutsche Asset & Wealth Management.<br />
Managing Director (3) , Deutsche Asset & Wealth Management.<br />
Each also serves as an Officer of <strong>The</strong> Central Europe, Russia and Turkey <strong>Fund</strong>, <strong>Inc</strong>. and <strong>The</strong> New Germany <strong>Fund</strong>, <strong>Inc</strong>., two other closed-end registered<br />
investment companies for which Deutsche Investment Management Americas <strong>Inc</strong>. acts as Administrator.<br />
* As a result of their respective positions held with the Administrator, these individuals are considered “interested persons” of the Administrator within<br />
the meaning of the 1940 Act. Interested persons receive no compensation directly from the <strong>Fund</strong>.<br />
(1) Since December 6, 2013.<br />
(2) Address: 222 South Riverside Plaza, Chicago, Illinois 60606.<br />
(3) Executive title, not a board directorship.<br />
(4) Since November 5, 2004.<br />
(5) Since February 1, 2010.<br />
(6) Address: Mainzer Landstraße 178-190, Frankfurt am Main, Germany.<br />
(7) Since April 27, 2012.<br />
(8) Since January 1, 2011. Served as Assistant Secretary from July 14, 2006 to December 31, 2010 and as Secretary to the <strong>Fund</strong> from January 30, 2006<br />
to July 13, 2006.<br />
(9) Address: One Beacon Street, Boston, Massachusetts 02108.<br />
(10) Since May 21, 2012.<br />
(11) Since August 24, 2009.<br />
(12) Since July 22, 2013.<br />
(13) Address: 60 Wall Street, New York, New York 10005.<br />
11
THE EUROPEAN EQUITY FUND, INC.<br />
SCHEDULE OF INVESTMENTS — DECEMBER 31, 2013<br />
Shares Description Value (a) Shares Description Value (a)<br />
INVESTMENTS IN GERMANY – 28.5%<br />
COMMON STOCKS – 25.8%<br />
AUTOMOBILES – 3.3%<br />
36,000 Daimler . . . . . . . . . . . . . . . . . . . . . . $ 3,119,664<br />
CHEMICALS – 3.7%<br />
13,000 BASF . . . . . . . . . . . . . . . . . . . . . . . . 1,387,854<br />
10,000 Linde . . . . . . . . . . . . . . . . . . . . . . . . 2,094,793<br />
3,482,647<br />
COMPUTERS &<br />
PERIPHERALS – 1.1%<br />
15,000 Wincor Nixdorf . . . . . . . . . . . . . . . . 1,040,921<br />
DIVERSIFIED<br />
TELECOMMUNICATION<br />
SERVICES – 1.8%<br />
100,000 Deutsche Telekom . . . . . . . . . . . . . . 1,712,481<br />
INDUSTRIAL<br />
CONGLOMERATES – 2.6%<br />
18,000 Siemens . . . . . . . . . . . . . . . . . . . . . . 2,462,253<br />
INSURANCE – 4.0%<br />
15,000 Allianz . . . . . . . . . . . . . . . . . . . . . . . 2,693,748<br />
33,000 Talanx . . . . . . . . . . . . . . . . . . . . . . . 1,120,690<br />
3,814,438<br />
INTERNET SOFTWARE &<br />
SERVICES – 2.2%<br />
48,000 United Internet . . . . . . . . . . . . . . . . 2,044,727<br />
MEDIA – 2.7%<br />
40,000 Axel Springer . . . . . . . . . . . . . . . . . 2,573,544<br />
SEMICONDUCTORS &<br />
SEMICONDUCTOR<br />
EQUIPMENT – 2.0%<br />
180,000 Infineon Technologies . . . . . . . . . . . 1,924,371<br />
TEXTILES, APPAREL &<br />
LUXURY GOODS – 2.4%<br />
18,000 Adidas . . . . . . . . . . . . . . . . . . . . . . . 2,297,342<br />
Total Common Stocks<br />
(cost $18,690,432) . . . . . . . . . . . . . 24,472,388<br />
PREFERRED STOCKS – 2.7%<br />
HOUSEHOLD PRODUCTS – 2.7%<br />
22,000 Henkel & Co.<br />
(cost $1,620,131) . . . . . . . . . . . . . . 2,555,386<br />
Total <strong>Investments</strong> in Germany<br />
(cost $20,310,563) . . . . . . . . . . . . . 27,027,774<br />
<strong>The</strong> accompanying notes are an integral part of the financial statements.<br />
12<br />
INVESTMENTS IN FRANCE – 19.2%<br />
AEROSPACE &<br />
DEFENSE – 2.6%<br />
14,000 Zodiac Aerospace† . . . . . . . . . . . . . $ 2,483,304<br />
AUTOMOBILES – 1.9%<br />
22,000 Renault . . . . . . . . . . . . . . . . . . . . . . . 1,771,584<br />
COMMERCIAL BANKS – 4.2%<br />
120,000 Credit Agricole* . . . . . . . . . . . . . . . 1,538,340<br />
42,000 Societe Generale . . . . . . . . . . . . . . . 2,442,993<br />
3,981,333<br />
COMMERCIAL SERVICES &<br />
SUPPLIES – 1.9%<br />
15,000 Societe BIC . . . . . . . . . . . . . . . . . . . 1,840,469<br />
CONSTRUCTION<br />
MATERIALS – 2.6%<br />
28,000 Imerys . . . . . . . . . . . . . . . . . . . . . . . 2,438,364<br />
DIVERSIFIED<br />
TELECOMMUNICATION<br />
SERVICES – 2.2%<br />
80,000 Vivendi . . . . . . . . . . . . . . . . . . . . . . 2,111,188<br />
HEALTH CARE EQUIPMENT &<br />
SUPPLIES – 2.3%<br />
20,000 Essilor International . . . . . . . . . . . . 2,129,373<br />
INSURANCE – 1.5%<br />
50,000 AXA . . . . . . . . . . . . . . . . . . . . . . . . 1,392,166<br />
Total <strong>Investments</strong> in France<br />
(cost $14,935,091) . . . . . . . . . . . . . 18,147,781<br />
INVESTMENTS IN SPAIN – 14.7%<br />
CONSTRUCTION &<br />
ENGINEERING – 1.8%<br />
50,000 ACS Actividades de<br />
Construccion y Servicios . . . . . . . . 1,723,503<br />
GAS UTILITIES – 2.3%<br />
84,000 Enagas . . . . . . . . . . . . . . . . . . . . . . . 2,198,231<br />
INSURANCE – 4.4%<br />
52,000 Grupo Catalana Occidente . . . . . . . 1,864,083<br />
540,000 Mapfre . . . . . . . . . . . . . . . . . . . . . . . 2,315,941<br />
4,180,024<br />
IT SERVICES – 4.1%<br />
50,000 Amadeus IT Holding . . . . . . . . . . . . 2,142,668<br />
100,000 Indra Sistemas . . . . . . . . . . . . . . . . . 1,674,594<br />
3,817,262
THE EUROPEAN EQUITY FUND, INC.<br />
SCHEDULE OF INVESTMENTS — DECEMBER 31, 2013 (continued)<br />
Shares Description Value (a) Shares Description Value (a)<br />
INVESTMENTS IN<br />
SPAIN – 14.7% (continued)<br />
OIL, GAS & CONSUMABLE<br />
FUELS – 2.0%<br />
76,000 Repsol YPF . . . . . . . . . . . . . . . . . . . $ 1,918,199<br />
Total Common Stocks<br />
(cost $10,238,730) . . . . . . . . . . . . . 13,837,219<br />
RIGHTS – 0.1%<br />
OIL, GAS & CONSUMABLE<br />
FUELS – 0.1%<br />
76,000 Repsol*<br />
(cost $0) . . . . . . . . . . . . . . . . . . . . . 51,934<br />
Total <strong>Investments</strong> in Rights<br />
(cost $0) . . . . . . . . . . . . . . . . . . . . . 51,934<br />
Total <strong>Investments</strong> in Spain<br />
(cost $10,238,730) . . . . . . . . . . . . . 13,889,153<br />
INVESTMENTS IN<br />
NETHERLANDS – 13.9%<br />
AEROSPACE &<br />
DEFENSE – 2.8%<br />
34,000 EADS . . . . . . . . . . . . . . . . . . . . . . . . 2,614,241<br />
AIR FREIGHT &<br />
LOGISTICS – 1.7%<br />
280,000 PostNL NV* . . . . . . . . . . . . . . . . . . 1,600,887<br />
CHEMICALS – 1.5%<br />
18,000 Koninklijke DSM . . . . . . . . . . . . . . 1,417,488<br />
DIVERSIFIED FINANCIAL<br />
SERVICES – 1.8%<br />
120,000 ING Groep* . . . . . . . . . . . . . . . . . . . 1,669,772<br />
FOOD PRODUCTS – 2.3%<br />
44,000 Nutreco . . . . . . . . . . . . . . . . . . . . . . 2,188,945<br />
MEDIA – 2.5%<br />
110,000 Reed Elsevier NV . . . . . . . . . . . . . . 2,333,824<br />
SEMICONDUCTORS &<br />
SEMICONDUCTOR<br />
EQUIPMENT – 1.3%<br />
13,090 ASML Holding . . . . . . . . . . . . . . . . 1,227,040<br />
Total <strong>Investments</strong> in Netherlands<br />
(cost $9,054,679) . . . . . . . . . . . . . . 13,052,197<br />
INVESTMENTS IN UNITED<br />
KINGDOM – 6.9%<br />
HEALTH CARE EQUIPMENT &<br />
SUPPLIES – 2.4%<br />
160,000 Smith & Nephew . . . . . . . . . . . . . . . $ 2,280,754<br />
HOUSEHOLD PRODUCTS – 2.2%<br />
26,000 Reckitt Benckiser Group . . . . . . . . . 2,063,176<br />
MULTILINE RETAIL – 2.3%<br />
24,000 Next . . . . . . . . . . . . . . . . . . . . . . . . . 2,165,525<br />
Total <strong>Investments</strong> in<br />
United Kingdom<br />
(cost $5,266,293) . . . . . . . . . . . . . . 6,509,455<br />
INVESTMENTS IN NORWAY – 5.0%<br />
COMMERCIAL BANKS – 2.3%<br />
120,000 DNB . . . . . . . . . . . . . . . . . . . . . . . . . 2,144,975<br />
DIVERSIFIED<br />
TELECOMMUNICATION<br />
SERVICES – 1.9%<br />
74,000 Telenor . . . . . . . . . . . . . . . . . . . . . . . 1,762,833<br />
ENERGY EQUIPMENT &<br />
SERVICES – 0.8%<br />
19,000 Seadrill . . . . . . . . . . . . . . . . . . . . . . . 775,025<br />
Total <strong>Investments</strong> in Norway<br />
(cost $4,654,389) . . . . . . . . . . . . . . 4,682,833<br />
INVESTMENTS IN FINLAND – 2.9%<br />
INSURANCE – 2.9%<br />
56,000 Sampo . . . . . . . . . . . . . . . . . . . . . . . 2,755,841<br />
Total <strong>Investments</strong> in Finland<br />
(cost $1,417,010) . . . . . . . . . . . . . . 2,755,841<br />
INVESTMENTS IN<br />
LUXEMBOURG – 2.5%<br />
MEDIA – 2.5%<br />
18,000 RTL Group . . . . . . . . . . . . . . . . . . . 2,329,332<br />
Total <strong>Investments</strong> in Luxembourg<br />
(cost $1,965,355) . . . . . . . . . . . . . . 2,329,332<br />
<strong>The</strong> accompanying notes are an integral part of the financial statements.<br />
13
THE EUROPEAN EQUITY FUND, INC.<br />
SCHEDULE OF INVESTMENTS — DECEMBER 31, 2013 (continued)<br />
Shares Description Value (a) 14<br />
INVESTMENTS IN SWEDEN – 2.2%<br />
COMMERCIAL SERVICES &<br />
SUPPLIES – 2.2%<br />
200,000 Securitas . . . . . . . . . . . . . . . . . . . . . $ 2,125,311<br />
Total <strong>Investments</strong> in Sweden<br />
(cost $1,822,584) . . . . . . . . . . . . . . 2,125,311<br />
INVESTMENTS IN GREECE – 1.8%<br />
HOTELS, RESTAURANTS &<br />
LEISURE – 1.8%<br />
130,000 OPAP . . . . . . . . . . . . . . . . . . . . . . . . 1,731,907<br />
Total <strong>Investments</strong> in Greece<br />
(cost $1,685,846) . . . . . . . . . . . . . . 1,731,907<br />
INVESTMENTS IN<br />
SWITZERLAND – 1.1%<br />
CHEMICALS – 1.1%<br />
2,500 Syngenta . . . . . . . . . . . . . . . . . . . . . 998,314<br />
Total <strong>Investments</strong> in Switzerland<br />
(cost $834,335) . . . . . . . . . . . . . . . 998,314<br />
Total <strong>Investments</strong> in<br />
Common and Preferred<br />
Stocks and Rights – 98.7%<br />
(cost $72,184,875) . . . . . . . . . . . . . 93,249,898<br />
* Non-income producing security.<br />
** <strong>The</strong> cost for federal income tax purposes was $75,966,416. At<br />
December 31, 2013, net unrealized appreciation for all securities<br />
based on tax cost was $21,064,079. This consisted of aggregate gross<br />
unrealized appreciation for all securities in which there was an excess<br />
of value over tax cost of $21,393,778 and aggregate gross unrealized<br />
depreciation for all securities in which there was an excess of tax cost<br />
over value of $329,699.<br />
† All or a portion of these securities were on loan. <strong>The</strong> value of all securities<br />
loaned at December 31, 2013 amounted to $2,447,828, which<br />
is 2.6% of net assets.<br />
(a) Value stated in U.S. dollars.<br />
(b) Represents collateral held in connection with securities lending.<br />
<strong>Inc</strong>ome earned by the <strong>Fund</strong> is net of borrower rebates.<br />
(c) Affiliated fund managed by Deutsche Investment Management<br />
Americas <strong>Inc</strong>. <strong>The</strong> rate shown is the annualized seven-day yield at<br />
period end.<br />
For purposes of its industry concentration policy, the <strong>Fund</strong> classifies<br />
issuers of portfolio securities at the industry sub-group level. Certain of<br />
the categories in the above Schedule of <strong>Investments</strong> consist of multiple<br />
industry sub-groups or industries.<br />
SECURITIES LENDING COLLATERAL – 2.7%<br />
2,548,860 Daily Assets <strong>Fund</strong><br />
Institutional, 0.08%<br />
(cost $2,548,860) (b)(c) . . . . . . . . . . . 2,548,860<br />
CASH EQUIVALENTS – 1.3%<br />
1,231,737 Central Cash<br />
Management <strong>Fund</strong>, 0.05%<br />
(cost $1,231,737) (c) . . . . . . . . . . . . 1,231,737<br />
Total <strong>Investments</strong> – 102.7%<br />
(cost $75,965,472)** . . . . . . . . . . . 97,030,495<br />
Other Assets and Liabilities,<br />
Net – (2.7%) . . . . . . . . . . . . . . . . . . (2,562,327)<br />
NET ASSETS – 100.0% . . . . . . . . $94,468,168<br />
<strong>The</strong> accompanying notes are an integral part of the financial statements.
THE EUROPEAN EQUITY FUND, INC.<br />
SCHEDULE OF INVESTMENTS — DECEMBER 31, 2013 (continued)<br />
Fair Value Measurements<br />
Various inputs are used in determining the value of the <strong>Fund</strong>’s investments. <strong>The</strong>se inputs are summarized in three broad levels. Level 1<br />
includes quoted prices in active markets for identical securities. Level 2 includes other significant observable inputs (including quoted<br />
prices for similar securities, interest rates, prepayment speeds and credit risk). Level 3 includes significant unobservable inputs (including<br />
the <strong>Fund</strong>’s own assumptions in determining the fair value of investments). <strong>The</strong> level assigned to the securities valuations may not<br />
be an indication of the risk or liquidity associated with investing in those securities.<br />
<strong>The</strong> following is a summary of the inputs used as of December 31, 2013 in valuing the <strong>Fund</strong>’s investments. For information on the<br />
<strong>Fund</strong>’s policy regarding the valuation of investments, please refer to the Security Valuation section of Note 1 in the accompanying<br />
Notes to Financial Statements.<br />
Category Level 1 Level 2 Level 3 Total<br />
Common Stocks and/or Other <strong>Equity</strong> <strong>Investments</strong> (1)<br />
Germany . . . . . . . . . . . . . . . . . . . . . . . . . . . . . . . . . $27,027,774 $ — $ — $27,027,774<br />
France . . . . . . . . . . . . . . . . . . . . . . . . . . . . . . . . . . . 18,147,781 — — 18,147,781<br />
Spain . . . . . . . . . . . . . . . . . . . . . . . . . . . . . . . . . . . . 13,889,153 — — 13,889,153<br />
Netherlands . . . . . . . . . . . . . . . . . . . . . . . . . . . . . . . 13,052,197 — — 13,052,197<br />
United Kingdom . . . . . . . . . . . . . . . . . . . . . . . . . . . 6,509,455 — — 6,509,455<br />
Norway . . . . . . . . . . . . . . . . . . . . . . . . . . . . . . . . . . . 4,682,833 — — 4,682,833<br />
Finland . . . . . . . . . . . . . . . . . . . . . . . . . . . . . . . . . . . 2,755,841 — — 2,755,841<br />
Luxembourg . . . . . . . . . . . . . . . . . . . . . . . . . . . . . . . 2,329,332 — — 2,329,332<br />
Sweden . . . . . . . . . . . . . . . . . . . . . . . . . . . . . . . . . . . 2,125,311 — — 2,125,311<br />
Greece . . . . . . . . . . . . . . . . . . . . . . . . . . . . . . . . . . . 1,731,907 — — 1,731,907<br />
Switzerland . . . . . . . . . . . . . . . . . . . . . . . . . . . . . . . 998,314 — — 998,314<br />
Short-Term Instruments (1) . . . . . . . . . . . . . . . . . . . . . . . 3,780,597 — — 3,780,597<br />
Total . . . . . . . . . . . . . . . . . . . . . . . . . . . . . . . . . . . . . . . $97,030,495 $ — $ — $97,030,495<br />
<strong>The</strong>re have been no transfers between fair value measurement levels during the year ended December 31, 2013.<br />
(1) See Schedule of <strong>Investments</strong> for additional detailed categorizations.<br />
<strong>The</strong> accompanying notes are an integral part of the financial statements.<br />
15
THE EUROPEAN EQUITY FUND, INC.<br />
STATEMENT OF ASSETS AND LIABILITIES<br />
DECEMBER 31, 2013<br />
ASSETS<br />
<strong>Investments</strong> in non-affiliated securities, at value (cost $72,184,875) — including $2,447,828 of securities loaned . . . $ 93,249,898<br />
Investment in Central Cash Management <strong>Fund</strong> (cost $1,231,737) . . . . . . . . . . . . . . . . . . . . . . . . . . . . . . . . . . . . . . . . . 1,231,737<br />
Investment in Daily Assets <strong>Fund</strong> Institutional (cost $2,548,860)* . . . . . . . . . . . . . . . . . . . . . . . . . . . . . . . . . . . . . . . . . . 2,548,860<br />
Total <strong>Investments</strong>, at value (cost $75,965,472) . . . . . . . . . . . . . . . . . . . . . . . . . . . . . . . . . . . . . . . . . . . . . . . . . . . . . . 97,030,495<br />
Foreign currency, at value (cost $97,112) . . . . . . . . . . . . . . . . . . . . . . . . . . . . . . . . . . . . . . . . . . . . . . . . . . . . . . . . . . . . . 98,081<br />
Dividends receivable . . . . . . . . . . . . . . . . . . . . . . . . . . . . . . . . . . . . . . . . . . . . . . . . . . . . . . . . . . . . . . . . . . . . . . . . . . . . . 13,260<br />
Foreign taxes recoverable . . . . . . . . . . . . . . . . . . . . . . . . . . . . . . . . . . . . . . . . . . . . . . . . . . . . . . . . . . . . . . . . . . . . . . . . . 112,801<br />
Interest receivable . . . . . . . . . . . . . . . . . . . . . . . . . . . . . . . . . . . . . . . . . . . . . . . . . . . . . . . . . . . . . . . . . . . . . . . . . . . . . . . 2,714<br />
Other assets . . . . . . . . . . . . . . . . . . . . . . . . . . . . . . . . . . . . . . . . . . . . . . . . . . . . . . . . . . . . . . . . . . . . . . . . . . . . . . . . . . . . 7,649<br />
Total assets . . . . . . . . . . . . . . . . . . . . . . . . . . . . . . . . . . . . . . . . . . . . . . . . . . . . . . . . . . . . . . . . . . . . . . . . . . . . . . . . . . 97,265,000<br />
LIABILITIES<br />
Payable upon return of securities loaned . . . . . . . . . . . . . . . . . . . . . . . . . . . . . . . . . . . . . . . . . . . . . . . . . . . . . . . . . . . . . 2,548,860<br />
Investment advisory fee payable . . . . . . . . . . . . . . . . . . . . . . . . . . . . . . . . . . . . . . . . . . . . . . . . . . . . . . . . . . . . . . . . . . . . 60,185<br />
Administration fee payable . . . . . . . . . . . . . . . . . . . . . . . . . . . . . . . . . . . . . . . . . . . . . . . . . . . . . . . . . . . . . . . . . . . . . . . . 15,943<br />
Payable for Directors’ fees and expenses . . . . . . . . . . . . . . . . . . . . . . . . . . . . . . . . . . . . . . . . . . . . . . . . . . . . . . . . . . . . . 7,369<br />
Accrued expenses and other liabilities . . . . . . . . . . . . . . . . . . . . . . . . . . . . . . . . . . . . . . . . . . . . . . . . . . . . . . . . . . . . . . . 164,475<br />
Total liabilities . . . . . . . . . . . . . . . . . . . . . . . . . . . . . . . . . . . . . . . . . . . . . . . . . . . . . . . . . . . . . . . . . . . . . . . . . . . . . . . 2,796,832<br />
NET ASSETS . . . . . . . . . . . . . . . . . . . . . . . . . . . . . . . . . . . . . . . . . . . . . . . . . . . . . . . . . . . . . . . . . . . . . . . . . . . . . . . . . $ 94,468,168<br />
Net assets consist of:<br />
Paid-in capital, $0.001 par (Authorized 80,000,000 shares) . . . . . . . . . . . . . . . . . . . . . . . . . . . . . . . . . . . . . . . . . . . . . . $106,578,485<br />
Undistributed net investment income . . . . . . . . . . . . . . . . . . . . . . . . . . . . . . . . . . . . . . . . . . . . . . . . . . . . . . . . . . . . . . . . 993,209<br />
Accumulated net realized loss on investments and foreign currency . . . . . . . . . . . . . . . . . . . . . . . . . . . . . . . . . . . . . . . (34,174,831)<br />
Net unrealized appreciation (depreciation) on:<br />
<strong>Investments</strong> . . . . . . . . . . . . . . . . . . . . . . . . . . . . . . . . . . . . . . . . . . . . . . . . . . . . . . . . . . . . . . . . . . . . . . . . . . . . . . . . . . 21,065,023<br />
Foreign currency . . . . . . . . . . . . . . . . . . . . . . . . . . . . . . . . . . . . . . . . . . . . . . . . . . . . . . . . . . . . . . . . . . . . . . . . . . . . . . 6,282<br />
Net assets . . . . . . . . . . . . . . . . . . . . . . . . . . . . . . . . . . . . . . . . . . . . . . . . . . . . . . . . . . . . . . . . . . . . . . . . . . . . . . . . . . . . . $ 94,468,168<br />
Net asset value per share ($94,468,168 ÷ 9,652,610 shares of common stock issued and outstanding) . . . . . . . . . . . . $ 9.79<br />
*Represents collateral on securities loaned.<br />
<strong>The</strong> accompanying notes are an integral part of the financial statements.<br />
16
THE EUROPEAN EQUITY FUND, INC.<br />
STATEMENT OF OPERATIONS<br />
NET INVESTMENT INCOME<br />
<strong>Inc</strong>ome:<br />
For the<br />
year ended<br />
December 31, 2013<br />
Dividends (net of foreign witholding taxes of $247,602) . . . . . . . . . . . . . . . . . . . . . . . . . . . . . . . . . . . . . . . . . . . . $ 2,123,970<br />
Interest . . . . . . . . . . . . . . . . . . . . . . . . . . . . . . . . . . . . . . . . . . . . . . . . . . . . . . . . . . . . . . . . . . . . . . . . . . . . . . . . . . . 33<br />
<strong>Inc</strong>ome distributions — Central Cash Management <strong>Fund</strong> . . . . . . . . . . . . . . . . . . . . . . . . . . . . . . . . . . . . . . . . . . . 1,614<br />
Securities lending, including income from Daily Assets <strong>Fund</strong> Institutional, net of borrower rebates . . . . . . . . . . 189,111<br />
Total investment income . . . . . . . . . . . . . . . . . . . . . . . . . . . . . . . . . . . . . . . . . . . . . . . . . . . . . . . . . . . . . . . . . . . . . . . 2,314,728<br />
Expenses:<br />
Investment advisory fee . . . . . . . . . . . . . . . . . . . . . . . . . . . . . . . . . . . . . . . . . . . . . . . . . . . . . . . . . . . . . . . . . . . . . . 639,801<br />
Administration fee . . . . . . . . . . . . . . . . . . . . . . . . . . . . . . . . . . . . . . . . . . . . . . . . . . . . . . . . . . . . . . . . . . . . . . . . . . 168,149<br />
Custodian fee . . . . . . . . . . . . . . . . . . . . . . . . . . . . . . . . . . . . . . . . . . . . . . . . . . . . . . . . . . . . . . . . . . . . . . . . . . . . . . 49,568<br />
Services to shareholders . . . . . . . . . . . . . . . . . . . . . . . . . . . . . . . . . . . . . . . . . . . . . . . . . . . . . . . . . . . . . . . . . . . . . 21,801<br />
<strong>Report</strong>s to shareholders . . . . . . . . . . . . . . . . . . . . . . . . . . . . . . . . . . . . . . . . . . . . . . . . . . . . . . . . . . . . . . . . . . . . . . 93,755<br />
Directors’ fees and expenses . . . . . . . . . . . . . . . . . . . . . . . . . . . . . . . . . . . . . . . . . . . . . . . . . . . . . . . . . . . . . . . . . . 157,420<br />
Legal fees . . . . . . . . . . . . . . . . . . . . . . . . . . . . . . . . . . . . . . . . . . . . . . . . . . . . . . . . . . . . . . . . . . . . . . . . . . . . . . . . . 88,574<br />
Audit and tax fees . . . . . . . . . . . . . . . . . . . . . . . . . . . . . . . . . . . . . . . . . . . . . . . . . . . . . . . . . . . . . . . . . . . . . . . . . . 73,633<br />
NYSE listing fee . . . . . . . . . . . . . . . . . . . . . . . . . . . . . . . . . . . . . . . . . . . . . . . . . . . . . . . . . . . . . . . . . . . . . . . . . . . 23,571<br />
Insurance . . . . . . . . . . . . . . . . . . . . . . . . . . . . . . . . . . . . . . . . . . . . . . . . . . . . . . . . . . . . . . . . . . . . . . . . . . . . . . . . . 14,268<br />
Miscellaneous . . . . . . . . . . . . . . . . . . . . . . . . . . . . . . . . . . . . . . . . . . . . . . . . . . . . . . . . . . . . . . . . . . . . . . . . . . . . . 26,696<br />
Net expenses . . . . . . . . . . . . . . . . . . . . . . . . . . . . . . . . . . . . . . . . . . . . . . . . . . . . . . . . . . . . . . . . . . . . . . . . . . . . . . 1,357,236<br />
Net investment income . . . . . . . . . . . . . . . . . . . . . . . . . . . . . . . . . . . . . . . . . . . . . . . . . . . . . . . . . . . . . . . . . . . . . . . . 957,492<br />
REALIZED AND UNREALIZED GAIN (LOSS)<br />
Net realized gain (loss) from:<br />
<strong>Investments</strong> . . . . . . . . . . . . . . . . . . . . . . . . . . . . . . . . . . . . . . . . . . . . . . . . . . . . . . . . . . . . . . . . . . . . . . . . . . . . . . . 7,233,745<br />
Foreign currency . . . . . . . . . . . . . . . . . . . . . . . . . . . . . . . . . . . . . . . . . . . . . . . . . . . . . . . . . . . . . . . . . . . . . . . . . . . 18,818<br />
Net realized gain (loss) . . . . . . . . . . . . . . . . . . . . . . . . . . . . . . . . . . . . . . . . . . . . . . . . . . . . . . . . . . . . . . . . . . . . 7,252,563<br />
Change in net unrealized appreciation (depreciation) on:<br />
<strong>Investments</strong> . . . . . . . . . . . . . . . . . . . . . . . . . . . . . . . . . . . . . . . . . . . . . . . . . . . . . . . . . . . . . . . . . . . . . . . . . . . . . . . 10,686,266<br />
Foreign currency . . . . . . . . . . . . . . . . . . . . . . . . . . . . . . . . . . . . . . . . . . . . . . . . . . . . . . . . . . . . . . . . . . . . . . . . . . . (9,376)<br />
Change in net unrealized appreciation (depreciation) . . . . . . . . . . . . . . . . . . . . . . . . . . . . . . . . . . . . . . . . . . . . . 10,676,890<br />
Net gain (loss) . . . . . . . . . . . . . . . . . . . . . . . . . . . . . . . . . . . . . . . . . . . . . . . . . . . . . . . . . . . . . . . . . . . . . . . . . . . . . . . 17,929,453<br />
NET INCREASE (DECREASE) IN NET ASSETS RESULTING FROM OPERATIONS . . . . . . . . . . . . . . . . . . . . . . . . . . $18,886,945<br />
<strong>The</strong> accompanying notes are an integral part of the financial statements.<br />
17
THE EUROPEAN EQUITY FUND, INC.<br />
STATEMENT OF CHANGES IN NET ASSETS<br />
INCREASE (DECREASE) IN NET ASSETS<br />
Operations:<br />
For the<br />
For the<br />
year ended<br />
year ended<br />
December 31, 2013 December 31, 2012<br />
Net investment income . . . . . . . . . . . . . . . . . . . . . . . . . . . . . . . . . . . . . . . . . . . . . . . . . . . . . $ 957,492 $ 1,193,669<br />
Net realized gain . . . . . . . . . . . . . . . . . . . . . . . . . . . . . . . . . . . . . . . . . . . . . . . . . . . . . . . . . . 7,252,563 3,199,316<br />
Change in net unrealized appreciation . . . . . . . . . . . . . . . . . . . . . . . . . . . . . . . . . . . . . . . . . 10,676,890 9,544,278<br />
Net increase in net assets resulting from operations . . . . . . . . . . . . . . . . . . . . . . . . . . . . . . . 18,886,945 13,937,263<br />
Distributions to shareholders from:<br />
Net investment income . . . . . . . . . . . . . . . . . . . . . . . . . . . . . . . . . . . . . . . . . . . . . . . . . . . . . — (2,923,172)<br />
Capital share transactions:<br />
Net proceeds from reinvestment of dividends (77,880 and 72,390 shares, respectively) . . . 588,772 435,064<br />
Cost of shares tendered and accepted (0 and 529,026 shares, respectively) . . . . . . . . . . . . — (3,745,504)<br />
Cost of shares repurchased (319,635 and 328,667 shares, respectively) . . . . . . . . . . . . . . . (2,518,853) (2,212,885)<br />
Net decrease in net assets from capital share transactions . . . . . . . . . . . . . . . . . . . . . . . . . . (1,930,081) (5,523,325)<br />
Total increase in net assets . . . . . . . . . . . . . . . . . . . . . . . . . . . . . . . . . . . . . . . . . . . . . . . . . . 16,956,864 5,490,766<br />
NET ASSETS<br />
Beginning of year . . . . . . . . . . . . . . . . . . . . . . . . . . . . . . . . . . . . . . . . . . . . . . . . . . . . . . . . . . . 77,511,304 72,020,538<br />
End of year (including undistributed net investment income of $993,209 and $0,<br />
as of December 31, 2013 and December 31, 2012, respectively) . . . . . . . . . . . . . . . . . . . . $94,468,168 $77,511,304<br />
<strong>The</strong> accompanying notes are an integral part of the financial statements.<br />
18
THE EUROPEAN EQUITY FUND, INC.<br />
FINANCIAL HIGHLIGHTS<br />
Selected data for a share of common stock outstanding throughout each of the years indicated:<br />
For the years ended December 31,<br />
2013 2012 2011 2010 2009<br />
Per share operating performance:<br />
Net asset value:<br />
Beginning of year . . . . . . . . . . . . . . . . . . . . . . . . . . . . . . . . . . . . . . . . $ 7.83 $ 6.74 $ 8.18 $ 8.08 $ 6.38<br />
Net investment income (a) . . . . . . . . . . . . . . . . . . . . . . . . . . . . . . . . . . . .10 .12 .11 .07 .11<br />
Net realized and unrealized gains (loss) on investments<br />
and foreign currency . . . . . . . . . . . . . . . . . . . . . . . . . . . . . . . . . . . . 1.84 1.23 (1.57) .06 1.92<br />
<strong>Inc</strong>rease (decrease) from investment operations . . . . . . . . . . . . . . . . . 1.94 1.35 (1.46) .13 2.03<br />
Distributions from net investment income . . . . . . . . . . . . . . . . . . . . . — (.29) (.01) (.06) (.33)<br />
Accretion resulting from tender offer . . . . . . . . . . . . . . . . . . . . . . . . . — .01 .01 — —<br />
Dilution in net asset value from dividend reinvestment . . . . . . . . . . . (.01) (.00) (c) — (.01) (.02)<br />
<strong>Inc</strong>rease resulting from share repurchases . . . . . . . . . . . . . . . . . . . . . .03 .02 .02 .04 .02<br />
Net asset value:<br />
End of year . . . . . . . . . . . . . . . . . . . . . . . . . . . . . . . . . . . . . . . . . . . . $ 9.79 $ 7.83 $ 6.74 $ 8.18 $ 8.08<br />
Market value:<br />
End of year . . . . . . . . . . . . . . . . . . . . . . . . . . . . . . . . . . . . . . . . . . . . $ 8.94 $ 7.03 $ 5.94 $ 7.58 $ 7.05<br />
Total investment return for the year:†<br />
Based upon market value . . . . . . . . . . . . . . . . . . . . . . . . . . . . . . . . . . 27.17% 23.44% (21.56)% 8.32% 36.84%<br />
Based upon net asset value . . . . . . . . . . . . . . . . . . . . . . . . . . . . . . . . . 25.03% 21.17% (17.52)% (b) 1.99%* 33.76%*<br />
Ratio to average net assets:<br />
Ratio of expenses before expense reductions . . . . . . . . . . . . . . . . . . . 1.61% 1.79% 1.60% 1.63% 1.69%<br />
Ratio of expenses after expense reductions . . . . . . . . . . . . . . . . . . . . 1.61% 1.79% 1.60% 1.41% 1.55%<br />
Net investment income . . . . . . . . . . . . . . . . . . . . . . . . . . . . . . . . . . . . 1.14% 1.59% 1.42% 1.00% 1.59%<br />
Portfolio turnover . . . . . . . . . . . . . . . . . . . . . . . . . . . . . . . . . . . . . . . . 77% 87% 73% 67% 77%<br />
Net assets at end of year (000’s omitted) . . . . . . . . . . . . . . . . . . . . . . $94,468 $77,511 $72,021 $94,080 $97,377<br />
(a) Based on average shares outstanding during the year.<br />
(b) <strong>Inc</strong>ludes a reimbursement from the Advisor for losses on investment not meeting investment guidelines. Excluding this reimbursement, total return<br />
would have been 0.37% lower.<br />
(c) Amount is less than $.005 per share.<br />
† Total return based on net asset value reflects changes in the <strong>Fund</strong>’s net asset value during each period. Total return based on market value reflects<br />
changes in the market value during each period. Each figure includes reinvestments of dividend and capital gain distributions, if any. <strong>The</strong>se figures<br />
will differ depending upon the level of any discount from or premium to net asset value at which the <strong>Fund</strong>’s shares trade during the period.<br />
* Total return would have been lower had certain expenses not been reduced.<br />
19
THE EUROPEAN EQUITY FUND, INC.<br />
NOTES TO FINANCIAL STATEMENTS — DECEMBER 31, 2013<br />
NOTE 1. ACCOUNTING POLICIES<br />
<strong>The</strong> <strong>European</strong> <strong>Equity</strong> <strong>Fund</strong>, <strong>Inc</strong>. (the “<strong>Fund</strong>”) was incorporated<br />
in Delaware on April 8, 1986 as a diversified,<br />
closed-end management investment company. Investment<br />
operations commenced on July 23, 1986. <strong>The</strong> <strong>Fund</strong> reincorporated<br />
in Maryland on August 29, 1990 and, on<br />
October 16, 1996, the <strong>Fund</strong> changed from a diversified to<br />
a non-diversified company. <strong>The</strong> <strong>Fund</strong> became a diversified<br />
fund on October 31, 2008.<br />
<strong>The</strong> following is a summary of significant accounting policies<br />
followed by the <strong>Fund</strong> in the preparation of its financial<br />
statements. <strong>The</strong> preparation of financial statements in accordance<br />
with accounting principles generally accepted in<br />
the United States of America requires management to make<br />
estimates and assumptions that affect the reported amounts<br />
and disclosures in the financial statements. Actual results<br />
could differ from those estimates.<br />
Security Valuation: <strong>The</strong> <strong>Fund</strong> calculates its net asset value<br />
(“NAV”) per share for publication at 11:30 a.m., New York<br />
time.<br />
Various inputs are used in determining the value of the<br />
<strong>Fund</strong>’s investments. <strong>The</strong>se inputs are summarized in three<br />
broad levels. Level 1 includes quoted prices in active markets<br />
for identical securities. Level 2 includes other significant<br />
observable inputs (including quoted prices for similar<br />
securities, interest rates, prepayment speeds and credit<br />
risk). Level 3 includes significant unobservable inputs (including<br />
the <strong>Fund</strong>’s own assumptions in determining the fair<br />
value of investments). <strong>The</strong> level assigned to the securities<br />
valuations may not be an indication of the risk or liquidity<br />
associated with investing in those securities.<br />
<strong>Equity</strong> securities are valued at the most recent sale price or<br />
official closing price reported on the exchange (U.S. or foreign)<br />
or over-the-counter market on which they trade prior<br />
to the time of valuation. Securities for which no sales are<br />
reported are valued at the calculated mean between the<br />
most recent bid and asked quotations on the relevant market<br />
or, if a mean cannot be determined, at the most recent bid<br />
quotation. <strong>Equity</strong> securities are generally categorized as<br />
Level 1.<br />
<strong>Investments</strong> in open-end investment companies are valued<br />
at their NAV each business day and are categorized as<br />
Level 1.<br />
Purchased options are generally valued at the settlement<br />
prices established each day on the exchange on which they<br />
are traded and are categorized as Level 1.<br />
Securities and other assets for which market quotations are<br />
not readily available or for which the above valuation procedures<br />
are deemed not to reflect fair value are valued in a<br />
manner that is intended to reflect their fair value as determined<br />
in accordance with procedures approved by the<br />
Board and are generally categorized as Level 3. In accordance<br />
with the <strong>Fund</strong>’s valuation procedures, factors used in<br />
determining value may include, but are not limited to, the<br />
type of the security; the size of the holding; the initial cost<br />
of the security; the existence of any contractual restrictions<br />
on the security’s disposition; the price and extent of public<br />
trading in similar securities of the issuer or of comparable<br />
companies; quotations or evaluated prices from brokerdealers<br />
and/or the appropriate stock exchange (for exchange-traded<br />
securities); an analysis of the company’s or<br />
issuer’s financial statements; an evaluation of the forces<br />
that influence the issuer and the market(s) in which the security<br />
is purchased and sold; and with respect to debt securities,<br />
the maturity, coupon, creditworthiness, currency denomination,<br />
and the movement of the market in which the<br />
security is normally traded. <strong>The</strong> value determined under<br />
these procedures may differ from published values for the<br />
same securities.<br />
Disclosure about the classification of the fair value measurements<br />
is included in a table following the <strong>Fund</strong>’s<br />
Schedule of <strong>Investments</strong>.<br />
Securities Transactions and Investment <strong>Inc</strong>ome:<br />
Investment transactions are accounted for on a trade date<br />
plus one basis for daily NAV calculation. However, for financial<br />
reporting purposes, investment security transactions<br />
are reported on trade date. Interest income is recorded<br />
on the accrual basis. Dividend income is recorded on the<br />
ex-dividend date net of foreign withholding taxes. Certain<br />
dividends from foreign securities may be recorded<br />
20
THE EUROPEAN EQUITY FUND, INC.<br />
NOTES TO FINANCIAL STATEMENTS — DECEMBER 31, 2013 (continued)<br />
subsequent to the ex-dividend date as soon as the <strong>Fund</strong> is<br />
informed of such dividends. Realized gains and losses from<br />
investment transactions are recorded on an identified cost<br />
basis. Proceeds from litigation payments, if any, are included<br />
in net realized gain (loss) for investments.<br />
Securities Lending: Brown Brothers Harriman & Co., as<br />
lending agent, lends securities of the <strong>Fund</strong> to certain financial<br />
institutions under the terms of the Security Lending<br />
Agreement. <strong>The</strong> <strong>Fund</strong> retains the benefits of owning the securities<br />
it has loaned and continues to receive interest and<br />
dividends generated by the securities and to participate in<br />
any changes in their market value. <strong>The</strong> <strong>Fund</strong> requires the<br />
borrowers of the securities to maintain collateral with the<br />
<strong>Fund</strong> consisting of either cash or liquid, unencumbered assets<br />
having a value at least equal to the value of the securities<br />
loaned. When the collateral falls below specified<br />
amounts, the lending agent will use its best effort to obtain<br />
additional collateral on the next business day to meet required<br />
amounts under the security lending agreement. <strong>The</strong><br />
<strong>Fund</strong> may invest the cash collateral into a joint trading account<br />
in an affiliated money market fund pursuant to<br />
Exemptive Orders issued by the SEC. Deutsche Investment<br />
Management Americas <strong>Inc</strong>. receives a management/administration<br />
fee (0.12% annualized effective rate as of<br />
December 31, 2013) on the cash collateral invested in the<br />
affiliated money fund. <strong>The</strong> <strong>Fund</strong> receives compensation for<br />
lending its securities either in the form of fees or by earning<br />
interest on invested cash collateral net of borrower rebates<br />
and fees paid to a lending agent. Either the <strong>Fund</strong> or the borrower<br />
may terminate the loan. <strong>The</strong>re may be risks of delay<br />
and costs in recovery of securities or even loss of rights in<br />
the collateral should the borrower of the securities fail financially.<br />
If the <strong>Fund</strong> is not able to recover securities lent,<br />
the <strong>Fund</strong> may sell the collateral and purchase a replacement<br />
investment in the market, incurring the risk that the value of<br />
the replacement security is greater than the value of the collateral.<br />
<strong>The</strong> <strong>Fund</strong> is also subject to all investment risks associated<br />
with the reinvestment of any cash collateral received,<br />
including, but not limited to, interest rate, credit and<br />
liquidity risk associated with such investments.<br />
As of the year ended December 31, 2013, the <strong>Fund</strong> had securities<br />
on loan. <strong>The</strong> value of the related collateral exceeded<br />
the value of the securities loaned at period end.<br />
Foreign Currency Translation: <strong>The</strong> books and records of<br />
the <strong>Fund</strong> are maintained in United States dollars.<br />
Assets and liabilities denominated in foreign currency are<br />
translated into United States dollars at the 11:00 a.m. midpoint<br />
of the buying and selling spot rates quoted by the<br />
Federal Reserve Bank of New York. Purchases and sales of<br />
investment securities, income and expenses are translated<br />
at the rate of exchange prevailing on the respective dates of<br />
such transactions. Net realized and unrealized gains and<br />
losses on foreign currency transactions represent net gains<br />
and losses between trade and settlement dates on securities<br />
transactions, the acquisition and disposition of foreign currencies,<br />
and the difference between the amount of net investment<br />
income accrued and the U.S. dollar amount actually<br />
received. That portion of both realized and unrealized<br />
gains and losses on investments that results from fluctuations<br />
in foreign currency exchange rates is not separately<br />
disclosed but is included with net realized and unrealized<br />
gain/appreciation and loss/depreciation on investments.<br />
At December 31, 2013, the exchange rate was EUR €1.00<br />
to USD $1.38.<br />
Contingencies: In the normal course of business, the <strong>Fund</strong><br />
may enter into contracts with service providers that contain<br />
general indemnification clauses. <strong>The</strong> <strong>Fund</strong>’s maximum exposure<br />
under these arrangements is unknown as this would<br />
involve future claims that may be made against the <strong>Fund</strong><br />
that have not yet occurred. However, based on experience,<br />
the <strong>Fund</strong> expects the risk of loss to be remote.<br />
Taxes: <strong>The</strong> <strong>Fund</strong>’s policy is to comply with the requirements<br />
of the Internal Revenue Code, as amended, which are<br />
applicable to regulated investment companies, and to distribute<br />
all of its taxable income to its shareholders.<br />
Additionally, the <strong>Fund</strong> may be subject to taxes imposed by<br />
the governments of countries in which it invests and are<br />
generally based on income and/or capital gains earned or<br />
repatriated. Estimated tax liabilities on certain foreign<br />
21
THE EUROPEAN EQUITY FUND, INC.<br />
NOTES TO FINANCIAL STATEMENTS — DECEMBER 31, 2013 (continued)<br />
securities are recorded on an accrual basis and are reflected<br />
as components of interest income or net change in unrealized<br />
gain/loss on investments. Tax liabilities realized as a<br />
result of security sales are reflected as a component of net<br />
realized gain/loss on investments.<br />
Under the Regulated Investment Company Modernization<br />
Act of 2010, net capital losses incurred post-enactment<br />
may be carried forward indefinitely, and their character is<br />
retained as short-term and/or long-term. Previously, net<br />
capital losses were carried forward for eight years and<br />
treated as short-term losses. As a transition rule, the Act requires<br />
that post-enactment net capital losses be used before<br />
pre-enactment net capital losses.<br />
At December 31, 2013, the <strong>Fund</strong> had a net tax basis capital<br />
loss carryforward of approximately $34,174,000 of<br />
pre-enactment losses, which may be applied against any<br />
realized net taxable capital gains of each succeeding year<br />
until fully utilized or until December 31, 2017 (the expiration<br />
date), whichever occurs first.<br />
<strong>The</strong> <strong>Fund</strong> has reviewed the tax positions for the open tax<br />
years as of December 31, 2013 and has determined that no<br />
provision for income tax is required in the <strong>Fund</strong>’s financial<br />
statements. <strong>The</strong> <strong>Fund</strong>’s federal tax returns for the prior<br />
three fiscal years remain open subject to examinations by<br />
the Internal Revenue Service.<br />
Dividends and Distributions to Shareholders: <strong>The</strong> <strong>Fund</strong><br />
records dividends and distributions to its shareholders on<br />
the ex-dividend date. <strong>The</strong> timing and character of certain<br />
income and capital gain distributions are determined annually<br />
in accordance with United States Federal income tax<br />
regulations which may differ from accounting principles<br />
generally accepted in the United States of America. <strong>The</strong>se<br />
differences primarily relate to investments in foreign denominated<br />
investments, investments in foreign passive investment<br />
companies, recognition of certain foreign currency<br />
gains (losses) as ordinary income (loss) and certain<br />
securities sold at a loss. As a result, net investment income<br />
(loss) and net realized gain (loss) on investment transactions<br />
for a reporting period may differ significantly from<br />
distributions during such period. Accordingly, the <strong>Fund</strong><br />
may periodically make reclassifications among certain of<br />
its capital accounts without impacting the NAV of the<br />
<strong>Fund</strong>.<br />
At December 31, 2013, the <strong>Fund</strong>’s components of distributable<br />
earnings (accumulated losses) on a tax basis were as<br />
follows:<br />
Undistributed ordinary income . . . . . . . . . . . . . $ 993,209<br />
Capital loss carryforward . . . . . . . . . . . . . . . . . . $(34,174,000)<br />
Net unrealized appreciation (depreciation) . . . . $ 21,064,079<br />
In addition, the tax character of distributions paid to shareholders<br />
by the <strong>Fund</strong> is summarized as follows:<br />
Years Ended December 31<br />
2013 2012<br />
Distributions from ordinary income* . . $0 $2,923,172<br />
*For tax purposes short-term capital gain is considered ordinary income.<br />
Options. An option contract is a contract in which the<br />
writer (seller) of the option grants the buyer of the option,<br />
upon payment of a premium, the right to purchase from<br />
(call option), or sell to (put option), the writer a designated<br />
instrument at a specified price within a specified period of<br />
time. Certain options, including options on indices and interest<br />
rate options, will require cash settlement by the <strong>Fund</strong><br />
if exercised. For the year ended December 31, 2013, the<br />
<strong>Fund</strong> entered into options for hedging purposes.<br />
If the <strong>Fund</strong> writes a covered call option, the <strong>Fund</strong> foregoes,<br />
in exchange for the premium, the opportunity to profit during<br />
the option period from an increase in the market value<br />
of the underlying security above the exercise price. If the<br />
<strong>Fund</strong> writes a put option it accepts the risk of a decline in<br />
the value of the underlying security below the exercise<br />
price. Over-the-counter options have the risk of the potential<br />
inability of counterparties to meet the terms of their<br />
contracts. <strong>The</strong> <strong>Fund</strong>’s maximum exposure to purchased options<br />
is limited to the premium initially paid. In addition,<br />
certain risks may arise upon entering into option contracts<br />
including the risk that an illiquid secondary market will<br />
limit the <strong>Fund</strong>’s ability to close out an option contract prior<br />
to the expiration date and that a change in the value of the<br />
22
THE EUROPEAN EQUITY FUND, INC.<br />
NOTES TO FINANCIAL STATEMENTS — DECEMBER 31, 2013 (continued)<br />
option contract may not correlate exactly with changes in<br />
the value of the securities hedged.<br />
<strong>The</strong>re were no open option contracts as of December 31,<br />
2013. For the year ended December 31, 2013, the investment<br />
in purchased option contracts had a total value indicative<br />
of a range from $0 to approximately $1,402,000.<br />
<strong>The</strong> following table summarizes the amount of realized<br />
losses on derivative instruments recognized in <strong>Fund</strong> earnings<br />
during the year ended December 31, 2013, and the related<br />
location in the accompanying Statement of<br />
Operations is summarized in the following tables by primary<br />
underlying risk exposure:<br />
Realized Gain (Loss)<br />
Purchased Options<br />
<strong>Equity</strong> Contracts (a) $(2,154,628)<br />
<strong>The</strong> above derivative is located in the following Statement of Operations account:<br />
(a) Net realized gain (loss) from investments (includes purchased options)<br />
NOTE 2. INVESTMENT ADVISORY AND<br />
ADMINISTRATION AGREEMENTS<br />
<strong>The</strong> <strong>Fund</strong> is party to an Investment Advisory Agreement<br />
with Deutsche Asset & Wealth Management International<br />
GmbH (“DeAWMI”). <strong>The</strong> <strong>Fund</strong> also has an Administration<br />
Agreement with Deutsche Investment Management<br />
Americas <strong>Inc</strong>. (“DIMA”). DeAWMI and DIMA are affiliated<br />
companies.<br />
Under the Investment Advisory Agreement with DeAWMI,<br />
DeAWMI directs the investments of the <strong>Fund</strong> in accordance<br />
with its investment objectives, policies and restrictions.<br />
DeAWMI determines the securities, instruments and<br />
other contracts relating to investments to be purchased, sold<br />
or entered into by the <strong>Fund</strong>.<br />
<strong>The</strong> Investment Advisory Agreement provides DeAWMI<br />
with a fee, computed weekly and payable monthly, at the<br />
annual rate of 0.80% of the <strong>Fund</strong>’s average weekly net assets<br />
up to and including $50 million, 0.70% of such assets<br />
in excess of $50 million and up to and including $100 million,<br />
and 0.60% of such assets in excess of $100 million.<br />
Accordingly, for the year ended December 31, 2013, the fee<br />
pursuant to the Investment Advisory Agreement was equivalent<br />
to an annual effective rate of 0.76% of the <strong>Fund</strong>’s average<br />
daily net assets.<br />
Under the Administration Agreement with DIMA, DIMA<br />
provides all of the non-investment advisory services to the<br />
<strong>Fund</strong>. <strong>The</strong> Administration Agreement provides DIMA with<br />
a fee, computed weekly and payable monthly, of 0.20% of<br />
the <strong>Fund</strong>’s average weekly net assets.<br />
NOTE 3. TRANSACTIONS WITH AFFILIATES<br />
<strong>DWS</strong> <strong>Investments</strong> Service Company (“DISC”), an affiliate<br />
of DIMA, is the transfer agent, dividend-paying agent and<br />
shareholder service agent of the <strong>Fund</strong>. Pursuant to a subtransfer<br />
agency agreement between DISC and DST<br />
Systems, <strong>Inc</strong>. (“DST”), DISC has delegated certain transfer<br />
agent and dividend-paying agent paying functions to DST.<br />
DISC compensates DST out of the shareholder servicing<br />
fee it receives from the <strong>Fund</strong>. For the year ended<br />
December 31, 2013, the amount charged to the <strong>Fund</strong> by<br />
DISC aggregated $21,801, of which $1,913 is unpaid.<br />
Deutsche Bank AG, the German parent of DIMA and<br />
DeAWMI, and its affiliates may receive brokerage commissions<br />
as a result of executing agency transactions in portfolio<br />
securities on behalf of the <strong>Fund</strong>, that the Board determined<br />
were effected in compliance with the <strong>Fund</strong>’s Rule 17e-1 procedures.<br />
For the year ended December 31, 2013, Deutsche<br />
Bank did not receive brokerage commissions.<br />
Certain Officers of the <strong>Fund</strong> are also officers of DIMA or<br />
DeAWMI.<br />
<strong>The</strong> <strong>Fund</strong> pays each Director who is not an “interested person”<br />
of DIMA or DeAWMI retainer fees plus specified<br />
amounts for attended board and committee meetings.<br />
<strong>The</strong> <strong>Fund</strong> may invest uninvested cash balances in Central<br />
Cash Management <strong>Fund</strong>, which is managed by DIMA. <strong>The</strong><br />
<strong>Fund</strong> indirectly bears its proportionate share of the expenses<br />
of Central Cash Management <strong>Fund</strong>. Central Cash<br />
Management <strong>Fund</strong> does not pay DIMA an investment management<br />
fee. Central Cash Management <strong>Fund</strong> seeks a high<br />
23
THE EUROPEAN EQUITY FUND, INC.<br />
NOTES TO FINANCIAL STATEMENTS — DECEMBER 31, 2013 (continued)<br />
level of current income consistent with liquidity and the<br />
preservation of capital.<br />
NOTE 4. PORTFOLIO SECURITIES<br />
Purchases and sales of investment securities, excluding<br />
short-term investments, for the year ended December 31,<br />
2013 were $63,231,580 and $66,964,138, respectively.<br />
NOTE 5. CAPITAL<br />
During the year ended December 31, 2013 and the year<br />
ended December 31, 2012, the <strong>Fund</strong> purchased 319,635<br />
and 328,667 of its shares of common stock on the open<br />
market at a total cost of $2,518,853 and $2,212,885 ($7.88<br />
and $6.73 average per share), respectively. <strong>The</strong> weighted<br />
average discount of these purchased shares comparing the<br />
purchased price to the NAV at the time of purchase was<br />
9.28% and 9.47%, respectively.<br />
During the year ended December 31, 2012, the <strong>Fund</strong> accepted<br />
529,026 tendered shares of common stock at a total<br />
cost of $3,745,504 at a repurchase price of $7.08 per share,<br />
which was equal to 98% of the NAV per share on<br />
August 23, 2012.<br />
During the year ended December 31, 2013 and the year<br />
ended December 31, 2012, the <strong>Fund</strong> issued for dividend<br />
reinvestment 77,880 and 72,390 shares, respectively. <strong>The</strong><br />
average discount of these issued shares comparing the issue<br />
price to the NAV at the time of issuance was 9.57% and<br />
9.58%, respectively.<br />
NOTE 6. SHARE REPURCHASES AND TENDER<br />
OFFERS<br />
On July 18, 2011, the <strong>Fund</strong> announced that the Board of<br />
Directors approved an extension of the repurchase program<br />
permitting the <strong>Fund</strong> to repurchase up to 600,000 shares<br />
during the twelve-month period from August 1, 2011<br />
through July 31, 2012. <strong>The</strong> <strong>Fund</strong> repurchased 250,370<br />
shares from August 1, 2011 through July 31, 2012 under<br />
this authorization. On July 18, 2012, the <strong>Fund</strong> announced<br />
that the Board of Directors approved the extension of the<br />
share repurchase program permitting the <strong>Fund</strong> to repurchase<br />
up to 550,000 shares during the period August 1,<br />
2012 through July 31, 2013. <strong>The</strong> <strong>Fund</strong> repurchased 303,395<br />
shares between August 1, 2012 and July 31, 2013. On<br />
July 26, 2013, the <strong>Fund</strong> announced that the Board of<br />
Directors approved an extension of the current repurchase<br />
authorization permitting the <strong>Fund</strong> to repurchase 550,000<br />
shares during the period from August 1, 2013 through<br />
July 31, 2014. <strong>The</strong> <strong>Fund</strong> repurchased 173,373 shares between<br />
August 1, 2013 and December 31, 2013.<br />
Repurchases will be made from time to time when they are<br />
believed to be in the best interests of the <strong>Fund</strong>. <strong>The</strong>re can<br />
be no assurance that the <strong>Fund</strong>’s repurchases or Discount<br />
Management Program will reduce the spread between the<br />
market price of the <strong>Fund</strong>’s shares and its NAV per share.<br />
Monthly updates concerning the <strong>Fund</strong>’s repurchase program<br />
are available on its web site at www.dws-investments.com.<br />
On July 20, 2010, the <strong>Fund</strong> announced that the Board of<br />
Directors approved a series of up to four consecutive semiannual<br />
tender offers each for up to 5% of the <strong>Fund</strong>’s outstanding<br />
shares at a price equal to 98% of NAV. Under the<br />
<strong>Fund</strong>’s Discount Management Program, the <strong>Fund</strong> is required<br />
to conduct a tender offer if its shares trade at an average<br />
discount to NAV of more than 10% during the applicable<br />
twelve-week measurement period.<br />
<strong>The</strong> first measurement period commenced September 1,<br />
2010 and expired on November 24, 2010. During the measurement<br />
period the <strong>Fund</strong>’s shares traded at an average discount<br />
to NAV of 10.02%. <strong>The</strong>refore, the <strong>Fund</strong> conducted a<br />
tender offer which commenced on January 7, 2011 and expired<br />
on February 8, 2011. <strong>The</strong> <strong>Fund</strong> accepted 574,974 tendered<br />
shares (which represents 5% of the <strong>Fund</strong>’s outstanding<br />
shares of common stock) at a price equal to 98% of the<br />
NAV as of the close of the regular trading session of the<br />
New York Stock Exchange on February 9, 2011.<br />
Approximately 4,789,310 shares of common stock, or approximately<br />
42% of the <strong>Fund</strong>’s common shares outstanding,<br />
were tendered through the expiration date. Because the<br />
offer was oversubscribed, not all of the tendered shares<br />
were accepted for payment by the <strong>Fund</strong>. Under the final<br />
pro-ration calculation, approximately 12% of the tendered<br />
shares were accepted for payment. <strong>The</strong> shares accepted for<br />
payment received cash at a repurchase price of $8.62 per<br />
24
THE EUROPEAN EQUITY FUND, INC.<br />
NOTES TO FINANCIAL STATEMENTS — DECEMBER 31, 2013 (continued)<br />
share, which was equal to 98% of the NAV per share on<br />
February 9, 2011.<br />
<strong>The</strong> second measurement period commenced on March 7,<br />
2011 and expired on May 27, 2011 and the third measurement<br />
period commenced on August 29, 2011 and expired<br />
on November 18, 2011. During these measurement periods<br />
the <strong>Fund</strong>’s shares traded at an average discount to NAV of<br />
less than 10%. <strong>The</strong>refore, the <strong>Fund</strong> was not required to conduct<br />
a tender offer.<br />
<strong>The</strong> fourth measurement period commenced on March 5,<br />
2012 and expired on May 25, 2012. During the measurement<br />
period, the <strong>Fund</strong>’s shares traded at an average discount<br />
to NAV of 10.17%. <strong>The</strong>refore, the <strong>Fund</strong> conducted a tender<br />
offer which commenced on July 25, 2012 and expired on<br />
August 22, 2012. <strong>The</strong> <strong>Fund</strong> accepted 529,026 tendered<br />
shares at a price equal to 98% of the NAV per share as of the<br />
close of the regular trading session of the New York Stock<br />
Exchange on August 23, 2012. Approximately 5,314,744<br />
shares of common stock, or approximately 50% of the<br />
<strong>Fund</strong>’s common shares outstanding, were tendered through<br />
the expiration date. Because the offer was oversubscribed,<br />
not all of the tendered shares were accepted for payment by<br />
the <strong>Fund</strong>. Under the final pro-ration calculation, approximately<br />
10% of the tendered shares were accepted for payment.<br />
<strong>The</strong> shares accepted for payment received cash at a<br />
repurchase price of $7.08 per share, which was equal to 98%<br />
of the NAV per share on August 23, 2012.<br />
On January 31, 2012, the <strong>Fund</strong> announced that the Board of<br />
Directors approved a new Discount Management Program<br />
(the “New Program”) on the same terms as the <strong>Fund</strong>’s then<br />
current program. Pursuant to the New Program, the <strong>Fund</strong>’s<br />
Board of Directors approved a new series of up to four consecutive<br />
semi-annual tender offers, each for up to 5% of the<br />
<strong>Fund</strong>’s outstanding shares at a price equal to 98% of NAV.<br />
<strong>The</strong> <strong>Fund</strong> will conduct a tender offer if its shares trade at an<br />
average discount to NAV of more than 10% during the<br />
twelve-week measurement period. <strong>The</strong> first measurement<br />
period commenced on September 10, 2012 and expired on<br />
November 30, 2012, the second measurement period commenced<br />
on March 25, 2013 and expired on June 14, 2013<br />
and the third measurement period commenced on<br />
September 16, 2013 and expired on December 6, 2013.<br />
25<br />
During these measurement periods, the <strong>Fund</strong>’s shares traded<br />
at an average discount to NAV of less than 10%. <strong>The</strong>refore,<br />
the <strong>Fund</strong> was not required to conduct a tender offer. On<br />
January 27, 2014, the <strong>Fund</strong> announced that the next measurement<br />
period will commence on April 7, 2014 and expire<br />
on June 27, 2014.<br />
NOTE 7. CONCENTRATION OF OWNERSHIP<br />
From time to time, the <strong>Fund</strong> may have a concentration of<br />
several shareholder accounts holding a significant percentage<br />
of shares outstanding. Investment activities of these<br />
shareholders could have a material impact on the <strong>Fund</strong>. At<br />
December 31, 2013, there were 3 shareholders that held approximately<br />
13%, 9% and 8%, respectively, of the outstanding<br />
shares of the <strong>Fund</strong>.
REPORT OF INDEPENDENT REGISTERED PUBLIC ACCOUNTING FIRM<br />
To the Board of Directors and Shareholders of<br />
<strong>The</strong> <strong>European</strong> <strong>Equity</strong> <strong>Fund</strong>, <strong>Inc</strong>.<br />
In our opinion, the accompanying statement of assets and liabilities, including the schedule of investments, and the<br />
related statements of operations and of changes in net assets and the financial highlights present fairly, in all material<br />
respects, the financial position of <strong>The</strong> <strong>European</strong> <strong>Equity</strong> <strong>Fund</strong>, <strong>Inc</strong>. (the “<strong>Fund</strong>”) at December 31, 2013, the results of its<br />
operations, the changes in its net assets and the financial highlights for each of the periods indicated therein, in conformity<br />
with accounting principles generally accepted in the United States of America. <strong>The</strong>se financial statements and financial<br />
highlights (hereafter referred to as “financial statements”) are the responsibility of the <strong>Fund</strong>’s management. Our<br />
responsibility is to express an opinion on these financial statements based on our audits. We conducted our audits of<br />
these financial statements in accordance with the standards of the Public Company Accounting Oversight Board (United<br />
States). Those standards require that we plan and perform the audit to obtain reasonable assurance about whether the<br />
financial statements are free of material misstatement. An audit includes examining, on a test basis, evidence supporting<br />
the amounts and disclosures in the financial statements, assessing the accounting principles used and significant estimates<br />
made by management, and evaluating the overall financial statement presentation. We believe that our audits, which<br />
included confirmation of securities at December 31, 2013 by correspondence with the custodian, provide a reasonable<br />
basis for our opinion.<br />
PricewaterhouseCoopers LLP<br />
Boston, Massachusetts<br />
February 21, 2014<br />
26
VOLUNTARY CASH PURCHASE PROGRAM AND DIVIDEND REINVESTMENT PLAN<br />
(unaudited)<br />
<strong>The</strong> <strong>Fund</strong> offers shareholders a Voluntary Cash Purchase<br />
Program and Dividend Reinvestment Plan (“Plan”) which<br />
provides for optional cash purchases and for the automatic<br />
reinvestment of dividends and distributions payable by the<br />
<strong>Fund</strong> in additional <strong>Fund</strong> shares. A more complete description<br />
of the Plan is provided in the Plan brochure available<br />
from <strong>DWS</strong> <strong>Investments</strong> Service Company, the transfer<br />
agent (the “Transfer Agent”), P.O. Box 219066, Kansas<br />
City, Missouri 64105 (telephone 1-800-437-6269).<br />
Computershare, <strong>Inc</strong>. (the “Plan Agent”) acts as the plan<br />
agent under the Plan. A shareholder should read the Plan<br />
brochure carefully before enrolling in the Plan.<br />
Under the Plan, participating shareholders (“Plan<br />
Participants”) appoint the Transfer Agent to receive or invest<br />
<strong>Fund</strong> distributions as described below under<br />
“Reinvestment of <strong>Fund</strong> Shares.” In addition, Plan<br />
Participants may make optional cash purchases through the<br />
Transfer Agent as often as once a month as described below<br />
under “Voluntary Cash Purchases.” <strong>The</strong>re is no charge to<br />
Plan Participants for participating in the Plan, although<br />
when shares are purchased under the Plan by the Plan<br />
Agent on the New York Stock Exchange or otherwise on the<br />
open market, each Plan Participant will pay a pro rata share<br />
of brokerage commissions incurred in connection with<br />
such purchases, as described below under “Reinvestment of<br />
<strong>Fund</strong> Shares” and “Voluntary Cash Purchases.”<br />
Reinvestment of <strong>Fund</strong> Shares. Whenever the <strong>Fund</strong> declares<br />
a capital gain distribution, an income dividend or a<br />
return of capital distribution payable, at the election of<br />
shareholders, either in cash or in <strong>Fund</strong> shares, or payable<br />
only in cash, the Transfer Agent shall automatically elect to<br />
receive <strong>Fund</strong> shares for the account of each Plan<br />
Participant.<br />
Whenever the <strong>Fund</strong> declares a capital gain distribution,<br />
an income dividend or a return of capital distribution<br />
payable only in cash and the net asset value per share of the<br />
<strong>Fund</strong>’s common stock equals or is less than the market<br />
price per share on the valuation date (the “Market Parity or<br />
Premium”), the Transfer Agent shall apply the amount of<br />
such dividend or distribution payable to a Plan Participant<br />
to the purchase from the <strong>Fund</strong> of <strong>Fund</strong> Shares for a Plan<br />
Participant’s account, except that if the <strong>Fund</strong> does not offer<br />
shares for such purpose because it concludes Securities Act<br />
registration would be required and such registration cannot<br />
be timely effected or is not otherwise a cost-effective alternative<br />
for the <strong>Fund</strong>, then the Transfer Agent shall follow the<br />
procedure described in the next paragraph. <strong>The</strong> number of<br />
additional shares to be credited to a Plan Participant’s account<br />
shall be determined by dividing the dollar amount of<br />
the distribution payable to a Plan Participant by the net asset<br />
value per share of the <strong>Fund</strong>’s common stock on the valuation<br />
date, or if the net asset value per share is less than<br />
95% of the market price per share on such date, then by<br />
95% of the market price per share. <strong>The</strong> valuation date will<br />
be the payable date for such dividend or distribution.<br />
Whenever the <strong>Fund</strong> declares a capital gains distribution,<br />
an income dividend or a return of capital distribution<br />
payable only in cash and the net asset value per share of the<br />
<strong>Fund</strong>’s common stock exceeds the market price per share<br />
on the valuation date (the “Market Discount”), the Plan<br />
Agent shall apply the amount of such dividend or distribution<br />
payable to a Plan Participant (less a Plan Participant’s<br />
pro rata share of brokerage commissions incurred with respect<br />
to open-market purchases in connection with the reinvestment<br />
of such dividend or distribution) to the purchase<br />
on the open market of <strong>Fund</strong> shares for a Plan Participant’s<br />
account. <strong>The</strong> valuation date will be the payable date for<br />
such dividend or distribution. Such purchases will be made<br />
on or shortly after the valuation date and in no event more<br />
than 30 days after such date except where temporary curtailment<br />
or suspension of purchase is necessary to comply<br />
with applicable provisions of federal securities laws.<br />
<strong>The</strong> Transfer Agent or the Plan Agent may aggregate a<br />
Plan Participant’s purchases with the purchases of other<br />
Plan Participants, and the average price (including brokerage<br />
commissions) of all shares purchased by the Plan Agent<br />
shall be the price per share allocable to each Plan<br />
Participant.<br />
For all purposes of the Plan, the market price of the<br />
<strong>Fund</strong>’s common stock on a payable date shall be the last<br />
sales price on the New York Stock Exchange on that date,<br />
or, if there is no sale on such Exchange (or, if different, the<br />
27
VOLUNTARY CASH PURCHASE PROGRAM AND DIVIDEND REINVESTMENT PLAN<br />
(unaudited) (continued)<br />
principal exchange for <strong>Fund</strong> shares) on that date, then the<br />
mean between the closing bid and asked quotations for<br />
such stock on such Exchange on such date. <strong>The</strong> net asset<br />
value per share of the <strong>Fund</strong>’s common stock on a valuation<br />
date shall be as determined by or on behalf of the <strong>Fund</strong>.<br />
<strong>The</strong> Transfer Agent may hold a Plan Participant’s shares<br />
acquired pursuant to the Plan, together with the shares of<br />
other Plan Participants acquired pursuant to this Plan, in<br />
non-certificated form in the name of the Transfer Agent or<br />
that of a nominee. <strong>The</strong> Transfer Agent will forward to each<br />
Plan Participant any proxy solicitation material and will<br />
vote any shares so held for a Plan Participant only in accordance<br />
with the proxy returned by a Plan Participant to the<br />
<strong>Fund</strong>. Upon a Plan Participant’s written request, the<br />
Transfer Agent will deliver to a Plan Participant, without<br />
charge, a certificate or certificates for the full shares held<br />
by the Transfer Agent.<br />
Voluntary Cash Purchases. Plan Participants have the<br />
option of making investments in <strong>Fund</strong> shares through the<br />
Transfer Agent as often as once a month. Plan Participants<br />
may invest as little as $100 in any month and may invest up<br />
to $36,000 annually through the voluntary cash purchase<br />
feature of the Plan.<br />
<strong>The</strong> Plan Agent shall apply such funds (less a Plan<br />
Participant’s pro rata share of brokerage commissions or<br />
other costs, if any) to the purchase on the New York Stock<br />
Exchange (or, if different, on the principal exchange for<br />
<strong>Fund</strong> shares) or otherwise on the open market of <strong>Fund</strong><br />
shares for such Plan Participant’s account, regardless of<br />
whether there is a Market Parity or Premium or a Market<br />
Discount. <strong>The</strong> Plan Agent will purchase shares for Plan<br />
Participants on or about the 15th of each month. Cash payments<br />
received by the Transfer Agent less than five business<br />
days prior to a cash purchase investment date will be<br />
held by the Transfer Agent until the next month’s investment<br />
date. Uninvested funds will not bear interest. Plan<br />
Participants may withdraw any voluntary cash payment by<br />
written notice received by the Transfer Agent not less than<br />
48 hours before such payment is to be invested.<br />
Enrollment and Withdrawal. Both current shareholders<br />
and first-time investors in the <strong>Fund</strong> are eligible to participate<br />
in the Plan. Current shareholders may join the Plan<br />
by either enrolling their shares with the Transfer Agent or<br />
by making an initial cash deposit of at least $250 with the<br />
Transfer Agent. First-time investors in the <strong>Fund</strong> may join<br />
the Plan by making an initial cash deposit of at least $250<br />
with the Transfer Agent. In order to become a Plan<br />
Participant, shareholders must complete and sign the enrollment<br />
form included in the Plan brochure and return it,<br />
and, if applicable, an initial cash deposit of at least $250 directly<br />
to the Transfer Agent if shares are registered in their<br />
name. Shareholders who hold <strong>Fund</strong> shares in the name of a<br />
brokerage firm, bank or other nominee should contact such<br />
nominee to arrange for it to participate in the Plan on such<br />
shareholder’s behalf.<br />
If the Plan Participant elects to participate in the Plan by<br />
enrolling current shares owned by the Plan Participant with<br />
the Transfer Agent, participation in the dividend reinvestment<br />
feature of the Plan begins with the next dividend or<br />
capital gains distribution payable after the Transfer Agent<br />
receives the Plan Participant’s written authorization, provided<br />
such authorization is received by the Transfer Agent<br />
prior to the record date for such dividend or distribution. If<br />
such authorization is received after such record date, the<br />
Plan Participant’s participation in the dividend reinvestment<br />
feature of the Plan begins with the following dividend<br />
or distribution.<br />
If the Plan Participant elects to participate in the Plan by<br />
making an initial cash deposit of at least $250 with the<br />
Transfer Agent, participation in the dividend reinvestment<br />
feature of the Plan begins with the next dividend or capital<br />
gains distribution payable after the Transfer Agent receives<br />
the Plan Participant’s authorization and deposit, and after<br />
the Plan Agent purchases shares for the Plan Participant on<br />
the New York Stock Exchange (or, if different, on the principal<br />
exchange for <strong>Fund</strong> shares) or otherwise on the open<br />
market, provided that the authorization and deposit are received,<br />
and the purchases are made by the Plan Agent prior<br />
to the record date. If such authorization and deposit are received<br />
after the record date, or if the Plan Agent purchases<br />
28
VOLUNTARY CASH PURCHASE PROGRAM AND DIVIDEND REINVESTMENT PLAN<br />
(unaudited) (continued)<br />
shares for the Plan Participant after the record date, the<br />
Plan Participant’s participation in the dividend reinvestment<br />
feature of the Plan begins with the following dividend<br />
or distribution.<br />
A shareholder’s written authorization and cash payment<br />
must be received by the Transfer Agent at least five business<br />
days in advance of the next cash purchase investment<br />
date (normally the 15th of every month) in order for the<br />
Plan Participant to participate in the voluntary cash purchase<br />
feature of the Plan in that month.<br />
Plan Participants may withdraw from the Plan without<br />
charge by written notice to the Transfer Agent. Plan<br />
Participants who choose to withdraw may elect to receive<br />
stock certificates representing all of the full shares held by<br />
the Transfer Agent on their behalf, or to instruct the<br />
Transfer Agent to sell such full shares and distribute the<br />
proceeds, net of brokerage commissions, to such withdrawing<br />
Plan Participant. Withdrawing Plan Participants will receive<br />
a cash adjustment for the market value of any<br />
fractional shares held on their behalf at the time of termination.<br />
Withdrawal will be effective immediately with respect<br />
to distributions with a record date not less than 10 days later<br />
than receipt of such written notice by the Transfer Agent.<br />
Amendment and Termination of Plan. <strong>The</strong> Plan may<br />
only be amended or supplemented by the <strong>Fund</strong> or by the<br />
Transfer Agent by giving each Plan Participant written notice<br />
at least 90 days prior to the effective date of such<br />
amendment or supplement, except that such notice period<br />
may be shortened when necessary or appropriate in order to<br />
comply with applicable law or the rules or policies of the<br />
Securities and Exchange Commission or any other regulatory<br />
body.<br />
<strong>The</strong> Plan may be terminated by the <strong>Fund</strong> or by the<br />
Transfer Agent by written notice mailed to each Plan<br />
Participant. Such termination will be effective with respect<br />
to all distributions with a record date at least 90 days after<br />
the mailing of such written notice to the Plan Participants.<br />
Federal <strong>Inc</strong>ome Tax Implications of Reinvestment<br />
of <strong>Fund</strong> Shares. Reinvestment of <strong>Fund</strong> shares does not<br />
relieve Plan Participants from any income tax which may<br />
be payable on dividends or distributions. For U.S. federal<br />
income tax purposes, when the <strong>Fund</strong> issues shares representing<br />
an income dividend or a capital gains dividend, a<br />
Participant will include in income the fair market value of<br />
the shares received as of the payment date, which will be<br />
ordinary dividend income or capital gains, as the case may<br />
be. <strong>The</strong> shares will have a tax basis equal to such fair market<br />
value, and the holding period for the shares will begin<br />
on the day after the date of distribution. If shares are purchased<br />
on the open market by the Plan Agent, a Plan<br />
Participant will include in income the amount of the cash<br />
payment made. <strong>The</strong> basis of such shares will be the purchase<br />
price of the shares, and the holding period for the<br />
shares will begin on the day following the date of purchase.<br />
State, local and foreign taxes may also be applicable.<br />
29
THE EUROPEAN EQUITY FUND, INC.<br />
REPORT OF STOCKHOLDERS’ MEETING (unaudited)<br />
<strong>The</strong> <strong>Annual</strong> Meeting of Stockholders (the “Meeting”) of <strong>The</strong> <strong>European</strong> <strong>Equity</strong> <strong>Fund</strong>, <strong>Inc</strong>. was held on June 26, 2013. At the<br />
close of business on May 8, 2013, the record date for the determination of stockholders entitled to vote at the Meeting, there<br />
were issued and outstanding 9,912,359 shares of the <strong>Fund</strong>’s common stock, each share being entitled to one vote, constituting<br />
all of the <strong>Fund</strong>’s outstanding voting securities. At the Meeting, the holders of 8,281,297 shares of the <strong>Fund</strong>’s common<br />
stock were represented in person or by proxy, constituting a quorum. At the Meeting, the following matters were voted upon<br />
by the stockholders. <strong>The</strong> resulting votes are presented below:<br />
1. To elect three (3) Class II Directors, each to serve for a term of three years and until his successor is elected and qualifies.<br />
Number of Votes<br />
For<br />
Withheld<br />
Ambassador Richard R. Burt 7,021,216 1,260,081<br />
Dr. Friedbert H. Malt 7,758,721 522,576<br />
Mr. Joachim Wagner 7,794,448 486,849<br />
2. To elect one (1) Class I Director, to serve for a term of three years and until his successor is elected and qualifies.<br />
Number of Votes<br />
For<br />
Withheld<br />
Dr. Wilhelm Bender 7,009,260 1,272,037<br />
3. To ratify the appointment by the Audit Committee and the Board of Directors of PricewaterhouseCoopers LLP, an independent<br />
public accounting firm, as independent auditors for the fiscal year ending December 31, 2013.<br />
Number of Votes<br />
For Against Abstain<br />
8,129,469 91,695 71,250<br />
PROXY VOTING<br />
A description of the <strong>Fund</strong>’s policies and procedures for voting proxies for portfolio securities and information about how<br />
the <strong>Fund</strong> voted proxies related to its portfolio securities during the 12-month period ended June 30 is available on our web<br />
site — www.dws-investments.com or on the SEC’s web site — www.sec.gov. To obtain a written copy of the <strong>Fund</strong>’s policies<br />
and procedures without charge, upon request, call us toll free at (800) 349-4281.<br />
30
SHARES REPURCHASED AND ISSUED<br />
<strong>The</strong> <strong>Fund</strong> has been purchasing shares of its common stock in the open market. Shares repurchased and shares issued for<br />
dividend reinvestment for the past five years are as follows:<br />
Fiscal Years Ended December 31, 2013 2012 2011 2010 2009<br />
Shares repurchased 319,635 328,667 244,836 627,075 265,168<br />
Shares issued for dividend reinvestment 77,880 72,390 — 77,238 207,315<br />
Shares tendered and accepted — 529,026 574,974 — —<br />
31
PRIVACY NOTICE<br />
FACTS<br />
Why<br />
What<br />
How<br />
What Does Deutsche Asset & Wealth Management Do With Your Personal Information<br />
Financial companies choose how they share your personal information. Federal law gives consumers<br />
the right to limit some but not all sharing. Federal law also requires us to tell you how we<br />
collect, share, and protect your personal information. Please read this notice carefully to understand<br />
what we do.<br />
<strong>The</strong> types of personal information we collect and share can include:<br />
• Social Security number<br />
• Account balances<br />
• Purchase and transaction history<br />
• Bank account information<br />
• Contact information such as mailing address, e-mail address and telephone number<br />
All financial companies need to share customers’ personal information to run their everyday business.<br />
In the section below, we list the reasons financial companies can share their customers’ personal<br />
information; the reasons Deutsche Asset & Wealth Management chooses to share; and<br />
whether you can limit this sharing.<br />
Does Deutsche Asset &<br />
Reasons we can share your personal Wealth Management Can you limit this<br />
information share sharing<br />
For our everyday business purposes — such as to<br />
process your transactions, maintain your account(s), respond<br />
to court orders or legal investigations<br />
Yes<br />
No<br />
For our marketing purposes — to offer our products and<br />
services to you<br />
Yes<br />
No<br />
For joint marketing with other financial companies No We do not share<br />
For our affiliates’ everyday business purposes —<br />
information about your transactions and experiences<br />
For our affiliates’ everyday business purposes —<br />
information about your creditworthiness<br />
No<br />
No<br />
We do not share<br />
We do not share<br />
For nonaffiliates to market to you No We do not share<br />
Questions<br />
Call (800) 349-4281 or e-mail us at service@dws.com<br />
32
PRIVACY NOTICE (continued)<br />
Who we are<br />
Who is providing<br />
this notice<br />
What we do<br />
How does Deutsche<br />
Asset & Wealth<br />
Management protect<br />
my personal<br />
information<br />
How does Deutsche<br />
Asset & Wealth<br />
Management collect<br />
my personal<br />
information<br />
Why can’t I limit all<br />
sharing<br />
Definitions<br />
Affiliates<br />
Non-affiliates<br />
Joint marketing<br />
<strong>The</strong> <strong>European</strong> <strong>Equity</strong> <strong>Fund</strong>, <strong>Inc</strong>.<br />
To protect your personal information from unauthorized access and use, we use security measures<br />
that comply with federal law. <strong>The</strong>se measures include computer safeguards and secured files<br />
and buildings.<br />
We collect your personal information, for example. When you<br />
• open an account<br />
• give us your contact information<br />
• provide bank account information for ACH or wire transactions<br />
• tell us where to send money<br />
• seek advice about your investments<br />
Federal law gives you the right to limit only<br />
• sharing for affiliates’ everyday business purposes — information about your creditworthiness<br />
• affiliates from using your information to market to you<br />
• sharing for nonaffiliates to market to you<br />
State laws and individual companies may give you additional rights to limit sharing.<br />
Companies related by common ownership or control. <strong>The</strong>y can be financial or non-financial<br />
companies. Our affiliates include financial companies with the <strong>DWS</strong> or Deutsche Bank (“DB”)<br />
name, such as DB AG Frankfurt and DB Alex Brown.<br />
Companies not related by common ownership or control. <strong>The</strong>y can be financial and nonfinancial<br />
companies.<br />
Non-affiliates we share with include account service providers; service quality monitoring services;<br />
mailing service providers; and verification services to help in the fight against money laundering<br />
and fraud.<br />
A formal agreement between nonaffiliated financial companies that together market financial<br />
products or services to you.<br />
• Deutsche Asset & Wealth Management does not jointly market.<br />
33
THE EUROPEAN EQUITY FUND, INC.<br />
APPROVAL OF CONTINUANCE OF INVESTMENT ADVISORY AGREEMENT (unaudited)<br />
<strong>The</strong> <strong>Fund</strong>’s directors unanimously approved the continuance<br />
of the investment advisory agreement between the<br />
<strong>Fund</strong> and Deutsche Asset & Wealth Management<br />
International GmbH (“DeAWMI”) (the “agreement”) at a<br />
meeting held on October 18, 2013. <strong>The</strong> <strong>Fund</strong>’s directors simultaneously<br />
approved the continuance of the administration<br />
agreement (the “administration agreement”) between<br />
the <strong>Fund</strong> and Deutsche Investment Management Americas<br />
<strong>Inc</strong>. (“DIMA”), an affiliate of DeAWMI.<br />
In preparation for the meeting, the directors had requested,<br />
received and evaluated extensive materials from<br />
DeAWMI, including performance and expense information<br />
for other investment companies with similar investment objectives<br />
derived from data compiled by Lipper <strong>Inc</strong>.<br />
(“Lipper”). Prior to voting, the directors reviewed the proposed<br />
approval of the continuance of the agreement with<br />
management and with experienced counsel who are independent<br />
of DeAWMI and received a memorandum from<br />
such counsel discussing the legal standards for their consideration<br />
of the proposed approval of the continuance. <strong>The</strong> directors<br />
also discussed the proposed approval in a private<br />
session with counsel at which no representatives of<br />
DeAWMI were present. In reaching their determination relating<br />
to approval of the agreement, the directors considered<br />
all factors they believed relevant, including the<br />
following:<br />
1. information comparing the <strong>Fund</strong>’s performance to<br />
other investment companies with similar investment objectives<br />
and to an index;<br />
2. the nature, extent and quality of investment advisory<br />
and other services rendered by DeAWMI;<br />
3. payments received by DeAWMI from all sources in<br />
respect to the <strong>Fund</strong> and all investment companies in the<br />
Deutsche family of funds;<br />
4. the costs borne by, and profitability of, DeAWMI and<br />
its affiliates (including DIMA) in providing services to the<br />
<strong>Fund</strong> and to all investment companies in the Deutsche family<br />
of funds;<br />
5. comparative fee and expense data for the <strong>Fund</strong> and<br />
other investment companies with similar investment<br />
objectives;<br />
6. the extent to which economies of scale would be realized<br />
as the <strong>Fund</strong> grows and whether fee levels reflect these<br />
economies of scale for the benefit of investors;<br />
7. DeAWMI’s policies and practices regarding allocation<br />
of the <strong>Fund</strong>’s portfolio transactions, including the extent<br />
to which DeAWMI benefits from soft dollar<br />
arrangements;<br />
8. the <strong>Fund</strong>’s portfolio turnover rates compared to those<br />
of other investment companies with similar investment<br />
objectives;<br />
9. fall-out benefits which DeAWMI and its affiliates receive<br />
from their relationships with the <strong>Fund</strong>;<br />
10. information concerning the programs established by<br />
DeAWMI with respect to compliance, risk management,<br />
disclosure and ethics;<br />
11. the professional experience and qualifications of the<br />
<strong>Fund</strong>’s portfolio management team and other senior personnel<br />
of DeAWMI; and DeAWMI’s strengthening of the<br />
investment resources supporting the <strong>Fund</strong> in 2009; and<br />
12. the terms of the agreement.<br />
<strong>The</strong> directors also considered their knowledge of the nature<br />
and quality of the services provided by DIMA and<br />
DeAWMI to the <strong>Fund</strong> gained from their experience as directors<br />
of the New Germany <strong>Fund</strong> and the Central Europe,<br />
Russia and Turkey <strong>Fund</strong> and, where relevant, other<br />
Deutsche funds, their confidence in DeAWMI’s integrity<br />
and competence gained from that experience and<br />
DeAWMI’s responsiveness to concerns raised by them in<br />
the past, including DeAWMI’s willingness to consider and<br />
implement organizational and operational changes designed<br />
to improve investment results and the services provided<br />
to the <strong>Fund</strong>.<br />
In their deliberations, the directors did not identify any<br />
particular information that was all-important or controlling,<br />
34
THE EUROPEAN EQUITY FUND, INC.<br />
APPROVAL OF CONTINUANCE OF INVESTMENT ADVISORY AGREEMENT (unaudited) (continued)<br />
and each director attributed different weights to the various<br />
factors.<br />
<strong>The</strong> directors determined that the overall arrangements<br />
between the <strong>Fund</strong> and DeAWMI, as provided in the agreement,<br />
were fair and reasonable in light of the services performed,<br />
expenses incurred and such other matters as the<br />
directors considered relevant in the exercise of their reasonable<br />
judgment. <strong>The</strong> directors further determined that they<br />
were satisfied that the services provided by DeAWMI to the<br />
<strong>Fund</strong> represented good value for the money payable to it by<br />
the <strong>Fund</strong>.<br />
<strong>The</strong> material factors and conclusions that formed the basis<br />
for the directors’ reaching their determination to approve<br />
the continuance of the agreement (including their<br />
determinations that DeAWMI should continue in its role as<br />
investment advisor for the <strong>Fund</strong>, and that the fees payable<br />
to DeAWMI pursuant to the agreement are appropriate)<br />
were separately discussed by the directors.<br />
Nature, Extent and Quality of Services Provided by<br />
DeAWMI<br />
<strong>The</strong> directors noted that, under the agreement, DeAWMI,<br />
in accordance with the <strong>Fund</strong>’s investment objectives, policies<br />
and limitations, makes all decisions with respect to suitable<br />
securities for investment by the <strong>Fund</strong> and transmits<br />
purchase and sale orders and selects brokers and dealers to<br />
execute portfolio transactions on behalf of the <strong>Fund</strong>.<br />
DeAWMI pays all of the compensation of the <strong>Fund</strong>’s directors<br />
and officers who are interested persons of DeAWMI.<br />
<strong>The</strong> directors considered the scope and quality of services<br />
provided by DeAWMI under the agreement and noted<br />
that the scope of services provided had expanded over<br />
time as a result of regulatory and other developments. <strong>The</strong><br />
directors also considered the commitment of DeAWMI to,<br />
and the programs established by it with respect to, compliance,<br />
risk management, disclosure and ethics. <strong>The</strong> directors<br />
considered the quality of the investment research<br />
capabilities of DeAWMI and the other resources it has<br />
dedicated to performing services for the <strong>Fund</strong>. <strong>The</strong> quality<br />
of the advisory services provided also were considered.<br />
<strong>The</strong> directors concluded that, overall, they were satisfied<br />
with the nature, extent and quality of services provided<br />
(and expected to be provided) to the <strong>Fund</strong> under the<br />
agreement.<br />
Costs of Services Provided and Profitability to DeAWMI<br />
At the request of the directors, DeAWMI provided information<br />
concerning the profitability of its investment advisory<br />
and investment company activities and financial<br />
condition based on historical information for 2011 and<br />
2012. Similar information was provided for DIMA. <strong>The</strong> directors<br />
reviewed the assumptions and methods of allocation<br />
used by DeAWMI and DIMA in preparing <strong>Fund</strong> specific<br />
profitability data. DeAWMI and DIMA stated their belief<br />
that the methods of allocation used were reasonable, but<br />
noted that there are limitations inherent in allocating costs<br />
to multiple individual clients served by organizations such<br />
as DIMA and DeAWMI where each of the clients draws on,<br />
and benefits from, the research and other resources of the<br />
Deutsche Bank organization.<br />
<strong>The</strong> directors recognized that it is difficult to make comparisons<br />
of profitability from fund advisory contracts because<br />
comparative information is not generally publicly<br />
available and is affected by numerous factors, including the<br />
structure of the particular advisor, the types of funds it<br />
manages, its business mix, numerous assumptions regarding<br />
allocations and the advisor’s capital structure and cost<br />
of capital. In considering profitability information, the directors<br />
considered the effect of possible fall-out benefits on<br />
DeAWMI’s expenses, including the fact that there were no<br />
affiliated brokerage commissions.<br />
<strong>The</strong> directors noted that DeAWMI may allocate brokerage<br />
to receive research generated by, or paid for by, executing<br />
brokers. <strong>The</strong>y also noted that DeAWMI has policies to<br />
prohibit consideration of the sale of shares of Deutsche<br />
funds when selecting broker dealers to execute portfolio<br />
transactions for the <strong>Fund</strong> or other Deutsche funds.<br />
<strong>The</strong> directors recognized that DeAWMI should, as a<br />
general matter, be entitled to earn a reasonable level of<br />
profits for the services it provides to the <strong>Fund</strong> and, based on<br />
their review, concluded that DeAWMI’s level of profitability<br />
from its relationships with the <strong>Fund</strong> was not excessive.<br />
35
THE EUROPEAN EQUITY FUND, INC.<br />
APPROVAL OF CONTINUANCE OF INVESTMENT ADVISORY AGREEMENT (unaudited) (continued)<br />
Investment Results<br />
In addition to the information received by the directors<br />
for the meeting, the directors receive detailed performance<br />
information for the <strong>Fund</strong> at each regular board meeting during<br />
the year and also receive monthly performance information.<br />
<strong>The</strong> directors reviewed information showing the<br />
<strong>Fund</strong>’s performance compared to that of other investment<br />
vehicles compiled by Lipper (a total of 25 funds, consisting<br />
of exchange-traded funds, open-end funds and single-country<br />
funds). <strong>The</strong> directors also reviewed information showing<br />
performance of the <strong>Fund</strong>’s benchmark index, which,<br />
since November 1, 2005 (when the <strong>Fund</strong> changed its investment<br />
focus from Germany to the <strong>European</strong> countries utilizing<br />
the Euro currency), was the MSCI EMU index, an<br />
unmanaged capitalization-weighted index comprising several<br />
hundred companies domiciled in the countries using<br />
the Euro currency, and prior thereto was the Germany DAX<br />
index of 30 large cap stocks.<br />
<strong>The</strong> comparative information showed that the <strong>Fund</strong><br />
ranked above the median for the one-year period, and below<br />
the median for the three-, five- and 10-year periods ended<br />
December 31, 2012, in the second quartile for the one-year<br />
period, the third quartile for the three-, five- and 10-year<br />
periods ended December 31, 2012. As noted above, the<br />
<strong>Fund</strong> changed its investment focus from Germany to<br />
Europe on November 1, 2005. <strong>The</strong> <strong>Fund</strong> matched the performance<br />
of the benchmark in 2012, outperformed the<br />
benchmark in 2011, 2010 and 2009, and underperformed<br />
the benchmark in 2008 and 2007. Taking into account these<br />
comparisons and the other factors considered, including<br />
DeAWMI’s strengthening of the investment resources supporting<br />
the <strong>Fund</strong> in 2009 and the improvement in the<br />
<strong>Fund</strong>’s performance since that time, the directors concluded<br />
that the <strong>Fund</strong>’s investment results since the changes<br />
implemented in 2009 were satisfactory.<br />
Management and Investment Advisory Fees and Other<br />
Expenses<br />
<strong>The</strong> directors considered the investment advisory fee<br />
rates payable by the <strong>Fund</strong> to DeAWMI under the agreement.<br />
<strong>The</strong> directors recognized that it is difficult to make<br />
comparisons of advisory fees because there are variations<br />
in the services that are included in the fees paid by other<br />
funds. <strong>The</strong> directors also considered the representation by<br />
DeAWMI that it does not manage any institutional accounts<br />
that are similar to the <strong>Fund</strong>, and its review of the reasons<br />
that it does not consider institutional fee rates to be relevant<br />
to the consideration of appropriate fee rates payable by investment<br />
companies such as the <strong>Fund</strong>.<br />
<strong>The</strong> <strong>Fund</strong>’s expense comparison group consisted of 34<br />
closed-end country funds and ETFs. <strong>The</strong> directors reviewed<br />
information comparing the combined advisory and administrative<br />
fees payable under the agreement and the administration<br />
agreement for this purpose, noting that DeAWMI<br />
and DIMA are affiliated companies. <strong>The</strong> directors noted that<br />
the <strong>Fund</strong>’s effective combined advisory and administrative<br />
fee rate for 2012 of 0.969 was below the average and above<br />
the median of the comparison group. <strong>The</strong> directors noted<br />
that the <strong>Fund</strong>’s effective fee rate reflects the effect of breakpoints.<br />
<strong>The</strong> directors also considered the <strong>Fund</strong>’s total expense<br />
ratio in comparison to the fees and expenses of funds<br />
within the comparison group. <strong>The</strong> directors also noted that<br />
the <strong>Fund</strong>’s expense ratio was above the median and the average<br />
and in the third quartile of the comparison group.<br />
Management explained that this was principally the result of<br />
the <strong>Fund</strong>’s relatively small asset base. <strong>The</strong> directors concluded<br />
that the <strong>Fund</strong>’s expense ratio was satisfactory.<br />
Economies of Scale<br />
<strong>The</strong> directors noted that the investment advisory fee<br />
schedule in the agreement contains breakpoints that reduce<br />
the fee rate on assets above specified levels. <strong>The</strong> directors<br />
recognized that breakpoints may be an appropriate way for<br />
DeAWMI to share its economies of scale with some funds<br />
that have substantial assets or that may grow materially<br />
over the next year. However, they also recognized that there<br />
is no direct relationship between the economies of scale realized<br />
by funds and those realized by DeAWMI as assets increase,<br />
largely because economies of scale are realized (if<br />
at all) by DeAWMI across a variety of products and services,<br />
and not only in respect of a single fund. Having taken<br />
these factors into account, the directors concluded that the<br />
breakpoint arrangements in the agreement were acceptable<br />
under the <strong>Fund</strong>’s circumstances.<br />
36
EXECUTIVE OFFICES<br />
345 Park Avenue, New York, NY 10154<br />
ADMINISTRATOR<br />
Deutsche Investment Management Americas <strong>Inc</strong>.<br />
INVESTMENT ADVISER<br />
Deutsche Asset & Wealth Management International GmbH<br />
CUSTODIAN<br />
Brown Brothers Harriman & Co.<br />
TRANSFER AGENT<br />
<strong>DWS</strong> <strong>Investments</strong> Service Company<br />
LEGAL COUNSEL<br />
Sullivan & Cromwell LLP<br />
INDEPENDENT REGISTERED PUBLIC ACCOUNTING FIRM<br />
PricewaterhouseCoopers LLP<br />
DIRECTORS AND OFFICERS<br />
CHRISTIAN H. STRENGER<br />
Chairman and Director<br />
DR. WILHELM BENDER<br />
Director<br />
DETLEF BIERBAUM<br />
Director<br />
RICHARD R. BURT<br />
Director<br />
RICHARD KARL GOELTZ<br />
Director<br />
DR. FRANZ WILHELM HOPP<br />
Director<br />
DR. FRIEDBERT MALT<br />
Director<br />
ROBERT H. WADSWORTH<br />
Director<br />
JOACHIM WAGNER<br />
Director<br />
BRIAN BINDER*<br />
President and Chief Executive Officer<br />
PAUL H. SCHUBERT<br />
Chief Financial Officer and Treasurer<br />
RAINER VERMEHREN<br />
Vice President<br />
MELINDA MORROW<br />
Vice President<br />
CAROLINE PEARSON<br />
Chief Legal Officer<br />
ALEXIS KUCHINSKY<br />
Chief Compliance Officer<br />
JOHN CARUSO<br />
Anti-Money Laundering Compliance Officer<br />
JOHN MILLETTE<br />
Secretary<br />
HEPSEN UZCAN<br />
Assistant Secretary<br />
VOLUNTARY CASH PURCHASE PROGRAM<br />
AND DIVIDEND REINVESTMENT PLAN<br />
<strong>The</strong> <strong>Fund</strong> offers shareholders a Voluntary Cash Purchase<br />
Program and Dividend Reinvestment Plan (“Plan”) which<br />
provides for optional cash purchases and for the automatic<br />
reinvestment of dividends and distributions payable<br />
by the <strong>Fund</strong> in additional <strong>Fund</strong> shares. Plan participants<br />
may invest as little as $100 in any month and may invest<br />
up to $36,000 annually. <strong>The</strong> Plan allows current shareholders<br />
who are not already participants in the Plan and first<br />
time investors to enroll in the Plan by making an initial<br />
cash deposit of at least $250 with the plan agent. Share<br />
purchases are combined to receive a beneficial brokerage<br />
fee. A brochure is available by writing or telephoning the<br />
transfer agent:<br />
<strong>DWS</strong> <strong>Investments</strong> Service Company<br />
210 W 10th Street 6th Floor<br />
Attn: Closed-End <strong>Fund</strong> Area<br />
Kansas City, MO 64105<br />
Tel.: 1-800-349-4281 (in the U.S.) or<br />
00-800-2287-2750 (outside of the U.S.)<br />
This report is available to the shareholders of <strong>The</strong> <strong>European</strong> <strong>Equity</strong> <strong>Fund</strong>, <strong>Inc</strong>. for their information.<br />
This is not a prospectus, circular or representation intended for use in the purchase of<br />
shares of the <strong>Fund</strong> or any securities mentioned in this report. <strong>The</strong> information contained in the<br />
letter to the shareholders and the interview with the portfolio management team in this report<br />
are derived from carefully selected sources believed reasonable. We do not guarantee its accuracy<br />
or completeness, and nothing in this report shall be construed to be a representation of<br />
such guarantee. Any opinions expressed reflect the current judgment of the author, and do not<br />
necessarily reflect the opinion of Deutsche Bank AG or any of its subsidiaries and affiliates.<br />
Notice is hereby given in accordance with Section 23(c) of the Investment Company Act of 1940<br />
that the <strong>Fund</strong> may purchase at market prices from time to time shares of its common stock in<br />
the open market.<br />
Comparisons between changes in the <strong>Fund</strong>’s net asset value per share and changes in the<br />
MSCI-EMU Index should be considered in light of the <strong>Fund</strong>’s investment policy and objectives,<br />
the characteristics and quality of the <strong>Fund</strong>’s investments, the size of the <strong>Fund</strong> and variations in<br />
the foreign currency/dollar exchange rate.<br />
<strong>Fund</strong> Shares are not FDIC - insured and are not deposits or other obligations of or guaranteed<br />
by any bank. <strong>Fund</strong> Shares involve investment risk, including possible loss of principal.<br />
For latest net asset value, schedule of the <strong>Fund</strong>’s largest<br />
holdings, dividend data and shareholder inquiries, please call<br />
1-800-349-4281 (in the U.S.) or 00-800-2287-2750 (outside of<br />
the U.S.).<br />
* Mr. Binder’s presidency commenced as of December 6, 2013.<br />
R-025796-3