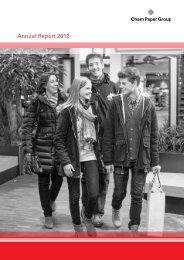
ANNUAL REPORT 2002 - Investor Relations
ANNUAL REPORT 2002 - Investor Relations
ANNUAL REPORT 2002 - Investor Relations

You also want an ePaper? Increase the reach of your titles
YUMPU automatically turns print PDFs into web optimized ePapers that Google loves.
<strong>ANNUAL</strong> <strong>REPORT</strong> <strong>2002</strong>
CONTENTS<br />
Highlights/Price trend<br />
Cover page<br />
Report of the non-executive Board of Directors 1<br />
Cham Paper Group 6<br />
Hammer Retex Group 14<br />
Kardex Remstar Group 20<br />
Consolidated financial statements 26<br />
Financial statements of Industrieholding Cham AG 44<br />
Affiliate companies as of 31 December <strong>2002</strong> 49<br />
Corporate Governance 52<br />
Addresses 61<br />
Further information on Industrieholding Cham<br />
is available on the internet at www.iccham.com<br />
E-mail address: info@iccham.com
CONSOLIDATED KEY FIGURES<br />
<strong>2002</strong> 2001<br />
<strong>2002</strong> 2001<br />
TCHF<br />
TCHF<br />
TCHF<br />
TCHF<br />
Net revenue 974 452 1 018 017<br />
EBIT 1) 53 119 9 767<br />
Profit/loss for the financial year 23 831 –33 324<br />
Total assets 972 282 1 032 711<br />
Equity 282 947 258 691<br />
Equity incl. minority interests 399 576 377 197<br />
Dividend (CHF per share) 0 0<br />
Employees 3 114 3 240<br />
1)<br />
EBIT: Profit before financial expenses, taxes and non-operating<br />
expenses/income (new definition: Prior year restated).<br />
CHAM PAPER GROUP (SPECIALITY PAPER)<br />
Internationally, the Cham Paper Group is one of the most respected and important<br />
manufacturers of high-quality speciality base papers. The Group has five paper mills<br />
in three countries, Switzerland, Italy and Norway, with a total annual capacity of<br />
265’000 tonnes of speciality base papers for flexible packaging, pressure-sensitive<br />
applications, labels, technical-industrial applications, inkjet and transfer printing applications,<br />
inner liners for the tobacco industry and wallpaper.<br />
Share of turnover<br />
Share of assets*<br />
HAMMER RETEX GROUP (REAL ESTATE)<br />
The Hammer Retex Group is one of the leading real estate companies in Central Switzerland.<br />
In the course of recent years, it has become a major provider of real estate<br />
services in the fields of general contracting, property management, real estate consultancy<br />
and real estate sales. In addition it actively manages its own real estate in<br />
Cham and the construction land reserves are used for new properties in tune with the<br />
development of the market.<br />
Share of turnover<br />
Share of assets*<br />
KARDEX REMSTAR GROUP (MATERIALS HANDLING)<br />
The Kardex Remstar Group produces and distributes throughout the world static and<br />
dynamic system solutions for stock retrieval, automation and conveying logistic. The<br />
main product groups are on the one hand vertical and horizontal rotating racks and<br />
high-rack modules and, on the other hand, conveyor equipment which is used in major<br />
automation solutions, particularly in the car industry.<br />
Share of turnover<br />
Share of assets*<br />
*2.31% of the assets belong<br />
to the non-operating holding<br />
companies
PRICE TREND, ZURICH STOCK EXCHANGE<br />
JANUARY–DECEMBER <strong>2002</strong><br />
CONDITIONS OF SHARE OWNERSHIP<br />
A shareholder is registered in the share register with a maximum of 3% of voting rights<br />
to the share capital. Under the provisions of the Lex Friedrich, foreign holders of<br />
registered shares have no voting rights.<br />
At the Annual General Meeting the voting rights of an individual shareholder are<br />
limited to 5% of the share capital.<br />
AVERAGE OF DEALT IC-SHARES<br />
PER BUSINESS DAY<br />
1998 1 170<br />
1999 3 431<br />
2000 3 662<br />
2001 308<br />
<strong>2002</strong> 2 015
<strong>REPORT</strong> OF THE<br />
NON-EXECUTIVE BOARD<br />
OF DIRECTORS<br />
Dear Sir or Madam<br />
Having reported a massive loss in 2001,<br />
Industrieholding Cham AG has returned<br />
to profitability in the year under review.<br />
<strong>2002</strong> was characterized by measures<br />
to ensure the turnaround, to improve<br />
liquidity, and to reduce debt.<br />
Priority was given to:<br />
• the implementation of restructuring<br />
programmes at Kardex Remstar<br />
Group to keep costs in line with the<br />
weak demand for capital goods,<br />
• strict management of net working<br />
capital in all three subsidiary companies,<br />
• strengthening of the Cham Paper<br />
Groups’ sales organisation,<br />
• sale of non-operating assets<br />
of the Cham Paper Group,<br />
• sale of real estate of the<br />
Hammer Retex Group,<br />
• reorganisation of equity and third-party<br />
financing of the Cham Paper Group,<br />
• early repayment of the Industrieholding<br />
Cham AG CHF 30 million bond issue.<br />
Even though profitability targets could<br />
not be fully attained, the result is pleasing<br />
in view of the adverse economic environment.<br />
The subsidiary companies of Industrieholding<br />
Cham AG generated consolidated<br />
turnover of CHF 974.5 million<br />
(2001: CHF 1 018.0 million), EBIT of CHF<br />
53.1 million (2001: CHF 9.8 million), and<br />
a net profit of CHF 23.8 million (2001:<br />
CHF –33.3 million).<br />
Consolidated debt declined from CHF<br />
309.4 million (31.12.2001) to CHF 242.2<br />
million (31.12.<strong>2002</strong>). This resulted in an<br />
improved equity ratio from 25% to 29%,<br />
or, if minorities are included, from 37% to<br />
41%.<br />
The three subsidiary companies show<br />
varying levels of success:<br />
1
The Speciality Paper division can look<br />
back on a pleasing business year. After<br />
two consecutive negative years, the<br />
Cham Paper Group reported an EBIT<br />
of CHF 24.0 million for <strong>2002</strong> (2001:<br />
CHF –14.9 million). Machine loading at<br />
the five mills ranged from satisfactory to<br />
good, with the Swiss and Italian mills<br />
even setting new turnover records. Progress<br />
was also made at the Hunsfos mill<br />
in Norway, but it will take further improvements<br />
in productivity and the product<br />
mix to generate more satisfactory results.<br />
The Hammer Retex Group again had a<br />
profitable year. All business areas (general<br />
contracting, property management, real<br />
estate consultancy, and real estate sales)<br />
were successful. The company presents<br />
an EBIT of CHF 13.0 million (2001: CHF<br />
9.6 million), which contains profits of sale<br />
of property of CHF 9.5 million (2001:<br />
CHF 5.4 million). In addition, the company<br />
provided valuable assistance to<br />
the Cham Paper Group in selling nonoperating<br />
assets.<br />
Despite the ongoing economic weakness<br />
and restrained capital spending, the<br />
Kardex Remstar Group generated an<br />
EBIT of CHF 18.4 million (2001: CHF<br />
17.2 million). Substantial efforts to improve<br />
profitability were largely offset by<br />
lacklustre markets. In view of these circumstances,<br />
the positive result can be<br />
deemed a success. Three of the four<br />
Kardex divisions, “Dynamic Storage and<br />
Retrieval Systems” (KRM), “Industrial<br />
Automation and Conveyor Technology”<br />
(AFT), and “Static Storage Systems”<br />
(Stow) generated profits, whereas the<br />
fourth and smallest division, “Special-<br />
Purpose Handling Systems” (STE), suffered<br />
a loss.<br />
Outlook<br />
For 2003, Industrieholding Cham AG<br />
expects the economic environment to<br />
remain difficult. Despite improved positioning<br />
and restructuring measures implemented<br />
in <strong>2002</strong>, it is likely that all<br />
three subsidiary companies will again be<br />
exposed to difficult markets and fierce<br />
competition.<br />
2
Proposed allocation of profit<br />
The non-executive Board of Directors will<br />
propose to the Annual General Meeting<br />
to waive payment of a dividend for <strong>2002</strong><br />
and to carry balance sheet profits of CHF<br />
15.1 million forward to the new financial<br />
year. The profit will be used to safeguard<br />
liquidity and further reduce the level of<br />
debt of Industrieholding Cham AG.<br />
A word of thanks<br />
The non-executive Board of Directors of<br />
Industrieholding Cham AG would like to<br />
express its sincere gratitude to all members<br />
of the workforce for their dedication<br />
and extraordinary performance in a highly<br />
challenging year. The non-executive<br />
Board would also like to thank the shareholders<br />
for their unfaltering confidence<br />
and loyalty.<br />
Head of the Cham Paper Group<br />
Effective 1 August <strong>2002</strong>, Mr. Beat U.<br />
Semadeni handed over the position of<br />
CEO to Mr. Axel W. Wappler. Mr. Semadeni<br />
had served for more than ten years<br />
as CEO of Cham Paper Group. The<br />
non-executive Board would like to thank<br />
Mr. Semadeni for his enormous commitment<br />
and wishes Mr. Wappler well for his<br />
new and challenging task.<br />
Elections<br />
The terms of office of Michael Funk,<br />
Dr. René Furler and Rolf Schweiger<br />
expire on the date of the forthcoming<br />
Annual General Meeting. All three gentlemen<br />
are available for re-election.<br />
On behalf of the non-executive<br />
Board of Directors<br />
Heinrich C. Spoerry<br />
Chairman of the non-executive Board<br />
of Directors<br />
Heinrich C. Spoerry<br />
3
INDUSTRIEHOLDING CHAM<br />
CONSOLIDATED KEY FIGURES 1998–<strong>2002</strong><br />
Net revenue<br />
EBITDA<br />
EBITDA margin 2)<br />
Operating profit (EBIT)<br />
EBIT margin 3)<br />
Profit/loss (–) for the year<br />
Return on sales 4)<br />
<strong>2002</strong><br />
TCHF<br />
974 452<br />
98 317<br />
10.09%<br />
53 119<br />
5.45%<br />
23 831<br />
2.45%<br />
2001<br />
TCHF<br />
1 018 017<br />
52 998<br />
5.21%<br />
9 767<br />
0.96%<br />
–33 324<br />
–3.27%<br />
2000 1)<br />
TCHF<br />
Restated<br />
942 628<br />
68 842<br />
7.30%<br />
25 801<br />
2.74%<br />
–4 371<br />
–0.46%<br />
1999<br />
TCHF<br />
720 002<br />
89 877<br />
12.48%<br />
59 428<br />
8.25%<br />
23 384<br />
3.25%<br />
1998<br />
TCHF<br />
568 461<br />
71 626<br />
12.60%<br />
49 399<br />
8.69%<br />
21 824<br />
3.84%<br />
Cash flow from operating activities<br />
Investments in fixed assets<br />
Free cash flow 5)<br />
76 752<br />
31 592<br />
83 133<br />
75 134<br />
62 582<br />
–15 726<br />
–7 575<br />
44 888<br />
–123 884<br />
23 332<br />
49 582<br />
–36 350<br />
48 338<br />
53 893<br />
–49 686<br />
Current assets<br />
Non-current assets<br />
Total assets<br />
451 451<br />
520 831<br />
972 282<br />
498 965<br />
533 746<br />
1 032 711<br />
504 470<br />
460 445<br />
964 915<br />
411 168<br />
369 083<br />
780 251<br />
364 549<br />
336 654<br />
701 203<br />
Liabilities<br />
Share capital<br />
Shareholders’ equity<br />
Minority interests<br />
Total liabilities and shareholders’ equity<br />
572 706<br />
80 640<br />
282 947<br />
116 629<br />
972 282<br />
655 514<br />
80 640<br />
258 691<br />
118 506<br />
1 032 711<br />
550 455<br />
80 640<br />
292 101<br />
122 359<br />
964 915<br />
479 637<br />
40 320<br />
236 819<br />
63 795<br />
780 251<br />
453 653<br />
20 160<br />
189 252<br />
58 298<br />
701 203<br />
Equity ratio 6)<br />
Dividend<br />
41.10%<br />
0<br />
36.52%<br />
0<br />
42.95%<br />
0<br />
38.53%<br />
8 064<br />
35.30%<br />
7 056<br />
Net working capital 7)<br />
Net interest-bearing liabilities 8)<br />
153 261<br />
242 242<br />
93 391<br />
309 423<br />
176 429<br />
258 684<br />
148 522<br />
249 445<br />
138 616<br />
224 250<br />
Employees (full-time equivalents) 9)<br />
Net sales per employee 10)<br />
FTE<br />
3 114<br />
307<br />
3 240<br />
333<br />
2 882<br />
352<br />
2 480<br />
324<br />
1 967<br />
300<br />
Consolidated group profit per share<br />
in CHF<br />
29.55<br />
–41.32<br />
–5.42<br />
58.00<br />
111.01<br />
1)<br />
Restated, mainly capitalization and amortization of goodwill.<br />
2)<br />
EBITDAllllllllll<br />
Net revenue<br />
3)<br />
EBITlllllllllllllllll<br />
Net revenue<br />
4)<br />
Profit/loss (–) for the year<br />
Net revenue<br />
5)<br />
Cash flow from operating activities + cash flow<br />
from investing activities<br />
6)<br />
Including minority interests<br />
7)<br />
Current assets ./. short-term liabilities<br />
8)<br />
Short-term bank loans + other short-term interest-bearing liabilities<br />
+ long-term interest-bearing liabilities./. cash and cash equivalents<br />
./. securities ./. other interest-bearing short-term liabilities<br />
9)<br />
Full-time equivalent (exclusive trainees)<br />
10)<br />
Net revenuexxxxxxxxxxxxxxxxxxxxxxxxxxl<br />
Average employees (full-time equivalents)<br />
4
TOTAL ASSETS INDUSTRIEHOLDING CHAM<br />
Current assets<br />
Non-current assets<br />
Liabilities<br />
Shareholders’ equity (including minority interests)<br />
DEVELOPMENT OF SALES & EBIT INDUSTRIEHOLDING CHAM<br />
Sales (Net revenue)<br />
Operating profit (EBIT)<br />
5
Whether it’s bread, marmalade or coffee: creative packaging<br />
sells products. Around the world, well-known manufacturers<br />
label, package, and present their popular brand products with<br />
speciality papers made by the Cham Paper Group.
CHAM PAPER GROUP<br />
The year under review was positive for<br />
the Cham Paper Group. In a difficult<br />
economic environment it succeeded in<br />
returning to profitability. For <strong>2002</strong> the<br />
Group reports a profit of CHF 15.8 million<br />
(2001: CHF –38.7 million). Several factors<br />
contributed to this success:<br />
• a higher gross margin due to an<br />
improved product mix and declining<br />
pulp prices,<br />
• strict management of net working<br />
capital,<br />
• a profit on a book value basis<br />
of CHF 7.5 million resulting from<br />
assets not forming part of core<br />
business operations.<br />
The medium-term financing of the Cham<br />
Paper Group was secured with a share<br />
capital increase of CHF 20.0 million and<br />
the conclusion of a syndicated loan.<br />
The company’s consistent policy of<br />
customer orientation and its focus on<br />
speciality paper have paid off. Despite<br />
considerable adjustments to its range,<br />
sales of own-manufactured products<br />
rose by 2.8% to 256’000 tonnes. A 28%<br />
increase in overseas sales more than<br />
compensated for the 2.2% decline in<br />
sales in Europe. Net turnover fell by 7.4%<br />
to CHF 413.2 million; 3.6% of the drop in<br />
sales were due to exchange rate effects.<br />
Net sales price declined as an indirect effect<br />
of the fall in pulp prices. Moreover,<br />
net turnover from distribution of thirdparty<br />
papers dropped by CHF 10.9 million.<br />
The Cham Paper Group continued to expand<br />
its share in strategically important<br />
markets, e.g. Germany, USA, China<br />
and South Korea. Progress was made<br />
especially in technical papers for the<br />
tobacco industry and wet-strength<br />
labels for beer and wine bottles, as well<br />
as inkjet papers. In the field of base<br />
papers for pressure-sensitive materials,<br />
quickly shifting customer requirements<br />
were promptly recognised. In particular,<br />
sustained growth was achieved with clay<br />
coated papers from Cham and glassine<br />
from Condino (Italy). In base papers for<br />
flexible packaging the Group succeeded<br />
in holding its position and even expanding<br />
in certain market segments. The wallpaper<br />
market has recovered worldwide<br />
but is still suffering from overcapacity.<br />
The Hunsfos mill in Norway benefited<br />
from increased orders for wallpaper<br />
base. However, the reorientation of this<br />
mill towards products with a potential for<br />
long-term success is still under way.<br />
Axel W. Wappler, CEO<br />
7
The current trend:<br />
From label to postage<br />
stamp, it’s all selfadhesive.<br />
Success with fast food requires systematic brand management.<br />
For this reason, successful fast food chains use the<br />
Cham Paper Group’s special Tenwax paper. It is easy to print<br />
and reusable – and cheeseburgers taste like cheeseburgers,<br />
not like paper.<br />
Production<br />
Overall, capacity utilization at the five<br />
mills was good. Cham, Carmignano and<br />
Condino increased production to new<br />
record levels: The Swiss mills produced<br />
together 102’000 tonnes and the two<br />
Italian mills 89’000 tonnes. The Hunsfos<br />
mill in Norway made progress. Despite<br />
various incidents, e.g. fire damaging a<br />
paper machine transformer and water<br />
supply problems, the mill improved its<br />
EBIT in comparison with the previous<br />
year by CHF 13.4 million. This success is<br />
due mainly to cost reduction, including<br />
job cuts in administration. From the<br />
fourth quarter <strong>2002</strong>, Mr. Morten Persen<br />
(Chairman of the non-executive Board of<br />
Directors) and Mr. Hans Peter Müller<br />
(General Manager) have been responsible<br />
for the mill. Further measures to<br />
implement the approved strategy will be<br />
enacted in 2003.
Indispensable:<br />
Top-quality paper for<br />
inkjet and dye-sublimation<br />
printing.<br />
Do it yourself:<br />
More and more people<br />
want to vary their wallpaper<br />
choice more<br />
often.<br />
In the spotlight:<br />
Consumer goods stand<br />
out when presented<br />
with metallized papers.<br />
Investments<br />
Investments by the Cham Paper Group<br />
during the year were spent to ensure<br />
continuous modernization of production<br />
equipment and to increase productivity.<br />
The construction of a new warehouse in<br />
Cham for finished rolls will help reduce<br />
future logistical costs. In Italy, the Cham<br />
Paper Group invested in a new drive for<br />
the Condino paper machine and in headbox<br />
improvements for the Carmignano<br />
paper machine.<br />
In mid <strong>2002</strong> the implementation of new<br />
IT applications was initiated. The software<br />
will be installed first in Cham and<br />
then group-wide through 2004. The strategy<br />
supports optimization and unification<br />
of business procedures within the Group<br />
and thus enhances productivity.<br />
Another major project involves a heat<br />
and electricity cogeneration plant to be<br />
built during 2003 and 2004 in cooperation<br />
with an electrical utility company in<br />
Condino. More economical electrical<br />
energy will lead to further cost savings.<br />
Outlook<br />
The Cham Paper Group shall again face a<br />
highly challenging market as geopolitical<br />
risks add to economic uncertainty.<br />
Nevertheless top management is confident<br />
that, together with their dedicated<br />
workforce, they will be able to satisfy<br />
expectations.<br />
The focus this year will be on Technical<br />
Speciality Papers. The highest growth<br />
rates are expected from the Far East and<br />
Eastern European markets. Customers<br />
are demanding products that offer them<br />
greater functionality and benefits.<br />
Many new products are being developed<br />
and markets built for innovative<br />
papers, which address a wide range of<br />
applications. These include, amongst<br />
others, speciality papers for improved<br />
inventory tracking, and papers that<br />
contribute to process optimization in<br />
brewery bottling.<br />
9
CHAM PAPER GROUP<br />
CONSOLIDATED KEY FIGURES 1998–<strong>2002</strong><br />
Net sales per employee 13) 391<br />
<strong>2002</strong><br />
TCHF<br />
Net revenue<br />
EBITDA<br />
EBITDA margin 2)<br />
Operating profit (EBIT)<br />
EBIT margin 3)<br />
Profit/loss (–) for the year<br />
Return on sales 4)<br />
Cash flow from operating activities<br />
Investments in fixed assets<br />
Free cash flow 5)<br />
Current assets<br />
Non-current assets<br />
Total assets<br />
Liabilities<br />
Share capital<br />
Shareholders’ equity<br />
Minority interests<br />
Total liabilities and shareholders’ equity<br />
Equity ratio 6)<br />
Dividend<br />
Net working capital 7)<br />
Net interest-bearing liabilities 8)<br />
Debt ratio 9)<br />
Coverage ratio 10)<br />
Gearing 11)<br />
Employees (full-time equivalents) 12)<br />
FTE<br />
413 232<br />
48 024<br />
11.62%<br />
24 000<br />
5.81%<br />
15 840<br />
3.83%<br />
42 286<br />
16 177<br />
32 852<br />
177 477<br />
245 869<br />
423 346<br />
273 962<br />
130 000<br />
149 384<br />
0<br />
423 346<br />
35.29%<br />
0<br />
62 480<br />
164 626<br />
3.43<br />
2.94<br />
1.10<br />
1 041<br />
2001<br />
TCHF<br />
446 136<br />
9 974<br />
2.24%<br />
–14 859<br />
–3.33%<br />
–38 685<br />
–8.67%<br />
34 744<br />
26 546<br />
12 140<br />
184 689<br />
249 299<br />
433 988<br />
322 612<br />
110 000<br />
111 376<br />
0<br />
433 988<br />
25.66%<br />
0<br />
–23 532<br />
215 453<br />
21.60<br />
–1.12<br />
1.93<br />
1 073<br />
404<br />
2000 1)<br />
TCHF<br />
Restated<br />
490 362<br />
24 298<br />
4.96%<br />
–5 126<br />
–1.05%<br />
–10 665<br />
–2.17%<br />
–9 933<br />
23 341<br />
–32 008<br />
240 434<br />
261 602<br />
502 036<br />
352 656<br />
110 000<br />
149 380<br />
0<br />
502 036<br />
29.75%<br />
4 000<br />
46 971<br />
225 049<br />
9.26<br />
–0.41<br />
1.51<br />
1 135<br />
422<br />
1999<br />
TCHF<br />
419 417<br />
47 819<br />
11.40%<br />
23 461<br />
5.59%<br />
13 501<br />
3.22%<br />
–9 976<br />
31 164<br />
–41 835<br />
234 049<br />
272 671<br />
506 720<br />
354 639<br />
90 000<br />
152 081<br />
0<br />
506 720<br />
30.01%<br />
4 048<br />
48 672<br />
230 430<br />
4.82<br />
2.69<br />
1.52<br />
1 188<br />
428<br />
1998<br />
TCHF<br />
295 437<br />
36 915<br />
12.50%<br />
20 042<br />
6.78%<br />
14 727<br />
4.98%<br />
40 775<br />
41 889<br />
–27 566<br />
191 101<br />
253 132<br />
444 233<br />
303 602<br />
90 000<br />
139 761<br />
870<br />
444 233<br />
31.66%<br />
4 021<br />
49 924<br />
180 358<br />
4.89<br />
4.23<br />
1.29<br />
771<br />
383<br />
10<br />
1)<br />
Restated, mainly capitalization and amortization of goodwill.<br />
2)<br />
EBITDAllllllllll<br />
Net revenue<br />
3)<br />
EBITlllllllllllllllll<br />
Net revenue<br />
4)<br />
Profit/loss (–) for the year<br />
Net revenue<br />
5)<br />
Cash flow from operating activities + cash flow<br />
from investing activities<br />
6)<br />
Including minority interests<br />
7)<br />
Current assets ./. short-term liabilities<br />
8)<br />
Short-term bank loans + other short-term interest-bearing liabilities<br />
+ long-term interest-bearing liabilities./. cash and cash equivalents<br />
./. securities ./. other interest-bearing short-term liabilities<br />
9)<br />
Net interest-bearing liabilities<br />
EBITDA<br />
10)<br />
EBITxxxxxxxxxxxxxxxxxxxxxxxxxxxx<br />
Interest expenses ./. interest earned<br />
11)<br />
Net interest-bearing liabilities<br />
Shareholders’ equity<br />
12)<br />
Full-time equivalent (exclusive trainees)<br />
13)<br />
Net revenuexxxxxxxxxxxxxxxxxxxxxxxxxxl<br />
Average employees (full-time equivalents)
TOTAL ASSETS CHAM PAPER GROUP<br />
Current assets<br />
Non-current assets<br />
Liabilities<br />
Shareholders’ equity (including minority interests)<br />
DEVELOPMENT OF NET INTEREST-BEARING LIABILITIES<br />
0<br />
Net interest-bearing liabilities<br />
11
DEVELOPMENT OF SALES BY REGION (OWN PRODUCTION)<br />
2001<br />
<strong>2002</strong><br />
DEVELOPMENT OF SALES BY PRODUCT GROUP<br />
(OWN PRODUCTION)<br />
Sales <strong>2002</strong> (in tonnes)<br />
Sales 2001 (in tonnes)<br />
12<br />
Graphic papers<br />
Base wallpapers<br />
Flexible packaging<br />
Base papers for self-adhesives<br />
Technical papers
DEVELOPMENT OF PULP PRICE CHAM PAPER GROUP<br />
NBSK in USD/tonnes<br />
13
Interdisciplinary planning processes as well as networked<br />
thinking and acting are welcome challenges for a general<br />
contractor.
HAMMER RETEX GROUP<br />
<strong>2002</strong> was another successful year for the<br />
Hammer Retex Group. This success<br />
confirms the soundness of its business<br />
strategy, as it generated a profit of CHF<br />
10.3 million (2001: CHF 7.3 million).<br />
The Hammer Retex Group offers comprehensive<br />
real estate services in Central<br />
Switzerland:<br />
• General contracting<br />
• Property management<br />
• Real estate consultancy<br />
• Real estate sales<br />
Within the strategy to develop building<br />
land reserves and to realize capital gains<br />
from sales of real estate, the <strong>2002</strong> result<br />
was influenced by the sale of a major<br />
residential property. The development of<br />
building land reserves is being pursued in<br />
step with the market trend. About 60<br />
apartments are under construction.<br />
These will generate profit in 2003.<br />
Despite difficult economic conditions, all<br />
business areas of the Hammer Retex<br />
Group were successful. In general contracting,<br />
the Group was involved in the<br />
construction of buildings worth about<br />
CHF 60.0 million. In property management,<br />
fee revenues increased by about<br />
19% to CHF 2.3 million.<br />
In <strong>2002</strong>, the Hammer Retex Group turnover<br />
from ordinary activities amounted to<br />
CHF 11.3 million. Combined with property<br />
sales, the Group reported an EBIT of<br />
CHF 13.0 million. Profit from the sale of<br />
real estate totalled CHF 9.5 million before<br />
taxes.<br />
The Group has a solid financial foundation.<br />
With total assets closing at CHF<br />
91.0 million and shareholders’ equity of<br />
CHF 63.4 million, the equity ratio is 70%.<br />
Claude Ebnöther, CEO<br />
With the acquisition of Hans Schmidlin<br />
AG, effective 30 September <strong>2002</strong>, the<br />
Hammer Retex Group further reinforced<br />
its market position as a real estate company<br />
in the canton of Zug. Hans Schmidlin<br />
AG manages and sells real estate with<br />
a workforce of ten employees.<br />
15
General contracting:<br />
Walking his dog allows<br />
Daniel Amrein to take a<br />
breather from the complexities<br />
of his job.<br />
The “Schutzengel” development project in Baar, carried out<br />
in cooperation with the Zurich-based architectural firm<br />
RRP, is a typical example of the successful interdisciplinary<br />
service package Hammer Retex Group strives to offer.<br />
Reference:<br />
The “Schutzengel” project in Baar<br />
One of the great assets of the Hammer<br />
Retex Group is that it can offer its<br />
customers a full complement of services<br />
in turn-key packages. Smooth coordination,<br />
direct communication and short<br />
decision-making paths are important prerequisites<br />
for success. During every<br />
phase of a project, competent partners<br />
are at the disposal of the customers.<br />
The “Schutzengel” development project<br />
in Baar is a typical example of the successful<br />
interdisciplinary service package<br />
offered by Hammer Retex. The builder,<br />
Obermühle Immobilien AG, decided to<br />
develop roughly 6500 square metres of<br />
land and sell the buildings in the form of<br />
flats. The major objectives were a high<br />
standard of urban architecture, aboveaverage<br />
construction quality, and optimised<br />
cost-effectiveness. Hammer Retex<br />
implemented this total vision, providing a<br />
comprehensive partnership that encompassed<br />
planning, sale, and management.<br />
RRP Architekten, a Zurich-based architectural<br />
firm already well known in the<br />
“Schutzengel” district, has created with<br />
this project a landmark of urban architectural<br />
design. Despite a nearly saturated<br />
market, the 43 flats have met with lively<br />
demand. Construction will be completed<br />
as scheduled by late May 2003.
General contracting:<br />
Hiking gives Irene<br />
Broch fresh energy<br />
that lets her master<br />
the daily challenges<br />
at work.<br />
Real estate sales:<br />
Yvonne Koch plays golf<br />
to relax after intensive<br />
talks with customers.<br />
Property management:<br />
After many meetings<br />
with owners and tenants,<br />
Brigitte Vogel<br />
enjoys time off and<br />
goes skiing.<br />
Outlook<br />
Although institutional and private investors<br />
as well as purchasers of flats are<br />
currently favouring a wait-and-see<br />
attitude, the Hammer Retex Group is<br />
confident about the future outlook.<br />
Despite uncertainty in the markets, the<br />
strong position and solid finances offer<br />
opportunities which need to be perceived.<br />
By entering the growth sector of facility<br />
management, the Hammer Retex Group<br />
will gradually expand its range of activities.<br />
This expansion will advance in<br />
small steps, accompanied by rigorous<br />
performance assessments. With the<br />
existing activities in real estate maintenance<br />
as a firm base, the aim is to focus<br />
on high-yield projects with high customer<br />
benefit.<br />
In the general contracting sector, a few<br />
projects will be developed on companyowned<br />
land reserves in order to be in a<br />
good position for any future economic<br />
upturn. In property management, the<br />
Hammer Retex Group aims to achieve<br />
profitable growth. An important step in<br />
this direction will be the integration of<br />
Hans Schmidlin AG and its customers.<br />
17
HAMMER RETEX GROUP<br />
CONSOLIDATED KEY FIGURES 1998–<strong>2002</strong><br />
Net sales per employee 13) 332<br />
<strong>2002</strong><br />
TCHF<br />
Net revenue<br />
EBITDA<br />
EBITDA margin 2)<br />
Operating profit (EBIT)<br />
EBIT margin 3)<br />
Profit/loss (–) for the year<br />
Return on sales 4)<br />
Cash flow from operating activities<br />
Investments in fixed assets<br />
Free cash flow 5)<br />
Current assets<br />
Non-current assets<br />
Thereof Non-current assets rented out<br />
Total assets<br />
Liabilities<br />
Share capital<br />
Shareholders’ equity<br />
Total liabilities and shareholders’ equity<br />
Equity ratio 6)<br />
Dividend<br />
Net working capital 7)<br />
Net interest-bearing liabilities 8)<br />
Debt ratio 9)<br />
Coverage ratio 10)<br />
Gearing 11)<br />
Employees (full-time equivalents) 12)<br />
FTE<br />
11 285<br />
14 281<br />
126.55%<br />
13 034<br />
115.50%<br />
10 301<br />
91.28%<br />
–5 299<br />
1 141<br />
12 002<br />
27 057<br />
63 964<br />
50 676<br />
91 021<br />
27 593<br />
4 500<br />
63 428<br />
91 021<br />
69.69%<br />
2 150<br />
17 509<br />
–6 761<br />
–0.47<br />
22.47<br />
–0.11<br />
36<br />
2001<br />
TCHF<br />
11 413<br />
10 713<br />
93.87%<br />
9 628<br />
84.36%<br />
7 281<br />
63.80%<br />
14 341<br />
13 676<br />
8 391<br />
15 439<br />
69 496<br />
57 207<br />
84 935<br />
29 659<br />
4 500<br />
55 276<br />
84 935<br />
65.08%<br />
2 000<br />
6 763<br />
8 617<br />
0.80<br />
12.80<br />
0.16<br />
32<br />
368<br />
2000 1)<br />
TCHF<br />
Restated<br />
11 210<br />
5 983<br />
53.37%<br />
4 427<br />
39.49%<br />
3 077<br />
27.45%<br />
9 170<br />
7 922<br />
1 469<br />
14 329<br />
64 021<br />
48 408<br />
78 350<br />
28 355<br />
4 500<br />
49 995<br />
78 350<br />
63.81%<br />
2 000<br />
9 146<br />
19 788<br />
3.31<br />
5.89<br />
0.40<br />
30<br />
374<br />
1999<br />
TCHF<br />
9 533<br />
8 438<br />
88.51%<br />
7 290<br />
76.47%<br />
5 581<br />
58.54%<br />
4 652<br />
4 172<br />
–1 491<br />
18 586<br />
57 772<br />
49 540<br />
76 358<br />
27 200<br />
4 500<br />
49 158<br />
76 358<br />
64.38%<br />
2 000<br />
14 224<br />
19 256<br />
2.28<br />
13.38<br />
0.39<br />
30<br />
303<br />
1998<br />
TCHF<br />
12 003<br />
5 059<br />
42.15%<br />
3 844<br />
32.03%<br />
2 891<br />
24.09%<br />
–2 553<br />
6 875<br />
–3 744<br />
18 269<br />
57 640<br />
47 033<br />
75 909<br />
30 419<br />
4 500<br />
45 490<br />
75 909<br />
59.93%<br />
2 000<br />
13 510<br />
18 303<br />
3.62<br />
5.53<br />
0.40<br />
33<br />
364<br />
18<br />
1)<br />
Restated, mainly capitalization and amortization of goodwill.<br />
2)<br />
EBITDAllllllllll<br />
Net revenue<br />
3)<br />
EBITlllllllllllllllll<br />
Net revenue<br />
4)<br />
Profit/loss (–) for the year<br />
Net revenue<br />
5)<br />
Cash flow from operating activities + cash flow<br />
from investing activities<br />
6)<br />
Including minority interests<br />
7)<br />
Current assets ./. short-term liabilities<br />
8)<br />
Short-term bank loans + other short-term interest-bearing liabilities<br />
+ long-term interest-bearing liabilities./. cash and cash equivalents<br />
./. securities ./. other interest-bearing short-term liabilities<br />
9)<br />
Net interest-bearing liabilities<br />
EBITDA<br />
10)<br />
EBITxxxxxxxxxxxxxxxxxxxxxxxxxxxx<br />
Interest expenses ./. interest earned<br />
11)<br />
Net interest-bearing liabilities<br />
Shareholders’ equity<br />
12)<br />
Full-time equivalent (exclusive trainees)<br />
13)<br />
Net revenuexxxxxxxxxxxxxxxxxxxxxxxxxxl<br />
Average employees (full-time equivalents)
TOTAL ASSETS HAMMER RETEX GROUP<br />
Current assets<br />
Non-current assets rented out<br />
Rest non-current assets<br />
Liabilities<br />
Shareholders’ equity<br />
19
Two paternoster systems function as rotating<br />
showcases but are also exhibits in their own right.
KARDEX REMSTAR GROUP<br />
As a typical supplier of capital goods, the<br />
Kardex Remstar Group was hit particularly<br />
hard by the adverse economic trend.<br />
As a result, original financial targets had<br />
to be revised substantially downward<br />
in the <strong>2002</strong> half yearly report and the<br />
yearly forecast was readjusted to 2001<br />
levels. This assessment was confirmed<br />
by developments in the year under<br />
review. The hostile economic climate<br />
showed no signs of improvement, and<br />
many (prospective) customers either<br />
delayed or minimized investments.<br />
The unsatisfactory overall trend of the first<br />
six months continued unabated during<br />
the second half of the year. Thanks to the<br />
restructuring measures implemented in<br />
2001, operating costs were reduced by<br />
about 11%. For the full year, the Kardex<br />
Remstar Group reported an EBIT of CHF<br />
18.4 million (2001: CHF 17.2 million).<br />
Profit after taxes (and after minority interests)<br />
closed at CHF 3.0 million compared<br />
to CHF 4.1 million in 2001. Three of the<br />
four Kardex divisions, “Dynamic Storage<br />
and Retrieval Systems” (KRM), “Industrial<br />
Automation and Conveyor Technology”<br />
(AFT), and “Static Storage Systems”<br />
(Stow) generated profit, whereas the<br />
fourth and smallest unit, “Special-Purpose<br />
Handling Systems” (STE) reported a loss.<br />
Weak demand, combined with currencyfluctuation<br />
losses, reduced consolidated<br />
net turnover of the Kardex Remstar<br />
Group in financial <strong>2002</strong> by 2%, from CHF<br />
560.5 million to CHF 549.9 million. It<br />
must be noted that <strong>2002</strong> was the first<br />
year in which Stow was consolidated for<br />
the full twelve-month period (2001: nine<br />
months). On a comparable basis, the<br />
decline in turnover was 7%.<br />
In <strong>2002</strong>, the four divisions contributed to<br />
turnover as follows:<br />
•“Dynamic Storage and Retrieval<br />
Systems” (KRM) 48%<br />
(2001: 53%)<br />
•“Industrial Automation and Conveyor<br />
Technology” (AFT) 26%<br />
(2001: 26%)<br />
•“Static Storage Systems” (Stow) 22%<br />
(2001: 16%)<br />
•“Special-Purpose Handling Systems”<br />
(STE) 4%<br />
(2001: 5%)<br />
Richard Flury, CEO<br />
21
For a globally active electronics company, Kardex installed<br />
20 Kardex Shuttle NT units and 5 Kardex Industrievers<br />
in the customer’s new manufacturing plant in the Czech<br />
Republic.<br />
Megamat’s new<br />
Megaload storage<br />
system (3-axis lift)<br />
provides more storage<br />
space and greater<br />
retrieval and picking<br />
performance.<br />
The decline in demand affected worst the<br />
“Dynamic Storage and Retrieval Systems”<br />
(KRM) division, whose turnover fell<br />
by 12% (or 9% in local currencies).<br />
The turnover generated by the “Industrial<br />
Automation and Conveyor Technology”<br />
(AFT) division remained at the 2001 level,<br />
whereas the newly acquired Stow Group<br />
increased annualized turnover by 3% (or<br />
7% in local currencies). This increase reflects<br />
the systematic expansion of the<br />
sales organizations in Germany as well as<br />
in Eastern Central Europe.<br />
The Kardex Remstar Group cut back<br />
bank debt, accounts receivables, and inventory<br />
as far as possible, thus improving<br />
liquidity and operating cash flow.
The inductive electric<br />
monorail system was<br />
the major innovation of<br />
the year <strong>2002</strong>.<br />
Storage system, shelving,<br />
and mezzanine<br />
system in a large<br />
sportswear shipping<br />
centre.<br />
Carousel system: seven<br />
horizontal carousels<br />
with lifting tables and<br />
LAKOS inventory<br />
management software.<br />
Expansion of market shares<br />
All business units are fully focused on expanding<br />
their market shares worldwide.<br />
They can rely on many successfully completed<br />
projects, excellent references, and<br />
newly developed hardware and software.<br />
Outside core markets in Europe, the Kardex<br />
Remstar Group is undertaking great<br />
efforts to gain market share in the USA<br />
and the Far East. With production facilities<br />
in South Korea and China as well as<br />
the support of highly effective sales<br />
organizations, the Kardex Remstar Group<br />
is already working successfully in these<br />
countries.<br />
Investments<br />
All business units invested judiciously.<br />
The “Dynamic Storage and Retrieval<br />
Systems” (KRM) division spent capital to<br />
refurbish machinery and equipment in<br />
Bellheim and Neuburg, as well as procuring<br />
equipment for the production of the<br />
new “Shuttle” generation.<br />
The “Industrial Automation and Conveyor<br />
Technology” (AFT) division invested<br />
primarily in the construction or expansion<br />
of test installations in Schopfheim and<br />
in South Korea.<br />
The “Static Storage Systems” (Stow)<br />
division concentrated on the automation<br />
of shipping operations at Dottenijs, the<br />
expansion of its commercial IT and the<br />
reinforcement of its sales organization.<br />
Outlook<br />
For 2003, the Kardex Remstar Group<br />
expects the economy to remain sluggish;<br />
this will hamper the demand for capital<br />
goods. The focus will therefore be on<br />
tight cost management. The Kardex<br />
Remstar Group will continue to invest<br />
prudently in order to increase free cash<br />
flow. In addition, the Kardex Remstar<br />
Group will expedite innovative processes<br />
and continuously improve quality at every<br />
level with regard to all products and<br />
services.<br />
Proposed allocation of profit<br />
For the first time since the Group went<br />
public in 1987, no dividend was paid in<br />
2001. For <strong>2002</strong>, the non-executive Board<br />
of Directors will again propose that the<br />
Annual General Meeting waive the<br />
payment of a dividend. This proposal is<br />
justified in view of low net profit and the<br />
necessity to reduce debt. However, it<br />
remains the declared intention of the nonexecutive<br />
Board to pay a dividend again<br />
as soon as warranted by the financial<br />
results.<br />
With its comprehensive line-up of products<br />
and services, the Kardex Remstar Group<br />
is ideally equipped and positioned for the<br />
future. A modest upturn in the markets<br />
will lead to substantial increases in sales<br />
and profits.<br />
23
KARDEX REMSTAR GROUP<br />
CONSOLIDATED KEY FIGURES 1998–<strong>2002</strong><br />
Net sales per employee 13) 264<br />
<strong>2002</strong><br />
TCHF<br />
Net revenue<br />
EBITDA<br />
EBITDA margin 2)<br />
Operating profit (EBIT)<br />
EBIT margin 3)<br />
Profit/loss (–) for the year<br />
Return on sales 4)<br />
Cash flow from operating activities<br />
Investments in fixed assets<br />
Free cash flow 5)<br />
Current assets<br />
Non-current assets<br />
Total assets<br />
Liabilities<br />
Share capital<br />
Shareholders’ equity<br />
Minority interests<br />
Total liabilities and shareholders’ equity<br />
Equity ratio 6)<br />
Dividend<br />
Net working capital 7)<br />
Net interest-bearing liabilities 8)<br />
Debt ratio 9)<br />
Coverage ratio 10)<br />
Gearing 11)<br />
Employees (full-time equivalents) 12)<br />
FTE<br />
549 935<br />
36 807<br />
6.69%<br />
18 439<br />
3.35%<br />
3 007<br />
0.55%<br />
42 153<br />
14 264<br />
22 615<br />
240 547<br />
194 948<br />
435 495<br />
280 118<br />
79 950<br />
150 827<br />
4 550<br />
435 495<br />
35.68%<br />
0<br />
57 631<br />
100 479<br />
2.73<br />
2.57<br />
0.65<br />
2 034<br />
2001<br />
TCHF<br />
560 468<br />
32 339<br />
5.77%<br />
17 203<br />
3.07%<br />
4 051<br />
0.72%<br />
28 622<br />
25 303<br />
–34 448<br />
257 162<br />
197 351<br />
454 513<br />
296 288<br />
79 950<br />
154 602<br />
3 623<br />
454 513<br />
34.81%<br />
0<br />
65 137<br />
120 564<br />
3.73<br />
2.39<br />
0.76<br />
2 132<br />
291<br />
2000 1)<br />
TCHF<br />
Restated<br />
441 056<br />
39 502<br />
8.96%<br />
28 945<br />
6.56%<br />
19 490<br />
4.42%<br />
–10 577<br />
13 544<br />
–77 198<br />
211 476<br />
115 902<br />
327 378<br />
162 697<br />
79 950<br />
164 681<br />
0<br />
327 378<br />
50.30%<br />
10 127<br />
78 526<br />
42 080<br />
1.07<br />
8.13<br />
0.26<br />
1 714<br />
297<br />
1999<br />
TCHF<br />
290 616<br />
34 232<br />
11.78%<br />
29 291<br />
10.08%<br />
20 604<br />
7.09%<br />
17 100<br />
14 234<br />
–3 282<br />
152 755<br />
37 895<br />
190 650<br />
105 855<br />
53 300<br />
84 795<br />
0<br />
190 650<br />
44.48%<br />
9 540<br />
61 489<br />
29 028<br />
0.85<br />
n.a.<br />
0.34<br />
1 259<br />
240<br />
1998<br />
TCHF<br />
261 209<br />
30 830<br />
11.80%<br />
26 100<br />
10.22%<br />
18 974<br />
7.26%<br />
10 406<br />
5 129<br />
1 063<br />
142 361<br />
25 882<br />
168 243<br />
90 754<br />
53 300<br />
77 489<br />
0<br />
168 243<br />
46.06%<br />
9 061<br />
63 725<br />
6 835<br />
0.22<br />
n.a.<br />
0.09<br />
1 160<br />
225<br />
24<br />
1)<br />
Restated, mainly capitalization and amortization of goodwill.<br />
2)<br />
EBITDAllllllllll<br />
Net revenue<br />
3)<br />
EBITlllllllllllllllll<br />
Net revenue<br />
4)<br />
Profit/loss (–) for the year<br />
Net revenue<br />
5)<br />
Cash flow from operating activities + cash flow<br />
from investing activities<br />
6)<br />
Including minority interests<br />
7)<br />
Current assets ./. short-term liabilities<br />
8)<br />
Short-term bank loans + other short-term interest-bearing liabilities<br />
+ long-term interest-bearing liabilities./. cash and cash equivalents<br />
./. securities ./. other interest-bearing short-term liabilities<br />
9)<br />
Net interest-bearing liabilities<br />
EBITDA<br />
10)<br />
EBITxxxxxxxxxxxxxxxxxxxxxxxxxxxx<br />
Interest expenses ./. interest earned<br />
11)<br />
Net interest-bearing liabilities<br />
Shareholders’ equity<br />
12)<br />
Full-time equivalent (exclusive trainees)<br />
13)<br />
Net revenuexxxxxxxxxxxxxxxxxxxxxxxxxxl<br />
Average employees (full-time equivalents)
TOTAL ASSETS KARDEX REMSTAR GROUP<br />
Current assets<br />
Non-current assets<br />
Liabilities<br />
Shareholders’ equity (including minority interests)<br />
DEVELOPMENT OF SALES BY REGION<br />
Sales <strong>2002</strong> (in CHF million)<br />
Sales 2001 (in CHF million)<br />
EU countries<br />
Other Europe<br />
North, Middle, South America<br />
Middle and Far East, Oceania<br />
25
Consolidated Balance Sheet at 31 December <strong>2002</strong><br />
Assets<br />
Note<br />
31. 12. <strong>2002</strong><br />
TCHF %<br />
31. 12. 2001<br />
TCHF %<br />
Cash and cash equivalents<br />
Securities<br />
Accounts receivables – trade, services, net<br />
Other non-interest-bearing current assets<br />
Inventories 3<br />
Prepaid expenses and accrued income<br />
Current assets<br />
63 703<br />
8 384<br />
216 635<br />
15 163<br />
137 399<br />
10 167<br />
451 451 46.4<br />
71 665<br />
30 707<br />
233 997<br />
18 814<br />
134 662<br />
9 120<br />
498 965 48.3<br />
Land and buildings 5<br />
Machinery, equipment and vehicles 5<br />
Major production machines 5<br />
Assets under construction 5<br />
Assets under financial lease 5<br />
Loans<br />
Investments<br />
Other financial assets 4<br />
Goodwill 6<br />
Other intangible assets 6<br />
Non-current assets<br />
Total assets<br />
183 409<br />
105 479<br />
92 221<br />
12 742<br />
7 887<br />
1 251<br />
716<br />
5 251<br />
95 824<br />
16 051<br />
520 831 53.6<br />
972 282 100.0<br />
182 335<br />
104 380<br />
95 173<br />
26 375<br />
8 191<br />
1 036<br />
695<br />
4 860<br />
98 964<br />
11 737<br />
533 746 51.7<br />
1 032 711 100.0<br />
Equity and Liabilities<br />
Note<br />
31. 12. <strong>2002</strong><br />
TCHF %<br />
31. 12. 2001<br />
TCHF %<br />
Short-term bank loans<br />
Accounts payable – trade, services<br />
Other non-interest-bearing short-term liabilities<br />
Accrued expenses and deferred taxes<br />
Short-term provisions 9<br />
Short-term liabilities<br />
78 145<br />
121 237<br />
35 163<br />
47 261<br />
16 384<br />
298 190 30.7<br />
201 092<br />
107 121<br />
32 432<br />
49 707<br />
15 222<br />
405 574 39.3<br />
Bonds<br />
Long-term bank loans 7<br />
Other interest-bearing long-term liabilities 8<br />
Subordinated loans (interest-bearing) 8<br />
Long-term provisions 9<br />
Provisions for deferred taxes<br />
Long-term liabilities<br />
0<br />
216 394<br />
15 671<br />
4 119<br />
27 282<br />
11 050<br />
274 516 28.2<br />
30 000<br />
160 552<br />
20 151<br />
0<br />
26 123<br />
13 114<br />
249 940 24.2<br />
Share capital<br />
Capital reserves<br />
Restricted reserves for treasury stock<br />
Retained earnings<br />
Profit/loss (–) for the year<br />
Shareholders’ equity 10<br />
80 640<br />
78 047<br />
177<br />
100 252<br />
23 831<br />
282 947 29.1<br />
80 640<br />
78 047<br />
0<br />
133 328<br />
–33 324<br />
258 691 25.0<br />
26<br />
Minority interests<br />
Total shareholders’ equity (including minority interests)<br />
Total liabilities and shareholders’ equity<br />
116 629 12.0<br />
399 576 41.1<br />
972 282 100.0<br />
118 506 11.5<br />
377 197 36.5<br />
1 032 711 100.0
Consolidated Income Statement <strong>2002</strong><br />
Note<br />
<strong>2002</strong><br />
TCHF %<br />
2001<br />
TCHF %<br />
Net revenue 20<br />
Costs of goods sold<br />
Own production capitalized<br />
Gross profit<br />
974 452<br />
–778 922<br />
0<br />
195 530 100.0<br />
1 018 017<br />
–835 026<br />
177<br />
183 168 100.0<br />
Other operating income 11<br />
Administration expenses<br />
Marketing and selling expenses<br />
Research and development expenses<br />
Amortization of goodwill<br />
Other operating expenses 14<br />
Gains on disposal of operating fixed assets<br />
Operating profit<br />
11 772 6.0<br />
–65 629 –33.6<br />
–77 416 –39.6<br />
–12 418 –6.4<br />
–6 429 –3.3<br />
–2 049 –1.0<br />
9 758 5.0<br />
53 119 27.2<br />
5 345 2.9<br />
–69 060 –37.7<br />
–84 226 –46.0<br />
–13 091 –7.1<br />
–6 260 –3.4<br />
–12 079 –6.6<br />
5 970 3.3<br />
9 767 5.3<br />
Net financial result 15<br />
Net non-operating expenses 16<br />
Profit/loss (–) for the year before tax<br />
–21 427<br />
7 605<br />
39 297<br />
–22 637<br />
–14<br />
–12 884<br />
Taxes 17<br />
Profit/loss (–) for the year<br />
Minority interests<br />
Profit/loss (–) for the year (excluding minority interests)<br />
–12 141<br />
27 156<br />
–3 325<br />
23 831<br />
–15 355<br />
–28 239<br />
–5 085<br />
–33 324<br />
27
Consolidated Cash Flow Statement <strong>2002</strong><br />
<strong>2002</strong><br />
TCHF<br />
2001<br />
TCHF<br />
Profit/loss (–) for the financial year (excluding minority interests)<br />
Minority interests<br />
Depreciation<br />
Gains on disposal of fixed assets<br />
Losses on disposal of fixed assets<br />
Other non-cash income/expenses<br />
Depreciation of loans – investments<br />
Amortization<br />
Increase/decrease (–) of provisions<br />
Increase/decrease (–) of provisions and deferred taxes<br />
Increase/decrease (–) of pension provisions<br />
Share of associates’ net profit<br />
Increase/decrease (–) of non-cash net working capital<br />
Cash flow from operating activities<br />
23 831<br />
3 325<br />
38 341<br />
–17 315<br />
422<br />
428<br />
0<br />
6 429<br />
4 029<br />
–1 927<br />
526<br />
–12<br />
18 675<br />
76 752<br />
–33 324<br />
5 085<br />
35 233<br />
–5 970<br />
1 108<br />
1 738<br />
1 000<br />
6 260<br />
10 918<br />
3 254<br />
647<br />
–128<br />
49 313<br />
75 134<br />
Application of funds for acquisition of subsidiaries<br />
Investments in securities<br />
Disposal of securities<br />
Increase of loans and long-term securities<br />
Decrease of loans and long-term securities<br />
Investment in tangible fixed assets<br />
Disposal of tangible fixed assets<br />
Investment in intangible fixed assets<br />
Disposal of intangible fixed assets<br />
Cash flow from investing activities<br />
–1 392<br />
–165<br />
22 112<br />
–269<br />
25<br />
–31 592<br />
27 283<br />
–9 755<br />
134<br />
6 381<br />
–41 573<br />
753<br />
1 000<br />
560<br />
1 398<br />
–62 582<br />
15 101<br />
–5 517<br />
0<br />
–90 860<br />
28
Note<br />
<strong>2002</strong><br />
TCHF<br />
2001<br />
TCHF<br />
Increase/decrease (–) in bonds<br />
Increase/decrease (–) in bank loans<br />
Increase/decrease (–) in other long-term liabilities<br />
Share capital increase (including share premium)<br />
Dividend payments to minorities<br />
Cash flow from financing activities<br />
–30 000<br />
–67 069<br />
–618<br />
–200<br />
0<br />
–97 887<br />
0<br />
14 597<br />
41 090<br />
0<br />
–8 317<br />
47 370<br />
Increase/decrease (–) in cash and cash equivalents<br />
–14 754<br />
31 644<br />
Exchange effect on cash and cash equivalents<br />
6 792<br />
1 316<br />
Change in cash and cash equivalents 18<br />
–7 962<br />
32 960<br />
Cash and cash equivalents at the start of the financial year<br />
71 665<br />
38 705<br />
Cash and cash equivalents at the end of the financial year<br />
63 703<br />
71 665<br />
Change in cash and cash equivalents<br />
–7 962<br />
32 960<br />
29
Notes to the consolidated financial statements <strong>2002</strong><br />
Notes to the consolidated financial statements <strong>2002</strong><br />
Balance sheet<br />
Note 1<br />
Accounting principles<br />
1.1 General<br />
The consolidated accounts of Industrieholding Cham AG are<br />
based on the accounts of the individual subsidiary companies,<br />
which were prepared in accordance with the historical cost principle<br />
and with Swiss GAAP FER.<br />
The new Standards 20 (Impairment of assets) and 22 (Long-term<br />
contracts) were applied in <strong>2002</strong> for the first time.<br />
The financial statements have been approved by the nonexecutive<br />
Board of Directors of Industrieholding Cham AG on<br />
24 March 2003.<br />
subsidiaries at the date of purchase or first-time consolidation.<br />
Transactions and balances between the consolidated companies,<br />
including income and expenses, as well as assets and<br />
liabilities, are eliminated in the consolidation process. Profits<br />
occurring on intercompany supplies of goods and services are<br />
eliminated in the profit consolidation.<br />
Companies in which Industrieholding Cham AG holds between<br />
20% and 50% of the voting rights are valued according to the<br />
equity method. The profit and loss account includes only the<br />
proportion of profit accruing to Industrieholding Cham AG, and<br />
the balance sheet the corresponding proportion of equity.<br />
Investments in companies below 20% are valued at historical<br />
cost (less any necessary valuation reserves).<br />
1.2 Principles of consolidation<br />
1.3 Cash and cash equivalents<br />
The consolidated financial statements comprise of the holding<br />
and all subsidiaries, where Industrieholding Cham AG holds<br />
directly or indirectly more than 50% of the voting rights.<br />
Cash and cash equivalents comprise cash in hand, post deposits,<br />
bank deposits and term deposits. Foreign currency amounts are<br />
translated at the exchange rates on balance sheet date.<br />
Assets and liabilities as well as income and expenses are reported<br />
in their entirety in accordance with the guidelines on full<br />
consolidation. The minority interest in the shareholders’ equity<br />
and profit or loss of consolidated companies is to be disclosed<br />
separately.<br />
1.4 Marketable securities<br />
Marketable securities are publicly traded securities, and are<br />
carried at the lower of cost or market value.<br />
Companies that are acquired during the year will be consolidated<br />
as from the date of incorporation.<br />
1.5 Inventories<br />
All balance sheet items (with the exception of shareholders’<br />
equity) are to be translated into the reporting currency at the<br />
exchange rate ruling at the balance sheet date. The items in the<br />
profit and loss accounts are translated at an average rate of the<br />
period. The translation differences are booked into the shareholders’<br />
equity account.<br />
Consolidation of shareholders’ equity is calculated according to<br />
the purchase method. According to this method the purchase<br />
costs of the consolidated subsidiaries, as valued in the subsidiary<br />
accounts, are offset against the shareholders’ equity of the<br />
Raw materials and trade inventories are recorded at the lower of the<br />
initial purchase price or the market value. Finished and semi-finished<br />
products are valued at manufacturing cost. The values are generally<br />
based on the first-in-first-out (FIFO) or average price method. Settlement<br />
discounts (in the sense of deduction for a quick payment) are<br />
dealt with as purchase price reductions. Intercompany profits are<br />
eliminated.<br />
30
Long-term contracts (Real Estate and Materials Handling division)<br />
are recognized according to the percentage-of-completion method<br />
(POC) in the consolidated financial statements. With the POC method<br />
any profit is recognized based on the stage of completion. The stage<br />
of completion is determined by the cost-to-cost method (Real Estate<br />
and Materials Handling division). The Materials Handling division<br />
uses the efforts-expended method as an additional check.<br />
1.6 Tangible fixed assets<br />
Tangible fixed assets (machinery, furniture, buildings and land) are<br />
stated in the balance sheet at purchase price less accumulated<br />
depreciation. Depreciation is calculated on the basis of the expected<br />
useful life (see note 13: Depreciation).<br />
Real Estate division: Long-term projects, which will be used as<br />
investment property, will be recognized at cost, less any impairment<br />
losses. Borrowing costs are expensed as financial costs (no<br />
capitalization).<br />
1.9 Taxes<br />
Provisions have been made for the taxes incurred on the taxable<br />
profits of the individual companies, as well as for non-reclaimable<br />
taxes withheld from the distributable profits of the subsidiaries.<br />
The provisions for deferred taxes take into consideration the<br />
taxation effects of the differences between the values applying for<br />
taxation purposes and those calculated according to companyinternal<br />
principles. Deferred taxes are calculated on the basis of<br />
locally applicable tax rates. The relevant tax rates are those which<br />
were anticipated at the date of the balance sheet (liability method).<br />
In accordance with Swiss GAAP FER 11/25, deferred tax assets<br />
on temporary differences and on tax losses carried forward may<br />
only be shown as an asset when it is probable that sufficient<br />
taxable profits will be generated within the respective accounting<br />
periods.<br />
1.10 Foreign currencies<br />
1.7 Liabilities<br />
Short-term liabilities include all financial obligations which are due<br />
within one year. In contrast, long-term liabilities reflect all obligations<br />
with more than one year until maturity.<br />
1.8 Provisions<br />
Provisions are created if a legal requirement or past event gives<br />
rise to an obligation that is likely to cause a negative cash flow<br />
which can be reliably estimated. The amount of the provision corresponds<br />
to the best-possible current estimate of the respective<br />
obligation.<br />
The consolidated balance sheet and income statement are presented<br />
in Swiss francs (CHF).<br />
Foreign exchange rates Balance sheet Income stateyear-end<br />
rate ment/Average<br />
rate for the year<br />
<strong>2002</strong> 2001 <strong>2002</strong> 2001<br />
USA USD 1 1.39 1.69 1.56 1.69<br />
Great Britain GBP 1 2.23 2.46 2.34 2.43<br />
Norway NOK 100 19.96 18.62 19.54 18.78<br />
EURO EUR 1 1.45 1.49 1.47 1.51<br />
31
Notes to the consolidated financial statements <strong>2002</strong><br />
Notes to the consolidated financial statements <strong>2002</strong><br />
Balance sheet<br />
1.11 Employee benefit plans<br />
In addition to participating in state pension plans, the individual<br />
group companies also have their own pension schemes of which<br />
the majority of employees are members. Most of these are defined<br />
contribution pension plans, but in some cases there are<br />
also defined benefit pension plans.<br />
The definitions of defined contribution and defined benefit pension<br />
plans comply with the definitive version of Swiss GAAP FER<br />
16, which was published in the collection of valid Standard for the<br />
year <strong>2002</strong>. In the case of a defined contribution pension plan, the<br />
contributions of the employees are fixed in the valid rules of the<br />
plan. The employer is not responsible for prevailing contribution<br />
gaps in the pension plan. All due surpluses are effected, as a rule,<br />
to the benefit of the insured. Without further commitment on<br />
coverage from the employer, the Swiss pension plans, in accordance<br />
with the Swiss Federal Law on Occupational Benefit Plans<br />
(BV), will be treated as defined contribution pension plans.<br />
The pension fund costs of the defined benefit pension plans have<br />
been calculated according to the accrued benefit valuation method.<br />
This takes into account expectations regarding return on capital,<br />
salary development and pension indexing. The initial<br />
calculation of the difference between the pension liability and the<br />
net assets of the pension fund is calculated and recognized in the<br />
income statement using the straight-line method over the average<br />
remaining period of service of the respective employees. The<br />
annual pension fund costs of the group are charged to personnel<br />
expenses.<br />
1.12 Intangible fixed assets<br />
Any difference between the purchase price and the acquired net<br />
assets (goodwill) valued according to group policies, is capitalized<br />
and amortized over its useful economic life.<br />
Internally generated intangibles (research & development, software,<br />
patents, licences) can only be capitalized if they meet all<br />
the conditions outlined in Swiss GAAP FER 9. Intangible assets<br />
are valued at the lower of acquisition or production costs and net<br />
realizable value. The useful life is estimated carefully, using the<br />
straight-line method (see note 13: Depreciation).<br />
Note 2 – Changes in group companies<br />
During <strong>2002</strong>, the group expanded to include the following<br />
company which was consolidated for the first time: real estate<br />
company Hans Schmidlin AG, Steinhausen/ZG (acquired as of<br />
1 October <strong>2002</strong>). The real estate company is subconsolidated<br />
within the Real Estate division.<br />
Note 3 – Inventories<br />
<strong>2002</strong> 2001<br />
TCHF TCHF<br />
Raw materials 41 633 40 605<br />
Production supplies 3 795 3 290<br />
Semi-finished goods 17 574 12 652<br />
Finished goods 56 540 59 957<br />
Spare parts 15 277 16 564<br />
Trade merchandise 1 291 1 137<br />
Agriculture 83 105<br />
Property held for sale 1 206 352<br />
Total 137 399 134 662<br />
Above figures include depreciation on inventory of TCHF 3 234<br />
(2001: TCHF 3 697) and received prepayments from customers<br />
of TCHF 12 409 (2001: TCHF 20 158).<br />
32
Note 4 – Other financial investments<br />
31.12.02 31.12.01<br />
TCHF TCHF<br />
Pension plans 612 1 093<br />
Deferred tax credits 4 559 3 692<br />
Long-term securities 80 75<br />
Total 5 251 4 860<br />
Deferred tax<br />
The capitalized deferred tax assets of TCHF 4 559 (2001: TCHF<br />
3 692) take into account the effects on income tax of existing<br />
tax losses carried forward against future taxable profits in the<br />
Materials Handling division.<br />
As of 31 December <strong>2002</strong>, the value of the tax losses carried<br />
forward, which for reasons of prudence has not been capitalized,<br />
amounts to TCHF 13 900 (2001: TCHF 20 385).<br />
Pension plan assets<br />
The calculations were based on the assumptions listed below.<br />
Variations within the group result from varying parameters in the<br />
individual business divisions and countries of the group.<br />
Employee benefit plans exist both within the Speciality Paper and<br />
Materials Handling divisions. Recalculations on the assets and<br />
obligations are done on an annual basis.<br />
2001/<strong>2002</strong> NO D UK<br />
Discount rate 6% 5.75% 5.4%<br />
Expected yield on<br />
pension fund capital 7% 5.25% 7.75%<br />
Salary increase 3% 2.3% 4.5%<br />
Benefit progression 3% 2% 2.3%<br />
Excess Unfunded Excess Unfunded<br />
cover<br />
cover<br />
<strong>2002</strong> <strong>2002</strong> 2001 2001<br />
TCHF TCHF TCHF TCHF<br />
Calculated pension fund liabilities 27 446 11 582 26 603 19 743<br />
– Market value of assets –28 756 –7 514 –28 918 –9 219<br />
+ Funded portion not eligible for capitalization 0 –1 407 0 0<br />
+/– Difference from initial application 23 –913 271 –5 368<br />
+/– Accrued pension fund costs for defined benefit plans 0 94 0 1 116<br />
Net assets (–)/provision for employee benefit plans –1 287 1 842 –2 044 6 272<br />
Net capitalized pension plan receivables –555 –4 228<br />
– thereof capitalized pension plan receivables Materials Handling division 612 1 093<br />
– thereof provisions Hunsfos / Speciality Paper division –1 167 –5 321<br />
The provisions of the Speciality Paper division are booked in the<br />
long-term provisions for pensions and similar obligations (see<br />
Note 9).<br />
33
Notes to the consolidated financial statements <strong>2002</strong><br />
Notes to the consolidated financial statements <strong>2002</strong><br />
Balance sheet<br />
Note 5 – Movements in tangible fixed assets<br />
Land and Machinery Major Assets Assets Total<br />
buildings equipment production under under finan- <strong>2002</strong><br />
vehicles machines construction cial lease<br />
TCHF TCHF TCHF TCHF TCHF TCHF<br />
Gross value 01.01.<strong>2002</strong><br />
Additions from initial consolidation<br />
Additions<br />
Disposals<br />
Restatement<br />
Other adjustments<br />
Exchange rate differences<br />
Gross value 31.12.<strong>2002</strong><br />
Accumulated depreciation 01.01.<strong>2002</strong><br />
Additions<br />
Disposals<br />
Restatement<br />
Other adjustments<br />
Exchange rate differences<br />
Accumulated depreciation 31.12.<strong>2002</strong><br />
Net tangible fixed assets 01.01.<strong>2002</strong><br />
Net tangible fixed assets 31.12.<strong>2002</strong><br />
Insurance value<br />
246 346 308 060 216 894 29 253 12 007 812 560<br />
0 219 0 0 0 219<br />
7 161 14 478 508 9 191 1 336 32 674<br />
–13 307 –7 188 0 –1 633 –348 –22 476<br />
–645 2 813 0 –1 245 –355 568<br />
10 635 6 489 2 648 –22 684 180 –2 732<br />
–702 –4 714 2 388 –140 –40 –3 208<br />
249 488 320 157 222 438 12 742 12 780 817 605<br />
64 011 203 680 121 721 2 878 3 816 396 106<br />
6 605 18 420 8 097 0 1 367 34 489<br />
–4 786 –5 210 0 –1 633 –173 –11 802<br />
688 1 282 0 –1 245 –157 568<br />
0 –140 2 0 0 –138<br />
–439 –3 354 397 0 40 –3 356<br />
66 079 214 678 130 217 0 4 893 415 867<br />
182 335 104 380 95 173 26 375 8 191 416 454<br />
183 409 105 479 92 221 12 742 7 887 401 738<br />
505 880 552 879 864 052 29 291 9 953 1 962 055<br />
Group landholdings (in m 2 ) 31.12.<strong>2002</strong><br />
Switzerland<br />
Germany<br />
Italy<br />
Norway<br />
Others<br />
Total<br />
1 057 497<br />
157 763<br />
187 939<br />
242 200<br />
189 594<br />
1 834 993<br />
Prepayments of TCHF 616 (2001: TCHF 79) and other disbursements<br />
for current capital or building projects are recorded as<br />
assets under construction. The amounts are transferred to the<br />
respective asset categories when the project is completed. In<br />
<strong>2002</strong>, assets under construction, amounting to TCHF 22’684,<br />
have been relocated to the other tangible fixed assets categories<br />
and intangible fixed assets.<br />
The gross values at the end of <strong>2002</strong> are made up of the assets<br />
of the Speciality Paper, Real Estate and Materials Handling divisions.<br />
Included are also the gross values of the additions from<br />
initial consolidation less exchange rate differences.<br />
The total amount of the liabilities related to finance lease as per<br />
31.12.<strong>2002</strong> is TCHF 7’205 (2001: TCHF 7’117).<br />
34
Note 6 – Intangible fixed assets<br />
Goodwill Licences & Capitalized Others Total<br />
intercompany patents research and <strong>2002</strong><br />
development<br />
costs<br />
Gross value 01.01.<strong>2002</strong> 121 307 1 869 7 806 18 515 149 497<br />
Additions from initial consolidation 757 0 0 0 757<br />
Additions 3 535 120 1 731 4 369 9 755<br />
Disposals –34 –140 0 –732 –906<br />
Restatement 0 91 75 59 225<br />
Other adjustments 0 0 0 2 731 2 731<br />
Exchange differences –1 194 –22 –542 –261 –2 019<br />
Gross value 31.12.<strong>2002</strong> 124 371 1 918 9 070 24 681 160 040<br />
Accumulated depreciation 01.01.<strong>2002</strong> 22 343 289 1 542 14 622 38 796<br />
Additions 6 429 351 1 470 2 031 10 281<br />
Disposals –35 0 0 –726 –761<br />
Restatement 0 116 70 39 225<br />
Other adjustments 0 0 0 138 138<br />
Exchange differences –190 –5 –122 –197 –514<br />
Accumulated depreciation 31.12.<strong>2002</strong> 28 547 751 2 960 15 907 48 165<br />
Net intangible assets 01.01.<strong>2002</strong> 98 964 1 580 6 264 3 893 110 701<br />
Net intangible assets 31.12.<strong>2002</strong> 95 824 1 167 6 110 8 774 111 875<br />
The goodwill of TCHF 95 824 includes TCHF 79 478 from the<br />
Materials Handling division, TCHF 15 608 from the Holding<br />
division and TCHF 738 from the Real Estate division. On the<br />
goodwill from the Materials Handling divisions an impairment<br />
test has been performed based on the business plan. As per<br />
31.12.02, no adjustment was necessary. The other intangible<br />
assets consist mainly of software.<br />
Note 7 – Long-term bank loans<br />
31.12.2001 31.12.<strong>2002</strong><br />
TCHF TCHF TCHF TCHF TCHF TCHF<br />
Years until maturity<br />
Unsecured bank loans<br />
Secured bank loans<br />
Mortgages<br />
Total long-term bank loans<br />
1 2–3 4–5 >5 Total<br />
27 879 1 117 97 309 14 924 19 857 133 207<br />
54 808 6 920 16 894 4 966 17 915 46 695<br />
77 865 2 849 12 539 10 443 10 661 36 492<br />
160 552 10 886 126 742 30 333 48 433 216 394<br />
Secured loans are covered by land, buildings, operating machinery<br />
and parts of currents assets.<br />
The mortgages included with a remaining time of up to one year<br />
are legally redeemable at six months’ notice. In practice, however,<br />
they are treated as long-term borrowing because they are<br />
usually extended automatically. The same holds true for other<br />
loans, as long as it is the clear intention to extend these loans on<br />
an ongoing basis.<br />
35
Notes to the consolidated financial statements <strong>2002</strong><br />
Notes to the consolidated financial statements <strong>2002</strong><br />
Balance sheet<br />
Note 8 – Other long-term liabilities<br />
31.12.02 31.12.01<br />
Saving funds 1 840 1 979<br />
Other long-term liabilities<br />
of non-banks 13 831 18 172<br />
Subordinated loans 4 119 0<br />
Total 19 790 20 151<br />
In other long-term liabilities of non-banks of TCHF 13’831 (2001:<br />
TCHF 18’172) pension plan liabilities of TCHF 16 (2001: TCHF<br />
186) are included.<br />
Note 9 – Provisions<br />
Total Pensions Guarantees Process Restruc- Other Total<br />
short-term and similar and risks turing provisions long-term<br />
provisions obligations warranties provisions<br />
Opening balance 01.01.<strong>2002</strong><br />
Increase<br />
Decrease for obligations incurred<br />
Unused amounts reversed<br />
Changes from long-term<br />
to short-term provisions<br />
Exchange rate differences<br />
Closing balance 31.12.<strong>2002</strong><br />
15 222 13 363 2 398 146 6 595 3 621 26 123<br />
12 908 1 935 1 124 264 1 875 1 899 7 097<br />
–5 763 –1 652 –361 –101 –6 105 –1 717 –9 936<br />
–1 556 0 –312 0 –94 0 –406<br />
–4 508 221 0 0 4 287 0 4 508<br />
81 –218 –17 –1 129 3 –104<br />
16 384 13 649 2 832 308 6 687 3 806 27 282<br />
36
Note 10 – Changes in shareholders’ equity<br />
Share Capital Retained Profit/ Total sharecapital<br />
reserve profit loss (–) holders’<br />
equity<br />
TCHF TCHF TCHF TCHF TCHF<br />
Value 01.01.2001 80 640 78 047 137 785 –4 371 292 101<br />
Retained loss 0 0 –4 371 4 371 0<br />
Other changes 0 0 –767 0 –767<br />
Exchange differences on intercompany loans 0 0 897 0 897<br />
Exchange differences 0 0 –216 0 –216<br />
Loss for the financial year 0 0 0 –33 324 –33 324<br />
Value 31.12.2001 80 640 78 047 133 328 –33 324 258 691<br />
Value 01.01.<strong>2002</strong> 80 640 78 047 133 328 –33 324 258 691<br />
Retained profit 0 0 –33 324 33 324 0<br />
Other changes 0 0 –200 0 –200<br />
Exchange differences on intercompany loans 0 0 –96 0 –96<br />
Exchange differences 0 0 721 0 721<br />
Profit for the financial year 0 0 0 23 831 23 831<br />
Value 31.12.<strong>2002</strong> 80 640 78 047 100 429 23 831 282 947<br />
Minority interests 0 0 0 0 116 629<br />
Total value 31.12.<strong>2002</strong> 80 640 78 047 100 429 23 831 399 576<br />
The share capital of TCHF 80’640, representing 806’400 shares<br />
with a nominal value of CHF 100 per share, together with the<br />
capital reserve of TCHF 78’047, comprise the paid-in capital.<br />
The retained profit contains retained group profits and group<br />
exchange differences resulting from currency translations.<br />
37
Notes to the consolidated financial statements <strong>2002</strong><br />
Notes to the consolidated financial statements <strong>2002</strong><br />
Income statement<br />
Note 11 – Other operating income<br />
Note 13 – Depreciation<br />
In <strong>2002</strong> the amount of TCHF 11’772 includes TCHF 7’734<br />
(2001: TCHF 3’038) from the Speciality Paper division (rent,<br />
paper refinement and subsidies) and TCHF 4’038 (2001: TCHF<br />
2’253) from the Materials Handling division (rent, subsidies and<br />
release of unused provisions).<br />
<strong>2002</strong> 2001<br />
Holding<br />
Goodwill 5% 5%<br />
Office and business equipment 20–33% 20–33%<br />
Note 12 – Personnel expenses<br />
<strong>2002</strong> 2001<br />
TCHF TCHF<br />
Wages and salaries 187 571 189 164<br />
Pension plan expenses 7 857 8 389<br />
Other social security expenses 36 322 33 497<br />
Other personnel expenses 5 078 5 505<br />
Total 236 828 236 555<br />
The pension plan expenses were calculated as follows:<br />
<strong>2002</strong> 2001<br />
TCHF TCHF<br />
Contribution made to<br />
defined contribution plans 6 045 6 560<br />
Contribution made to<br />
defined benefit plans 1 847 2 088<br />
Accrual of expenses under<br />
defined benefit plans –35 –259<br />
Total pension plan expenses 7 857 8 389<br />
Employees (with apprentices/ 31.12.02 31.12.01<br />
trainees, including part-time employees)<br />
Speciality Paper division<br />
Land 0% 0%<br />
Buildings 4% 4%<br />
Large industrial machinery 4% 4%<br />
Machinery, plant and equipment 10–33% 10–33%<br />
Office and business equipment,<br />
vehicles 5–20% 5–20%<br />
Real Estate division<br />
Land, buildings under construction 0% 0%<br />
Rental housing 2.5% 2.5%<br />
Real estate built after 1990 2.5% 2.5%<br />
Farm buildings 2.5% 2.5%<br />
Machinery and equipment 20–33% 20–33%<br />
Vehicles 20% 20%<br />
Materials Handling division<br />
Buildings 2.5–5% 2.5–5%<br />
Fixtures according according<br />
in tented premises<br />
to contract to contract<br />
Machinery and equipment 7–20% 7–20%<br />
Office and business equipment,<br />
vehicles 5–33% 5–33%<br />
Research and development costs 20% 20%<br />
Goodwill 5% 5%<br />
Full-time employees 3 114 3 240<br />
Apprentices/trainees 35 33<br />
Total 3 149 3 273<br />
38
Note 14 – Other operating expenses<br />
<strong>2002</strong> 2001<br />
TCHF TCHF<br />
Other operating expenses –2 754 –2 241<br />
Restructuring expenses –1 076 –9 838<br />
Extraordinary income 1 781 0<br />
Other operating expenses –2 049 –12 079<br />
The TCHF 1 781 comprises the release of restructuring provisions<br />
in the Speciality Paper division.<br />
Note 16 – Net non-operating expenses<br />
<strong>2002</strong> 2001<br />
TCHF TCHF<br />
Gains on disposal<br />
of non-operating fixed assets 7 557 0<br />
Losses on disposal<br />
of non-operating fixed assets 0 0<br />
Non-operating income 48 6<br />
Non-operating expenses 0 –20<br />
Net non-operating expenses 7 605 –14<br />
Note 15 – Net financial result<br />
<strong>2002</strong> 2001<br />
TCHF TCHF<br />
Income from investments 13 128<br />
Interest earned 1 712 2 671<br />
Other financial income 8 421 7 871<br />
Interest expenses –20 273 –24 005<br />
Depreciation of loans (assets) –50 0<br />
Other financial expenses –11 250 –9 302<br />
Net financial result –21 427 –22 637<br />
Note 17 – Taxes<br />
<strong>2002</strong> 2001<br />
TCHF TCHF<br />
Current taxes –15 675 –11 153<br />
Deferred taxes 3 534 –4 202<br />
Total –12 141 –15 355<br />
The reported taxes include taxes on the profit for the year, as well<br />
as capital tax, the change in deferred tax charged to the income<br />
statement and non-reclaimable taxes deducted at source on<br />
dividends of foreign subsidiaries.<br />
The other financial expenses include mainly exchange losses of<br />
TCHF –5 062 (2001: TCHF –3 283) from the Materials Handling<br />
division and TCHF –1’925 (2001: TCHF –4’167) from the<br />
Speciality Paper division.<br />
Note 18 – Change in cash and cash equivalents<br />
Recently, the cash flow statement is based on the fund “cash and<br />
cash equivalents”, excluding short-term bank loans.<br />
39
Notes to the consolidated financial statements <strong>2002</strong><br />
Notes to the consolidated financial statements <strong>2002</strong><br />
Other notes<br />
Note 19 – Segment reporting by business activity<br />
Consolidated Income Speciality Real Estate Materials Holding Elimination Consoli-<br />
Statement <strong>2002</strong> Paper Handling dated<br />
TCHF TCHF TCHF TCHF TCHF TCHF<br />
Net revenue<br />
Cost of goods sold<br />
Own production capitalized<br />
Gross profit<br />
413 232<br />
–357 868<br />
0<br />
55 364<br />
11 285<br />
–7 053<br />
0<br />
4 232<br />
549 935<br />
–414 001<br />
0<br />
135 934<br />
0<br />
0<br />
0<br />
0<br />
0<br />
0<br />
0<br />
0<br />
974 452<br />
–778 922<br />
0<br />
195 530<br />
Other operating income<br />
Administration expenses<br />
Marketing and selling expenses<br />
Research and development costs<br />
Amortization of goodwill<br />
Other operating expenses<br />
Gains on disposal of operating fixed assets<br />
Operating profit<br />
7 734<br />
–21 864<br />
–14 067<br />
–3 329<br />
0<br />
–5<br />
167<br />
24 000<br />
0<br />
–428<br />
–95<br />
0<br />
–19<br />
–113<br />
9 457<br />
13 034<br />
4 038<br />
–42 097<br />
–63 254<br />
–9 089<br />
–4 909<br />
–2 318<br />
134<br />
18 439<br />
0<br />
–1 240<br />
0<br />
0<br />
0<br />
387<br />
0<br />
–853<br />
0<br />
0<br />
0<br />
0<br />
–1 501<br />
0<br />
0<br />
–1 501<br />
11 772<br />
–65 629<br />
–77 416<br />
–12 418<br />
–6 429<br />
–2 049<br />
9 758<br />
53 119<br />
Net financial result<br />
Net non-operating expenses<br />
Profit for the year before tax<br />
–21 427<br />
7 605<br />
39 297<br />
Taxes<br />
Profit for the year<br />
Minority interests<br />
Profit for the year (excluding minority interests)<br />
–12 141<br />
27 156<br />
–3 325<br />
23 831<br />
Consolidated Balance Sheet Speciality Real Estate Materials Holding Elimination Consoliat<br />
31 December <strong>2002</strong> Paper Handling dated<br />
TCHF TCHF TCHF TCHF TCHF TCHF<br />
Current assets 177 477 27 057 240 547 17 471 –11 101 451 451<br />
Non-current assets 245 869 63 964 194 948 218 120 –202 070 520 831<br />
Total assets 423 346 91 021 435 495 235 591 –213 171 972 282<br />
Short-term liabilities 114 997 9 548 182 916 1 930 –11 201 298 190<br />
Long-term liabilities 158 965 18 045 97 202 24 804 –24 500 274 516<br />
Shareholders’ equity 149 384 63 428 155 377 208 857 –177 470 399 576<br />
Liabilities and shareholders’ equity 423 346 91 021 435 495 235 591 –213 171 972 282<br />
Operating profit 24 000 13 034 18 439 –853 –1 501 53 119<br />
Depreciation and losses on disposal<br />
of fixed assets 24 024 1 228 13 459 52 0 38 763<br />
Amortization 0 19 4 909 1 501 0 6 429<br />
40
Note 20 – Segment reporting by geographic region<br />
Net sales turnover by country<br />
<strong>2002</strong> 2001<br />
TCHF in % TCHF in %<br />
Switzerland 60 262 6.3 57 614 5.7<br />
Italy 56 608 5.8 72 841 7.2<br />
Norway 10 945 1.1 14 394 1.4<br />
Germany 263 423 27.0 244 880 24.1<br />
United Kingdom 106 092 10.9 115 352 11.3<br />
Netherlands 63 301 6.5 70 063 6.9<br />
Belgium 53 386 5.5 54 561 5.4<br />
Spain 28 316 2.9 26 430 2.6<br />
France 77 001 7.9 80 040 7.8<br />
Rest of EU 37 140 3.8 40 251 4.0<br />
Rest of Europe 34 894 3.6 44 190 4.3<br />
USA 86 983 8.9 84 451 8.3<br />
Canada 5 807 0.6 5 317 0.5<br />
Latin America 8 547 0.9 14 687 1.4<br />
Asia 68 630 7.0 78 638 7.7<br />
Oceania 5 131 0.5 7 295 0.7<br />
Africa 7 986 0.8 7 013 0.7<br />
Total 974 452 100.0 1 018 017 100.0<br />
Note 22 – Contingent liabilities<br />
31.12.02 31.12.01<br />
TCHF TCHF<br />
Guarantees of the indebtedness<br />
of others 291 0<br />
Guarantees 3 366 4 434<br />
Other liabilities 0 1 740<br />
Tax obligations 4 488 476<br />
Total 8 145 6 650<br />
Note 23 – Security on own liabilities<br />
31.12.02 31.12.01<br />
TCHF TCHF<br />
For mortgaged loans 90 592 62 324<br />
For other loans 46 521 33 031<br />
Total 137 113 95 355<br />
Note 21 – Unrecorded rental and leasing liabilities<br />
Unrecorded rental and leasing liabilities (Operating Leasing)<br />
amounted to TCHF 23’070 at the end of <strong>2002</strong> versus TCHF<br />
26’443 in the prior year. The future minimum rental and leasing<br />
commitments as of 31 December <strong>2002</strong> will become due as<br />
follows:<br />
Maturity date<br />
TCHF<br />
2003 8 094<br />
2004 5 275<br />
2005 3 450<br />
2006 2 515<br />
2007 2 086<br />
Later 1 650<br />
Total 23 070<br />
41
Notes to the consolidated financial statements <strong>2002</strong><br />
Notes to the consolidated financial statements <strong>2002</strong><br />
Other notes<br />
Note 24 – Financial instruments<br />
Contract amounts Positive Negative<br />
replacement value replacement value<br />
<strong>2002</strong> 2001 <strong>2002</strong> 2001 <strong>2002</strong> 2001<br />
TCHF TCHF TCHF TCHF TCHF TCHF<br />
Exchange instruments<br />
Currency futures –587 24 569 94 17 88 –735<br />
Exchange options 2 541 7 871 70 151 0 80<br />
Total exchange instruments 1 954 32 440 164 168 88 –655<br />
Interest instruments<br />
Interest rate swaps 50 194 35 902 0 591 –2 174 0<br />
Forward rate agreements 12 500 25 000 0 9 66 9<br />
Total interest instruments 62 694 60 902 0 600 –2 108 9<br />
Other derivative financial instruments 0 0 0 0 0 0<br />
Total financial instruments 64 648 93 342 164 768 –2 020 –646<br />
The above contract values are presented in order to provide<br />
information concerning the outstanding transaction volume at the<br />
date of the balance sheet. The replacement value represents the<br />
profit/loss which would have been realized at the daily prices<br />
applicable on 31 December <strong>2002</strong>.<br />
For derivative financial instruments which are exclusively held for<br />
hedging purposes, the positive and negative replacement values<br />
are not recorded in the accounts.<br />
Note 25 – Transaction with related parties<br />
There were no outstanding receivables or payables with related<br />
parties as of 31 December <strong>2002</strong>. Nor did any considerable transactions<br />
with related parties take place.<br />
42
Report of the group auditors<br />
To the Annual General Meeting of<br />
Industrieholding Cham AG, Cham<br />
As auditors of the group, we have audited the consolidated financial statements (income statement,<br />
balance sheet, cash flow statement and notes, pages 26 to 42) of Industrieholding Cham AG for the year<br />
ending 31 December <strong>2002</strong>.<br />
These consolidated financial statements are the responsibility of the non-executive Board of Directors. Our<br />
responsibility is to express an opinion on these consolidated financial statements based on our audit. We<br />
confirm that we meet the legal requirements concerning professional qualifications and independence.<br />
Our audit was conducted in accordance with auditing standards promulgated by the Swiss profession and<br />
with the International Standards on Auditing (ISA), which require that an audit to be so planned and performed<br />
as to obtain reasonable assurance about whether the consolidated financial statements are free from material<br />
misstatement. We have examined on a test basis evidence supporting the amounts and disclosures in the<br />
consolidated financial statements. We have also assessed the accounting principles used, significant estimates<br />
made, and the overall consolidated financial statement presentation. We believe that our audit provides a<br />
reasonable basis for our opinion.<br />
In our opinion, the consolidated financial statements give a true and fair view of the financial position, the results<br />
of operations and the cash flows in accordance with Swiss GAAP FER and comply with Swiss law as well as<br />
the principles of consolidation and valuation contained in the notes.<br />
We recommend that the consolidated financial statements submitted to you be approved.<br />
Zurich, 20 March 2003<br />
Ernst & Young AG<br />
Thomas Huwyler<br />
Certified Accountant<br />
(Auditor in Charge)<br />
Reto Fierz<br />
Certified Accountant<br />
43
Balance Sheet of Industrieholding Cham AG at 31 December <strong>2002</strong><br />
Assets<br />
31. 12. <strong>2002</strong><br />
TCHF %<br />
31. 12. 2001<br />
TCHF %<br />
Cash and cash equivalents<br />
Receivables from group companies<br />
Prepayment and deferrals<br />
Current assets<br />
16 071<br />
954<br />
287<br />
17 312 8.5<br />
41 173<br />
4 446<br />
579<br />
46 198 19.9<br />
Investments<br />
Loans to group companies<br />
Land<br />
Non-current assets<br />
161 918<br />
24 500<br />
1<br />
186 419 91.5<br />
141 918<br />
44 500<br />
1<br />
186 419 80.1<br />
Total assets<br />
203 731 100.0<br />
232 617 100.0<br />
Equity and Liabilities<br />
31. 12. <strong>2002</strong><br />
TCHF %<br />
31. 12. 2001<br />
TCHF %<br />
Accruals<br />
Bond issue<br />
Liabilities<br />
788<br />
0<br />
788 0.4<br />
1 118<br />
30 000<br />
31 118 13.4<br />
Share capital<br />
General legal reserve<br />
Restricted reserves for treasury stock<br />
Free reserve<br />
Brought forward<br />
Profit/loss (–) for the year<br />
Shareholders’ equity<br />
80 640<br />
80 765<br />
177<br />
26 223<br />
13 694<br />
1 444<br />
202 943 99.6<br />
80 640<br />
80 765<br />
0<br />
26 400<br />
10 090<br />
3 604<br />
201 499 86.6<br />
Total liabilities and shareholders’ equity<br />
203 731 100.0<br />
232 617 100.0<br />
44
Income Statement of Industrieholding Cham AG <strong>2002</strong><br />
Income<br />
<strong>2002</strong><br />
TCHF %<br />
2001<br />
TCHF %<br />
Investment income<br />
Net financial income<br />
Interest earned<br />
Gains on disposal of non-operating fixed assets<br />
Total income<br />
2 150 64.0<br />
–285 –8.5<br />
1 395 41.5<br />
100 3.0<br />
3 360 100.0<br />
4 004 68.2<br />
–389 –6.6<br />
2 253 38.4<br />
0 0.0<br />
5 868 100.0<br />
Expenses<br />
Financial expenses<br />
Administrative expenses<br />
Taxes<br />
Total expenses<br />
1 180 61.6<br />
709 37.0<br />
27 1.4<br />
1 916 100.0<br />
1 432 63.3<br />
702 31.0<br />
130 5.7<br />
2 264 100.0<br />
Profit/loss (–) for the year<br />
1 444<br />
3 604<br />
45
Notes to the financial statements <strong>2002</strong><br />
(Art. 663b Swiss CO)<br />
Note 1 – Contingent liabilities<br />
As of 31 December <strong>2002</strong>, similar to the previous year, no guarantees<br />
or mortgage bonds existed in favour of third parties.<br />
Note 7 – Reversal of hidden reserves<br />
No hidden reserves were reversed in <strong>2002</strong>.<br />
Note 2 – Assets assigned as security<br />
for own obligations<br />
As of 31 December <strong>2002</strong>, there were no assets assigned as security<br />
for own obligations.<br />
Note 3 – Lease commitments<br />
As of 31 December <strong>2002</strong>, similar to the previous year, no unrecorded<br />
commitments arising out of leasing transactions existed.<br />
Note 8 – Revaluations<br />
As in the prior year, no revaluations were made during the current<br />
period.<br />
Note 9 – Treasury shares<br />
of Industrieholding Cham AG<br />
In <strong>2002</strong> Industrieholding Cham AG bought 1 000 own treasury<br />
shares in the amount of CHF 176 575. Its affiliate companies<br />
held no shares in the parent company.<br />
Note 4 – Fire insurance value of fixed assets<br />
Industrieholding Cham AG owns no insurable fixed assets.<br />
Note 10 – Authorized or conditional capital<br />
As of 31 December <strong>2002</strong>, as in the year before, there was no<br />
authorized or conditional capital.<br />
Note 5 – Commitments to pension schemes<br />
As of 31 December <strong>2002</strong>, similar to the previous year, there<br />
existed no commitments towards pension schemes.<br />
Note 6 – Investments<br />
The affiliated companies of Industrieholding Cham AG are listed<br />
on pages 49 to 51.<br />
Note 11 – Significant shareholders as<br />
per Art. 663c CO (shareholding of more than 5%)<br />
As of 31 December <strong>2002</strong>, Tuxedo AG, Zug, and Pensionskasse<br />
des Basler Staatspersonals, Basel, are registered in the Industrieholding<br />
Cham AG share register as a shareholder with a capital<br />
quota in excess of 5%. The respective participation of Tuxedo<br />
AG is 30.17% and the participation of Pensionskasse des Basler<br />
Staatspersonals is 9.92%.<br />
46
Note 12 – Other supplementary information<br />
Net financial income <strong>2002</strong> 2001<br />
TCHF TCHF<br />
Interest and dividend income 846 1 098<br />
Price and exchange gains 761 88<br />
Price and exchange losses –1 525 –1 392<br />
Administrative costs –258 –141<br />
Portfolio performance –176 –347<br />
Change in provision<br />
for net unrealized price gains –109 –42<br />
Net income<br />
as per income statement –285 –389<br />
Proposed appropriation of profit<br />
<strong>2002</strong> 2001<br />
TCHF TCHF<br />
Profit brought forward 13 694 10 090<br />
Profit for the year 1 444 3 604<br />
Distributable profit 15 138 13 694<br />
Carried forward to new period 15 138 13 694<br />
The non-executive Board proposes to the Annual General<br />
Meeting that no dividend be distributed. Upon acceptance of this<br />
proposal, the distributable profit of CHF 15.1 million will be<br />
carried forward to the new period.<br />
47
Report of the group auditors<br />
To the Annual General Meeting of<br />
Industrieholding Cham AG, Cham<br />
As statutory auditors we have audited the accounting records and the financial statements (balance sheet,<br />
income statement and notes, pages 44 to 47) of Industrieholding Cham AG, for the financial year ending<br />
31 December <strong>2002</strong>.<br />
The financial statements are the responsibility of the non-executive Board of Directors. Our responsibility is to<br />
express an opinion on these statements based on our audit. We confirm that we meet the legal requirements<br />
concerning professional qualifications and independence.<br />
Our audit was conducted in accordance with auditing standards promulgated by the Swiss profession and with<br />
the International Standards on Auditing which require that an audit be so planned and performed as to obtain<br />
reasonable assurance about whether the financial statements are free from material misstatement. We have<br />
examined on a test basis evidence supporting the amounts and disclosures in the financial statements. We have<br />
also assessed the accounting principles used, significant estimates made and the overall financial statement<br />
presentation. We believe that our audit provides a reasonable basis for our opinion.<br />
In our opinion the accounting records and financial statements and the proposed appropriation of available<br />
earnings comply with Swiss law and the company’s articles of incorporation.<br />
We recommend that the financial statements submitted to you be approved.<br />
Zurich, 20 March 2003<br />
Ernst & Young AG<br />
Thomas Huwyler<br />
Certified Accountant<br />
(Auditor in charge)<br />
Reto Fierz<br />
Certified Accountant<br />
48
Affiliate companies as of 31 December <strong>2002</strong><br />
Name of company Location Activity Currency Share Holding<br />
capital direct indirect<br />
in million % %<br />
Cham Paper Group<br />
Papierfabriken Cham-Tenero AG CH Cham ■ ▲ ● CHF 130.0 100<br />
Papierfabrik Cham AG CH Cham ▲ CHF 5.0 100<br />
Aerofiber AG CH Cham ▲ CHF 0.1 100<br />
Cartiera di Locarno S.A. CH Tenero ■ ▲ CHF 9.0 100<br />
Cham Paper Group Deutschland GmbH DE Düsseldorf ● EUR 0.0256 100<br />
Cham Paper Group (France) S. à r. l. FR Paris ● EUR 0.0318 100<br />
Cham Paper Group (UK) Ltd. GB Tunbridge Wells ● GBP 0.01 100<br />
Cartiera di Carmignano S.p.A. IT Carmignano ■ ▲ ● EUR 15.0 100<br />
Saetersdalen AS NO Bykle ▲ NOK 0.051 33<br />
Hunsfos Fabrikker ASA NO Vennesla ■ ▲ ● NOK 330.0 100<br />
Cham Paper Group (Atlantic) Inc. US King of Prussia ● USD 0.0002 80<br />
Condino Energia S.r.l. 1) IT Condino EUR 0.03 100<br />
Kardex Remstar Group<br />
Kardex AG CH Zurich ▲ CHF 37.50 54.8 2)<br />
Kardex Organisationssysteme GmbH AT Vienna ● EUR 0.30 54.8 3)<br />
Stow GmbH Austria AT Vienna ● EUR 0.11 32.9 4)<br />
Kardex VCA Pty Ltd. AU Wodonga ■ ● AUD 0.20 54.8 3)<br />
S.A. Kardex N.V. BE Brussels ● EUR 0.35 54.8 3)<br />
Stow International nv BE Wevelgem ■ ▲ ● EUR 4.4 32.9 4)<br />
AFT Benelux NV BE Zandhoven ● EUR 0.061 54.8 3)<br />
RETIS Software AG CH Jona ■ ● CHF 0.33 54.8 3)<br />
System Schultheis AG CH Rapperswil ■ ● CHF 0.50 54.8 3)<br />
Dreier Systemtechnik AG CH Reinach ■ ● CHF 0.25 43.7 5)<br />
Kardex Systems AG CH Volketswil ● CHF 1.00 54.8 3)<br />
AFT Automation and Conveying Systems<br />
(Shanghai) Co. Ltd. CN Shanghai ● CNY 24.9 54.8 3)<br />
Shanghai Stow Storage Equipment Co. Ltd. CN Shanghai ■ ● USD 0.20 32.9 4)<br />
Kardex Systems Ltd. CY Limassol ● CYP 0.25 54.8 3)<br />
KRI Logistik Ltd. CY Limassol ● CYP 0.016 54.8 3)<br />
Megamat Overseas Ltd. CY Limassol ● CYP 0.01 54.8 3)<br />
Kardex s.r.o. CZ Prague ● CSK 0.50 54.8 3)<br />
1) The subsidiary Condino Energia S.r.l. was established on<br />
19.12.<strong>2002</strong>. In view of the minor significance of this subsidiary<br />
and its low level of business activity in <strong>2002</strong>, it has not been<br />
included in the consolidation.<br />
2) Proportion of voting rights of Industrieholding Cham AG<br />
■ Research, Development, Production, Product- and<br />
Software development<br />
▲ Financing, Real Estate, Services<br />
● Marketing, Sales<br />
on share capital<br />
3) Kardex AG holds 100%<br />
4) Kardex AG holds 60%<br />
5) Kardex AG holds 79.7%<br />
49
Affiliate companies as of 31 December <strong>2002</strong><br />
Name of company Location Activity Currency Share Holding<br />
capital direct indirect<br />
in million % %<br />
Kardex Remstar Group<br />
Stow Ceska Republika s.r.o. CZ Prague ● CSK 0.50 32.9 4)<br />
AFT Förderanlagen Bautzen GmbH & Co. KG DE Bautzen ■ ● EUR 0.205 54.8 3)<br />
Bellheimer Metallwerk GmbH DE Bellheim ■ ● EUR 4.24 54.8 3)<br />
GSS Global Software Solutions GmbH DE Filderstadt ■ ● EUR 0.03 54.8 3)<br />
Kardex Organisationssysteme GmbH DE Kronberg ● EUR 1.02 54.8 3)<br />
fam Fördertechnik GmbH DE Memmingen ■ ● EUR 0.03 54.8 3)<br />
Megamat GmbH DE Neuburg ■ ● EUR 2.05 54.8 3)<br />
AFT Automatisierungs- und Fördertechnik<br />
GmbH & Co. KG DE Schopfheim ■ ▲ ● EUR 0.23 54.8 3)<br />
AFT Immobilien GmbH DE Schopfheim ▲ EUR 0.03 54.8 3)<br />
AFT Verwaltungs GmbH DE Schopfheim ▲ EUR 0.03 54.8 3)<br />
Stow Deutschland GmbH DE Wiesbaden ● EUR 0.51 32.9 4)<br />
Kardex Sistemas S.A. ES Madrid ● EUR 0.30 54.8 3)<br />
ET Systems S.L. ES Sant Just Desvern ● EUR 0.003 54.8 3)<br />
JKL-Logistics OY FI Muurame ■ ● EUR 0.13 54.8 3)<br />
Kardex S.A.<br />
FR Neuilly-Plaisance<br />
Cedex ● EUR 0.76 54.8 3)<br />
Stow France S.A.<br />
FR Saint Pierre du<br />
Perray ● EUR 0.68 32.9 4)<br />
Kardex Systems (UK) Ltd. GB London ● GBP 0.83 54.8 3)<br />
Stow U.K. Co. Ltd. GB Middlesex ● GBP 0.22 32.9 4)<br />
Megamat (UK) Ltd. GB Milton Keynes ● GBP 0.001 54.8 3)<br />
AFT Automation and Conveying<br />
Systems UK, Ltd. GB Telford Shropshire ● GBP 0.03 54.8 3)<br />
Kardex Systems Ireland Ltd. IE Dublin ● EUR 0.001 54.8 3)<br />
Kardex TE-CO SpA IT Opera (Mi) ● EUR 0.31 54.8 3)<br />
Seo Kwang AFT Co. Ltd. KR Kyeonggi-Do ■ ● KRW 1176.0 54.8 3)<br />
AFT Automatización y Sistemas<br />
de Transportación de México S.A. de C.V. MX Mexico ● MXP 0.05 54.8 3)<br />
Stow Nederland bv NL TZ Hoeven ● EUR 0.02 32.9 4)<br />
Kardex Systemen B.V. NL HE Woerden ● EUR 0.09 54.8 3)<br />
Kardex System AS NO Oslo ● NOK 0.90 54.8 3)<br />
Stow Polska Sp.z.o.o. PL Warsaw ● PLZ 0.50 32.9 4)<br />
AFT Slovakia S.R.O. SK Bratislava ● SLK 0.20 54.8 3)<br />
AFT Automation and Conveying Systems Ltd. US Auburn Hills ● USD 0.055 54.8 3)<br />
MHAT Inc. US Auburn Hills ▲ USD 0.050 54.8 3)<br />
Remstar International Inc. US Westbrook ● USD 2.05 54.8 3)<br />
50<br />
3) Kardex AG holds 100%<br />
4) Kardex AG holds 60%<br />
■ Research, Development, Production, Product- and<br />
Software development<br />
▲ Financing, Real Estate, Services<br />
● Marketing, Sales
Name of company Location Activity Currency Share Holding<br />
capital direct indirect<br />
in million % %<br />
Hammer Retex Group<br />
Hammer Retex AG CH Cham ● ▲ CHF 4.00 100<br />
Valorit AG CH Cham ● ▲ CHF 0.50 100<br />
Hans Schmidlin AG CH Steinhausen ● ▲ CHF 0.1 100<br />
Holding and finance companies<br />
Ibemo AG CH Cham ▲ CHF 2.00 100<br />
Industrieverwaltungsgesellschaft Cham AG CH Cham ▲ CHF 0.05 100<br />
Sistemco AG CH Cham ▲ CHF 1.00 54.8 3)<br />
Kardimo AG CH Zurich ▲ CHF 0.50 54.8 3)<br />
Kardex Deutschland GmbH DE Bellheim ▲ EUR 0.51 54.8 3)<br />
Kardex Megamat Beteiligungs GmbH DE Neuburg ▲ EUR 5.11 54.8 3)<br />
Kardex Holdings Ltd. GB London ▲ GBP 1.83 54.8 3)<br />
Kardex Europe B.V. NL Amsterdam ▲ EUR 0.01 54.8 3)<br />
Kardex Nederland B.V. NL HE Woerden ▲ EUR 0.09 54.8 3)<br />
3) Kardex AG holds 100% ■ Research, Development, Production, Product- and<br />
Software development<br />
▲ Financing, Real Estate, Services<br />
● Marketing, Sales<br />
51
Corporate Governance<br />
Industrieholding Cham AG is aware of its responsibilities in<br />
communication with the public and the financial markets; its<br />
policy is therefore to provide transparent information to all stakeholders.<br />
Apart from the annual report, further details on the<br />
company, including the articles of incorporation, are available at<br />
www.iccham.com.<br />
Kardex AG has been deliberately omitted in the following section<br />
to eliminate redundancy. The relevant information is available in<br />
the annual report published by Kardex Remstar Group. It can be<br />
obtained on request from Industrieholding Cham AG.<br />
1. Group structure and shareholders<br />
Group structure 31 December <strong>2002</strong><br />
52
At 31 December <strong>2002</strong>, the share register of Industrieholding<br />
Cham AG lists Tuxedo AG, Zug, and the pension fund of the<br />
Basel Civil Servants Assn., Basel, as shareholders with a capital<br />
quota in excess of 5%. Tuxedo AG owns 30.17% and the pension<br />
fund of the Basel Civil Servants Assn. 9.92% of the shares.<br />
Industrieholding Cham AG is not aware of any shareholders’<br />
agreements or other forms of consensus among significant<br />
shareholders with respect to the registered shares of Industrieholding<br />
Cham AG or with respect to the exercise of shareholders’<br />
rights.<br />
Industrieholding Cham AG does not maintain any capital or voting-rights-related<br />
cross-shareholdings with other companies<br />
beyond the 5% limit.<br />
2. Capital structure<br />
The nominal value of the share capital of Industrieholding Cham<br />
AG is CHF 80’640’000, divided into 806’400 fully paid-up<br />
registered shares with a par value of CHF 100 each.<br />
Industrieholding Cham AG does not have any outstanding convertible<br />
bonds and options.<br />
Information for investors<br />
Number of dividend-bearing shares<br />
at 31 December<br />
<strong>2002</strong><br />
2001<br />
2000<br />
1999<br />
1998<br />
Registered shares (CHF 100 par)<br />
806 400<br />
806 400<br />
806 400<br />
403 200<br />
201 600<br />
Total outstanding<br />
806 400<br />
806 400<br />
806 400<br />
403 200<br />
196 600<br />
Per-share figures in CHF<br />
Net income<br />
Equity capital<br />
Dividend<br />
29.55<br />
350.88<br />
–<br />
–41.32<br />
320.80<br />
–<br />
–5.42<br />
362.23<br />
–<br />
58.00<br />
587.35<br />
20.00<br />
111.01<br />
962.62<br />
35.00<br />
Registered share<br />
Market prices High<br />
Low<br />
End-of-year price<br />
P/E ratio<br />
203<br />
110<br />
175<br />
5.9<br />
620<br />
161<br />
175<br />
n.a.<br />
850<br />
530<br />
620<br />
n.a.<br />
1 310<br />
518<br />
1 290<br />
22.2<br />
1 410<br />
700<br />
940<br />
8.50<br />
53
Corporate Governance<br />
3. Members of the non-executive Board of Directors<br />
Name Industrieholding Hammer Retex AG Papierfabriken Kardex AG<br />
Cham AG<br />
Cham-Tenero AG<br />
Function Term expires Function Term expires Function Term expires Function Term expires<br />
Heinrich C. Spoerry CBD 2005 CBD 2003 M 2004<br />
Michael Funk VCBD 2003 CBD 2003 M 2003 CBD 2004<br />
Dr. René Furler M 2003 M 2003<br />
Dr. Peter R. Isler M 2004 M 2005<br />
Dr. Reinhard von Meiss M 2005 M 2003<br />
Rolf Schweiger M 2003 M 2003<br />
Prof. Dr. Armin Seiler M 2005<br />
Beat U. Semadeni M 2003<br />
Claude Ebnöther CEO 2003<br />
Richard Flury CEO 2004<br />
Ernst Meiss M 2005<br />
Legend:<br />
CBD: Chairman of the non-executive Board of Directors<br />
VCBD: Vice-Chairman of the non-executive Board of Directors<br />
M: Member of the non-executive Board of Directors<br />
CEO: Chief Executive Officer<br />
The non-executive Boards of Directors of the 100% subsidiaries<br />
of Hammer Retex AG and Papierfabriken Cham-Tenero AG consist<br />
of members of the non-executive and executive Boards of Directors.<br />
Short-form portraits<br />
Name, nationality<br />
Professional background<br />
Education<br />
Activities in governing and supervisory bodies<br />
Heinrich C. Spoerry (51), Swiss citizen<br />
since 1999 CEO SFS Group, Heerbrugg<br />
1986–1998 Elektrowatt/Siemens Building Technologies, Zurich<br />
1981–1986 SFS Group, Heerbrugg<br />
1979–1981 BCG, Munich<br />
Lic. oec. HSG, S.M. MIT<br />
Board member, SFS Holding AG, Heerbrugg<br />
Board member, Mikron Holding AG, Biel<br />
Name, nationality<br />
Professional background<br />
Education<br />
Activities in governing and supervisory bodies<br />
Michael Funk (61), Swiss citizen<br />
since 1991 independent entrepreneur and director<br />
1969–1990 Oerlikon-Bührle Group, Zurich<br />
Dipl. El. Ing., ETH Zurich<br />
VCBD, Feintool International Holding, Lyss<br />
54
Name, nationality<br />
Professional background<br />
Education<br />
Activities in governing and supervisory bodies<br />
Dr. René Furler (53), Swiss citizen<br />
since 2001 Managing Director of HG Commerciale, Zurich<br />
1999–2001 ZZ Wancor AG, Regensdorf<br />
1994–1999 Zürcher Ziegeleien AG (now Conzzeta), Zurich<br />
1985–1994 Hard AG, Volketswil<br />
1980–1984 Zürcher Ziegeleien AG (now Conzzeta), Zurich<br />
Dipl. Ing., ETH Zurich<br />
Lic. oec. publ., University of Zurich<br />
Dr. sc. techn., ETH Zurich<br />
Various directorships of participating interests of HG Commerciale, Zurich<br />
Board member, Alcover AG, Zug<br />
Name, nationality<br />
Professional background<br />
Education<br />
Activities in governing and supervisory bodies<br />
Public and political functions<br />
Dr. Peter R. Isler (56), Swiss citizen<br />
since 1981 partner with Niederer Kraft & Frey, Zurich<br />
1977–1981 Niederer Kraft & Frey, Zurich<br />
1974–1977 Advokaturbüro Homburger, Zurich<br />
Dr. iur., attorney, University of Zurich<br />
Master of Laws, Harvard Law School, Cambridge (USA)<br />
Board member, Bank Leu AG, Zurich<br />
Board member, Schulthess Group AG, Bubikon<br />
Board member, Zellweger Luwa AG, Uster<br />
Lecturer at the University of Zurich for commercial and economic law<br />
Member of the lawyer examination commission of the canton of Zurich<br />
Name, nationality<br />
Professional background<br />
Education<br />
Dr. Reinhard von Meiss (62), Swiss citizen<br />
since 2003 independent consultant<br />
1979–<strong>2002</strong> SIG Holding AG, Neuhausen<br />
1975–1979 Industrieholding Cham AG, Cham<br />
Dr. iur., University of Zurich<br />
Name, nationality<br />
Professional background<br />
Education<br />
Public and political functions<br />
Rolf Schweiger (57), Swiss citizen<br />
since 1975 Senior Partner Schweiger Advokatur/Notariat, Zug<br />
Lic. iur., University of Zurich<br />
Attorney and notary public<br />
Government councillor<br />
Name, nationality<br />
Professional background<br />
Education<br />
Activities in governing and supervisory bodies<br />
Prof. Dr. Armin Seiler (63), Swiss citizen<br />
since 1983 Professor of business administration, ETH Zurich<br />
1978–1983 Cham Paper Group, Cham<br />
1975–1977 Koenig AG, Dietikon<br />
1969–1974 McKinsey & Co., Zurich and Chicago<br />
Dipl. Masch. Ing., ETH Zurich<br />
Dr. oec. publ., University of Zurich<br />
Board member, Tuxedo Invest AG, Zug<br />
Board member, Tecan Group AG, Männedorf<br />
55
Corporate Governance<br />
Due to their independence, the non-executive members of the<br />
Board of Directors assure effective corporate governance. None<br />
of the non-executive members of the Board belonged to the executive<br />
management of Industrieholding Cham AG in the past five<br />
years. None of the members of the non-executive Board has a<br />
mandate with other listed companies that maintain significant<br />
business relationships with Industrieholding Cham AG.<br />
Organisation and responsibilities<br />
of the non-executive Board of Directors<br />
The members of the non-executive Board are elected for threeyear<br />
terms. If replacement elections are necessary during a term,<br />
the newly elected person completes the term of office of the<br />
predecessor (Art. 17 of the articles of incorporation).<br />
The non-executive Board convenes as often as necessary but at<br />
least once quarterly. In <strong>2002</strong>, the non-executive Board of Industrieholding<br />
Cham AG convened six times, the non-executive<br />
Board of Papierfabriken Cham-Tenero AG five times, and the<br />
non-executive Board of Hammer Retex AG four times.<br />
The meetings of the non-executive Board of Industrieholding<br />
Cham AG are attended by the CEOs of the principal affiliated<br />
companies, and, depending on the agenda, by other executive<br />
members. The non-executive Board of Industrieholding Cham AG<br />
convenes privately on business issues that pertain exclusively to<br />
Industrieholding Cham AG. Requests for meetings of this kind<br />
must be submitted to the Chairman prior to the meeting.<br />
The non-executive Board is the body responsible for business<br />
policy and management. The key tasks are:<br />
• Definition of the organization and strategic direction<br />
of Industrieholding Cham AG and its subsidiaries,<br />
• Definition of reporting principles for Industrieholding Cham AG<br />
and its subsidiaries,<br />
• Approval of budgets for subsidiaries,<br />
• Monitoring of the course of business at subsidiaries,<br />
• Appointment of executives and signatories,<br />
• Approval of investments, divestitures, acquisitions,<br />
incorporations and financing of subsidiaries,<br />
• Proposals to the Annual General Meeting and presentation<br />
of the financial statements.<br />
The organization regulations list the competencies of the nonexecutive<br />
and executive Boards.<br />
The subsidiaries report the course of business to the non-executive<br />
Board of Directors on a monthly basis. Apart from budget<br />
comparisons, three extrapolations are performed. Additionally,<br />
the non-executive Board can request ad hoc analyses.<br />
So far, the holding company has waived the creation of special<br />
committees to prevent the dilution of the Board’s overall responsibility.<br />
An Audit Committee (Chairman: Dr. P. Isler, Members: H. Spoerry<br />
and Prof. Dr. A. Seiler) and a Compensation Committee<br />
(Chairman: R. Schweiger, Members: H. Spoerry and M. Funk)<br />
will be formed in 2003.<br />
56
4. Executive Board of Directors<br />
Industrieholding Cham AG does not have its own executive<br />
Board. For this reason, this section lists the executives of the<br />
subsidiaries (except Kardex AG).<br />
Cham Paper Group<br />
Name, nationality<br />
Professional background<br />
Education<br />
Activities in governing and supervisory bodies<br />
Beat U. Semadeni (60), Swiss citizen<br />
since 1.8.<strong>2002</strong> Non-executive Board member, Papierfabriken Cham-Tenero AG, Cham<br />
1990–31.7.<strong>2002</strong> CEO, Cham Paper Group, Cham<br />
1981–1989 Eduard Züblin & Cie AG, Zurich<br />
1973–1980 KIBAG AG, Zurich and Bäch<br />
Dipl. El. Ing., ETH Zurich<br />
MBA Columbia University, New York (USA)<br />
Board member, ZPK, Zurich<br />
Board member, CEPI, Brussels<br />
Name, nationality<br />
Professional background<br />
Education<br />
Axel W. Wappler (42), German citizen<br />
since 1.8.<strong>2002</strong> CEO Cham Paper Group, Cham<br />
2001–31.7.<strong>2002</strong> Cham Paper Group, Cham<br />
1999–2001 Swissmetal Group, Dornach<br />
1998–1999 KPCL-Deutschland, Selb<br />
1989–1997 Timcal AG, Sins and Cleveland (USA)<br />
1986–1989 Metro International AG, Baar<br />
Lic. oec. HSG<br />
Name, nationality<br />
Professional background<br />
Education<br />
Peter O. Knüsel (52), Swiss citizen<br />
since 1996 CFO Cham Paper Group, Cham<br />
1981–1996 Eurodis Group, Regensdorf<br />
1978–1981 Escor Group, Basel<br />
Grad. Controller<br />
Name, nationality<br />
Professional background<br />
Education<br />
Dr. Giuseppe Bardini (54), Italian citizen<br />
since 1997 General Manager of Cartiera di Carmignano S.p.A., Carmignano<br />
1986–1997 Saffa SpA-Sarrio SA., Milan<br />
1984–1986 M&A Bonomi Group, Milan<br />
1977–1983 McKinsey & Co., Cleveland (USA) and Milan<br />
1973–1976 GEA, Milan<br />
1977 MBA MIT Sloan School of Management, Cambridge (USA)<br />
1971 Dr. Engineering Politecnico di Milano<br />
57
Corporate Governance<br />
Name, nationality<br />
Professional background<br />
Education<br />
Dr. Hans-Ulrich Körner (48), German citizen<br />
since 1989 Vice-Director Research and Development, Cham Paper Group, Cham<br />
1986–1989 Ziegler Papier AG, Grellingen<br />
1985–1986 Betz GmbH, Düsseldorf<br />
Grad. forestry eng., University of Hamburg<br />
Dr. rer. nat., University of Hamburg<br />
Name, nationality<br />
Professional background<br />
Education<br />
Klaus Kranich (63), Swiss citizen<br />
since 2001 Director Special Tasks, Cham Paper Group, Cham<br />
1965–2001 Cham Paper Group, Cham<br />
Grad. eng. paper machinery, FH Munich<br />
Grad. eng. paper production, FH Munich<br />
Name, nationality<br />
Professional background<br />
Education<br />
Activities in governing and supervisory bodies<br />
Hans Peter Müller (58), Swiss citizen<br />
since <strong>2002</strong> Managing Director Hunsfos<br />
since 1999 Director Production and Engineering, Cham Paper Group, Cham<br />
1983–1999 Papierfabriken Cham-Tenero AG, Cham<br />
Grad. eng., FH Munich<br />
Board member, SUVA, Lucerne<br />
ASPI, Zurich (until mid-<strong>2002</strong>)<br />
Hammer Retex AG<br />
Name, nationality<br />
Professional background<br />
Education<br />
Public and political functions<br />
Claude Ebnöther (53), Swiss citizen<br />
since 1980 CEO Hammer Retex Group, Cham<br />
1974–1980 Ortobau GU, Zurich<br />
Real estate fiduciary<br />
Member of the Security Commission of the community of Kilchberg/Rüschlikon<br />
Name, nationality<br />
Professional background<br />
Education<br />
Bruno Kryenbühl (50), Swiss citizen<br />
since 1992 member of the executive Board of Hammer Retex AG, Cham<br />
1975–1992 Retex AG, Zug<br />
1973–1975 Fitrag AG, Zug<br />
Grad. real estate fiduciary<br />
Industrieholding Cham AG<br />
Name, nationality<br />
Professional background<br />
Education<br />
Ageeth Walti-Slob (35), Swiss citizen<br />
since <strong>2002</strong> Head of Corporate Services and<br />
secretary to the non-executive Board of Directors of Industrieholding Cham AG, Cham<br />
2000–<strong>2002</strong> PricewaterhouseCoopers, Zurich<br />
1991–2000 Unilever (Schweiz) AG, Zug<br />
Lic. rer. publ. HSG<br />
58
Responsibilities of the executive Boards<br />
The non-executive Board of Directors of Industrieholding Cham<br />
AG has delegated operations management duties to the affiliated<br />
companies.<br />
The principal responsibilities of the executive Boards are:<br />
• Ongoing implementation of the business strategy<br />
defined by the non-executive Board,<br />
• Representation of Industrieholding Cham AG<br />
and its constituents,<br />
• Implementation of changes within the organization<br />
to optimize consolidated results,<br />
• Promotion of internal and external communication policy.<br />
There is no participation programme within the scope of which<br />
shares are allotted to members of the non-executive and executive<br />
Boards of Directors.<br />
At 31 December <strong>2002</strong>, the members of the non-executive Board<br />
held a total of 5575 shares and the members of the executive<br />
Boards a total of 1118 shares of Industrieholding Cham AG.<br />
In financial year <strong>2002</strong>, no additional honorariums and remunerations<br />
attaining or exceeding half of the ordinary remuneration of<br />
the respective governing body were paid to members of the nonexecutive<br />
and executive Boards.<br />
No loans were granted to governing bodies in financial year <strong>2002</strong>.<br />
5. Compensations, shareholdings, and loans<br />
Members of the non-executive Board of Industrieholding<br />
Cham AG and its subsidiaries are remunerated with net salaries<br />
(excluding employers’ and employees’ contributions) and with<br />
lump-sum expense accounts. The remuneration amount depends<br />
on the complexity of the affiliated company. Total remuneration<br />
amounts are listed for persons who are members of the non-executive<br />
Board of Industrieholding Cham AG and also of the nonexecutive<br />
Board of a subsidiary (except Kardex AG).<br />
The sum of all remunerations of the seven members of the nonexecutive<br />
Board of Industrieholding Cham AG was CHF 475 000<br />
for financial year <strong>2002</strong>.<br />
The maximum remuneration paid to a member of the nonexecutive<br />
Board of Industrieholding Cham AG in financial <strong>2002</strong><br />
was CHF 120 000 (net salary).<br />
The sum of all remunerations of the members of the executive<br />
Boards consist of gross salaries (excluding employers’ contributions,<br />
including employees’ contributions), lump-sum expense<br />
accounts, contributions in kind (company vehicles), and expenditures<br />
for executive insurance.<br />
The ten members of the executive Boards received a total of CHF<br />
2 763 498 in financial year <strong>2002</strong>.<br />
No severance payments were made in financial year <strong>2002</strong>,<br />
neither to persons who withdrew during the year under review<br />
nor to persons who withdrew in prior periods.<br />
6. Shareholders’ participation rights<br />
Shareholders with voting rights are entered in the share register<br />
only if approved by the non-executive Board of Directors.<br />
The non-executive Board of Directors may refuse approval only<br />
(Art. 7 of the articles of incorporation):<br />
• if the purchaser is not purchasing the shares in his/her own<br />
name or for his/her own account,<br />
• if the purchaser is neither a Swiss citizen nor the holder of a<br />
type C residence permit,<br />
• if the purchaser would directly or indirectly own more than 3%<br />
of the share capital entered in the commercial register.<br />
In special cases, with a majority of two-thirds of its members, the<br />
non-executive Board of Directors may approve exceptions to<br />
these rules.<br />
No exceptions were approved in financial year <strong>2002</strong>.<br />
If the registration of a shareholder with voting rights is refused,<br />
the purchaser is registered as a shareholder without voting rights.<br />
Every person registered in the share register as a shareholder<br />
with voting rights is eligible to attend the Annual General Meeting.<br />
With a written power of attorney, the voting right can be assigned<br />
to other persons registered as shareholders with voting rights.<br />
However, a shareholder – directly or indirectly, and for own and<br />
represented shares together – may exercise a voting right equivalent<br />
to no more than 5% of all votes (Art. 13, para. 3 of the<br />
articles of incorporation). With a two-thirds majority, the nonexecutive<br />
Board may approve exceptions to this limitation of voting<br />
rights.<br />
59
Corporate Governance<br />
No exceptions of this kind were approved in financial year <strong>2002</strong>.<br />
The recognition of proxies is determined by the attending members<br />
of the non-executive Board.<br />
At least two-thirds of all represented votes are required for resolutions<br />
pursuant to Art. 704 of the Swiss Code of Obligations.<br />
A resolution passed by the Annual General Meeting with at least<br />
two-thirds of all represented votes and at least half of the votes<br />
of all outstanding shares is required for:<br />
• the conversion of registered shares into bearer shares,<br />
• the annulment of Art. 7 of the articles of incorporation as well<br />
as the abolishment or alleviation of the limitations it contains<br />
regarding registration of registered shares with voting rights in<br />
the share register,<br />
• the annulment of Art. 13 para. 3 of the articles of incorporation<br />
as well as the abolishment or alleviation of the voting rights<br />
limitations it contains,<br />
• the annulment of Art. 17 of the articles of incorporation<br />
(eligibility for election, duration of the term of office of members<br />
of the non-executive Board) as well as the abolishment or<br />
alleviation limitations it contains and the voting down of more<br />
than one-fourth of the members of the non-executive Board<br />
• the dissolution of the company,<br />
• the annulment of this statutory clause as well as the<br />
abolishment or alleviation of the quorum it specifies.<br />
The convocation of an Annual General Meeting is governed by<br />
Art. 699.3 of the Swiss Code of Obligations. Shareholders who<br />
represent shares with a par value of one million Swiss francs may<br />
request that an issue be placed on the agenda by submitting<br />
their motions in writing. Such a request must be submitted in<br />
writing to the non-executive Board at least sixty days prior to the<br />
Annual General Meeting.<br />
As a rule, shareholders may be entered into the share register<br />
until ten days prior to the Annual General Meeting.<br />
7. Changes of control<br />
and defensive measures<br />
There are no statutory clauses with respect to “opting out” and<br />
“opting up” (Art. 22 BEHG).<br />
8. Auditors<br />
Ernst & Young AG has been the auditing company since 1977.<br />
Thomas Huwyler has been serving Industrieholding Cham AG<br />
as Lead Auditor since financial year 2000. For financial year <strong>2002</strong><br />
(except for Kardex AG), E&Y invoiced Industrieholding Cham AG<br />
CHF 352 000 for its auditing activities and CHF 216 000 for consulting<br />
activities.<br />
The non-executive Board of Directors of Industrieholding Cham AG<br />
meets with the Lead Auditor twice a year to discuss the Auditors’<br />
Report, weaknesses, and optimization possibilities.<br />
9. Information policy<br />
Industrieholding Cham AG provides regular information on<br />
business developments and current events.<br />
The most important sources of information are the Annual General<br />
Meeting as well as media releases and letters to shareholders.<br />
General Meeting <strong>2002</strong>: 28 May 2003<br />
Annual report: 30 April 2003<br />
Letters to shareholders: 28 March 2003, 18 August 2003<br />
Media releases: 28 March 2003, 30 April 2003,<br />
18 August 2003, 6 November 2003<br />
Further details on the company and its subsidiaries<br />
are provided on: www.iccham.com<br />
E-mail: info@iccham.com<br />
<strong>Investor</strong> <strong>Relations</strong>:<br />
Mrs Ageeth Walti-Slob<br />
Tel. +41 41 785 18 80<br />
Fax +41 41 785 18 87<br />
60
Addresses<br />
Industrieholding Cham<br />
Industrieholding Cham AG<br />
HAMMERTOR, Sinserstrasse 67, CH-6330 Cham<br />
Tel. +41 41 785 18 88, Fax +41 41 785 18 87<br />
Internet: www.iccham.com<br />
E-mail: info@iccham.com<br />
Ageeth Walti-Slob<br />
Cham Paper Group<br />
Papierfabriken Cham-Tenero AG<br />
Fabrikstrasse, CH-6330 Cham<br />
Tel. +41 41 785 33 33, Fax +41 41 785 31 50<br />
Internet: www.champaper.ch<br />
E-mail: mail.cham@cham-group.com<br />
Axel W. Wappler<br />
Hammer Retex Group<br />
Hammer Retex AG<br />
HAMMERTOR, Sinserstrasse 67, CH-6330 Cham<br />
Tel. +41 41 785 18 51, Fax +41 41 780 90 81<br />
Internet: www.hammerretex.ch<br />
E-mail: info@hammerretex.ch<br />
Claude Ebnöther<br />
Kardex Remstar Group<br />
Kardex AG (Holding)<br />
Bellerivestrasse 3, CH-8008 Zurich<br />
Tel. +41 1 386 44 10, Fax +41 1 386 44 18<br />
Internet: www.kri-group.com<br />
E-mail: info@kri-group.com<br />
Richard Flury<br />
Printed in Switzerland<br />
61
The Group publishes Annual Reports in English and German.<br />
The German version is legally binding.<br />
Editor<br />
Industrieholding Cham AG, Cham<br />
Concept & Design<br />
DDB Corporate, Zollikerberg-Zurich<br />
Proofreader<br />
text control ag, Zurich<br />
Photos<br />
Christian Höfliger, Jona<br />
Printing<br />
printlink AG, Wetzikon<br />
62
Industrieholding Cham AG<br />
HAMMERTOR<br />
Sinserstrasse 67<br />
CH-6330 Cham<br />
Tel. +41 41 785 18 88<br />
Fax +41 41 785 18 87<br />
Internet: www.iccham.com<br />
E-mail: info@iccham.com