GCSE Mathematics Unit 1 Higher - Specimen Question Paper
GCSE Mathematics Unit 1 Higher - Specimen Question Paper
GCSE Mathematics Unit 1 Higher - Specimen Question Paper

You also want an ePaper? Increase the reach of your titles
YUMPU automatically turns print PDFs into web optimized ePapers that Google loves.
klm<br />
<strong>GCSE</strong><br />
Draft <strong>Specimen</strong> <strong>Question</strong> <strong>Paper</strong>s<br />
<strong>Mathematics</strong><br />
For first teaching September 2010<br />
This is a draft specification and not for teaching.<br />
The final specification, for teaching, will be available in<br />
January 2010<br />
Version 0.1 Date: 0709
Centre Number<br />
Surname<br />
Other Names<br />
Candidate Number<br />
For Examiner’s Use<br />
Examiner’s Initials<br />
Candidate Signature<br />
General Certificate of Secondary Education<br />
<strong>Higher</strong> Tier<br />
Pages<br />
2 – 3<br />
4 – 5<br />
Mark<br />
<strong>Mathematics</strong><br />
<strong>Unit</strong> 1<br />
<strong>Higher</strong> Tier<br />
<strong>Specimen</strong> <strong>Paper</strong> 2012 Specification<br />
For this paper you must have:<br />
• a calculator<br />
• mathematical instruments.<br />
Time allowed<br />
• 1 hour<br />
<strong>Unit</strong> 1H<br />
Instructions<br />
• Use black ink or black ball-point pen. Draw diagrams in pencil.<br />
• Fill in the boxes at the top of this page.<br />
• Answer all questions.<br />
• You must answer the questions in the space provided. Do not write outside the<br />
box around each page or on blank pages.<br />
• Do all rough work in this book. Cross through any work that you do not want to<br />
be marked.<br />
Information<br />
• The marks for questions are shown in brackets.<br />
• The maximum mark for this paper is 54.<br />
• You may ask for more answer paper, graph paper and tracing paper.<br />
These must be tagged securely to this answer booklet.<br />
• You are expected to use a calculator where appropriate.<br />
Advice<br />
• In all calculations, show clearly how you work out your answer.<br />
H<br />
Not for teaching<br />
6 – 7<br />
8 – 9<br />
10 – 11<br />
12 – 13<br />
14 – 15<br />
TOTAL<br />
SP12/<strong>Unit</strong> 1H<br />
SP12/<strong>Unit</strong> 1H
2<br />
Do not write<br />
outside the<br />
box<br />
Answer all questions in the spaces provided.<br />
1 Clive works for the local council.<br />
One of his jobs is to check that taxi companies charge reasonable fares.<br />
Each week he checks 10 taxi journeys with local companies.<br />
He records the fare and the distance of each journey.<br />
1 (a) Clive expects there to be strong positive correlation between the length of the<br />
journey and the fare charged.<br />
Explain why he might expect this.<br />
..................................…………...….…….....…………………………………………….…..<br />
..................................…………...….…….....…………………………………………….…..<br />
(1 mark)<br />
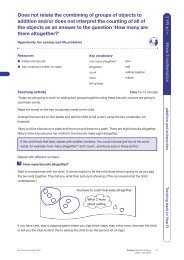
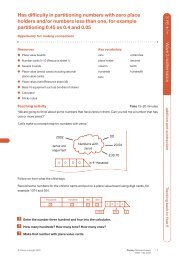
1 (b) The scatter diagram shows the results for a week in January 2009.<br />
Taxi fare<br />
(£)<br />
20<br />
16<br />
12<br />
8<br />
Not for teaching<br />
4<br />
0<br />
0 1 2 3 4 5 6 7 8 9 10<br />
Length of journey (miles)<br />
Does the data support Clive’s view about the expected correlation between the<br />
length of journey and the fare<br />
Give a reason for your answer.<br />
..................................…………...….…….....…………………………………………….…..<br />
.....................................…………...….…….....…………………………………… (1 mark)<br />
SP12/<strong>Unit</strong> 1H
3<br />
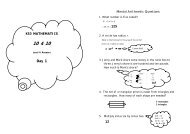
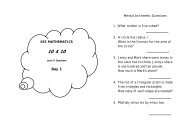
2 10 boys and 10 girls are each given 20 mental arithmetic questions.<br />
Here are the number of correct answers for each boy.<br />
Do not write<br />
outside the<br />
box<br />
12 18 12 19 9 20 11 9 18 12<br />
The range of the girls’ scores is 12<br />
The mean of the girls’ scores is 14.5<br />
Use the data to investigate the hypothesis<br />
‘Boys are better at mental arithmetic than girls’<br />
..................................…………...….…….....…………………………………………….…..<br />
..................................…………...….…….....…………………………………………….…..<br />
..................................…………...….…….....…………………………………………….…..<br />
..................................…………...….…….....…………………………………………….…..<br />
..................................…………...….…….....…………………………………………….…..<br />
..................................…………...….…….....…………………………………………….…..<br />
..................................…………...….…….....…………………………………………….…..<br />
..................................…………...….…….....…………………………………………….…..<br />
..................................…………...….…….....…………………………………………….…..<br />
..................................…………...….…….....…………………………………………….…..<br />
..................................…………...….…….....…………………………………………….…..<br />
..................................…………...….…….....…………………………………………….…..<br />
(5 marks)<br />
Not for teaching<br />
7<br />
Turn over <br />
SP12/<strong>Unit</strong> 1H
4<br />
Do not write<br />
outside the<br />
box<br />
3 A doctor wants to encourage her patients to take more exercise.<br />
The doctor has approximately 500 patients.<br />
She decides to do a survey about what exercise her patients take.<br />
3 (a) The doctor decides to use one of three methods to do the survey.<br />
Method 1<br />
Method 2<br />
Method 3<br />
Give the survey to the first 50 patients seen in a week<br />
Choose 50 patients at random<br />
Choose 26 patients, picking one whose surname begins with<br />
each letter of the alphabet<br />
Give a reason why method 3 is not suitable.<br />
..................................…………...….…….....…………………………………………….…..<br />
..................................…………...….…….....…………………………………………….…..<br />
..................................…………...….…….....…………………………………………….…..<br />
(1 mark)<br />
3 (b) Which of the other two methods for doing the survey will give the most reliable results<br />
Give a reason for your choice.<br />
..................................…………...….…….....…………………………………………….…..<br />
..................................…………...….…….....…………………………………………….…..<br />
..................................…………...….…….....…………………………………………….…..<br />
(1 mark)<br />
Not for teaching<br />
SP12/<strong>Unit</strong> 1H
y<br />
4 Ronan is designing a game.<br />
He has two sets of discs laid face down on a table.<br />
The first set of five discs are labelled 1, 3, 5, 7, 9<br />
The second set of four discs are labelled 2, 4, 6, 8<br />
5<br />
Players turn over one disc, at random, from each set and add the numbers together.<br />
Ronan uses the game to raise money for charity.<br />
Each player pays 20 p to play the game.<br />
If a player gets a total of exactly 13 they win a bar of chocolate.<br />
It costs Ronan 50 p for each bar of chocolate.<br />
If 100 people play the game, show that Ronan should expect to raise £ 12.50 for charity.<br />
You may find the grid below useful.<br />
2 3<br />
4<br />
6<br />
8<br />
1 3 5 7 9<br />
..................................…………...….…….....…………………………………………….…..<br />
..................................…………...….…….....…………………………………………….…..<br />
..................................…………...….…….....…………………………………………….…..<br />
..................................…………...….…….....…………………………………………….…..<br />
..................................…………...….…….....…………………………………………….…..<br />
Not for teaching<br />
..................................…………...….…….....…………………………………………….…..<br />
..................................…………...….…….....…………………………………………….…..<br />
(4 marks)<br />
Do not write<br />
outside the<br />
box<br />
Turn over <br />
6<br />
SP12/<strong>Unit</strong> 1H
6<br />
Do not write<br />
outside the<br />
box<br />
5 (a) The National Curriculum levels in <strong>Mathematics</strong> for 30 students in year 9 were recorded.<br />
Level<br />
Number of students<br />
3 0<br />
4 4<br />
5 4<br />
6 9<br />
7 8<br />
8 5<br />
Calculate the mean level.<br />
..................................…………...….…….....…………………………………………….…..<br />
..................................…………...….…….....…………………………………………….…..<br />
Answer ................................................................................ (3 marks)<br />
5 (b) The 30 students study both French and Spanish.<br />
Their National Curriculum levels in these subjects are shown in the table.<br />
Level in Spanish<br />
1 2 3 4 5 6 Total<br />
1 0 0 0 0 0 0 0<br />
2 1 0 0 0 0 0 1<br />
Level in French<br />
5 (b) (i) What is the median level for French<br />
Show clearly how you obtain your answer.<br />
3 2 1 1 0 0 0 4<br />
4 0 3 4 1 0 0 8<br />
5 0 1 2 3 2 0 8<br />
6 0 0 3 3 2 1 9<br />
Total 3 5 10 7 4 1 30<br />
Not for teaching<br />
..................................…………...….…….....…………………………………………….…..<br />
..................................…………...….…….....…………………………………………….…..<br />
..................................…………...….…….....…………………………………………….…..<br />
..................................…………...….…….....…………………………………………….…..<br />
Answer ................................................................................ (2 marks)<br />
SP12/<strong>Unit</strong> 1H
7<br />
Do not write<br />
outside the<br />
box<br />
5 (b) (ii) The teacher claims that the students are better at French than at Spanish.<br />
How can you tell from the table that this is true<br />
..................................…………...….…….....…………………………………………….…..<br />
..................................…………...….…….....…………………………………………….…..<br />
..................................…………...….…….....…………………………………………….…..<br />
(1 mark)<br />
6 x, y and z are standard form numbers.<br />
x = 2.5 × 10 5 y = 3.8 × 10 4 z = 1.9 × 10 6<br />
6 (a) Calculate x – y<br />
..................................…………...….…….....…………………………………………….…..<br />
..................................…………...….…….....…………………………………………….…..<br />
Answer ....................................................................... (1 mark)<br />
6 (b) Calculate x 2<br />
..................................…………...….…….....…………………………………………….…..<br />
..................................…………...….…….....…………………………………………….…..<br />
Answer ....................................................................... (1 mark)<br />
xy<br />
6 (c) Calculate<br />
z<br />
..................................…………...….…….....…………………………………………….…..<br />
..................................…………...….…….....…………………………………………….…..<br />
Not for teaching<br />
Answer ....................................................................... (1 mark)<br />
9<br />
Turn over <br />
SP12/<strong>Unit</strong> 1H
8<br />
Do not write<br />
outside the<br />
box<br />
7 Martha sees an advert for a summer holiday.<br />
Summer Sun<br />
Fantastic deals with Sunbreaks Holidays<br />
Dates 7 nights 14 nights<br />
1 April - 29 April £ 315 £ 575<br />
30 April - 6 July £ 220 £ 400<br />
o Prices are per person.<br />
Salima books a holiday through a travel agent.<br />
The travel agent adds a percentage surcharge to the cost of the holiday for booking fees.<br />
Salima’s final bill is £ 642.60<br />
What was the percentage surcharge<br />
..................................…………...….…….....…………………………………………….…..<br />
..................................…………...….…….....…………………………………………….…..<br />
..................................…………...….…….....…………………………………………….…..<br />
..................................…………...….…….....…………………………………………….…..<br />
..................................…………...….…….....…………………………………………….…..<br />
..................................…………...….…….....…………………………………………….…..<br />
Answer ............................................................................. % (3 marks)<br />
Not for teaching<br />
SP12/<strong>Unit</strong> 1H
9<br />
8 A bag contains 5 green and 3 red balls.<br />
A ball is taken from the bag at random and replaced.<br />
Another ball is then taken from the bag at random.<br />
Do not write<br />
outside the<br />
box<br />
8 (a) Complete the tree diagram.<br />
first ball<br />
5<br />
8<br />
green<br />
............ red<br />
8 (b) What is the probability that both balls are red<br />
second ball<br />
5<br />
8<br />
............<br />
green<br />
red<br />
............ green<br />
............<br />
red<br />
(1 mark)<br />
..................................…………...….…….....…………………………………………….…..<br />
..................................…………...….…….....…………………………………………….…..<br />
Answer ......................................................................... (2 marks)<br />
8 (c) Some more green balls are added to the 5 green and 3 red balls in the bag.<br />
A ball is taken from the bag at random and replaced.<br />
Another ball is then taken from the bag at random.<br />
Not for teaching<br />
The probability that both balls are red is now 25<br />
1 .<br />
How many green balls were added to the bag<br />
..................................…………...….…….....…………………………………………….…..<br />
..................................…………...….…….....…………………………………………….…..<br />
..................................…………...….…….....…………………………………………….…..<br />
..................................…………...….…….....…………………………………………….…..<br />
Answer ......................................................................... (3 marks)<br />
Turn over <br />
9<br />
SP12/<strong>Unit</strong> 1H
10<br />
9 The cumulative frequency diagram shows the waiting times for 120 patients needing<br />
an operation at a hospital.<br />
Cumulative<br />
frequency<br />
120<br />
110<br />
100<br />
90<br />
80<br />
70<br />
60<br />
50<br />
40<br />
30<br />
20<br />
10<br />
9 (a) The hospital claims that 75% of patients wait less than 40 days for the operation.<br />
Comment on this claim.<br />
0<br />
0 1 2 3 4 5 6 7 8<br />
Waiting time (weeks)<br />
Not for teaching<br />
..................................…………...….…….....…………………………………………….…..<br />
..................................…………...….…….....…………………………………………….…..<br />
..................................…………...….…….....…………………………………………….…..<br />
..................................…………...….…….....…………………………………………….…..<br />
(3 marks)<br />
SP12/<strong>Unit</strong> 1H
9 (b) The least waiting time was 1 week.<br />
The range of waiting times was 7 weeks.<br />
11<br />
Do not write<br />
outside the<br />
box<br />
Use this information and the cumulative frequency diagram to draw a box plot for<br />
the waiting times<br />
0 1 2 3 4 5 6 7 8<br />
9 (c) At a different hospital 746 patients had the same operation.<br />
This table shows the age and gender of the patients.<br />
Age<br />
Under 18 18 – 65 Over 65<br />
Male 84 342 50<br />
Female 39 194 37<br />
(3 marks)<br />
The hospital wants to take a stratified sample of 80 patients.<br />
Complete the table below to show how many people from each group should be sampled.<br />
Male<br />
Female<br />
Age<br />
Under 18 18 – 65 Over 65<br />
Not for teaching<br />
(3 marks)<br />
Turn over <br />
9<br />
SP12/<strong>Unit</strong> 1H
10 The table shows the weight of the first 100 parcels posted over the counter at<br />
a Post Office.<br />
12<br />
Do not write<br />
outside the<br />
box<br />
Weight, w (grams)<br />
Frequency<br />
0 < w ≤ 500 34<br />
500 < w ≤ 1000 28<br />
1000 < w ≤ 2000 22<br />
2000 < w ≤ 4000 16<br />
10 (a) Draw a fully labelled histogram to show the weights of the 100 parcels.<br />
Not for teaching<br />
(3 marks)<br />
SP12/<strong>Unit</strong> 1H
10 (b) Estimate the probability that the first two parcels posted that week were both<br />
over 500 grams in weight.<br />
13<br />
Do not write<br />
outside the<br />
box<br />
.................................…………...….…….....…………………………………………….…..<br />
.................................…………...….…….....…………………………………………….…..<br />
.................................…………...….…….....…………………………………………….…..<br />
.................................…………...….…….....…………………………………………….…..<br />
.................................…………...….…….....…………………………………………….…..<br />
.................................…………...….…….....…………………………………………….…..<br />
.................................…………...….…….....…………………………………………….…..<br />
.................................…………...….…….....…………………………………………….…..<br />
.................................…………...….…….....…………………………………………….…..<br />
.................................…………...….…….....…………………………………………….…..<br />
Answer ....................................................................... (3 marks)<br />
Turn over for the next question<br />
Not for teaching<br />
6<br />
Turn over <br />
SP12/<strong>Unit</strong> 1H
14<br />
Do not write<br />
outside the<br />
box<br />
11 The radius of the Earth and the radius of Jupiter are in the approximate ratio 1 : 11<br />
The mass of the Earth and the mass of Jupiter are in the approximate ratio 1 : 320<br />
You will need the following information.<br />
• The Earth and Jupiter are spherical<br />
4<br />
• The volume of a sphere of radius r is 3 πr<br />
3<br />
11 (a) Show that the approximate ratio of the volume of the Earth to the volume of Jupiter<br />
is 1 : 1331<br />
..................................…………...….…….....…………………………………………….…..<br />
..................................…………...….…….....…………………………………………….…..<br />
(1 mark)<br />
mass<br />
11 (b) You are given density = volume<br />
Work out the approximate ratio of the average density of the Earth to the average<br />
density of Jupiter in the form 1 : n<br />
..................................…………...….…….....…………………………………………….…..<br />
..................................…………...….…….....…………………………………………….…..<br />
..................................…………...….…….....…………………………………………….…..<br />
..................................…………...….…….....…………………………………………….…..<br />
..................................…………...….…….....…………………………………………….…..<br />
..................................…………...….…….....…………………………………………….…..<br />
..................................…………...….…….....…………………………………………….…..<br />
..................................…………...….…….....…………………………………………….…..<br />
Answer ....................................................................... 1 :<br />
(2 marks)<br />
Not for teaching<br />
SP12/<strong>Unit</strong> 1H
15<br />
Do not write<br />
outside the<br />
box<br />
12 A coffee machine dispenses 130 millilitres<br />
of black coffee into cups with a capacity<br />
of 175 millilitres.<br />
These values are accurate to 3 significant figures.<br />
Milk is supplied in small cartons which<br />
contain 21 millilitres, accurate to the<br />
nearest millilitre.<br />
Beryl likes milky coffee and always puts<br />
2 cartons of milk in her coffee.<br />
Will Beryl’s cup ever overflow<br />
You must show your working.<br />
..................................…………...….…….....…………………………………………….…..<br />
..................................…………...….…….....…………………………………………….…..<br />
..................................…………...….…….....…………………………………………….…..<br />
..................................…………...….…….....…………………………………………….…..<br />
..................................…………...….…….....…………………………………………….…..<br />
..................................…………...….…….....…………………………………………….…..<br />
..................................…………...….…….....…………………………………………….…..<br />
..................................…………...….…….....…………………………………………….…..<br />
..................................…………...….…….....…………………………………………….…..<br />
..................................…………...….…….....…………………………………………….…..<br />
..................................…………...….…….....…………………………………………….…..<br />
..................................…………...….…….....…………………………………………….…..<br />
(5 marks)<br />
Not for teaching<br />
END OF QUESTIONS<br />
8<br />
SP12/<strong>Unit</strong> 1H
16<br />
There are no questions printed on this page<br />
DO NOT WRITE ON THIS PAGE<br />
ANSWER IN THE SPACES PROVIDED<br />
Not for teaching<br />
Copyright © 2009 AQA and its licensors. All rights reserved.<br />
SP12/<strong>Unit</strong> 1H