Statistical Analysis of Structural Plate Mechanical Properties (Part 1)
Statistical Analysis of Structural Plate Mechanical Properties (Part 1)
Statistical Analysis of Structural Plate Mechanical Properties (Part 1)

You also want an ePaper? Increase the reach of your titles
YUMPU automatically turns print PDFs into web optimized ePapers that Google loves.
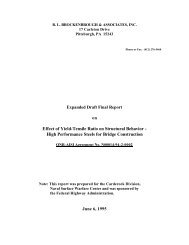
CE vs. Tensile Strength<br />
95<br />
90<br />
85<br />
A572: y = 85.719x + 47.422<br />
Correlation Coefficient = 0.454<br />
No. <strong>of</strong> Data = 35<br />
Fu (ksi)<br />
80<br />
75<br />
70<br />
65<br />
60<br />
A588: y = 106.96x + 32.774<br />
Correlation Coefficient = 0.564<br />
No. <strong>of</strong> Data = 38<br />
A572<br />
A588<br />
0.300 0.350 0.400 0.450 0.500 0.550<br />
CE (%)<br />
Figure 3.2: CE versus Tensile Strength for the 4-Mill Group.<br />
CE vs. Yield to Tensile Ratio<br />
0.85<br />
0.8<br />
A572: y = -0.2522x + 0.8097<br />
Correlation Coefficient = -0.219<br />
No. <strong>of</strong> Data = 35<br />
0.75<br />
Fy/Fu<br />
0.7<br />
0.65<br />
0.6<br />
0.55<br />
0.5<br />
A588: y = -0.7148x + 1.0332<br />
Coefficient <strong>of</strong> Correlation = -0.496<br />
No. <strong>of</strong> Data = 38<br />
0.300 0.350 0.400 0.450 0.500 0.550<br />
CE (%)<br />
A572<br />
A588<br />
Figure 3.3: CE versus Yield to Tensile Ratio for the 4-Mill Group.<br />
20