Statistical Analysis of Structural Plate Mechanical Properties (Part 1)
Statistical Analysis of Structural Plate Mechanical Properties (Part 1)
Statistical Analysis of Structural Plate Mechanical Properties (Part 1)

You also want an ePaper? Increase the reach of your titles
YUMPU automatically turns print PDFs into web optimized ePapers that Google loves.
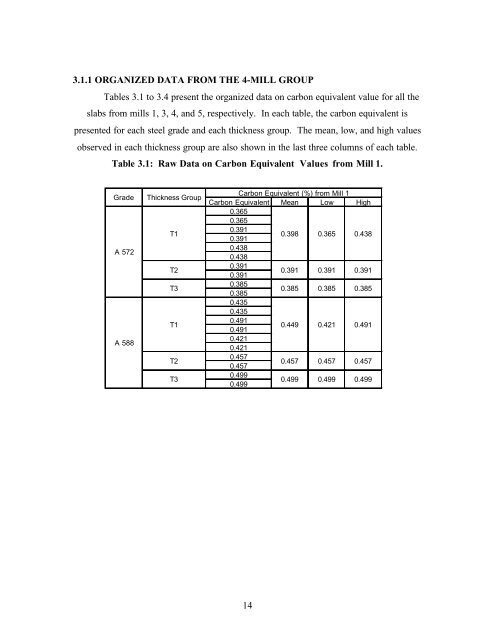
3.1.1 ORGANIZED DATA FROM THE 4-MILL GROUP<br />
Tables 3.1 to 3.4 present the organized data on carbon equivalent value for all the<br />
slabs from mills 1, 3, 4, and 5, respectively. In each table, the carbon equivalent is<br />
presented for each steel grade and each thickness group. The mean, low, and high values<br />
observed in each thickness group are also shown in the last three columns <strong>of</strong> each table.<br />
Table 3.1: Raw Data on Carbon Equivalent Values from Mill 1.<br />
Grade<br />
A 572<br />
A 588<br />
Thickness Group<br />
T1<br />
T2<br />
T3<br />
T1<br />
T2<br />
T3<br />
Carbon Equivalent (%) from Mill 1<br />
Carbon Equivalent Mean Low High<br />
0.365<br />
0.365<br />
0.391<br />
0.391<br />
0.438<br />
0.438<br />
0.391<br />
0.391<br />
0.385<br />
0.385<br />
0.435<br />
0.435<br />
0.491<br />
0.491<br />
0.421<br />
0.421<br />
0.457<br />
0.457<br />
0.499<br />
0.499<br />
0.398<br />
0.391<br />
0.385<br />
0.449<br />
0.457<br />
0.499<br />
0.365<br />
0.391<br />
0.385<br />
0.421<br />
0.457<br />
0.499<br />
0.438<br />
0.391<br />
0.385<br />
0.491<br />
0.457<br />
0.499<br />
14