Environmental Life Cycle Assessment of Southern Yellow Pine ...
Environmental Life Cycle Assessment of Southern Yellow Pine ...
Environmental Life Cycle Assessment of Southern Yellow Pine ...

Create successful ePaper yourself
Turn your PDF publications into a flip-book with our unique Google optimized e-Paper software.
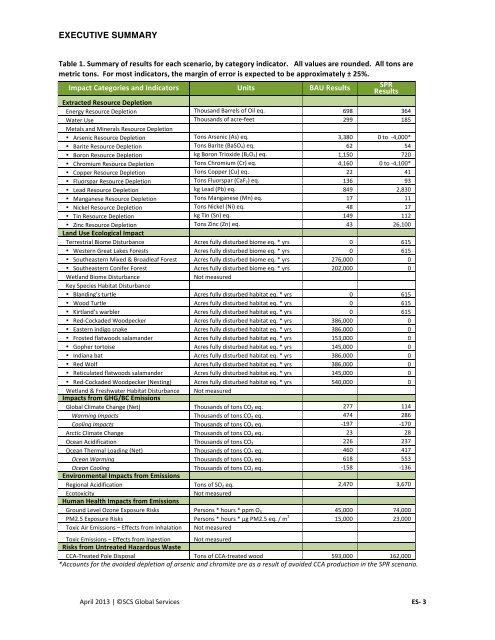
EXECUTIVE SUMMARY<br />
Table 1. Summary <strong>of</strong> results for each scenario, by category indicator. All values are rounded. All tons are <br />
metric tons. For most indicators, the margin <strong>of</strong> error is expected to be approximately ± 25%. <br />
Impact Categories and Indicators Units BAU Results <br />
SPR <br />
Results <br />
Extracted Resource Depletion <br />
Energy Resource Depletion Thousand Barrels <strong>of</strong> Oil eq. 698 364 <br />
Water Use Thousands <strong>of</strong> acre-‐feet 299 185 <br />
Metals and Minerals Resource Depletion <br />
• Arsenic Resource Depletion Tons Arsenic (As) eq. 3,380 0 to -‐4,000* <br />
• Barite Resource Depletion Tons Barite (BaSO 4) eq. 62 54 <br />
• Boron Resource Depletion kg Boron Trioxide (B 2O 3) eq. 1,150 720 <br />
• Chromium Resource Depletion Tons Chromium (Cr) eq. 4,160 0 to -‐4,100* <br />
• Copper Resource Depletion Tons Copper (Cu) eq. 22 41 <br />
• Fluorspar Resource Depletion Tons Fluorspar (CaF 2) eq. 136 93 <br />
• Lead Resource Depletion kg Lead (Pb) eq. 849 2,830 <br />
• Manganese Resource Depletion Tons Manganese (Mn) eq. 17 11 <br />
• Nickel Resource Depletion Tons Nickel (Ni) eq. 48 17 <br />
• Tin Resource Depletion kg Tin (Sn) eq. 149 112 <br />
• Zinc Resource Depletion Tons Zinc (Zn) eq. 43 26,100 <br />
Land Use Ecological Impact <br />
Terrestrial Biome Disturbance Acres fully disturbed biome eq. * yrs 0 615 <br />
• Western Great Lakes Forests Acres fully disturbed biome eq. * yrs 0 615 <br />
• Southeastern Mixed & Broadleaf Forest Acres fully disturbed biome eq. * yrs 276,000 0 <br />
• Southeastern Conifer Forest Acres fully disturbed biome eq. * yrs 202,000 0 <br />
Wetland Biome Disturbance <br />
Not measured <br />
Key Species Habitat Disturbance <br />
• Blanding’s turtle Acres fully disturbed habitat eq. * yrs 0 615 <br />
• Wood Turtle Acres fully disturbed habitat eq. * yrs 0 615 <br />
• Kirtland’s warbler Acres fully disturbed habitat eq. * yrs 0 615 <br />
• Red-‐Cockaded Woodpecker Acres fully disturbed habitat eq. * yrs 386,000 0 <br />
• Eastern indigo snake Acres fully disturbed habitat eq. * yrs 386,000 0 <br />
• Frosted flatwoods salamander Acres fully disturbed habitat eq. * yrs 153,000 0 <br />
• Gopher tortoise Acres fully disturbed habitat eq. * yrs 145,000 0 <br />
• Indiana bat Acres fully disturbed habitat eq. * yrs 386,000 0 <br />
• Red Wolf Acres fully disturbed habitat eq. * yrs 386,000 0 <br />
• Reticulated flatwoods salamander Acres fully disturbed habitat eq. * yrs 145,000 0 <br />
• Red-‐Cockaded Woodpecker (Nesting) Acres fully disturbed habitat eq. * yrs 540,000 0 <br />
Wetland & Freshwater Habitat Disturbance Not measured <br />
Impacts from GHG/BC Emissions <br />
Global Climate Change (Net) Thousands <strong>of</strong> tons CO 2 eq. 277 114 <br />
Warming Impacts Thousands <strong>of</strong> tons CO 2 eq. 474 286 <br />
Cooling Impacts Thousands <strong>of</strong> tons CO 2 eq. -‐197 -‐170 <br />
Arctic Climate Change Thousands <strong>of</strong> tons CO 2 eq. 23 28 <br />
Ocean Acidification Thousands <strong>of</strong> tons CO 2 226 237 <br />
Ocean Thermal Loading (Net) Thousands <strong>of</strong> tons CO 2 eq. 460 417 <br />
Ocean Warming Thousands <strong>of</strong> tons CO 2 eq. 618 553 <br />
Ocean Cooling Thousands <strong>of</strong> tons CO 2 eq. -‐158 -‐136 <br />
<strong>Environmental</strong> Impacts from Emissions <br />
Regional Acidification Tons <strong>of</strong> SO 2 eq. 2,470 3,670 <br />
Ecotoxicity <br />
Not measured <br />
Human Health Impacts from Emissions <br />
Ground Level Ozone Exposure Risks Persons * hours * ppm O 3 45,000 74,000 <br />
PM2.5 Exposure Risks Persons * hours * µg PM2.5 eq. / m 3 15,000 23,000 <br />
Toxic Air Emissions – Effects from Inhalation Not measured <br />
Toxic Emissions – Effects from Ingestion Not measured <br />
Risks from Untreated Hazardous Waste <br />
CCA-‐Treated Pole Disposal Tons <strong>of</strong> CCA-‐treated wood 593,000 162,000 <br />
*Accounts for the avoided depletion <strong>of</strong> arsenic and chromite ore as a result <strong>of</strong> avoided CCA production in the SPR scenario. <br />
April 2013 | ©SCS Global Services <br />
ES-‐ 3