Midterm exam #1 - Answer Key - Washington State University
Midterm exam #1 - Answer Key - Washington State University
Midterm exam #1 - Answer Key - Washington State University

Create successful ePaper yourself
Turn your PDF publications into a flip-book with our unique Google optimized e-Paper software.
ECONS 101 – PRINCIPLES OF MICROECONOMICS, SECTION 01<br />
WASHINGTON STATE UNIVERSITY<br />
Spring Semester 2009, 02/24/2009<br />
<strong>Midterm</strong> 1, February 24, 2009.<br />
Time: From 9:10am to 10:25am.<br />
Name: ______________________________________________________<br />
Student ID: ______________________________<br />
EXAM TYPE 1 (white color pages)<br />
Instructions: This <strong>exam</strong> has two parts: 15 multiple choice questions and 4 problems. Record your<br />
answers for the multiple choice questions on the bubble sheet. Regarding the four problems, please show<br />
all your work. This will help you to obtain more points from partial credit.<br />
1
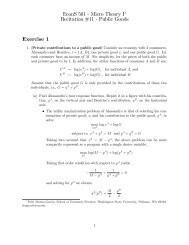
Exercise 1. [17 points]<br />
Farmers in Corntopia successfully lobby their government to enact a price floor for their agricultural<br />
commodity. The price floor is set at $10 above the equilibrium price. The initial demand and supply<br />
curves for agricultural production in Corntopia are as follows: P = 100 − Q and P = Q, where price is per<br />
bushel and quantity is measured in bushels.<br />
a. [1 points] Draw the demand and supply curve in this market. What is the equilibrium price and<br />
quantity without the price floor<br />
Math<br />
d<br />
demand: P = 100 −Q ⇒ Q = 100 − P (1)<br />
s<br />
supply: P= Q<br />
(2)<br />
d<br />
P Q d Q s<br />
0 100 0<br />
10 90 10<br />
20 80 20<br />
30 70 30<br />
40 60 40<br />
50 50 50<br />
60 40 60<br />
70 30 70<br />
80 20 80<br />
90 10 90<br />
100 0 100<br />
Graphically<br />
Equation 1 = Equation 2<br />
⇒100<br />
− Q=<br />
Q<br />
⇒ 2Q<br />
= 100<br />
* *<br />
*<br />
⇒ Q = 50<br />
( 2)<br />
and P = Q from<br />
= $50<br />
P 100<br />
P*=$50<br />
40<br />
0<br />
Q d Q*Q s<br />
=40 =50<br />
S<br />
Pf<br />
D<br />
100Q<br />
2
. [1 points] What is then the level of the price floor in this market, if the price floor is set at $10<br />
above the equilibrium price<br />
Pf<br />
= $10 + P<br />
*<br />
= $10 + $50<br />
= $60<br />
c. [4 points] How many units of the agricultural product will be demanded and supplied at this price<br />
floor level<br />
From (1):<br />
d<br />
Q<br />
= 100 −Pf<br />
= 100 −60<br />
= 40#<br />
From (2):<br />
s<br />
Q<br />
= Pf<br />
= 60#<br />
d. [2 points] Suppose the government purchases the surplus in this market once the price floor is<br />
implemented. What will be the cost to the government of buying this surplus<br />
@ Pf = $60 Surplus = Q −Q<br />
= 60 −40<br />
= 20<br />
∴ it costs 20× 60 = $1200<br />
s<br />
d<br />
e. [3 points] Given the price floor, what is the expenditure consumers make when purchasing this<br />
commodity Do not include in your calculation the cost to the government of buying the surplus.<br />
Consumer will pay:<br />
d<br />
Q × Pf = 40× 60 = $2,400<br />
f. [4 points] What is the deadweight loss associated with this price floor [Assume that the most<br />
efficient farmers are those who sell the good in the market].<br />
d<br />
@ Q = 40 ⇒ P=<br />
40 (from 2)<br />
∴ DWL=<br />
10×<br />
10<br />
=<br />
2<br />
= $50#<br />
( 60 − 40) × ( 50 −40)<br />
2<br />
3
g. [2 points] Could the deadweight loss be higher Why<br />
It could. If the consumers who buy the good are not those with the highest willingness to<br />
pay for the good.<br />
Exercise 2. [8 points]<br />
Suppose the market for demand for the market of milk is given by Q=100-2P and the supply is given by<br />
Q= 2<br />
P (quantity is given in thousand gallons of milk).<br />
a. [1 points] Find the equilibrium price of a gallon of milk and the equilibrium quantity.<br />
d<br />
demand: Q = 100 − 2P<br />
(1)<br />
s P<br />
supply: Q = (2)<br />
2<br />
@ equation 1 = equation 2<br />
P<br />
⇒100 − 2P<br />
=<br />
2<br />
P<br />
⇒ 2P<br />
+ = 100<br />
2<br />
2.5P<br />
= 100<br />
P<br />
*<br />
100<br />
= = $40 #<br />
2.5<br />
*<br />
* P 40<br />
∴ Q = = = 20 #<br />
2 2<br />
b. [1 point] Find the consumer surplus and producer surplus.<br />
CS =<br />
=<br />
( 50 − P* ) × ( 20 −0)<br />
( 50 − 40) × ( 20)<br />
2<br />
( 10×<br />
20)<br />
2<br />
= = $100<br />
2<br />
PS =<br />
( P* − 0) × ( 20−0)<br />
2<br />
( 40) × ( 20)<br />
=<br />
2<br />
= $400<br />
4
c. [2 points] How will the equilibrium change if the government imposes a price ceiling of 20, this<br />
is what is the new price and quantity of milk<br />
From (1):<br />
d<br />
Q<br />
= 100 −2Pc<br />
( )<br />
= 100 −2 20<br />
= 100 −40<br />
= 60<br />
From (2):<br />
s Pc<br />
Q =<br />
2<br />
20<br />
=<br />
2<br />
= 10#<br />
s<br />
@ Q = 10 ⇒ 10 = 100 −2P<br />
⇒ 2P<br />
= 100−10<br />
90<br />
⇒ P =<br />
2<br />
= 45<br />
d. [2 points] Find the loss in efficiency due to this price ceiling. [You can use Case 1 or Case 2. That<br />
is, you can assume that milk is bought by those consumers with the highest willingness to pay<br />
(case 1), or those with the lowest willingness to pay (case 2).]<br />
( ) ( )<br />
45 − 20 × 20 − 10 25×<br />
10<br />
DWL = = = $125<br />
2 2<br />
e. [2 points] Find the consumer surplus after the price ceiling. [Here too, you can use Case 1 or Case<br />
2. That is, you can assume that milk is bought by those consumers with the highest willingness to<br />
pay (case 1), or those with the lowest willingness to pay (case 2).]<br />
( )<br />
50 − 45 × 10<br />
CS = + ( 45 − 20)<br />
× 10 = 25 + 250 = $275<br />
2<br />
5
Exercise 3. [20 points]<br />
The government wishes to limit the quantity of alcoholic beverages sold and therefore is considering the<br />
imposition of an excise tax on the market for alcoholic drinks. Suppose the market for alcoholic drinks<br />
can be described by the following demand and supply equations:<br />
Demand: Q = 10,000 − 2,000P<br />
Supply: Q = 2,000P<br />
where P is the price of an alcoholic drink and Q is the quantity of alcoholic drinks sold and consumed<br />
during the time period. The proposed excise tax is $2 per alcoholic drink.<br />
a. [1 points] Draw a graph representing the initial market for alcoholic drinks. Label the equilibrium<br />
price P1, and the equilibrium quantity Q1.<br />
demand:<br />
Q<br />
*<br />
= 10000 − 2000P<br />
(1)<br />
s<br />
supply: Q = 2000P<br />
(2)<br />
P Q d Q s<br />
0 10000 0<br />
1 8000 2000<br />
2 6000 4000<br />
3 4000 6000<br />
4 2000 8000<br />
5 0 10000<br />
b. [1 points] Compute the numeric value of P1 and Q1 in this market.<br />
@ equation 1 = equation 2<br />
⇒10000 − 2000P=<br />
2000P<br />
⇒ 4000P<br />
= 10000<br />
10000<br />
⇒ P1<br />
= = $2.5#<br />
4000<br />
Q<br />
* *<br />
= 2000 P (from 2)<br />
= 2000×<br />
2.5<br />
= 5000 drinks #<br />
6
c. [2 points] What is the value of consumer and producer surplus (CS and PS) in this market prior to<br />
the imposition of the tax Shade in these two areas on your graph in part (a) and label these areas<br />
clearly. What is the value of total surplus before the tax<br />
( 5 − P ) × ( 5000 −0)<br />
1<br />
CS =<br />
2<br />
( 5 − 2.5)<br />
× 5000<br />
=<br />
2<br />
2.5×<br />
5000<br />
= = $6,250<br />
2<br />
( P − ) × ( − )<br />
1 0 5000 0<br />
PS =<br />
2<br />
2.5×<br />
5000<br />
=<br />
2<br />
= $6, 250<br />
Value of total surplus<br />
= CS + PS<br />
= 6250 + 6250<br />
= $12,500#<br />
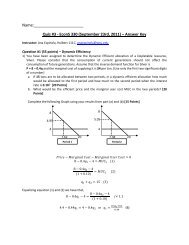
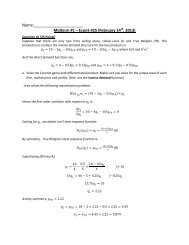
d. [4 points] Suppose the excise tax is implemented and producers are legally responsible for paying<br />
the tax. Draw a new graph (use next page) representing this market now that the excise tax has<br />
been implemented. Label the new equilibrium price with the tax (Pt), the new equilibrium<br />
quantity with the tax (Qt), and the net price received by producers after they pay the tax to the<br />
government (Pn).<br />
Price<br />
J<br />
St<br />
S<br />
CS t<br />
PTI<br />
CTI<br />
P 1<br />
4<br />
$3.5=P t<br />
3<br />
$1.50 =P N<br />
DWL<br />
2<br />
1<br />
PS t<br />
D<br />
0 2000 4000 6000 8000 10000<br />
Qt=3000<br />
Q1=5000<br />
Excise<br />
tax =$2<br />
Quantity of alcoholic drinks<br />
7
e. [4 points] Calculate the numeric values of Pt, Qt, and Pn that you marked on your graph in part<br />
(d).<br />
Consider the new supply curve<br />
1 s<br />
P= Q + a<br />
2000<br />
s<br />
@ P= 2⇒ Q = 0⇒ a=<br />
2<br />
1 s<br />
∴ P= Q + 2<br />
2000<br />
s<br />
( P )<br />
⇒ Q = 2000 −2<br />
s<br />
∴ Q = 2000P −4000 (2)′<br />
@ equation 1 = equation 2′<br />
⇒10000-2000P=2000P-4000<br />
⇒ 4000P=10000+4000<br />
14000<br />
⇒ P t = = $3.5<br />
4000<br />
∵Q = 2000P −4000 (from 2 ′)<br />
t<br />
( )<br />
= 2000 3.5 −4000<br />
= 7000 −4000<br />
= 3000 drinks<br />
P = P − excise tax<br />
N<br />
t<br />
= 3.5 −2<br />
= $1.5#<br />
t<br />
f. [4 points] On your graph from part (d), label the areas that correspond to consumer surplus with<br />
the tax (CSt), producer surplus with the tax (PSt), CTI, PTI, and DWL.<br />
( P − P ) × ( 5000 −3000)<br />
See graph.<br />
DWL =<br />
2<br />
( 3.5 − 1.5)<br />
× 2000<br />
=<br />
2<br />
2×<br />
2000<br />
= = $2000<br />
2<br />
t<br />
g. [4 points] Calculate the value of CSt, PSt, CTI, PTI, tax revenue, and DWL once the tax is<br />
implemented. Is the sum of (CSt) + (PSt) + (tax revenue) + DWL equal to the original value of<br />
total surplus before the tax was implemented<br />
N<br />
( P )<br />
5 − t × 3000<br />
CSt<br />
=<br />
2<br />
( 5 − 3.5)<br />
× 3000<br />
=<br />
2<br />
= $2,250<br />
( t 1)<br />
( )<br />
CTI = P − P × 3000<br />
= 3.5 − 2.5 × 3000<br />
= $3000<br />
( 1 N )<br />
( )<br />
PTI = P − P × 3000<br />
= 2.5 − 1.5 × 3000<br />
= $3000<br />
( P )<br />
N − 0 × 3000<br />
PSt<br />
=<br />
2<br />
1.5×<br />
3000<br />
=<br />
2<br />
= $2,250<br />
CSt + PSt + CTI + PTI + DWL =<br />
= 2, 250 + 2, 250 + 3,000 + 3,000 + 2,000<br />
= $12,500<br />
= original value of total surplus before tax<br />
8
Exercise 4. [10 points]<br />
When Luigi’s income increases by 10%, his consumption of noodles decreases from 100 units a year to<br />
70 units a year. In contrast, when his income increases by 10%, his consumption of salmon increases<br />
from 20 units a year to 60 units a year.<br />
d 200%<br />
∴ Incomeelasticity of demand for Salmon = = 20<br />
10%<br />
a. [3 points] What is Luigi’s income elasticity of demand for noodles What is Luigi’s income<br />
elasticity of demand for salmon<br />
Noodles:<br />
d 70 −100<br />
% Δ in Q = × 100%<br />
100<br />
= 30%<br />
% Δ in I = 10%<br />
Income elasticity of demand:<br />
d<br />
% Δ in Q<br />
=<br />
% Δ in Income<br />
−30% = =− 3<br />
10%<br />
Salmon:<br />
d 60 − 20<br />
% Δ inQ = × 100%<br />
20<br />
40<br />
= × 100%<br />
20<br />
= 200%<br />
% Δ in I = 10%<br />
b. [4 points] Is either of these goods income elastic for Luigi Is either of these goods income<br />
inelastic for Luigi<br />
Salmon is income elastic<br />
Neither good is income inelastic<br />
c. [3 points] From Luigi’s perspective, is either of these goods a luxury good Is either of these<br />
goods an inferior good Explain your answer.<br />
Salmon is luxury good ( ∵ ε d = 20 which is +ve<br />
IQ ,<br />
)<br />
Noodles is inferior good ( ∵ ε d =−3which is −ve<br />
IQ ,<br />
)<br />
9
MULTIPLE CHOICE QUESTIONS [15 questions, 3 points each]<br />
1. Consider that we are given the following information about the relative elasticities of the demand<br />
and supply curves: price-elasticity of demand is -5, and price-elasticity of supply is -0.5. An<br />
excise tax of t dollars per unit is implemented, and sellers are officially required to pay the tax.<br />
How is the distribution of the burden distributed between buyers and sellers<br />
a. The decrease in the price that sellers will receive is 10 times higher than the increase in<br />
the price that buyers will have to pay.<br />
b. Since sellers are officially required to pay the tax, the tax burden is bear only by sellers.<br />
c. The increase in the price that sellers will receive is 5 times higher than the increase in the<br />
price that buyers will have to pay.<br />
d. The increase in the price that consumers will have to pay is 5 times as much as the<br />
decrease that sellers will receive.<br />
<strong>Answer</strong> a. Using the expression we discussed in class, relating tax incidence and relative elasticities (see Chapter 7<br />
– additional materials in the class website), we have<br />
ε<br />
ε<br />
d<br />
Q , p<br />
S<br />
Q , p<br />
S<br />
Δp<br />
p Δp<br />
= =<br />
d<br />
Δp<br />
Δp<br />
p<br />
S<br />
d<br />
And given the information we have,<br />
Δp<br />
Δp<br />
S<br />
d<br />
ε d<br />
Q , p −5<br />
= = =−10<br />
ε −0.5<br />
S<br />
Q , p<br />
S<br />
d<br />
which implies that Δ p =−10Δ p , that is, the decrease in the price that sellers receive is 10 times bigger than<br />
the increase in the price that buyers have to pay.<br />
2. Price-elasticity of demand of good A,<br />
a. Increases if there are other goods which can be easily substituted for good A.<br />
b. Decreases if there are other goods which can be easily substituted for good A.<br />
c. Increases if the good is a necessity.<br />
d. Decreases if consumers have more time to adapt their consumption pattern.<br />
When considering the formal formula of price elasticity of demand. <strong>Answer</strong> a when considering the<br />
absolute value of price elasticity of demand.<br />
10
3. If we know that price-elasticity of demand of pizzas in Pullman is -3, what can we recommend to<br />
the manager of a pizzeria in Pullman<br />
a. Increasing prices will raise total revenue of the firm.<br />
b. Decreasing prices will raise total revenue, since the price effect of lower prices is<br />
stronger than the quantity effect.<br />
c. Decreasing prices will raise total revenue, since the quantity effect of lower prices is<br />
stronger than the price effect.<br />
d. We do not have enough information for making such a strong prediction about total<br />
revenue.<br />
<strong>Answer</strong> c. Use the formula of price-elasticity of demand,<br />
ΔQ<br />
Q<br />
ε d =<br />
Q , p Δ<br />
d<br />
p<br />
p<br />
Therefore, if we know that ε<br />
Q<br />
d<br />
,<br />
p<br />
=-3, then the quantity effect<br />
d<br />
Δ Q<br />
Δp<br />
> price effect,<br />
Q<br />
p<br />
. For <strong>exam</strong>ple,<br />
a 10% price decrease implies a -10x-3 = 30% increase in Q.<br />
Then if price set at $100, and quantity is set at 100 units, then a 10% decrease in p, implies $90, and<br />
a 30% increase in Q => 130 units.<br />
Before changes, the total revenue = 100x100 = $10,000<br />
After changes, the total revenue = 90x130 = $11,700<br />
4. What can we infer from the following statement: “the cross-price elasticity between the demand<br />
of goods A and B is -2”.<br />
a. The demand of both goods is relatively elastic.<br />
b. The demand of both goods increases faster than income.<br />
c. Consumers regard these two goods as complements, like in the <strong>exam</strong>ple of cars and<br />
gasoline.<br />
d. Consumers regard these two goods as substitutes, like in the <strong>exam</strong>ple of two brands of<br />
mineral water.<br />
<strong>Answer</strong> c. When the cross-price elasticity is positive, the two goods are substitutes. When the cross-price<br />
elasticity is negative, the two goods are complements.<br />
11
5. When reading about food demand, we often find the expression “demand for food products is<br />
income-inelastic in most countries, including the US.” What is the implication of such statement<br />
for farmers<br />
a. When consumer’s income increases by 10% (for <strong>exam</strong>ple, because of economic growth),<br />
the agricultural products they sell will increase by more than 10%.<br />
b. When consumer’s income increases by 10% (for <strong>exam</strong>ple, because of economic growth),<br />
the agricultural products they sell will decrease by more than 10%.<br />
c. When consumer’s income increases by 10% (for <strong>exam</strong>ple, because of economic growth),<br />
the agricultural products they sell will increase by less than 10%.<br />
<strong>Answer</strong> c.<br />
d. It means that the demand curve for the agricultural products farmers sell is very inelastic,<br />
which allows them to raise prices.<br />
Using the following formula:<br />
% change in quantity demanded<br />
Income elasticity of demand =<br />
% change in income<br />
For <strong>exam</strong>ple, if income elasticity of demand is .5, then 10 % increase in income implying that 5% increase in<br />
quantity demanded.<br />
6. The distribution of the burden of an excise tax,<br />
a. Does not depend on the relative price-elasticity of supply and demand.<br />
b. Depends on the price-elasticity of demand more than on the price-elasticity of supply.<br />
c. Depends on who is officially paying the tax, according to tax law.<br />
d. Depends on the relative price-elasticity of demand and supply.<br />
<strong>Answer</strong> d. The distribution of the burden of an excise tax depends on the relative price-elasticity of<br />
demand and supply.<br />
7. The deadweight loss due to the imposition of an excise tax is lowest when<br />
a. demand is relatively inelastic and supply is relatively elastic.<br />
b. demand is relatively inelastic and supply is relatively inelastic.<br />
c. demand is relatively elastic and supply is relatively elastic.<br />
d. demand is relatively elastic and supply is relatively inelastic.<br />
<strong>Answer</strong> b. The deadweight loss from an excise tax is smallest when both the demand and supply<br />
curves are relatively inelastic, since this implies that the percentage increase in the price is<br />
relatively greater than the percentage decrease in the quantity supplied and demanded in the<br />
market.<br />
12
Use the figure below to answer the next two questions, where point A is exactly the midpoint of<br />
the depicted linear demand curve.<br />
8. At prices greater than P1 demand is ______, while at prices less than P1 demand is _____, and at<br />
price P1 demand is _____.<br />
a. elastic; elastic; unit elastic<br />
b. inelastic; inelastic; unit elastic<br />
c. elastic; inelastic; unit elastic<br />
d. inelastic; elastic; unit elastic<br />
<strong>Answer</strong> c. This is definitional: above the midpoint on a linear demand curve, demand is elastic; below the<br />
midpoint on a linear demand curve, demand is inelastic; and at the midpoint on a linear demand curve,<br />
demand is unit elastic.<br />
9. Suppose price is initially at P1. Which of the following statements is true<br />
a. If price rises to P2, then the quantity effect will dominate over the price effect and total<br />
revenue will increase.<br />
b. If price falls to P3, then the quantity effect will dominate over the price effect and total<br />
revenue will increase.<br />
c. If price rises to P2, then the price effect will dominate over the quantity effect and total<br />
revenue will increase.<br />
d. If price falls to P3, then the price effect will dominate over the quantity effect and total<br />
revenue will decrease.<br />
<strong>Answer</strong> d. When price rises above P1, the quantity effect is dominant over the price effect and this<br />
dominance results in total revenue decreasing. When price falls below P1, the price effect is dominant<br />
over the quantity effect and this dominance results in total revenue decreasing.<br />
13
10. Suppose the income elasticity of demand for a good is greater than one. Which of the following<br />
statements is true<br />
a. The percentage change in the quantity demanded of this good is larger than the<br />
percentage change in income.<br />
b. This good is a necessity, since as income increases the quantity demanded of the good<br />
increases.<br />
c. This good is an inferior good, since as income increases the quantity demanded of the<br />
good increases at a much greater rate than the rate of increase in income.<br />
d. This good could not be a luxury good, since income and the quantity demanded have a<br />
positive relationship.<br />
<strong>Answer</strong> a. When income elasticity of demand is greater than one, this tells us that the good is not an<br />
inferior good, since as income increases this leads to an increase in the quantity demanded of the good.<br />
From the definition of income elasticity of demand, a value greater than one implies that the percentage<br />
change in the quantity demanded of the good is greater than the percentage change in income. When the<br />
income elasticity of demand is greater than one, this implies that the good is a luxury, since the<br />
percentage increase in the quantity demanded is increasing at a faster rate than the percentage increase<br />
in income.<br />
11. Suppose there are two countries, Texia and Urbania, that produce food and clothing and currently<br />
do not trade. Both countries have linear production possibility frontiers. Texia, if it devotes all of<br />
its resources to food production can produce 1,000 units of food this year and 0 units of clothing.<br />
If Texia devotes of all of its resources to clothing production this year, it can produce 500 units of<br />
clothing and 0 units of food. Urbania can either produce 500 units of food this year and 0 units of<br />
clothing, or it can produce 200 units of clothing this year and 0 units of food. _______________<br />
has the comparative advantage in the production of clothing and _____________ has the<br />
comparative advantage in the production of food.<br />
<strong>Answer</strong> b.<br />
a. Texia; Texia.<br />
b. Texia; Urbania.<br />
c. Urbania; Texia.<br />
d. Urbania; Urbania.<br />
14
12. Which of the following statements is true<br />
I. An effective price floor benefits some suppliers.<br />
II. An effective price floor benefits all demanders.<br />
III. An effective price floor results in a persistent surplus.<br />
IV. An effective price floor results in an inefficiently high level of quality in the good offered by<br />
suppliers.<br />
a. <strong>State</strong>ments I and III are true.<br />
b. <strong>State</strong>ments I, III, and IV are true.<br />
c. <strong>State</strong>ments III and IV are true.<br />
d. <strong>State</strong>ments II, III, and IV are true.<br />
<strong>Answer</strong> b. <strong>State</strong>ment I is correct because those suppliers who are lucky enough to sell their good at the<br />
higher price are benefited. <strong>State</strong>ment III is also correct since an effective price floor results in excess<br />
supply of the good. <strong>State</strong>ment IV is correct as well because suppliers will compete for customers by<br />
offering higher-quality goods since they cannot compete for customers by offering lower prices.<br />
<strong>State</strong>ment II is incorrect: demanders of this good now have to pay a higher price than they would have in<br />
a freely functioning market.<br />
13. Which of the following statements is true<br />
a. An effective price ceiling reduces the quantity of the good available to consumers, while<br />
an effective price floor increases the quantity of the good available to consumers.<br />
b. An effective price floor reduces the quantity of the good available to consumers, while an<br />
effective price ceiling increases the quantity of the good available to consumers.<br />
c. Government intervention in markets in the form of effective price ceilings or price floors<br />
increases the quantity of the good available to consumers.<br />
d. Government intervention in markets in the form of effective price ceilings or price floors<br />
decreases the quantity of the good available to consumers.<br />
<strong>Answer</strong> d. Effective price ceilings and price floors both reduce the quantity of the good available to<br />
consumers, so answers (a), (b), and (c) are not true.<br />
15
14. The demand curve for videos has shifted to the right. What could have caused it<br />
a. A fall in the price of videos.<br />
b. An increase in the price of videos.<br />
c. An increase in the supply of videos.<br />
d. An increase in the incomes of buyers.<br />
<strong>Answer</strong> d. Increase in the income of buyers will shift the demand curve rightward.<br />
15. Consider that the demand curve a product shifts to the right, while the supply curve shift to the<br />
left. What can we predict about the equilibrium quantity and equilibrium price<br />
a. The equilibrium quantity will increase, but we do not know what the effect on the<br />
equilibrium price is.<br />
b. The equilibrium price will increase, and the equilibrium price will increase as well.<br />
c. The equilibrium price will increase, but we do not know what the effect in the<br />
equilibrium quantity is.<br />
d. The equilibrium quantity increases, and as a consequence, the equilibrium price<br />
decreases.<br />
<strong>Answer</strong> c. By drawing a graph with supply curve shifting to the left and demand curve shifting to the right<br />
will result in an increase in equilibrium price. However, the equilibrium quantity is uncertain.<br />
16