1st Quarter Investment Report - Wilfrid Laurier University
1st Quarter Investment Report - Wilfrid Laurier University
1st Quarter Investment Report - Wilfrid Laurier University

Create successful ePaper yourself
Turn your PDF publications into a flip-book with our unique Google optimized e-Paper software.
<strong>Investment</strong> Management Review<br />
February 2009 Update<br />
<strong>Wilfrid</strong> <strong>Laurier</strong> <strong>University</strong> Pension Plan<br />
Sadiq Adatia, Chief <strong>Investment</strong> Officer - Canada<br />
Brian Goguen, Senior Client Executive<br />
March 31, 2009<br />
V308
V308<br />
3
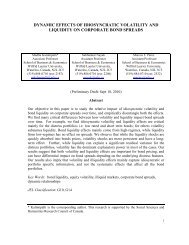
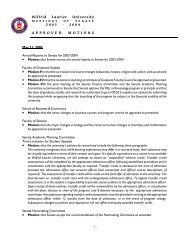
2008: A year filled with uncertainty<br />
20.0%<br />
10.0%<br />
0.0%<br />
April<br />
•BoC drops rate<br />
50bps to 3.0%<br />
June<br />
•Oil hits $147<br />
TSX peak<br />
6/18/08<br />
15,073<br />
Nov.<br />
• B. Obama 44 th US President<br />
• China plans for US$586B<br />
stimulus<br />
DEX Univ.<br />
Bond<br />
6.4%<br />
-10.0%<br />
-20.0%<br />
-30.0%<br />
-40.0%<br />
-50.0%<br />
March<br />
TSX 1/21/08<br />
12,132 Sept.<br />
•Gold hits $1000<br />
an ounce<br />
•Fed & JPM bail<br />
out Bear Stearns<br />
•US Govt. plans for $700B intervention<br />
•Lehman Bankrupt<br />
Oct.<br />
•Coordinated global rate cuts: US, CAD, EUR, UK, China<br />
& Global “rescue” packages to boost confidence<br />
•BoC cuts rate 75bps to 2.25%<br />
Dec.<br />
• BoC cuts 75bps to 1.5%<br />
•US Fed cuts rate to 0 –<br />
25bps range<br />
• Oil ends 08 @ $45<br />
TSX low<br />
11/20/08<br />
7,725<br />
12/31/2007<br />
1/15/2008<br />
1/30/2008<br />
2/14/2008<br />
2/29/2008<br />
3/15/2008<br />
3/30/2008<br />
4/14/2008<br />
4/29/2008<br />
5/14/2008<br />
5/29/2008<br />
6/13/2008<br />
6/28/2008<br />
7/13/2008<br />
7/28/2008<br />
8/12/2008<br />
8/27/2008<br />
9/11/2008<br />
9/26/2008<br />
10/11/2008<br />
10/26/2008<br />
11/10/2008<br />
11/25/2008<br />
12/10/2008<br />
12/25/2008<br />
MSCI ACWI<br />
-28.7%<br />
S&P/TSX<br />
-33.0%<br />
S&P/TSX DEX Univ. Bond MSCI ACWI<br />
Indexes are unmanaged and cannot be invested in directly. Past performance is not indicative of future results. (Jan. 1, 2008 – Dec. 31, 2008, cumulative returns $CAD)<br />
Source: Russell <strong>Investment</strong>s, Factset, MSCI<br />
V308<br />
4
One of Worst Years Ever For Global Equity Markets<br />
Period Ending December 31, 2008 ($Cdn)<br />
(%)<br />
Source: Fact set<br />
V308<br />
5
US Fixed Income Markets Suffered As Well<br />
Excess Return by Sector<br />
Excess return expressed in basis points: 1 basis point = 0.01%<br />
Source: Western Asset Management, Barclays Capital.<br />
V308<br />
6
Canadian Corporate Bonds Fared No Better<br />
Corporate Bonds’ Recent Losing Streak<br />
6.0<br />
Corporate Bond Annual Value-Added<br />
4.0<br />
2.0<br />
0.0<br />
1.43<br />
0.24<br />
2.30<br />
1.62 1.64<br />
1.17 1.35<br />
0.82<br />
1.61 2.83<br />
0.45 0.64<br />
0.35 0.77<br />
Percent<br />
-2.0<br />
-4.0<br />
1990<br />
(0.19)<br />
1991<br />
1992<br />
1993<br />
1994<br />
1995<br />
1996<br />
1997<br />
1998<br />
(1.10)<br />
1999<br />
2000<br />
(1.18)<br />
2001<br />
2002<br />
2003<br />
2004<br />
2005<br />
2006<br />
2007<br />
(2.83)<br />
2008<br />
-6.0<br />
-8.0<br />
-10.0<br />
-12.0<br />
Years<br />
(11.28)!<br />
DEX/Scotia Corporate Bond Index less DEX/Scotia Canadas Index<br />
Source: PC Bond<br />
V308<br />
7
Spreads Widened in North America<br />
Corporate <strong>Investment</strong>-Grade Spreads<br />
Canadian Corporate <strong>Investment</strong> Grade - OAS<br />
U.S. Corporate <strong>Investment</strong> Grade - OAS<br />
Source: PC Bond<br />
Past performance is not indicative of future results.<br />
V308<br />
8
Canadian economic growth set to contract<br />
4.0<br />
GDP Growth<br />
3.0<br />
2.0<br />
1.0<br />
0.9<br />
2.8<br />
0.6<br />
1.3<br />
Forecasted<br />
Growth<br />
1.6<br />
2.0<br />
0.0<br />
NA<br />
-1.0<br />
-0.6<br />
-0.5<br />
-0.2<br />
-2.0<br />
-1.2<br />
-1.7<br />
-3.0<br />
Canada GDP Growth<br />
US GDP Growth<br />
-2.3<br />
-2.7<br />
-3.0<br />
-4.0<br />
-5.0<br />
-4.5<br />
1Q08 2Q08 3Q08 4Q08 1Q09 2Q09 3Q09 4Q09<br />
Source: Factset, Russell <strong>Investment</strong>s. Note: Estimated Growth based on average forecasts as of 1/15/09 for of BMO, RBC, CIBC, TD, Scotia.<br />
US GDP estimates based on Moody's data.<br />
V308<br />
9
Unemployment Rises<br />
14.0<br />
12.0<br />
Canada Unemployment Rate<br />
Jan. 1990 - Dec. 2008<br />
Current US Unemployment<br />
• Dec. 08: 7.2%<br />
• US LTA: 5.9%<br />
10.0<br />
8.0<br />
LTA: 7.5%<br />
Feb. 09:<br />
7.7%<br />
6.0<br />
4.0<br />
2.0<br />
Canada Unemp.<br />
LT Avg. (1960)<br />
Dec. 08:<br />
6.6%<br />
0.0<br />
Jan-90<br />
Jan-91<br />
Jan-92<br />
Jan-93<br />
Jan-94<br />
Jan-95<br />
Jan-96<br />
Jan-97<br />
Jan-98<br />
Jan-99<br />
Jan-00<br />
Jan-01<br />
Jan-02<br />
Jan-03<br />
Jan-04<br />
Jan-05<br />
Jan-06<br />
Jan-07<br />
Jan-08<br />
Source: Factset, Russell<br />
V308<br />
10
Nov-07<br />
Jan-08<br />
Mar-08<br />
May-08<br />
Jul-08<br />
Sep-08<br />
Nov-08<br />
Sep-07<br />
V308<br />
11<br />
Retail Sales collapse<br />
10.0<br />
Canada Retail Sales<br />
Jan. 05 - Nov. 08<br />
8.0<br />
6.0<br />
4.0<br />
2.0<br />
% Change (YoY)<br />
0.0<br />
Jan-05<br />
Mar-05<br />
May-05<br />
Jul-05<br />
Sep-05<br />
Nov-05<br />
Jan-06<br />
Mar-06<br />
May-06<br />
Jul-06<br />
Sep-06<br />
Nov-06<br />
Jan-07<br />
Mar-07<br />
May-07<br />
Jul-07<br />
-2.0<br />
-4.0<br />
Source: Factset, Organization of Economic Cooperation & Dev. (OECD), Moody's, Russell<br />
1 st negative YoY<br />
in about 10 years<br />
US Retail<br />
Sales -2.1%
Oct-08<br />
Nov-08<br />
Aug-08<br />
Sep-08<br />
V308<br />
12<br />
Housing Deteriorating<br />
40<br />
% Change in Value of Building Permits<br />
Jan. 07 - Nov. 08<br />
30<br />
20<br />
10<br />
0<br />
% Change<br />
Jan-07<br />
Feb-07<br />
Mar-07<br />
Apr-07<br />
May-07<br />
Jun-07<br />
Jul-07<br />
Aug-07<br />
Sep-07<br />
Oct-07<br />
Nov-07<br />
Dec-07<br />
Jan-08<br />
Feb-08<br />
Mar-08<br />
Apr-08<br />
May-08<br />
Jun-08<br />
Jul-08<br />
-10<br />
-20<br />
-30<br />
Source: Factset, Moody's, Russell<br />
Building Permits (% Change YoY) 3 Mo Avg.
V308<br />
13<br />
Business Spending Contracting<br />
20.0<br />
Fixed Capital Formation (non residential)<br />
March 2000 - December 2008<br />
15.0<br />
10.0<br />
5.0<br />
0.0<br />
-5.0<br />
Mar-00<br />
Jun-00<br />
Sep-00<br />
Dec-00<br />
Mar-01<br />
Jun-01<br />
Sep-01<br />
Dec-01<br />
Mar-02<br />
Jun-02<br />
Sep-02<br />
Dec-02<br />
Mar-03<br />
Jun-03<br />
Sep-03<br />
Dec-03<br />
Mar-04<br />
Jun-04<br />
Sep-04<br />
Dec-04<br />
Mar-05<br />
Jun-05<br />
Sep-05<br />
Dec-05<br />
Mar-06<br />
Jun-06<br />
Sep-06<br />
Dec-06<br />
Mar-07<br />
Jun-07<br />
Sep-07<br />
Dec-07<br />
Mar-08<br />
Jun-08<br />
Sep-08<br />
Dec-08<br />
Year-over-Year Change (%)<br />
-10.0<br />
Source: Factset, OECD, Russell
Inflation not a concern<br />
4.0<br />
3.5<br />
Consumer Price Index (CPI)<br />
Jan. 07 - Dec. 08<br />
BoC expects Core CPI<br />
to ease throughout 2009<br />
and bottom around<br />
1.1%<br />
3.0<br />
2.5<br />
2.4<br />
V308<br />
14<br />
2.0<br />
1.5<br />
1.0<br />
0.5<br />
0.0<br />
CPI All items<br />
Core CPI<br />
BoC Target<br />
Source: Factset, Organization of Economic Cooperation & Development (OECD), Moody's, Russell<br />
Jan-07<br />
Feb-07<br />
Mar-07<br />
Apr-07<br />
May-07<br />
Jun-07<br />
Jul-07<br />
Aug-07<br />
Sep-07<br />
Oct-07<br />
Nov-07<br />
Dec-07<br />
Jan-08<br />
Feb-08<br />
Mar-08<br />
Apr-08<br />
May-08<br />
Jun-08<br />
Jul-08<br />
Aug-08<br />
Sep-08<br />
Oct-08<br />
Nov-08<br />
Dec-08<br />
1.2
6.8<br />
6.6%<br />
6.6<br />
6.4<br />
Unemployment Rate (%)<br />
6.2<br />
6.0<br />
5.8<br />
5.6<br />
5.4<br />
5.2<br />
12/31/2008<br />
V308<br />
15<br />
Bank of Canada gets aggressive<br />
5.0<br />
Canada Target & Unemployment Rates<br />
Dec. 06 - Jan. 09<br />
4.5<br />
4.0<br />
4.5%<br />
3.5<br />
3.0<br />
2.5<br />
2.0<br />
1.5<br />
1.0<br />
0.5<br />
BoC Target Rate (%)<br />
Canada Overnight Target Rate<br />
Canada Unemp. Rate<br />
5.8%<br />
0.0<br />
1.0%<br />
5.0<br />
12/31/2006<br />
2/28/2007<br />
4/30/2007<br />
6/30/2007<br />
8/31/2007<br />
10/31/2007<br />
12/31/2007<br />
2/29/2008<br />
4/30/2008<br />
6/30/2008<br />
8/31/2008<br />
10/31/2008<br />
Source: Moody's, Factset, OECD, Russell. Note: Unemployment as of 12/31/08; Target Rate as of 1/20/09.
Bank of Canada cuts again in March<br />
Cut rates 0.5% on March 3, to 0.5%.<br />
• Central bank expects target rate to stay at this rate, or lower<br />
‣ “until there are clear signs that excess supply in the economy is being taken up”<br />
• Once central bank runs out of room to cut, if required, would use credit and<br />
quantitative easing<br />
V308<br />
16
<strong>Wilfrid</strong> <strong>Laurier</strong> <strong>University</strong> Pension Plan<br />
FEBRUARY 2009<br />
V308<br />
17
<strong>Wilfrid</strong> <strong>Laurier</strong> <strong>University</strong> Pension Plan<br />
Performance Summary as of February 28, 2009<br />
Annualized<br />
Jan<br />
2009<br />
Feb<br />
2009<br />
Year to<br />
Date<br />
One<br />
Year<br />
Two<br />
Years<br />
Three<br />
Years<br />
Four<br />
Years<br />
Five<br />
Years<br />
Since<br />
Inception 2<br />
Total Fund Return (Excluding Cash) -4.09 -3.73 -7.67 -22.55 -12.68 -4.92 -1.14 0.64 2.96<br />
Policy Return 1 -3.85 -4.08 -7.77 -20.75 -11.79 -4.34 -0.80 0.79 3.16<br />
Total Fund Value Added -0.24 0.35 0.10 -1.80 -0.89 -0.58 -0.34 -0.15 -0.20<br />
1<br />
Current Policy Index is 30% S&P/TSX Capped Composite Index, 40% DEX Universe Bond Index (RBC CM Canadian Bond Market Index prior to 1/1/06), 15% Russell 1000 ® Index<br />
and 15% MSCI EAFE Index. Historical policy return reflects actual policy in effect at each point in time.<br />
2<br />
Transition into Russell Funds commenced in July 2003.<br />
• At the Total Fund level, returns were negative for the months of January and<br />
February (and year-to-date); 10 bps value added from active management so<br />
far in 2009<br />
• Foreign equities outperformed year-to-date; Canadian equity and fixed income<br />
underperformed<br />
18<br />
V308
<strong>Wilfrid</strong> <strong>Laurier</strong> <strong>University</strong> Pension Plan<br />
February 28, 2009 Asset Allocation<br />
Actual Asset Mix<br />
Policy Asset Mix<br />
15.2%<br />
30.6%<br />
15.0%<br />
30.0%<br />
14.6%<br />
Cdn. Equity<br />
Cdn. Fixed Income<br />
US Equity<br />
Overseas Equity<br />
15.0%<br />
39.6%<br />
40.0%<br />
Total Fund assets managed by Russell at February 28, 2009 = $207,811,649<br />
V308<br />
19
<strong>Wilfrid</strong> <strong>Laurier</strong> <strong>University</strong> Pension Plan<br />
Performance Summary as of December 31, 2007<br />
4Q07<br />
One<br />
Year<br />
Two<br />
Years<br />
Three<br />
Years<br />
Annualized<br />
Four<br />
Years<br />
Feb. 28/09<br />
Since Since<br />
Inception 2 Inception 2<br />
Total Fund Return (Excluding Cash) -0.4 2.7 8.0 9.5 9.6 10.9 3.0<br />
Policy Return 1 -0.2 2.0 7.3 8.8 9.1 10.6 3.2<br />
Total Fund Value Added -0.2 0.7 0.7 0.7 0.5 0.3 -0.2<br />
1<br />
Current Policy Index is 30% S&P/TSX Capped Composite Index, 40% DEX Universe Bond Index (RBC CM Canadian Bond Market Index prior to 1/1/06),<br />
15% Russell 1000 ® Index and 15% MSCI EAFE Index. Historical policy return reflects actual policy in effect at each point in time.<br />
2<br />
Transition into Russell Funds commenced in July 2003.<br />
• The perception of performance can be very end-date sensitive<br />
• 2008 was a difficult year<br />
• At the end of 2007 three of the four funds had strong outperformance<br />
over one year, with only Canadian equity lagging (-0.7%)<br />
V308<br />
20
<strong>Wilfrid</strong> <strong>Laurier</strong> <strong>University</strong> Pension Plan<br />
Performance Summary as of February 28, 2009<br />
Annualized<br />
January<br />
2009<br />
February<br />
2009<br />
Year to<br />
Date<br />
One<br />
Year<br />
Two<br />
Years<br />
Three<br />
Years<br />
Four<br />
Years<br />
Five<br />
Years<br />
Since<br />
Inception 1<br />
Russell Canadian Equity Fund -4.02 -5.48 -9.28 -40.59 -21.58 -1.65 -2.97 0.50 4.00<br />
S&P/TSX Capped Composite Index -2.96 -6.31 -9.09 -38.20 -18.78 -8.95 -1.81 0.80 4.41<br />
Value Added -1.06 0.83 -0.19 -2.39 -2.80 7.30 -1.16 -0.30 -0.41<br />
Russell US Equity Fund -6.69 -7.51 -13.70 -28.04 -22.90 -12.19 -8.68 -7.40 -4.89<br />
Russell 1000 Index -7.76 -8.24 -15.37 -26.95 -23.37 -12.10 -8.84 -7.42 -4.82<br />
Value Added 1.07 0.73 1.67 -1.09 0.47 -0.09 0.16 0.02 -0.07<br />
Russell Overseas Equity Fund -9.30 -7.58 -16.17 -36.82 -26.57 -12.65 -7.70 -5.09 -1.25<br />
MSCI EAFE Index (Linked) 2 -9.42 -8.16 -16.81 -35.51 -26.30 -12.16 -7.35 -4.26 -0.30<br />
Value Added 0.12 0.58 0.64 -1.31 -0.27 -0.49 -0.35 -0.83 -0.95<br />
Russell Canadian Fixed Income Fund -1.16 0.38 -0.79 1.98 3.92 4.48 4.73 4.88 5.55<br />
Fixed Income Policy 3 -0.95 0.69 -0.27 4.07 4.29 4.65 4.84 4.93 5.54<br />
Value Added -0.21 -0.31 -0.52 -2.09 -0.37 -0.17 -0.11 -0.05 0.01<br />
1<br />
Transition into Russell Funds commenced in July 2003.<br />
2<br />
M SCI EAFE Index is calculated with net dividends invested daily as of M arch 31, 2005. Historical performance is linked to the M SCI EAFE Index calculated with gross dividends reinvested daily. Source: M SCI -<br />
See Important Information for full disclaimer.<br />
3<br />
Fixed Income Policy currently consists of 100% DEX Universe Bond Index. DEX Universe Bond Index (previously known as SC Universe Bond Index), as a benchmark for the Russell Canadian Fixed Income<br />
Fund, was adopted on December 31, 2005. Historical performance prior to the DEX Universe Bond Index inception is linked to the RBC CM Canadian Bond M arket Index. Source: PC-Bond, a business unit of<br />
TSX Inc. Copyright (c) TSX Inc. See Important Information for full disclosure.<br />
V308<br />
21
Russell Group of Funds<br />
Performance to March 13, 2009<br />
Week<br />
Month to<br />
Date<br />
<strong>Quarter</strong><br />
to Date<br />
Year to<br />
Date<br />
Russell Canadian Equity Fund 9.56 2.52 -6.99 -6.99<br />
S&P/TSX Capped Composite Index 9.53 2.44 -6.87 -6.87<br />
Value Added 0.03 0.08 -0.12 -0.12<br />
Russell US Equity Fund 9.90 4.00 -10.25 -10.25<br />
Russell 1000 Index 9.82 3.53 -12.38 -12.38<br />
Value Added 0.08 0.47 2.13 2.13<br />
Russell Overseas Equity Fund 5.19 -0.35 -16.47 -16.47<br />
MSCI EAFE Index (Linked) 1 4.99 -1.13 -17.76 -17.76<br />
Value Added 0.20 0.78 1.29 1.29<br />
Russell Global Equity Fund 7.94 1.48 -14.02 -14.02<br />
MSCI EAFE Index (Linked) 1 7.52 1.34 -14.70 -14.70<br />
Value Added 0.42 0.14 0.68 0.68<br />
Russell Canadian Fixed Income Fund 0.70 1.16 0.36 0.36<br />
Fixed Income Policy 2 0.45 1.04 0.76 0.76<br />
Value Added 0.25 0.12 -0.40 -0.40<br />
1<br />
MSCI EAFE Index is calculated with net dividends invested daily as of March 31, 2005. Historical performance is linked to the<br />
MSCI EAFE Index calculated with gross dividends reinvested daily. Source: MSCI - See Important Information for full disclaimer.<br />
2<br />
Fixed Income Policy currently consists of 100% DEX Universe Bond Index. DEX Universe Bond Index (previously known as SC<br />
Universe Bond Index), as a benchmark for the Russell Canadian Fixed Income Fund, was adopted on December 31, 2005.<br />
Historical performance prior to the DEX Universe Bond Index inception is linked to the RBC CM Canadian Bond Market Index.<br />
Source: PC-Bond, a business unit of TSX Inc. Copyright (c) TSX Inc. See Important Information for full disclosure.<br />
V308<br />
22
Appendix<br />
V308<br />
23
Russell <strong>Investment</strong>s<br />
Organizational Update<br />
• Russell’s Board of Directors announces the appointment, effective February 2009, of<br />
Andrew Doman as Russell’s new CEO<br />
• Most recently, Mr. Doman was a founding director of McKinsey & Company's UK-based European<br />
Asset Management practice<br />
• John Schlifske will continue as President in the near term to ensure a smooth transition. Mr.<br />
Schlifske will return to Northwestern Mutual, and will remain on the Russell Board of Directors<br />
• Americas Institutional adds approximately $7 Billion in new assets under management<br />
• Canadian Institutional adds $450 million - 3 new DB full outsourcing clients<br />
• January 2009 - Barry McInerney, Managing Director, <strong>Investment</strong> Strategy & Services, left<br />
the firm to become CEO of Harris <strong>Investment</strong> Management<br />
• Mark Hansen, Managing Director, Americas Institutional will assume Barry’s leadership<br />
responsibilities on an interim basis<br />
• December 2008 - Tim Hicks, Managing Director, U.S. Equity Research left the firm<br />
• Brian Tipple, Chief <strong>Investment</strong> Officer – Equities; and Chief <strong>Investment</strong> Officer, EMEA, has<br />
assumed responsibility for Hicks’ direct reports on an interim basis<br />
V308<br />
24
Russell <strong>Investment</strong>s<br />
Update – News and Events<br />
Events<br />
• Save the Dates: Russell Regional Conferences<br />
• May 5, 2009 – Chicago<br />
• May 7, 2009 – New York<br />
• May 12, 2009 - Toronto<br />
• Russell to host Institutional Summit on October 4-6 at the Westin Mission Hills in Palm<br />
Springs, CA<br />
News Update<br />
• January 2009 - Canada launches Russell Extended Duration Fund<br />
• Provides solution to DB sponsors placing a greater emphasis on asset-liability matching<br />
• Russell survey: 50% of managers believe equity markets will rise 10% or more in 2009<br />
• Professional money managers expect a considerable bounce from the current market lows, and they anticipate this<br />
swing to take place sometime next year, according to the latest <strong>Investment</strong> Manager Outlook.<br />
• "Managers believe that the market has overshot the damage done by the ongoing recession and is now oversold<br />
and undervalued," said Erik Ristuben, Russell’s chief investment officer, North America.<br />
"In their opinion, this market has been driven by panic and fear as much as by economic fundamentals."<br />
The opinions expressed in the <strong>Investment</strong> Manager Outlook are not necessarily those held by Russell <strong>Investment</strong> Group, its affiliates or subsidiaries. While all material is deemed to be<br />
reliable, accuracy and completeness cannot be guaranteed. The information, analysis, and opinions are for general information only and are not intended to provide specific advice or<br />
recommendations for any individual or entity.<br />
V308<br />
25
Russell in Action – 2008<br />
• Russell Canadian Equity Fund<br />
Replaced Sanford C. Bernstein (value) with Aurion Capital Management (market-oriented) in July 2008<br />
Hired Goodman & Company (growth) in July 2008<br />
• Russell U.S. Equity Fund<br />
No changes to manager line up<br />
• Russell Overseas Equity Fund<br />
No changes to manager line up<br />
• Russell Global Equity Fund<br />
Hired Harris Associates (value) in January 2008 as replacement for Altrinsic Global Advisors (value)<br />
Added McKinley Capital Management (growth) in January 2008<br />
Replaced Alliance Bernstein (growth) with Marsico Capital Management (growth) in August 2008<br />
• Russell Canadian Fixed Income Fund<br />
No changes to manager line up<br />
V308<br />
26
Multi-Manager Implementation<br />
Russell Group of Funds - 26 Manager Products<br />
Researched, Monitored and Strategically Implemented<br />
Russell<br />
Funds<br />
Canadian Equity<br />
US Equity<br />
Overseas Equity<br />
Global Equity<br />
Canadian<br />
Fixed Income<br />
<strong>Investment</strong><br />
Styles<br />
Growth<br />
Market-<br />
Oriented<br />
Value<br />
Growth<br />
Market-<br />
Oriented<br />
Value<br />
Growth<br />
Market<br />
Oriented<br />
Value<br />
Growth<br />
Market<br />
Oriented<br />
Value<br />
Duration<br />
Constrained<br />
Active<br />
Yield<br />
Global<br />
Managers<br />
Foyston, Gordon & Payne<br />
(Value)<br />
Turner <strong>Investment</strong><br />
(Lrg. Cap Growth)<br />
Aronson + Johnson<br />
+ Ortiz<br />
(Value)<br />
Sanford C. Bernstein<br />
(Value)<br />
ClariVest Asset Management<br />
(Mkt-Oriented)<br />
Beutel Goodman & Co.<br />
(Duration Constrained)<br />
Aurion Capital Management<br />
(Market – Oriented)<br />
ASB<br />
(Market Oriented)<br />
Suffolk Capital Mgmt.<br />
(Market Oriented)<br />
Mondrian <strong>Investment</strong><br />
Partners<br />
(Lrg. Cap Value)<br />
Harris Associates<br />
(Value)<br />
Canso <strong>Investment</strong> Counsel<br />
(Active Yield)<br />
Greystone Managed<br />
<strong>Investment</strong>s<br />
(Market – Oriented)<br />
Montag & Caldwell<br />
(Growth)<br />
MFS Inst. Advisors<br />
(Value)<br />
Arrowstreet Capital<br />
(Market Oriented)<br />
Marsico Capital Management<br />
(Lrg. Cap Growth)<br />
Pacific <strong>Investment</strong><br />
Management<br />
(Global)<br />
Picton Mahoney<br />
Asset Management<br />
(Growth)<br />
Goodman & Company<br />
<strong>Investment</strong> Counsel<br />
(Growth)<br />
Cornerstone Capital<br />
Management<br />
(Lrg. Cap Growth)<br />
Schneider Capital<br />
Md-Lg Market Value<br />
Frank Russell Company 1<br />
MFS Institutional Advisors<br />
(Core/Growth bias)<br />
Wellington Mgmt. Company<br />
(Growth)<br />
McKinley Capital Management<br />
(Growth)<br />
MFS Institutional Advisors.<br />
(Core/GARP)<br />
Extended<br />
Duration<br />
Duration<br />
Constrained<br />
Global<br />
Beutel Goodman & Co.<br />
(Duration Constrained)<br />
1 Frank Russell Company is the parent company of Russell <strong>Investment</strong>s Canada Limited. Frank Russell Company may use a<br />
small fixed percentage of the pool’s assets to purchase additional securities that several managers consider to be attractive.<br />
Pacific <strong>Investment</strong><br />
Management<br />
(Global)<br />
V308<br />
27
Russell Group of Funds<br />
FUND PERFORMANCE (%) Period Ending December 31, 2008<br />
(Class A Units)<br />
Annualized<br />
Latest Latest Year One Two Three Four Five Ten Inception Inception<br />
Month 3 Months to Date Year Years Years Years Years Years to Date Date<br />
Russell Canadian Equity Fund 1 -1.9 -23.0 -36.8 -36.8 -17.0 -6.3 0.9 3.7 6.9 10.0 Nov./92<br />
S&P/TSX Capped Composite Index (Linked)1 -2.6 -22.7 -33.0 -33.0 -14.2 -4.8 1.7 4.2 7.0 9.5<br />
S&P/TSX Composite Index -2.6 -22.7 -33.0 -33.0 -14.2 -4.8 1.7 4.2 5.3 8.5<br />
MSCI Canada Growth Index 0.3 -19.1 -31.4 -31.4 -9.7 -1.0 5.6 6.4 2.2 6.9<br />
MSCI Canada Value Index -7.2 -25.6 -32.6 -32.6 -16.7 -6.9 -0.1 3.3 5.9 8.8<br />
Russell Canadian Fixed Income Fund 3.5 3.7 5.6 5.6 4.9 4.7 5.2 5.6 6.2 7.6 Nov./92<br />
DEX Universe Bond Index (Linked) 2 2.9 4.5 6.4 6.4 5.0 4.7 5.2 5.5 6.0 7.5<br />
Russell US Equity Fund 3 2.1 -10.7 -25.4 -25.4 -16.6 -7.6 -4.7 -3.2 -4.9 4.5 Apr./94<br />
S&P 500 Index 0.5 -9.4 -21.2 -21.2 -16.0 -6.7 -4.5 -3.1 -3.5 6.0<br />
Russell 1000 ® Index 1.1 -10.0 -21.9 -21.9 -16.3 -7.0 -4.4 -2.9 -3.2 6.1<br />
Russell 1000 ® Growth Index 1.3 -10.4 -23.0 -23.0 -14.6 -7.4 -5.0 -4.3 -6.3 4.4<br />
Russell 1000 ® Value Index 0.8 -9.6 -21.0 -21.0 -18.2 -6.6 -4.0 -1.7 -0.8 7.1<br />
Russell Overseas Equity Fund 4 5.2 -7.9 -31.3 -31.3 -19.2 -6.2 -2.3 -0.1 0.0 4.9 Dec./88<br />
MSCI EAFE Index (linked) 4 5.4 -7.1 -29.2 -29.2 -18.3 -5.6 -1.8 0.8 -1.2 3.6<br />
MSCI EAFE Growth Index (linked )4 5.8 -7.2 -28.3 -28.3 -15.9 -4.8 -1.2 0.6 -3.3 1.8<br />
MSCI EAFE Value Index (linked) 4 5.1 -6.9 -30.1 -30.1 -20.7 -6.5 -2.4 1.0 0.7 5.4<br />
Russell Global Equity Fund 5 2.9 -9.1 -27.0 -27.0 -18.1 -7.1 -- -- -- -4.2 May/05<br />
MSCI World Ex Canada Index 5 2.9 -8.6 -25.6 -25.6 -17.3 -6.5 -- -- -- -4.2<br />
1 Performance Benchmark Index: S&P/TSX Capped Composite Index, as a benchmark for the Russell Canadian Equity Fund, was adopted on May 31, 2000. Historical performance prior to the Capped index inception is linked<br />
to the S&P/TSX Composite Index.<br />
2 Performance Benchmark Index : DEX Universe Bond Index (previously known as SC Universe Bond Index), as a benchmark for the Russell Canadian Fixed Income Fund, was adopted on December 31, 2005. Source: PC-Bond,<br />
a business unit of TSX Inc. Historical performance prior to the DEX Universe Bond Index inception is linked to the RBC CM Canadian Bond Market Index.<br />
3 Performance Benchmark Index: Russell 1000 ® Index<br />
4 Performance Benchmark Index: MSCI EAFE Index (linked). MSCI EAFE Index is calculated with net dividends invested daily as of March 31, 2005. Historical performance is linked to the MSCI EAFE Index calculated with<br />
gross dividends reinvested daily. The MSCI EAFE Value and Growth Indicies are also calculated with net dividends invested daily as of the same date for comparison purposes. Source: MSCI.<br />
5 Performance Benchmark Index: MSCI World ex-Canada Index (a custom index calculated by MSCI) calculated with net dividends invested daily as of March 31, 2005. Historical performance is linked to the MSCI World ex-<br />
Canada Index calculated with gross dividends reinvested daily.<br />
* For illustration purposes only<br />
Note: Returns are for illustration only and are not indicative of future performance. The indicated rates of return are historical annual compounded total returns including<br />
changes in unit values and reinvestment of all distributions. They exclude management fees, and any sales, redemption, distribution or optional charges payable directly by any security holder.<br />
Use of MSCI data: MSCI makes no express or implied warranties or representations and shall have no liability whatsoever with respect to any MSCI data contained herein. The MSCI data may not be further redistributed or used to<br />
create indices or financial products. This report is not approved or produced by MSCI.<br />
Frank Russell Company is the owner of the trademarks, and registered trademarks related to its respective indices.<br />
Copyright © Russell <strong>Investment</strong>s Canada Limited 2007.<br />
V308<br />
28
Russell Group of Funds<br />
Performance to December 31, 2007<br />
FUND PERFORMANCE (%) Period Ending December 31, 2007<br />
(Class A Units)<br />
Annualized<br />
Latest Latest Year One Two Three Four Five Ten Inception Inception<br />
Month 3 Months to Date Year Years Years Years Years Years to Date Date<br />
Russell Canadian Equity Fund 1 1.13 -2.81 9.07 9.07 14.20 17.97 17.39 18.54 11.77 14.05 Nov./92<br />
S&P/TSX Capped Composite Index (Linked) 1 1.34 -1.25 9.83 9.83 13.49 16.93 16.31 18.32 11.15 13.15<br />
S&P/TSX Composite Index 1.34 -1.25 9.83 9.83 13.49 16.93 16.31 18.32 9.47 12.02<br />
MSCI Canada Growth Index 4.89 3.66 18.75 18.75 18.96 21.94 18.74 19.87 6.89 10.11<br />
MSCI Canada Value Index -1.88 -4.90 2.77 2.77 9.44 13.86 14.94 17.75 9.51 12.28<br />
Russell Canadian Fixed Income Fund 0.52 2.62 4.29 4.29 4.30 5.05 5.57 5.88 6.46 7.76 Nov./92<br />
DEX Universe Bond Index (linked 2 ) 0.62 2.74 3.68 3.68 3.87 4.74 5.32 5.58 6.24 7.59<br />
Russell US Equity Fund 3 -0.97 -2.63 -6.72 -6.72 2.89 3.50 3.28 3.94 0.95 7.05 Apr./94<br />
S&P 500 Index -1.95 -3.99 -10.53 -10.53 1.59 1.82 2.07 2.70 2.05 8.35<br />
Russell 1000 ® Index -1.91 -3.89 -10.29 -10.29 1.58 2.25 2.51 3.25 2.32 8.45<br />
Russell Overseas Equity Fund 4 -3.00 -1.87 -4.86 -4.86 9.57 9.87 9.72 9.92 6.54 7.24 Dec./88<br />
MSCI EAFE Index (linked) 4 -3.49 -2.42 -5.72 -5.72 8.93 9.54 10.13 10.86 4.94 5.71<br />
MSCI EAFE Growth Index (linked) 4 -3.37 -0.96 -1.23 -1.23 9.71 9.98 9.48 9.26 2.77 3.63<br />
MSCI EAFE Value Index (linked) 4 -3.61 -3.96 -10.14 -10.14 8.03 9.02 10.67 12.37 6.91 7.71<br />
Russell Global Equity Fund 5 -2.66 -2.44 -8.00 6.45 8.51 -- -- -- -- 6.25 May/05<br />
MSCI World Ex Canada Index 5 -2.70 -3.18 -8.16 7.27 8.55 -- -- -- -- 5.43<br />
1 Performance Benchmark Index: S&P/TSX Capped Composite Index, as a benchmark for the Russell Canadian Equity Fund, was adopted on May 31, 2000. Historical performance prior to the Capped index inception is linked<br />
to the S&P/TSX Composite Index.<br />
2 Performance Benchmark Index : DEX Universe Bond Index (previously known as SC Universe Bond Index), as a benchmark for the Russell Canadian Fixed Income Fund, was adopted on December 31, 2005. Source: PC-Bond,<br />
a business unit of TSX Inc. Historical performance prior to the DEX Universe Bond Index inception is linked to the RBC CM Canadian Bond Market Index.<br />
3 Performance Benchmark Index: Russell 1000 ® Index<br />
4 Performance Benchmark Index: MSCI EAFE Index (linked). MSCI EAFE Index is calculated with net dividends invested daily as of March 31, 2005. Historical performance is linked to the MSCI EAFE Index calculated with<br />
gross dividends reinvested daily. The MSCI EAFE Value and Growth Indicies are also calculated with net dividends invested daily as of the same date for comparison purposes. Source: MSCI.<br />
5 Performance Benchmark Index: MSCI World ex-Canada Index (a custom index calculated by MSCI) calculated with net dividends invested daily as of March 31, 2005. Historical performance is linked to the MSCI World ex-<br />
Canada Index calculated with gross dividends reinvested daily.<br />
* For illustration purposes only<br />
Note: Returns are for illustration only and are not indicative of future performance. The indicated rates of return are historical annual compounded total returns including<br />
changes in unit values and reinvestment of all distributions. They exclude management fees, and any sales, redemption, distribution or optional charges payable directly by any security holder.<br />
Use of MSCI data: MSCI makes no express or implied warranties or representations and shall have no liability whatsoever with respect to any MSCI data contained herein. The MSCI data may not be further redistributed or used to<br />
create indices or financial products. This report is not approved or produced by MSCI.<br />
Frank Russell Company is the owner of the trademarks, and registered trademarks related to its respective indices.<br />
Copyright © Russell <strong>Investment</strong>s Canada Limited 2007.<br />
V308<br />
29
V308<br />
30
V308<br />
31 63
V308<br />
32
Important Information (cont’d)<br />
This document and the information contained herein: (1) is provided by Russell <strong>Investment</strong>s Canada Limited (“Russell”) solely to such<br />
persons indicated in the material(s); (2) is the confidential and proprietary information of Russell; (3) may not be reproduced, provided or<br />
disclosed to others, or used for any other purpose, without the prior written permission of Russell; and (4) must be returned promptly upon<br />
request. The information contained herein is directed exclusively at persons who are accredited investors for purposes of Canadian<br />
securities laws. The Funds to which this communication relates are only available to the persons referred to above and other persons<br />
should not act or rely on the information contained herein.<br />
This document is not intended as and is not to be taken as an offer or solicitation with respect to the purchase or sale of any security or<br />
interest, nor does it constitute an offer or solicitation in any jurisdiction in Canada, including those in which such an offer or solicitation is<br />
not authorised or to any person to whom it is unlawful to make such a solicitation or offer. Any decision to purchase securities or interests<br />
with respect to the Fund must be based solely upon the information contained in the offering documents for the Fund.<br />
Date of First Publication: October 2008<br />
V308<br />
33
V308<br />
www.russell.com