COMMONS DEED
COMMONS DEED
COMMONS DEED

Create successful ePaper yourself
Turn your PDF publications into a flip-book with our unique Google optimized e-Paper software.
-0.081<br />
-0.073<br />
-0.065<br />
-0.057<br />
-0.049<br />
-0.041<br />
-0.032<br />
-0.024<br />
-0.016<br />
-0.008<br />
0.000<br />
0.008<br />
0.016<br />
0.024<br />
0.032<br />
0.041<br />
0.049<br />
0.057<br />
0.065<br />
0.073<br />
0.081<br />
0.089<br />
0.097<br />
0.106<br />
0.114<br />
-0.161<br />
-0.145<br />
-0.129<br />
-0.113<br />
-0.097<br />
-0.081<br />
-0.065<br />
-0.048<br />
-0.032<br />
-0.016<br />
0.000<br />
0.016<br />
0.032<br />
0.048<br />
0.065<br />
0.081<br />
0.097<br />
0.113<br />
0.129<br />
0.145<br />
0.161<br />
0.178<br />
0.194<br />
0.210<br />
0.226<br />
TOURISMOS: AN INTERNATIONAL MULTIDISCIPLINARY JOURNAL OF TOURISM<br />
Volume 6, Number 3, Winter 2011, pp. 13-36<br />
UDC: 338.48+640(050)<br />
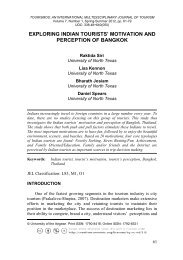
with higher leverage. The difference in two regions tested by Chi-square<br />
is statistically significant (p < 0.01).<br />
The evidence suggests that higher leverage firms achieve earnings<br />
benchmarks more frequently than lower leverage firms. Particularly, firms<br />
with higher leverage prefer to report small profits and increases in<br />
earnings against the opposite situation (small losses and small decreases<br />
in earnings). In the annex (Table 6) similar evidence is shown using<br />
interval widths of 0.01 for net income levels and 0.005 for changes in net<br />
income.<br />
Table 3 Frequency histograms (net income) constrained by<br />
leverage<br />
Panel A: Net Income distribution (NI/AT t-1 )<br />
Debt ratio (q1)<br />
16.0%<br />
Debt ratio (q3)<br />
14.0%<br />
12.0%<br />
10.0%<br />
8.0%<br />
6.0%<br />
4.0%<br />
2.0%<br />
0.0%<br />
16.0%<br />
14.0%<br />
12.0%<br />
10.0%<br />
8.0%<br />
6.0%<br />
4.0%<br />
2.0%<br />
0.0%<br />
25