
Create successful ePaper yourself
Turn your PDF publications into a flip-book with our unique Google optimized e-Paper software.
~®<br />
Intelligent Data Logging Products<br />
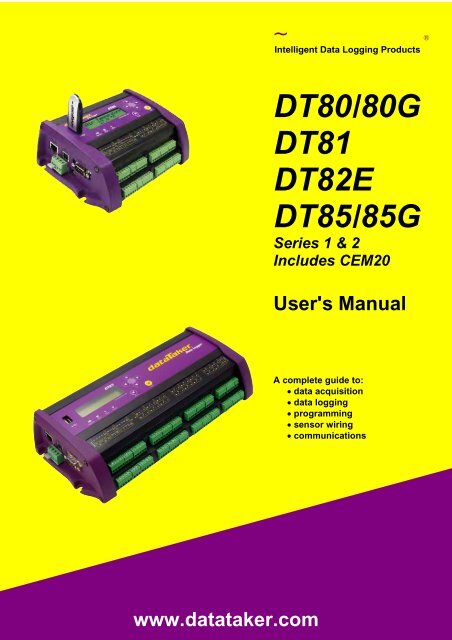
<strong>DT80</strong>/80G<br />
DT81<br />
DT82E<br />
DT85/85G<br />
<strong>Series</strong> 1 & 2<br />
Includes CEM20<br />
<strong>User's</strong> <strong>Manual</strong><br />
A complete guide to:<br />
data acquisition<br />
data logging<br />
programming<br />
sensor wiring<br />
communications<br />
www.datataker.com
<strong>DT80</strong> <strong>Series</strong> User’s <strong>Manual</strong><br />
© Copyright 2005-2010 Thermo Fisher Scientific Australia Pty Ltd ABN 52 058 390 917<br />
UM-0085-B2<br />
Warranty<br />
Thermo Fisher Scientific Australia Pty Ltd (“Thermo Fisher”) warrants the instruments it manufactures against defects in<br />
either the materials or the workmanship for a period of three years from the date of delivery to the original customer. This<br />
warranty is limited to, and purchaser’s sole remedy for a breach of this warranty is, the replacement or repair of such defects,<br />
without charge, when the instrument is returned to Thermo Fisher or to one of its authorized dealers pursuant to Thermo<br />
Fisher’s return policy procedures.<br />
The obligations set forth above shall be void with respect to any damage to the instrument resulting from accident, abuse,<br />
improper implementation or use, lack of reasonable care, loss of parts, force majeure, or any other third party cause beyond<br />
Thermo Fisher’s control. Any installation, maintenance, repair, service, or alteration to or of, or other tampering with, the<br />
instruments performed by any person or entity other than Thermo Fisher without its prior written approval, or any use of<br />
replacement parts not supplied by Thermo Fisher, shall immediately void and cancel all warranties with respect to the<br />
affected instruments.<br />
Thermo Fisher shall not be liable for any incidental, indirect, special, punitive or consequential loss or damages resulting<br />
from or arising out of the use of the instrument, In no event shall Thermo Fisher’s liability with respect to the instrument, the<br />
use thereof, this warranty statement or any cause of action related thereto, under any circumstances exceed the purchase<br />
price of the instrument actually paid by purchaser.<br />
Where Thermo Fisher supplies to the customer equipment or items manufactured by a third party, then the warranty<br />
provided by the third party manufacturer shall pass through to purchaser, but only to the extent allowed by the original<br />
manufacturer or third party supplier.<br />
EXCEPT AS EXPRESSLY PROVIDED IN THIS WARRANTY STATEMENT, THERMO FISHER DISCLAIMS ALL OTHER<br />
WARRANTIES, WHETHER EXPRESS OR IMPLIED, ORAL OR WRITTEN, WITH RESPECT TO THE INSTRUMENTS,<br />
INCLUDING WITHOUT LIMITATION ALL IMPLIED WARRANTIES OF MERCHANTABILITY OR FITNESS FOR ANY<br />
PARTICULAR PURPOSE. THERMO FISHER DOES NOT WARRANT THAT THE INSTRUMENTS ARE ERROR-FREE<br />
OR WILL ACCOMPLISH ANY PARTICULAR RESULT. ANY ADVICE OR ASSISTANCE FURNISHED BY THERMO<br />
FISHER IN RELATION TO THE INSTRUMENTS SHALL NOT GIVE RISE TO ANY WARRANTY OR GUARANTEE OF ANY<br />
KIND, AND SHALL NOT CONSTITUTE A WAIVER BY THERMO FISHER.<br />
The Purchaser shall be solely responsible for complying with all applicable local, state and Federal laws with respect to the<br />
installation, use and implementation of the equipment.<br />
Trademarks<br />
dataTaker is a registered trademark of Thermo Fisher Scientific Australia Pty Ltd<br />
Adobe® Flash® Player. Copyright © 1996 – 2006 Adobe Systems Incorporated. All Rights Reserved. Protected by U.S.<br />
Patent 6,879,327; Patents Pending in the United States and other countries. Adobe and Flash are either trademarks or<br />
registered trademarks in the United States and/or other countries.<br />
All other brand and product names are trademarks or registered trademarks of their respective holders.<br />
Related Software Products<br />
dEX, DeTransfer, DeLoad, dataTaker ActiveX, dataTaker LabVIEW TM instrument driver<br />
Important: Firmware Version Covered in This <strong>Manual</strong><br />
This version of the dataTaker <strong>DT80</strong> <strong>Series</strong> User’s <strong>Manual</strong> (UM-0085-B2) applies to the <strong>DT80</strong> range of data loggers (<strong>DT80</strong>,<br />
<strong>DT80</strong>G, DT81, DT82E, DT85 and DT85G, <strong>Series</strong> 1 and <strong>Series</strong> 2) running Version 8.04 firmware.<br />
WARNING<br />
dataTaker products are not authorized for use as critical components in any life support system where failure of the product is<br />
likely to affect the system’s safety or effectiveness.
Contents<br />
Contents ......................................................................................................................3<br />
Part A – The <strong>DT80</strong> ..................................................................................12<br />
<strong>DT80</strong> Concepts..........................................................................................................12<br />
What is the <strong>DT80</strong>.......................................................................................................... 12<br />
The <strong>DT80</strong> Product Family............................................................................................... 12<br />
<strong>DT80</strong>-Friendly Software ................................................................................................. 13<br />
About This <strong>Manual</strong> ......................................................................................................... 14<br />
A Tour of the <strong>DT80</strong>'s Interfaces...................................................................................... 14<br />
Getting Started ............................................................................................................... 15<br />
Sending Commands....................................................................................................... 16<br />
Getting Help ................................................................................................................... 16<br />
Designing Your Data Logging System............................................................................ 16<br />
Measurements...........................................................................................................17<br />
What can the <strong>DT80</strong> Measure........................................................................................ 17<br />
Analog Channels – Introduction ..................................................................................... 17<br />
Digital Channels – Introduction....................................................................................... 19<br />
Serial Channels – Introduction ....................................................................................... 20<br />
Programming the <strong>DT80</strong> ............................................................................................20<br />
Typical Workflow ............................................................................................................ 20<br />
USB memory devices..................................................................................................... 22<br />
Format of Returned Data..........................................................................................23<br />
Real-time data ................................................................................................................ 23<br />
Logged Data................................................................................................................... 24<br />
Part B – Channels ..................................................................................26<br />
Channel Definitions ..................................................................................................26<br />
Channel Numbers .....................................................................................................27<br />
Channel Number Sequence ........................................................................................... 28<br />
Channel Types ..........................................................................................................28<br />
Internal Channel Types .................................................................................................. 31<br />
Channel Options .......................................................................................................35<br />
Overview ........................................................................................................................ 35<br />
A Special Channel Option — Channel Factor ................................................................ 35<br />
Multiple Reports ............................................................................................................. 36<br />
Mutually Exclusive Options............................................................................................. 36<br />
Order of Application........................................................................................................ 36<br />
Default Channel Options ................................................................................................ 37<br />
Channel Option Table .................................................................................................... 38<br />
Part C – Schedules ................................................................................42<br />
Schedule Concepts ..................................................................................................42<br />
What are Schedules ..................................................................................................... 42<br />
Schedule Syntax ............................................................................................................ 42<br />
UM-0085-B2 <strong>DT80</strong> <strong>Series</strong> User’s <strong>Manual</strong> Page 3
Part D –<br />
Types of Schedules ..................................................................................................45<br />
General-Purpose Report Schedules (RA, RB,…RK)...................................................... 45<br />
Special-Purpose Report Schedules................................................................................ 49<br />
Immediate Report Schedules ......................................................................................... 49<br />
Statistical Report Schedules........................................................................................... 50<br />
Working with Schedules ..........................................................................................51<br />
Entering Schedules into the <strong>DT80</strong> (BEGIN–END).......................................................... 51<br />
Triggering and Schedule Order ...................................................................................... 51<br />
Changing a Schedule Trigger......................................................................................... 51<br />
Halting & Resuming Schedules...................................................................................... 52<br />
Executing Commands in Schedules............................................................................... 52<br />
Time Triggers — Synchronizing to Midnight................................................................... 52<br />
Jobs..........................................................................................54<br />
What is a Job................................................................................................................ 54<br />
Entering a Job ................................................................................................................ 54<br />
Loading an Existing Job ................................................................................................. 55<br />
Job Structure .................................................................................................................. 55<br />
Job Commands .............................................................................................................. 56<br />
Startup Job ..................................................................................................................... 57<br />
ONINSERT Job .............................................................................................................. 57<br />
Part E – Manipulating Data ...................................................................58<br />
Scaling.......................................................................................................................58<br />
Channel Factor............................................................................................................... 58<br />
Spans (Sn) ..................................................................................................................... 58<br />
Polynomials (Yn) ............................................................................................................ 59<br />
Thermistor Scaling (Tn).................................................................................................. 59<br />
Intrinsic Functions (Fn)................................................................................................... 60<br />
Combining Scaling Options ............................................................................................ 60<br />
Calculations ..............................................................................................................61<br />
Channel Variables (nCV)................................................................................................ 61<br />
Calculation Only Channels ............................................................................................. 62<br />
Reference Channels....................................................................................................... 62<br />
Expressions.................................................................................................................... 64<br />
Combining Methods ....................................................................................................... 66<br />
Derived Quantities ....................................................................................................67<br />
Rates and Integrals ........................................................................................................ 67<br />
Edge Timing ................................................................................................................... 67<br />
Statistical Channel Options .....................................................................................68<br />
Overview ........................................................................................................................ 68<br />
Statistical Functions ....................................................................................................... 69<br />
Multi Value Statistical Options ................................................................................70<br />
Histogram (Hx:y:m..nCV)................................................................................................ 70<br />
Rainflow Cycle Counting ................................................................................................ 71<br />
Part F – Alarms ......................................................................................74<br />
Alarm Concepts ........................................................................................................74<br />
UM-0085-B2 <strong>DT80</strong> <strong>Series</strong> User’s <strong>Manual</strong> Page 4
Alarm Commands .....................................................................................................74<br />
Alarm Number ................................................................................................................ 75<br />
Alarm Condition.............................................................................................................. 75<br />
Alarm Digital Action Channels........................................................................................ 77<br />
Alarm Action Text ........................................................................................................... 77<br />
Alarm Action Processes ................................................................................................. 79<br />
Alarm Records ..........................................................................................................82<br />
Real Time Alarm Return................................................................................................. 82<br />
Logging Alarms .............................................................................................................. 82<br />
Polling Alarm Inputs.................................................................................................83<br />
Part G – Logging and Retrieving Data .................................................84<br />
Part H –<br />
Logging Data.............................................................................................................84<br />
Enabling and Disabling Data Logging ............................................................................ 84<br />
How Data and Alarms are Stored................................................................................... 84<br />
Logging Options ............................................................................................................. 86<br />
Factors Which May Prevent Logging.............................................................................. 86<br />
Checking Logging Status ............................................................................................... 87<br />
Retrieving Logged Data............................................................................................88<br />
Overview ........................................................................................................................ 88<br />
LISTD – List Available Data ........................................................................................... 88<br />
COPYD – Unload Data................................................................................................... 92<br />
DELD - Delete Logged Data........................................................................................... 99<br />
Background Commands............................................................................................... 100<br />
Obsolete Commands.................................................................................................... 101<br />
The <strong>DT80</strong> File System.............................................................................................102<br />
Internal File System (B:)............................................................................................... 102<br />
External USB Devices (A:) ........................................................................................... 103<br />
File Commands ............................................................................................................ 104<br />
Data Recovery.............................................................................................................. 105<br />
<strong>DT80</strong> Front Panel...................................................................106<br />
Display.....................................................................................................................106<br />
Displaying Channels and Alarms.................................................................................. 106<br />
Bar Graph..................................................................................................................... 107<br />
Controlling what is shown on the display...................................................................... 108<br />
Auto-scrolling................................................................................................................ 108<br />
Auto-acknowledge........................................................................................................ 108<br />
Pop-up Messages ........................................................................................................ 108<br />
Display Backlight .......................................................................................................... 109<br />
User Defined Functions..........................................................................................109<br />
Defining Functions........................................................................................................ 109<br />
Selecting Functions ...................................................................................................... 109<br />
Default Functions ......................................................................................................... 109<br />
Keypad operation ...................................................................................................110<br />
Special Key Sequences ............................................................................................... 110<br />
Status Indicator Lights...........................................................................................110<br />
Sample Indicator .......................................................................................................... 110<br />
UM-0085-B2 <strong>DT80</strong> <strong>Series</strong> User’s <strong>Manual</strong> Page 5
Part I –<br />
Disk Indicator................................................................................................................ 110<br />
Power Indicator (not <strong>DT80</strong> <strong>Series</strong> 1) ............................................................................ 110<br />
Attn Indicator ................................................................................................................ 110<br />
Web Interface.........................................................................112<br />
What is the Web Interface .......................................................................................... 112<br />
dEX vs. Classic Web Interface ..................................................................................... 112<br />
Connecting to the Web Interface.................................................................................. 112<br />
Home Page .................................................................................................................. 112<br />
Starting dEX ................................................................................................................. 113<br />
Browser Requirements................................................................................................. 114<br />
dEX Configuration Builder .....................................................................................114<br />
Using the Configuration Builder.................................................................................... 114<br />
Defining Schedules ...................................................................................................... 116<br />
Defining Channels ........................................................................................................ 117<br />
Global Settings ............................................................................................................. 121<br />
Managing Configurations ............................................................................................. 121<br />
dEX Web Interface ..................................................................................................122<br />
Using the Web Interface............................................................................................... 122<br />
Status Screens ............................................................................................................. 123<br />
Data Retrieval............................................................................................................... 126<br />
Displaying Real-Time Measurements........................................................................... 129<br />
Command Window ....................................................................................................... 135<br />
Help .............................................................................................................................. 136<br />
Customising the Web Interface .............................................................................137<br />
Overview ...................................................................................................................... 137<br />
The Web Interface Configuration Tool.......................................................................... 137<br />
Status menu ................................................................................................................. 138<br />
Retrieve menu .............................................................................................................. 138<br />
Measurement menu ..................................................................................................... 138<br />
Command menu........................................................................................................... 138<br />
Help menu .................................................................................................................... 139<br />
Branding ....................................................................................................................... 139<br />
Security ........................................................................................................................ 140<br />
Preventing Configuration Changes............................................................................... 140<br />
Restoring Factory Settings ........................................................................................... 140<br />
Classic Web Interface.............................................................................................141<br />
Browser Requirements................................................................................................. 141<br />
Navigating the Web Interface ....................................................................................... 141<br />
Home Page .................................................................................................................. 141<br />
Channels Page............................................................................................................. 142<br />
Status Page.................................................................................................................. 142<br />
Files Page .................................................................................................................... 143<br />
Help Page..................................................................................................................... 143<br />
Customising the Classic Interface ........................................................................144<br />
Web Application Programming Interface (API)............................................................. 144<br />
Server-Side Include (SSI) Directives............................................................................ 144<br />
Building A Custom Web Page ...................................................................................... 147<br />
UM-0085-B2 <strong>DT80</strong> <strong>Series</strong> User’s <strong>Manual</strong> Page 6
Part J –<br />
Modbus Interface...................................................................149<br />
About Modbus .............................................................................................................. 149<br />
Connecting to a Modbus Network ................................................................................ 149<br />
Modbus Registers ........................................................................................................ 150<br />
Putting It All Together................................................................................................... 153<br />
Part K – Communications ...................................................................156<br />
Overview..................................................................................................................156<br />
Services........................................................................................................................ 156<br />
Protocols ...................................................................................................................... 156<br />
Physical Ports............................................................................................................... 157<br />
About the Communications Diagram............................................................................ 157<br />
The Command Interface.........................................................................................159<br />
Connecting to the Command Interface......................................................................... 159<br />
Command Interface Operation ..................................................................................... 159<br />
Detecting <strong>DT80</strong> Presence ............................................................................................ 159<br />
Password Protection .................................................................................................... 159<br />
USB Port ..................................................................................................................160<br />
Configuring the USB Port ............................................................................................. 160<br />
About DtUsb ................................................................................................................. 160<br />
Installing DtUsb ............................................................................................................ 161<br />
Using DtUsb ................................................................................................................. 164<br />
Sleep Mode .................................................................................................................. 166<br />
RS-232 Communications........................................................................................166<br />
Direct RS-232 Connection............................................................................................ 166<br />
RS-232 Flow Control .................................................................................................... 167<br />
Sleep Mode .................................................................................................................. 167<br />
Host RS-232 Port ....................................................................................................168<br />
Configuring the Host RS-232 Port................................................................................ 168<br />
Serial Sensor Port...................................................................................................169<br />
Connecting to the Serial Sensor Port ........................................................................... 169<br />
Configuring the Serial Sensor Port............................................................................... 171<br />
Modem Communications .......................................................................................172<br />
Modem (Remote) RS-232 Connection ......................................................................... 172<br />
Automatic Modem Detection ........................................................................................ 173<br />
<strong>DT80</strong>-to-Modem Cable................................................................................................. 173<br />
Modem Initialisation...................................................................................................... 173<br />
Powering the <strong>DT80</strong>’s Modem ....................................................................................... 175<br />
Modem Communications Operation............................................................................. 175<br />
Setting Up a Remote Connection................................................................................. 176<br />
Ethernet Communications .....................................................................................177<br />
TCP/IP Concepts.......................................................................................................... 177<br />
Connecting to the <strong>DT80</strong> Ethernet Port ......................................................................... 178<br />
Ethernet Commands .................................................................................................... 180<br />
How to set up Ethernet................................................................................................. 181<br />
Accessing the <strong>DT80</strong> via the Internet............................................................................. 184<br />
Using the Network Command Interface........................................................................ 186<br />
Using the <strong>DT80</strong> FTP Server ......................................................................................... 186<br />
UM-0085-B2 <strong>DT80</strong> <strong>Series</strong> User’s <strong>Manual</strong> Page 7
Part L –<br />
Part M –<br />
PPP Communications.............................................................................................188<br />
About PPP.................................................................................................................... 188<br />
Setting up PPP ............................................................................................................. 188<br />
Using PPP .................................................................................................................... 196<br />
Configuration.........................................................................198<br />
Configuring the <strong>DT80</strong> .............................................................................................198<br />
Parameters................................................................................................................... 198<br />
Switches ....................................................................................................................... 201<br />
Profile Settings ............................................................................................................. 202<br />
Setting the System Time .............................................................................................. 205<br />
Automatic Time Adjustment (NTP)............................................................................... 205<br />
Resetting the <strong>DT80</strong> .................................................................................................208<br />
Soft Reset..................................................................................................................... 208<br />
Hard Reset ................................................................................................................... 208<br />
Safe Mode .................................................................................................................... 209<br />
Factory Settings ........................................................................................................... 209<br />
Diagnostic Commands...........................................................................................210<br />
TEST Command........................................................................................................... 210<br />
Event Logs ................................................................................................................... 211<br />
STATUS Command...................................................................................................... 211<br />
CHARAC Command..................................................................................................... 212<br />
SERVICEDATA Command........................................................................................... 212<br />
Hardware & Power.................................................................213<br />
Inputs and Outputs.................................................................................................213<br />
<strong>DT80</strong> Wiring Panel ....................................................................................................... 213<br />
<strong>DT80</strong> Front Panel ......................................................................................................... 214<br />
<strong>DT80</strong> Side Panel .......................................................................................................... 214<br />
Inside the <strong>DT80</strong> .......................................................................................................215<br />
Accessing the main battery (not <strong>DT80</strong>G/DT82E) ......................................................... 215<br />
Accessing the lithium memory backup battery ............................................................. 216<br />
Mounting the <strong>DT80</strong> and CEM20 .............................................................................218<br />
Dimensions................................................................................................................... 218<br />
Operating Environment ................................................................................................ 218<br />
Powering the <strong>DT80</strong> .................................................................................................219<br />
Power Subsystem ........................................................................................................ 219<br />
External Power ............................................................................................................. 219<br />
Internal Power (not DT82E).......................................................................................... 220<br />
Power Outputs (<strong>DT80</strong>/82E <strong>Series</strong> 2 and DT85) ........................................................... 222<br />
Internal Memory-Backup Battery.................................................................................. 223<br />
Monitoring <strong>DT80</strong> Power................................................................................................ 223<br />
Power Consumption...............................................................................................224<br />
Power Consumption ..................................................................................................... 224<br />
Battery Life ................................................................................................................... 227<br />
Minimising Power Consumption ................................................................................... 228<br />
Sleep Mode..............................................................................................................229<br />
About Sleep Mode........................................................................................................ 229<br />
UM-0085-B2 <strong>DT80</strong> <strong>Series</strong> User’s <strong>Manual</strong> Page 8
Part N –<br />
Wake Events ................................................................................................................ 229<br />
Controlling Sleep .......................................................................................................... 230<br />
Forced Sleep Mode ...................................................................................................... 230<br />
Sensors & Channels.................................................................231<br />
Analog Channels ....................................................................................................231<br />
About the Analog Input Terminals ................................................................................ 231<br />
Voltage ......................................................................................................................... 232<br />
Current ......................................................................................................................... 235<br />
4–20mA Current Loops ................................................................................................ 237<br />
Resistance.................................................................................................................... 237<br />
Bridges ......................................................................................................................... 240<br />
Temperature – Thermocouples .................................................................................... 244<br />
Temperature – Thermistors.......................................................................................... 246<br />
Temperature – RTDs.................................................................................................... 247<br />
Temperature – AD590 <strong>Series</strong> IC Sensors.................................................................... 248<br />
Temperature – LM35 <strong>Series</strong> IC Sensors...................................................................... 249<br />
Temperature – LM135 <strong>Series</strong> IC Sensors.................................................................... 250<br />
Humidity Sensors ......................................................................................................... 251<br />
Frequency .................................................................................................................... 252<br />
Strain Gauges – Bridge ................................................................................................ 252<br />
Strain Gauges – Vibrating Wire.................................................................................... 253<br />
Strain Gauges – Carlson Meter.................................................................................... 255<br />
Analog Logic State Inputs ............................................................................................ 258<br />
Digital Channels......................................................................................................259<br />
About the Digital I/O Channels ..................................................................................... 259<br />
Digital Inputs................................................................................................................. 260<br />
Digital Outputs.............................................................................................................. 261<br />
Counters – Low Speed................................................................................................. 265<br />
Counters – High Speed ................................................................................................ 266<br />
Phase Encoders ........................................................................................................... 268<br />
Examples – Digital and Counters ................................................................................. 269<br />
SDI-12 Channel .......................................................................................................270<br />
About SDI-12................................................................................................................ 270<br />
Testing and Configuring an SDI-12 Device .................................................................. 270<br />
Reading Data from SDI-12 Devices ............................................................................. 271<br />
Example ....................................................................................................................... 272<br />
Other Considerations ................................................................................................... 273<br />
Troubleshooting............................................................................................................ 273<br />
Generic Serial Channel...........................................................................................275<br />
Connecting to and Configuring the Serial Port ............................................................. 275<br />
Serial Channel Commands .......................................................................................... 275<br />
Serial Channel Operation ............................................................................................. 276<br />
Control String – Output Actions.................................................................................... 278<br />
Control String – Input Actions....................................................................................... 280<br />
Control String – Example ............................................................................................. 282<br />
Schedules..................................................................................................................... 283<br />
Serial Sensor Direct Mode............................................................................................ 284<br />
Serial Interface Power Control...................................................................................... 284<br />
Serial Channel Debugging Tools.................................................................................. 285<br />
UM-0085-B2 <strong>DT80</strong> <strong>Series</strong> User’s <strong>Manual</strong> Page 9
Part O –<br />
Part P –<br />
Serial Channel Examples ............................................................................................. 285<br />
Modbus Channel.....................................................................................................288<br />
About Modbus .............................................................................................................. 288<br />
Connecting Serial Modbus Sensors ............................................................................. 288<br />
Connecting Network Modbus Sensors ......................................................................... 289<br />
Reading Data from Modbus Devices............................................................................ 290<br />
MODBUS Channel Options.......................................................................................... 291<br />
Block Transfers ............................................................................................................ 292<br />
Examples...................................................................................................................... 292<br />
Troubleshooting............................................................................................................ 293<br />
Technical Details & Troubleshooting....................................................................294<br />
<strong>DT80</strong> Analog Sub-System............................................................................................ 294<br />
Grounds, Ground Loops and Isolation ......................................................................... 298<br />
Noise Pickup ................................................................................................................ 299<br />
Self-Heating of Sensors ............................................................................................... 299<br />
Getting Optimal Speed from Your <strong>DT80</strong>....................................................................... 299<br />
The CEM20.............................................................................300<br />
What is the CEM20 .................................................................................................... 300<br />
Connecting CEM20s .................................................................................................... 300<br />
CEM20 Addresses ....................................................................................................... 302<br />
Powering the CEM20 ................................................................................................... 302<br />
Accessing CEM20 Channels........................................................................................ 302<br />
CEM20 Temperature Reference .................................................................................. 303<br />
Troubleshooting............................................................................................................ 303<br />
Reference...............................................................................304<br />
<strong>DT80</strong> <strong>Series</strong> Specifications ....................................................................................304<br />
Analog Inputs ............................................................................................................... 304<br />
Digital Inputs and Outputs ............................................................................................ 305<br />
High Speed Counter Inputs .......................................................................................... 306<br />
Serial Channels ............................................................................................................ 306<br />
Data Manipulation and Logging.................................................................................... 307<br />
Communication Interfaces............................................................................................ 307<br />
Network (TCP/IP) Services........................................................................................... 308<br />
System ......................................................................................................................... 308<br />
CEM20 Specifications.............................................................................................310<br />
Command Summary...............................................................................................311<br />
ASCII-Decimal Tables.............................................................................................314<br />
RS-232......................................................................................................................317<br />
Signals.......................................................................................................................... 317<br />
Cables .......................................................................................................................... 317<br />
Upgrading <strong>DT80</strong> Firmware .....................................................................................319<br />
Recommended Preparation ......................................................................................... 319<br />
Firmware Upgrade – USB Flash Device....................................................................... 320<br />
Firmware Upgrade – Host USB or RS232 Port ............................................................ 320<br />
Firmware Upgrade – Remote TCP/IP........................................................................... 321<br />
Reverting Back to Old Firmware................................................................................... 321<br />
UM-0085-B2 <strong>DT80</strong> <strong>Series</strong> User’s <strong>Manual</strong> Page 10
In Case of Failed Upgrade ........................................................................................... 321<br />
Error Messages.......................................................................................................322<br />
Standard Messages ..................................................................................................... 322<br />
Data Errors ................................................................................................................... 326<br />
<strong>DT80</strong> Abnormal Resets ................................................................................................ 326<br />
Glossary ..................................................................................................................327<br />
Index ........................................................................................................................337<br />
UM-0085-B2 <strong>DT80</strong> <strong>Series</strong> User’s <strong>Manual</strong> Page 11
Part A – The <strong>DT80</strong><br />
Figure 1: The dataTaker <strong>DT80</strong>G, <strong>DT80</strong> and DT81 (rear), DT85G and DT85 (centre), DT82E and CEM20 (front)<br />
<strong>DT80</strong> Concepts<br />
What is the <strong>DT80</strong><br />
The dataTaker <strong>DT80</strong> range of data acquisition and logging instruments are tools to measure and record a wide variety of<br />
quantities and values in the real world.<br />
The web based dEX graphical user interface makes it quick and easy to define basic measurement tasks. Logged data can<br />
then be easily extracted via a USB "memory stick", or downloaded using the web interface into files ready for import into<br />
spreadsheets and data analysis tools.<br />
The <strong>DT80</strong> range of loggers also include a powerful programming language which allows complex systems to be developed<br />
and monitored.<br />
Extensive sensor support and communications options, and a rugged and low-power design, make the <strong>DT80</strong> a very flexible<br />
data logger.<br />
The <strong>DT80</strong> Product Family<br />
The <strong>DT80</strong> product family includes the following models:<br />
The <strong>DT80</strong> is a full-featured data logger,<br />
The DT81 is a lower cost variant of the <strong>DT80</strong>.<br />
The DT82E is a low cost, low power logger designed for environmental applications.<br />
The DT85 is an expanded and enhanced version of the <strong>DT80</strong>.<br />
The <strong>DT80</strong>G and DT85G GeoLoggers are designed for Geotechnical applications.<br />
The CEM20 (Channel Expansion Module) is a 20-channel analog multiplexer which can be used to expand the<br />
number of analog input channels on a <strong>DT80</strong>/80G or DT85/85G.<br />
UM-0085-B2 <strong>DT80</strong> <strong>Series</strong> User’s <strong>Manual</strong> Page 12
The <strong>DT80</strong>/80G, DT81, DT82E and DT85/85G loggers all operate in a very similar way. The main differences are as follows:<br />
Feature DT81 DT82E <strong>DT80</strong> / <strong>DT80</strong>G DT85 / DT85G<br />
Analog input channels 1 2 5 16<br />
Digital I/O channels (open-drain outputs) 3 3 4 4<br />
Digital I/O channels (logic outputs / SDI-12) 1 1 4 4<br />
Dedicated RS232/422/485 serial sensor port - - yes yes<br />
Phase encoder inputs 1 - 2 2<br />
Switched 12V power output - yes - yes<br />
Unswitched external power output - - - yes<br />
LCD display & keypad - yes yes yes<br />
USB communications port yes - yes yes<br />
Battery charger for internal/external battery yes - yes yes<br />
Internal battery yes - yes (not <strong>DT80</strong>G) yes<br />
Modbus master function - - yes yes<br />
<strong>Series</strong> 1 and <strong>Series</strong> 2<br />
In January 2008, the original <strong>DT80</strong>, DT81 and DT85 models were superseded by enhanced <strong>Series</strong> 2 models. The main<br />
differences between the models are as follows:<br />
Feature<br />
DT81<br />
<strong>Series</strong> 1<br />
DT81<br />
<strong>Series</strong> 2<br />
<strong>DT80</strong><br />
<strong>Series</strong> 1<br />
<strong>DT80</strong>/80G<br />
<strong>Series</strong> 2<br />
DT85<br />
<strong>Series</strong> 1<br />
DT85/85G<br />
<strong>Series</strong> 2<br />
Fully isolated analog input pairs (+- and *# - yes - yes yes yes<br />
terminals switched independently)<br />
Switched 12V power output - yes - yes yes yes<br />
Unswitched external power output - - - - yes yes<br />
Status LEDs 4 4 3 4 4 4<br />
Classic web interface (HTML) yes yes yes yes yes yes<br />
dEX Enhanced web interface (Flash) - yes - yes - yes<br />
<strong>Series</strong> 2 units are clearly labelled as such on the front panel.<br />
Note that all DT82E units are <strong>Series</strong> 2.<br />
GeoLoggers<br />
The <strong>DT80</strong>G and DT85G "GeoLoggers" are equivalent to the <strong>DT80</strong> and DT85, but also include direct support for vibrating<br />
wire strain gauges, which are widely used in geotechnical applications; see Strain Gauges – Vibrating Wire (P253).<br />
Throughout this manual, references to the <strong>DT80</strong> and DT85 also refer to the <strong>DT80</strong>G and DT85G respectively, unless<br />
otherwise noted.<br />
Channel Expansion Module<br />
The CEM20 is an analog multiplexer designed to work with a <strong>DT80</strong> or DT85 <strong>Series</strong> 2 logger. It provides an easy way to<br />
expand the number of input channels. Up to 15 CEM20 modules can be connected to a DT85, giving a total of 300 input<br />
channels. See The CEM20 (P300).<br />
Note: In this manual, the term <strong>DT80</strong> (italics) is used to refer to all products (<strong>DT80</strong>, DT81 and DT85; <strong>Series</strong> 1 and <strong>Series</strong> 2).<br />
If a feature or behaviour is specific to a particular model, this will be made clear in the text.<br />
<strong>DT80</strong>-Friendly Software<br />
Programming and Configuration<br />
There are three main ways to set up and program the <strong>DT80</strong>.<br />
dEX is a web based application for programming and monitoring <strong>DT80</strong> <strong>Series</strong> 2 data loggers. dEX is built into the<br />
logger (no installation required) and runs in your web browser. It provides a totally graphical interface, which means<br />
that knowledge of the dataTaker programming language is not required. Channels and schedules are defined simply<br />
by clicking on icons and making selections from menus and dialog boxes; dEX will then generate the required <strong>DT80</strong><br />
program and load it onto the logger.<br />
Alternatively, commands entered interactively and then sent to the <strong>DT80</strong> via one of its comms ports or a TCP/IP<br />
network. This allows full access to the <strong>DT80</strong>'s capabilities. DeTransfer, or the enhanced web interface's command<br />
window, are the best tools for the job here. They both have separate send and receive windows, a macro facility, and<br />
many other useful features. A standard terminal program (e.g. HyperTerminal) can also be used.<br />
Finally, you can develop a <strong>DT80</strong> program off-line (e.g. using a text editor), then transfer it to the <strong>DT80</strong> using a USB<br />
memory device or send it as a file using DeTransfer. DeLoad is a Windows based application which allows a<br />
pre-written program to be transferred to the logger using a simple "drag and drop" operation.<br />
UM-0085-B2 <strong>DT80</strong> <strong>Series</strong> User’s <strong>Manual</strong> Page 13
Viewing Data and Status<br />
Once the <strong>DT80</strong> has been set up, there are a number of options for retrieving data and monitoring status:<br />
<br />
The <strong>DT80</strong>'s inbuilt web interface (dEX) provides a convenient way to access current data values and status<br />
information from any web browser. dEX is available on all <strong>Series</strong> 2 loggers.<br />
A simple HTML-based web interface is also provided on all loggers. This can be customised if required to provide an<br />
application-specific user interface. This interface is designed to operate efficiently on slow communications networks<br />
or on portable devices with a small display screen.<br />
DeTransfer can be used to view real-time and logged data in text format.<br />
DeLoad provides an easy way of collecting logged data, which can then be saved or sent by email.<br />
dataTaker Instrument driver for LabVIEW is a set of drivers and documentation which allows dataTaker data<br />
loggers to be incorporated in a LabVIEW environment. LabVIEW is National Instruments' industry-leading graphical<br />
software development environment for measurement and automation applications.<br />
All software is provided on the CD supplied with your <strong>DT80</strong>, and updates are available from the Datataker website,<br />
www.datataker.com (Support/Downloads section).<br />
About This <strong>Manual</strong><br />
This manual is intended for all users of the <strong>DT80</strong>. It describes:<br />
how to connect sensors and other devices to the <strong>DT80</strong>'s input and output channels.<br />
how to program the <strong>DT80</strong> to collect and return data as required.<br />
how to manage the data that the <strong>DT80</strong> collects.<br />
The main focus of this manual will be on directly programming the <strong>DT80</strong> using its command language. However, most of the<br />
concepts discussed here also apply when building programs using tools such as dEX.<br />
A Tour of the <strong>DT80</strong>'s Interfaces<br />
The <strong>DT80</strong>'s interfaces with the outside world are grouped into three main areas: user interface (top), sensor interface (front)<br />
and communications interface (side). See also Inputs and Outputs (P213).<br />
User Interface<br />
On the top panel of the <strong>DT80</strong> you will find controls which allow the user to interact with the unit during operation – without<br />
requiring a host computer:<br />
A 2-line LCD display shows status messages, measured values, and a menu of pre-defined functions (not DT81)<br />
Six keypad buttons allow the user to navigate between the various displayed options (not DT81)<br />
Four status LEDs are provided – the blue Sample LED flashes each time a measurement is taken, the green Disk<br />
LED indicates internal flash disk activity, the red Attn LED indicates various warning conditions, and the green Power<br />
LED flashes at 3 second intervals while the logger is powered and not in low "sleep" mode. The duty cycle of the flash<br />
indicates whether the logger is externally powered (long flashes) or running from its internal battery (short flashes).<br />
(Note that the Power LED is not present on <strong>DT80</strong> <strong>Series</strong> 1.)<br />
A USB socket allows connection of a USB memory device, which provides a convenient way to retrieve data from the<br />
<strong>DT80</strong> (or load a program onto it)<br />
Sensor Interface<br />
On the sloping front panel of the <strong>DT80</strong> there are two rows of terminal blocks – digital channels on the left, analog channels on<br />
the right. The green terminal blocks can be quickly unplugged from the <strong>DT80</strong> without unscrewing the sensor cabling.<br />
This interface includes:<br />
8 digital input/output/counter channels (1D – 8D), 4 of which are SDI-12 compatible (DT81/82E: 4 channels, one of<br />
which is SDI-12 compatible)<br />
an input to wake the <strong>DT80</strong> from low power "sleep" mode (WK)<br />
4 counter inputs (or two phase encoder inputs) (1C – 4C) (one phase encoder input on DT81, none on DT82E)<br />
a pair of voltage free relay contact outputs (RELAY A and B)<br />
a general purpose switched 12V 150mA power output (12V) (<strong>DT80</strong>/81/82E <strong>Series</strong> 2 and DT85 only)<br />
a general purpose current limited (300mA) power output (PWR OUT), which is derived from the external power input<br />
(DT85 only)<br />
an RS232/422/485 compatible serial port (Tx, Rx, RTS and CTS) (not present on DT81/82E)<br />
digital / power ground terminals (DGND)<br />
a number of analog input channels (5 channels for <strong>DT80</strong>, 1 channel for DT81, 16 channels for DT85)<br />
an external excitation input (EXT *)<br />
isolated analog ground terminals (AGND on <strong>DT80</strong>/81, EXT# on <strong>DT80</strong> <strong>Series</strong> 2 and DT85)<br />
UM-0085-B2 <strong>DT80</strong> <strong>Series</strong> User’s <strong>Manual</strong> Page 14
(Note that early production <strong>DT80</strong> models only had 4 analog inputs.)<br />
Communications/Power Interface<br />
On the left side panel you have a variety of connectivity options:<br />
10-Base-T Ethernet for connection to a host computer or local area network<br />
USB for high speed connection to a host computer (not present on DT82E)<br />
RS232 for connection to host computer or modem<br />
two alternative DC power connectors – a standard plug-pack socket (DC jack) and a 4-pin terminal block (2-pin for<br />
DT82E)<br />
For more details, see Communications (P156)<br />
A threaded earth point is also available on both left and right side panels.<br />
Getting Started<br />
Power<br />
Powering the <strong>DT80</strong>(P219) discusses the ways to provide power to the <strong>DT80</strong>. The simplest option is to plug in the supplied AC<br />
adaptor.<br />
All <strong>DT80</strong> models except the DT82E include an internal 6V lead-acid battery which can power the logger if the main external<br />
supply is interrupted.<br />
Important The <strong>DT80</strong> is shipped with its main internal battery disconnected. We recommend the battery is connected as<br />
soon as practical so that it can charge from the mains adaptor or other external power source. This is achieved by simply<br />
plugging the green power connector, see Powering the <strong>DT80</strong> (P219).<br />
Switch On!<br />
When power is connected, you should observe:<br />
the LCD backlight switches on (<strong>DT80</strong>/85), and the green Power LED starts flashing (DT81/85 and <strong>DT80</strong> <strong>Series</strong> 2)<br />
a brief clicking sound as the unit performs an initial self-calibration<br />
<strong>DT80</strong> restarted / Power loss is displayed on the LCD<br />
the front panel LEDs flash a few times then the red Attn LED continues to flash.<br />
The <strong>DT80</strong> is warning you that its power has been interrupted. Press any of the front panel keys (or send the command<br />
CATTN) to clear this indication. The Attn LED should stop flashing and the display should now read: <strong>DT80</strong> V8.00 / No<br />
current job. This indicates that:<br />
the version of <strong>DT80</strong> firmware in use is "8.00" (this number may vary), and<br />
no user program (or "job") has been loaded<br />
The <strong>DT80</strong> is now idle and waiting for instructions.<br />
Connecting to a Host Computer<br />
In order to program the <strong>DT80</strong>, it is generally necessary to connect it to a "host" computer. The easiest option here is to use<br />
the supplied USB cable, or, for the DT82E, the supplied Ethernet cable. Other options are to use a "null-modem" (cross-over)<br />
RS232 cable, or to connect the logger to an Ethernet network. See Communications (P156) for more details of the different<br />
communications options.<br />
Very briefly, connecting the <strong>DT80</strong> via USB involves the following steps:<br />
1. Install the supplied DtUsb driver software. This allows you to access to <strong>DT80</strong>'s network services via a USB<br />
connection.<br />
2. Connect the USB cable between the <strong>DT80</strong> and the PC.<br />
3. The Windows "New Hardware Found" wizard will then run automatically (if required) to complete the installation of the<br />
necessary drivers.<br />
4. Your default web browser will then be launched automatically and the dEX home page will be displayed.<br />
To connect to the <strong>DT80</strong> using Ethernet:<br />
1. Connect the Ethernet cable between the <strong>DT80</strong> and the PC, or between the <strong>DT80</strong> and a socket on your computer's<br />
local area network.<br />
2. Use the <strong>DT80</strong> keypad to scroll down to the "Ethernet" screen. Check that a valid IP address is displayed, e.g.<br />
169.254.3.202<br />
3. Launch your web browser and type the logger's IP address into the address bar. The dEX home page should be<br />
displayed.<br />
The above is only an brief overview. See USB Port (P160) or Ethernet Communications (P177) for detailed, step by step<br />
instructions.<br />
As an alternative to the dEX web-based interface, you can also install the supplied DeTransfer software, which can be used<br />
UM-0085-B2 <strong>DT80</strong> <strong>Series</strong> User’s <strong>Manual</strong> Page 15
to send the text-based commands described in this manual to the logger. DeTransfer can operate over a direct RS2323/USB<br />
connection or a network connection, and will work with <strong>Series</strong> 1 or <strong>Series</strong> 2 loggers.<br />
The remainder of this manual will assume you have successfully established a connection between the host PC and the<br />
<strong>DT80</strong>.<br />
Sending Commands<br />
The <strong>DT80</strong> is programmed by sending it textual commands. These commands may be either:<br />
manually entered (using DeTransfer, or the Command screen in dEX), or<br />
generated by the dEX configuration builder, based on details entered using its graphical user interface controls.<br />
Commands are executed by the <strong>DT80</strong> only after it receives a carriage-return character ().<br />
Commands are not case-sensitive; that is, they may be entered using either uppercase or lowercase characters.<br />
In this manual all commands are shown in UPPERCASE. Responses from the <strong>DT80</strong> are shown like this.<br />
After receiving a command, the <strong>DT80</strong> will normally echo the command, after converting it to uppercase. Note that the <strong>DT80</strong><br />
does not echo each character as it is received.<br />
After a command has been processed, the <strong>DT80</strong> will normally indicate that it is ready for the next one by transmitting a<br />
prompt string, such as:<br />
<strong>DT80</strong>><br />
(Command echo and the prompt string can be turned off if required using the /e switch command, see Switches (P201).)<br />
The maximum length of a command is 255 characters.<br />
The general categories of commands are:<br />
channel definitions (P26) (e.g. 2TK("Kiln temp",FF4)) – these define what measurements are to be taken,<br />
how they are to be acquired and how the measured values are to be presented.<br />
schedule definitions (P42) (e.g. RA(DATA:2MB)10S) – these define when a set of measurements are to be taken<br />
and where the results are to be stored<br />
job management commands (P56) (e.g. BEGIN, END, SHOWPROG) – these allow a set of schedule and channel<br />
definitions to be grouped into a single program, or "job", which can then be treated as a unit.<br />
data management commands (P88) (e.g. COPYD, LISTD) – these allow logged data points and alarms to be<br />
retrieved, displayed or deleted.<br />
configuration commands (P198) (e.g. PROFILE) – these allow various aspects of the <strong>DT80</strong>'s operation to be<br />
adjusted to suit particular requirements.<br />
Jobs (sets of commands) are stored in the <strong>DT80</strong>'s internal file system along with the data they generate. Different jobs can<br />
be loaded under manual or program control. In addition, the <strong>DT80</strong> can automatically run a particular job every time it is reset<br />
or powered up. See Startup Job (P57).<br />
Getting Help<br />
There are several options for getting help with programming the <strong>DT80</strong>:<br />
The command HELP topic will display useful summary information on a number of topics. Type HELP by itself to<br />
display a list of available topics. For example, HELP COMMANDS will display a list of <strong>DT80</strong> commands.<br />
This user manual, firmware release notes and a list of known issues are automatically installed onto the <strong>DT80</strong>'s<br />
internal file system each time a firmware upgrade is done. In this way you always have access to up-to-date<br />
documentation for the installed firmware version. The easiest way to view these is via the <strong>DT80</strong>'s built-in web<br />
interface.<br />
The Datataker website (www.datataker.com) contains an extensive database of frequently asked questions, code<br />
examples, sensor information, application notes, video tutorials and an online forum.<br />
Designing Your Data Logging System<br />
Data acquisition and data logging are orderly processes and should be undertaken in a systematic way. In order to obtain<br />
effective information efficiently, do the following:<br />
Identify the quantities to be measured.<br />
Select the sensors, considering measurement range, accuracy, stability, ruggedness and cost.<br />
Select the wiring configuration. For example, resistive sensors can be connected in 2, 3 or 4 wire configuration, while<br />
serial sensors can use different electrical standards (RS232/RS485 etc.) and data rates.<br />
Determine sensor output scaling, that is, the relationship between sensor output voltage/current/resistance/etc. and<br />
the actual quantity. For many sensor types this calculation is performed automatically by the <strong>DT80</strong> – all you need to do<br />
is specify the appropriate channel type.<br />
Determine how data is to be processed, for example statistical functions such as max/min or histograms may be<br />
required.<br />
UM-0085-B2 <strong>DT80</strong> <strong>Series</strong> User’s <strong>Manual</strong> Page 16
Decide on the sample frequency – don't sample faster than you need to.<br />
Calculate the volume of data to be collected.<br />
Decide on the method of data recovery and archiving – real-time data return or logging or both Will logged data be<br />
unloaded via a comms port, or collected using a USB memory device, or transmitted to an FTP site How often<br />
Decide on an appropriate communications technology for setup/maintenance and normal operation: RS232, USB,<br />
Ethernet, modem, none<br />
Consider the power consumption, including the use of low power “sleep” mode. In the event of a power failure will the<br />
<strong>DT80</strong>’s internal battery provide adequate running time<br />
The remainder of this manual will help you address these questions and then generate a suitable program for your <strong>DT80</strong>.<br />
Measurements<br />
What can the <strong>DT80</strong> Measure<br />
Analog<br />
Using its analog inputs, the <strong>DT80</strong> can directly measure the following:<br />
DC voltage (30mV, 300mV, 3V and 30V ranges)<br />
DC current (0.3mA, 3mA and 30mA ranges)<br />
resistance (10Ω, 100Ω, 1kΩ, 10kΩ ranges)<br />
frequency (0.1 to 10,000 Hz)<br />
Many other quantities can be measured by connecting appropriate sensors which convert a physical quantity into<br />
something that the <strong>DT80</strong> can measure. The <strong>DT80</strong> directly supports:<br />
4-20mA current loop sensors (0 to 100%)<br />
temperature sensors (thermocouples, RTDs, thermistors, IC sensors)<br />
bridges and strain gauges<br />
vibrating wire strain gauges (<strong>DT80</strong>G/85G only)<br />
This list can be extended by means of user specified scaling calculations.<br />
Digital<br />
The <strong>DT80</strong>’s digital and counter channels allow the measurement of:<br />
digital input state (contact closure or TTL logic)<br />
pulse count (32 bit)<br />
phase encoder position (32 bit)<br />
Serial<br />
Various “smart sensors” can also be read:<br />
SDI-12 (Serial Data Interface – 1200 baud) based sensor networks<br />
other serial sensor devices with an RS232/422/485 interface, such as weighing machines, barcode scanners<br />
CAN (Controller Area Network) sensors, using the optional dataTaker CANgate CAN to ASCII gateway device. The<br />
use of this product is outside the scope of this manual.<br />
Analog Channels – Introduction<br />
ELAY<br />
1<br />
*+-#<br />
2<br />
*+-#<br />
3<br />
*+-#<br />
4<br />
*+-#<br />
5<br />
*+-#<br />
EXT<br />
*<br />
EXT<br />
#<br />
EXT<br />
*<br />
EXT<br />
#<br />
ANALOG<br />
Figure 2: <strong>DT80</strong> analog terminals<br />
Input Terminals<br />
The <strong>DT80</strong> provides five analog input channels, numbered 1 to 5. Depending on the wiring configuration used, these allow<br />
between 5 and 15 separate voltages to be measured. The DT81 has one analog input channel, allowing 1-3 separate<br />
voltages to be measured, and the DT82E has two (2-6 separate voltage measurements). Finally, the DT85 has 16 analog<br />
UM-0085-B2 <strong>DT80</strong> <strong>Series</strong> User’s <strong>Manual</strong> Page 17
input channels, allowing 16-48 separate voltage measurements.<br />
Each analog input channel on a <strong>DT80</strong> is a 4-wire connection (see Figure 3) that allows voltage, current, resistance and<br />
frequency to be measured. These are the fundamental signals output by most sensors. It is not necessary to use all four<br />
terminals on each channel— two are often adequate.<br />
Excite Terminal<br />
Positive Terminal<br />
Negative Terminal<br />
Return Terminal<br />
Figure 3: Analog input channel terminal labels<br />
The exact function of each terminal varies depending on how the channel is programmed. In general terms:<br />
The * ("Excite") terminal can be a voltage input (relative to # terminal), or it can provide sensor excitation (for example,<br />
for resistance measurement) See Sensor Excitation (P19).<br />
The + ("Plus") terminal is a voltage input (relative to – or # terminal)<br />
The – ("Minus") terminal is a voltage input (relative to # terminal)<br />
The # ("Return") terminal is normally used as a common or return terminal. It can also be used as a current input, using<br />
the <strong>DT80</strong>'s internal shunt resistor.<br />
Multiplexers<br />
The <strong>DT80</strong>'s analog input channels are multiplexed. The required input terminals are first connected to the input of the<br />
<strong>DT80</strong>'s instrumentation amplifier and analog to digital converter, then a measurement is taken. The next channel to be<br />
sampled is then switched through to the amplifier and ADC, and so on. Simultaneous sampling of analog channels is not<br />
possible.<br />
Channel definition commands in the <strong>DT80</strong> program determine which terminals are used for a particular measurement. For<br />
example, the channel definition 1+V measures the voltage between the + and # terminals on channel 1.<br />
Gain Ranges and Attenuators<br />
The <strong>DT80</strong>'s instrumentation amplifier has three switchable gain settings. These give three basic voltage measurement<br />
ranges (3V, 300mV and 30mV full scale)<br />
The <strong>DT80</strong>’s default is for its instrumentation amplifier to automatically change gain range to suit the input signal applied to it<br />
by the multiplexers.<br />
If the amplitude of your input signals are known, then the gain can be set manually. Do this by applying the GLx (gain lock)<br />
channel option, which disables autoranging for that channel and sets the gain to a fixed range.<br />
The analog inputs also include switchable 10:1 attenuators, which effectively provide a fourth range (30V).<br />
Warning Maximum input voltage on any analog input is ±35V dc, relative to the AGND/EXT# terminal. If this is exceeded<br />
then permanent damage may occur.<br />
Analog Input Configurations<br />
The basic quantity that the <strong>DT80</strong> measures is voltage. Voltages can be measured using two different input configurations:<br />
shared-terminal analog inputs<br />
independent analog inputs<br />
Shared-Terminal Analog Inputs<br />
Sometimes called "single-ended" inputs, a shared-terminal input is one that shares one or more of its terminals with another<br />
input. In Figure 4, the three sensors share channel 1’s # terminal. Each of the three inputs is a shared-terminal input.<br />
Figure 4 Shared-terminal voltage inputs sharing a channel’s # terminal (voltage inputs used as example)<br />
UM-0085-B2 <strong>DT80</strong> <strong>Series</strong> User’s <strong>Manual</strong> Page 18
In a shared-terminal configuration, a sensor’s "return" or "negative" wire is usually connected to the channel's # terminal. The<br />
remaining sensor wire (the "positive" or "signal") is connected to any of the channel’s other three terminals. The common<br />
terminal need not be at ground potential – all voltage measurements (shared or unshared) are differential, i.e. only the<br />
difference in voltage between the two terminals is reported.<br />
For shared-terminal inputs, the channel number is given a suffix indicating the terminal to which the positive wire is<br />
connected. For example, a shared-terminal voltage input applied to channel 1 between the + and # terminals is recognized<br />
by the channel definition 1+V.<br />
Independent Analog Inputs<br />
An independent input (also known as an "unshared" input) is one that connects to its own terminals and does not share any<br />
of those terminals with any other inputs. For example, in Figure 5, sensor A is connected to channel 1’s + and – terminals,<br />
and sensor B is connected to the other two terminals of the channel. In other words, each sensor’s terminals are independent<br />
of the other’s — no terminal is used by both sensors.<br />
Figure 5 Wiring one or two independent inputs to a single channel (voltage inputs used as example)<br />
Note that each analog input channel can support two independent voltage inputs. In the above example, the channel<br />
definition 1V will read sensor A while 1*V will read sensor B. The channel definition syntax is fully described in Channels<br />
(P26)<br />
Sensor Excitation<br />
Many sensors require excitation (electrical energy) so that they can provide an output signal. For example, to read the<br />
temperature of a thermistor, excitation current is passed through the thermistor to generate a voltage drop that can be<br />
measured.<br />
The <strong>DT80</strong> can provide<br />
Voltage source of approx. 4.5V via 1kΩ. Useful for powering some sensors however the supply is not regulated and<br />
consequently liable to drift with temperature<br />
200μA (approx.) current source. Default excitation for resistance measurement. Very stable over environmental<br />
temperature range.<br />
2.5mA (approx.) current source. Default excitation for RTD and bridge measurement. Very stable over environmental<br />
temperature range.<br />
User supplied external excitation EXT* terminal. The user can provide an external excitation which is appropriate to<br />
the sensor being used. (The <strong>DT80</strong> <strong>Series</strong> 2 and DT85 provide two general purpose DC power outputs which may be<br />
connected to the EXT* terminal to provide external excitation if required.)<br />
See the Excitation category in the Table 3: <strong>DT80</strong> Channel Options (P41) table.<br />
More Information<br />
For full details on how to connect sensors and make measurements using the <strong>DT80</strong>'s analog inputs, see Analog Channels<br />
(P231).<br />
Digital Channels – Introduction<br />
DIGITAL<br />
1D 2D 3D 4D D<br />
GND WK 12V<br />
1C 2C 3C 4C D<br />
1PE<br />
2PE GND<br />
RELAY<br />
A B<br />
5D<br />
Tx Z<br />
6D 7D 8D D<br />
GND<br />
Rx RTS CTS A Y B<br />
D<br />
GND<br />
1 3<br />
2 4<br />
5<br />
ANALOG<br />
Figure 6: <strong>DT80</strong> digital terminals<br />
The <strong>DT80</strong> provides:<br />
4 bidirectional digital I/O channels (1D-4D) with open drain output driver and pull-up resistor (DT81/82E: 3 channels,<br />
1D-3D)<br />
4 bidirectional digital I/O channels (5D-8D) with tri-stateable output driver and weak pull-down resistor. These<br />
channels may also be used for controlling intelligent sensors using the SDI-12 protocol (DT81/82E: 1 channel, 4D)<br />
1 voltage free latching relay contact output (RELAY)<br />
UM-0085-B2 <strong>DT80</strong> <strong>Series</strong> User’s <strong>Manual</strong> Page 19
1 LED output (Attn)<br />
4 hardware counter inputs (1C-4C) which can be used as independent counter channels or as two quadrature (phase<br />
encoder) inputs (DT81: one phase encoder input, shared with inputs 3C and 4C. There are no phase encoder inputs<br />
on the DT82E.)<br />
As with analog channels, channel definition commands are used to specify which digital inputs are to be measured and/or<br />
what digital output states are to be set. For example, the command 1DS will read the digital state (0 or 1) on channel 1D,<br />
while 3DSO=0 will set channel 3D low.<br />
A transition on a digital channel can be used to trigger a schedule. This allows a series of measurements to be made (or<br />
commands executed) in response to a change in digital state.<br />
The <strong>DT80</strong> can count the number of pulses received on any digital input. The four dedicated counter inputs provide additional<br />
capabilities:<br />
a higher maximum count rate<br />
the ability to keep counting even if the logger is in low-power "sleep" mode<br />
optional low-level (5mV) input threshold levels<br />
optional decoding of phase-encoded input signals<br />
For more details, see Digital Channels (P259)<br />
Serial Channels – Introduction<br />
The <strong>DT80</strong> supports two main classes of "smart sensor":<br />
A wide range of sensors, particularly in the environmental monitoring field, use the SDI-12 protocol. The <strong>DT80</strong> fully<br />
supports this protocol making it a simple process to read measured values. See SDI-12 Channel (P270).<br />
The <strong>DT80</strong> also provides a generic serial channel.<br />
The serial channel allows a wide variety of sensors and devices to be controlled and polled. The serial channel:<br />
can use the dedicated serial sensor port (not DT81/82E), the host RS232 port, and/or the USB port<br />
supports USB, RS232, RS422 and RS485 signal levels (depending on the port)<br />
supports point-to-point or multi-drop operation (point-to-point only for the host/USB port)<br />
features programmable output (poll) strings and a variety of options for parsing returned data<br />
can trigger execution of a schedule in response to received data<br />
For more details, see Generic Serial Channel (P275).<br />
Programming the <strong>DT80</strong><br />
Typical Workflow<br />
When creating a program to send to the <strong>DT80</strong>, typically the work will follow this order:<br />
Connect Sensors<br />
Sensors & Channels (P231) describes how to measure many different quantities and read many different sensor types using<br />
the <strong>DT80</strong>’s analog, digital and serial inputs.<br />
The first step is therefore to refer to the sub-section relating to the quantity you wish to measure. This will help you decide on<br />
the most appropriate way to connect the sensor to the <strong>DT80</strong>.<br />
Define Channels<br />
Programming the <strong>DT80</strong> essentially consists of :<br />
defining a series of measurements to take, and<br />
specifying when to take them.<br />
Each measurement definition is referred to as a channel. It is important to be clear on how the word “channel” is used – in<br />
<strong>DT80</strong> parlance, it refers to a measurement to be made, not a physical input channel.<br />
For example, if you program the <strong>DT80</strong> to measure a voltage on analog input 1, then read the state of digital input 3, then<br />
measure the voltage on analog input 1 again then you have defined three channels. The fact that the first and third channels<br />
both measure the same physical quantity (the voltage on analog input 1) is irrelevant – as far as the <strong>DT80</strong> is concerned, they<br />
are two entirely separate measurements.<br />
To specify when measurements are to be made, channel definitions may be grouped into schedule definitions. These<br />
specify whether the channels should be sampled immediately, or periodically, or in response to some event.<br />
To define a channel, you need to specify:<br />
UM-0085-B2 <strong>DT80</strong> <strong>Series</strong> User’s <strong>Manual</strong> Page 20
the input number (e.g. 1 for analog input 1)<br />
<br />
<br />
the channel type (e.g. V to perform a voltage measurement)<br />
any channel options that may be required (listed in parentheses, e.g. (GL3V,FF3)<br />
So to define the three channels mentioned above, you could enter:<br />
1V 3DS 1V<br />
Since we haven’t specified any schedule, these three measurements will be taken immediately, one after the other. Default<br />
settings will be used, since no channel options were specified. By default, the <strong>DT80</strong> will then return the measured values in<br />
ASCII form to the host computer, e.g.<br />
1V 234.9 mV<br />
3DS 1 State<br />
1V 233.0 mV<br />
So once you have connected the sensor as described in Sensors (P231), you can then test it out by directly entering a<br />
suitable channel definition.<br />
For example, suppose we want to check the resistance of a resistor. In the section Resistance (P237), several different wiring<br />
configurations are given. In this case we are going to connect the resistor directly to the <strong>DT80</strong>’s terminals so we don’t need<br />
to worry about lead resistance issues. The simplest 2-wire configuration is therefore suitable, as described in R4 – 2-Wire<br />
Independent Resistance Inputs (P238). We therefore pick an analog input to use, say input 2, and wire the resistor between<br />
the * and # terminals on analog input 2. We can now enter the channel definition:<br />
<strong>DT80</strong>>2*R<br />
2*R 559.1 Ohm<br />
In this case the channel number is 2* (analog input 2, measuring between * and # terminals) and the channel type is R<br />
(measure resistance) and there were no channel options, so the complete channel definition is 2*R.<br />
Note that a particular physical input can be read using different channel types. For example, a thermocouple can be read as<br />
a thermocouple or as a voltage. The command<br />
1TK 1V<br />
returns both a temperature and a voltage based on two readings of the same sensor.<br />
For more information about how channels (measurements) are specified in the <strong>DT80</strong> programming language, see Channels<br />
(P26).<br />
Define Measurement Schedules<br />
A schedule defines when a set of channels should be measured. It consists of a list of channel definitions preceded by a<br />
scan trigger specification. See Schedules (P42).<br />
As a general rule when creating schedules, don’t instruct the <strong>DT80</strong> to read channels more frequently than is really<br />
necessary. For example, temperatures generally change slowly so rapid reading does not provide extra useful information.<br />
Up to eleven different schedules can be declared (A to K), each with a different trigger based on a time interval or a digital<br />
input event. The schedule’s trigger can be changed at any time, either manually or under program control.<br />
A list of channels without a trigger specification can be entered at any time. These are scanned immediately, without<br />
affecting other schedules that may be operating. For more information, see Immediate Report Schedules (P49).<br />
Important Whilst a schedule’s trigger can be changed at any time, its channel list cannot be altered without re-entering all<br />
schedules. In fact, all schedules must be entered at the same time, either all on one line or between BEGIN and END<br />
keywords (see Working with Schedules (P51)).<br />
Jobs<br />
A <strong>DT80</strong> job is a logical "hold-all" for a group of schedule definitions and other commands. The command BEGIN signifies<br />
the start of a job, and the command END signifies the end of the job. Once a job has been fully entered, the <strong>DT80</strong> will activate<br />
all schedules defined therein.<br />
The <strong>DT80</strong> can store more than one job (each with its own separate logged data and alarms), but only one can be the<br />
current/active job. See Jobs (P54) for more details.<br />
Scaling and Calculations<br />
The <strong>DT80</strong> can scale the channel input data to engineering units by applying intrinsic functions, spans or polynomials.<br />
Arithmetic expressions provide cross-channel and other calculations. Various statistical functions, including averaging and<br />
histogram channel options, can be applied. See Scaling (P58).<br />
Reducing Data<br />
In many instances the volume of the data recorded can be reduced by taking averages, maximums, minimums, standard<br />
deviations, histograms or integrals. See Statistical Channel Options (P68).<br />
Alarms and Conditional Execution<br />
The <strong>DT80</strong>’s alarm facility is flexible and powerful. Alarms are used to warn of certain conditions (e.g. setpoint exceeded) and<br />
to control the <strong>DT80</strong>’s operation. Alarms can<br />
control <strong>DT80</strong> digital state outputs<br />
UM-0085-B2 <strong>DT80</strong> <strong>Series</strong> User’s <strong>Manual</strong> Page 21
initiate execution of <strong>DT80</strong> commands<br />
trigger the sending of messages to the host computer.<br />
set variables<br />
Executing <strong>DT80</strong> commands from an alarm can be particularly useful in modifying the <strong>DT80</strong>’s programming in response to<br />
changes in input(s). See Alarms (P74).<br />
Data Logging<br />
The <strong>DT80</strong> stores measurements in its internal data store or in a removable USB memory device.<br />
Logging begins only after you issue the LOGON command. Time and date stamping is automatic.<br />
By default, the <strong>DT80</strong> overwrites the oldest data with new data once the memory is full. If you prefer to have the logger stop<br />
logging once the memory is full then you need to set the no-overwrite schedule option (NOV) (P43).<br />
For more details see Logging and Retrieving Data (P84)<br />
Selective Logging<br />
To selectively log channels and schedules:<br />
For channels, use the NL (no log) channel option<br />
For schedules, use the LOGONx & LOGOFFx commands<br />
See Enabling and Disabling Data Logging (P84).<br />
Retrieving Data<br />
The <strong>DT80</strong> can do two things with the data it measures:<br />
Return it immediately to the host computer, where it can be seen arriving on-screen. This monitoring function is data<br />
return in real time.<br />
Store it in its internal memory and/or an inserted USB memory device ready for retrieval (unload) to the host computer<br />
at a later time. This is data logging.<br />
The <strong>DT80</strong> can carry out these functions separately, or at the same time.<br />
Retrieving Real-Time Data<br />
The <strong>DT80</strong>’s default is to return data in ASCII text form to a connected host computer instantaneously – that is, as it is<br />
measured. (To override this send the /r switch to the data logger (P201)).<br />
The logger's inbuilt dEX software can also display real-time data in tabular form in your web browser, or you can define<br />
mimics to display the data in graphical form such as dials or trend charts.<br />
Note that if the <strong>DT80</strong> is configured to take measurements at a rapid rate then it is possible that not all data values will be<br />
returned. All measurements will, however, be logged (if logging is enabled).<br />
Retrieving Logged Data<br />
Data stored in a <strong>DT80</strong>’s internal memory or USB memory device can be retrieved (or unloaded) by means of the Host<br />
RS-232 port, the Ethernet port, or the USB port. Data can be retrieved for an individual schedule or all schedules, or for all<br />
jobs or an individual job.<br />
USB memory devices<br />
The <strong>DT80</strong>’s USB port supports USB memory devices, which can be used<br />
as a medium for transferring logged data from the internal memory of a <strong>DT80</strong> to a computer (see Retrieving Logged<br />
Data (P88))<br />
as removable data storage. See Logging Data (P84)<br />
to load a job into a <strong>DT80</strong>. See ONINSERT Job (P57).<br />
to upgrade a <strong>DT80</strong>’s firmware. See Firmware Upgrade – USB Flash Device (P320).<br />
Data stored on the USB memory device is in a Windows-compatible file structure – see The <strong>DT80</strong> File System (P102).<br />
UM-0085-B2 <strong>DT80</strong> <strong>Series</strong> User’s <strong>Manual</strong> Page 22
Format of Returned Data<br />
As mentioned earlier, the <strong>DT80</strong> can:<br />
<br />
<br />
make data available to a host computer as it is measured (real-time data), and/or<br />
store data in memory to be retrieved at a later date (logged data)<br />
You can control whether data is returned or logged on a per channel, per schedule or global basis.<br />
Real-time data<br />
Web Access (dEX)<br />
If the <strong>DT80</strong> is connected to a host computer via a TCP/IP network then the logger's built in web interface can be used to<br />
display real-time data in any web browser. This may be presented in tabular numeric format, or as graphical "mimic"<br />
displays. See Displaying Real-Time Measurements (P129).<br />
ASCII Data<br />
The <strong>DT80</strong> can also return real-time data in ASCII (text) form via its command interface. This can be in one of two formats:<br />
free format mode<br />
fixed format mode (also known as "host mode", or "formatted mode")<br />
The /h switch command selects free format mode (which is the default); /H selects fixed format mode.<br />
Free Format Mode /h<br />
In free format mode, data is returned as human-readable ASCII text. Various settings are available to control how the data is<br />
presented. By default, each channel is printed on a separate line, prefixed by its name (either a standard <strong>DT80</strong> channel<br />
name e.g. "3TK", or a user-specified name e.g. "Inlet temp") and followed by appropriate units.<br />
Thus the following program:<br />
RA30S 1V("Pressure~kPa") 2TK 5DS("Valve state")<br />
would result in text similar to the following text being sent to the active communications port:<br />
Pressure 102.3 kPa<br />
2TK 98.0 degC<br />
Valve state 1 State<br />
Pressure 107.3 kPa<br />
2TK 98.2 degC<br />
Valve state 1 State<br />
and so on.<br />
By applying various formatting settings you can get different results. One possible example would be:<br />
/n/c/u/T P33=10 RA30S 1V("Pressure~kPa",FF2) 2TK(FF2) 5DS("Valve state")<br />
which would format the data thus:<br />
12:46:00.029 102.32 97.98 1<br />
12:46:30.017 107.34 98.22 1<br />
In this example, /n/c/u are switch commands (P201) that have been used to switch off output of channel numbers,<br />
channel names and units. The /T switch causes each data record to be prefixed by a timestamp. P33=10 is a parameter<br />
setting (P198) that sets each data value to a fixed width (10 characters). Finally, the FF2 channel option (P41) specifies<br />
that the channel value is to be rounded to 2 decimal places.<br />
Fixed Format Mode /H<br />
Fixed format mode is designed for use with dataTaker host software. Data is still returned in ASCII form, but the record<br />
format is fixed to allow it to be easily parsed by a computer. If /H is specified then both of the above examples will return<br />
data as:<br />
D,081044,"JOB1",2005/03/29,12:46:00,0.0293681,0;A,0,102.322,97.979902,1;0072;065F<br />
D,081044,"JOB1",2005/03/29,12:46:30,0.0170320,0;A,0,107.341,98.220014,1;0072;3BEB<br />
In fixed format mode:<br />
all formatting commands (e.g. FF2, /n, channel names) are ignored – fixed settings are used<br />
all records are prefixed by a header, which specifies that this is a data record (D), from <strong>DT80</strong> serial number 081044,<br />
running a job called "JOB1". This is followed a timestamp (date, time, and sub-second time). The 0 indicates that this<br />
is real-time data, the A identifies the schedule, and the 0 is the index within the schedule of the first data value.<br />
floating point data values are always specified to 8 significant digits<br />
each record includes an error-detection code (CRC) on the end. This allows host software to reject corrupted records.<br />
UM-0085-B2 <strong>DT80</strong> <strong>Series</strong> User’s <strong>Manual</strong> Page 23
Data records such as the above are only one of several types of fixed format message. A comprehensive description of all<br />
fixed format message types is beyond the scope of this manual.<br />
Logged Data<br />
This section discusses the different formats in which logged data can be retrieved. For details on how to go about retrieving<br />
your data, what mechanisms are available (web, file, FTP etc.) and what commands and options to use, see Retrieving<br />
Logged Data (P88).<br />
CSV Format Data<br />
CSV (comma separated value) is a widely used text based format for transferring data. The <strong>DT80</strong> command COPYD can be<br />
used to report logged data in CSV format. Data can be written to either:<br />
<br />
<br />
<br />
<br />
the active comms port, so the data appears in the dEX or DeTransfer command window from which the COPYD<br />
command was issued, or<br />
a file on the <strong>DT80</strong>'s internal file system, or<br />
a file on a removable USB device, or<br />
a file on an FTP server<br />
CSV Record Format<br />
By default, the <strong>DT80</strong> merges logged data and alarms from multiple schedules into a single file. The file consists of a number<br />
of rows. Each row is terminated by a CR-LF sequence.<br />
Each row consists of a number of fields (columns), separated by commas.<br />
Each row consists of the following fields, in order:<br />
timestamp (e.g. 2010/03/01 09:54:38.000)<br />
<br />
<br />
timezone. Currently, this field will always have the value "n", meaning "no timezone"<br />
data values for first schedule (zero or more fields, one for each loggable channel). Numeric data values are specified<br />
in "mixed" format (may be either standard or exponential format), to 8 significant digits and trailing zeroes after the<br />
decimal point are trimmed. String values are enclosed in quotes, with any control characters represented in ^c form<br />
(e.g. a CR character would appear as ^M).<br />
alarm number, alarm state (0-3) and alarm text (see Alarm Records (P82)) for first schedule (three fields; only present<br />
if schedule has one or more loggable alarm channels)<br />
data values for second schedule (if any)<br />
alarm number, alarm state and alarm text for second schedule (if any)<br />
(and so on, for each schedule)<br />
The first row in the file is a header row, which contains a descriptive name for each field. For example, the name of a data<br />
value field has the form "chanName (units)", e.g. "Ext Temp (degC)"<br />
The first block of rows after the header row contain all data records for the first schedule. The next block of rows contain all<br />
alarm records for the first schedule. Then comes the data records for the second schedule, and so on.<br />
In other words, the CSV data is generated in schedule order, not in time order. However, once it is loaded into a spreadsheet<br />
it is a trivial exercise to re-sort by the timestamp field.<br />
Example<br />
For example, a typical file might look like:<br />
"Timestamp","TZ","Ext Temp (degC)","2V (mV)","1CV","B.ALnum","B.ALstate","B.ALtext"<br />
2010/03/01 09:54:38.000,n,22.896844,-0.05822<br />
2010/03/01 09:54:39.000,n,22.894454,-0.058563<br />
2010/03/01 09:54:40.000,n,22.899576,-0.057869<br />
2010/03/01 09:54:41.000,n,22.897856,-0.056656<br />
2010/03/01 09:54:42.000,n,22.893504,-0.05735<br />
2010/03/01 09:54:38.233,n,,,3<br />
2010/03/01 09:54:40.249,n,,,4<br />
2010/03/01 09:54:42.237,n,,,1<br />
2010/03/01 09:54:40.249,n,,,,2,1,"trig 22.9"<br />
Variations<br />
To simplify parsing by host applications, the CSV format files generated by the <strong>DT80</strong> are essentially fixed format. However<br />
the following parameters may be used to vary the format:<br />
P38 can be used to change the character used as the decimal point. By default, this is set to 46, which is the ASCII<br />
code for a period character (.). For European applications, it is often set to 44, which is the code for comma (,). If this<br />
is set to comma then the data separator is automatically changed to semi-colon (;).<br />
P41 can be used to change the number of decimal places shown for timestamp values (default 3).<br />
For example, setting<br />
UM-0085-B2 <strong>DT80</strong> <strong>Series</strong> User’s <strong>Manual</strong> Page 24
P38=44 P41=0<br />
would result in:<br />
"Timestamp";"TZ";"Ext Temp (degC)";"2V (mV)";"1CV";"B.ALnum";"B.ALstate";"B.ALtext"<br />
2010/03/01 09:54:38;n;22,896844;-0,05822<br />
2010/03/01 09:54:39;n;22,894454;-0,058563<br />
2010/03/01 09:54:40;n;22,899576;-0,057869<br />
2010/03/01 09:54:41;n;22,897856;-0,056656<br />
2010/03/01 09:54:42;n;22,893504;-0,05735<br />
2010/03/01 09:54:38;n;;;3<br />
2010/03/01 09:54:40;n;;;4<br />
2010/03/01 09:54:42;n;;;1<br />
2010/03/01 09:54:40;n;;;;2;1;"trig 22.9"<br />
Data in this format can then be readily imported into spreadsheet applications which are set up for a European locale.<br />
Error Values<br />
In the event of an erroneous sample value, e.g. analog input overrange, or calculation error, a textual error string will be<br />
inserted into the CSV data in place of the data value, e.g.<br />
2010/03/01 09:54:40.000,n,OverRange,-0.057869<br />
When this is imported into a spreadsheet application, the non-numeric data value will typically plot as zero.<br />
Native (DBD) Format Data<br />
When the <strong>DT80</strong> logs data to its internal memory, it stores it in fixed size data files, one for each schedule. These files have a<br />
.DBD file extension, e.g. DATA_A.DBD.<br />
An alternative way of getting data out of a <strong>DT80</strong> is to transfer relevant .DBD files to the host computer. These files can then<br />
be opened using tools such as:<br />
dataTaker dump_dbd (which can convert to CSV format). This utility is available on the dataTaker resource CD or on<br />
the datataker.com website.<br />
third party packages such as DPlot, which provides plotting facilities.<br />
For large data files, it is often significantly faster to transfer data in DBD format, as the <strong>DT80</strong> does not need to perform any<br />
data conversion and formatting.<br />
Native format <strong>DT80</strong> data files can be saved to files on the <strong>DT80</strong> internal file system, a USB memory device or an FTP server.<br />
As with CSV format output, this is done using the COPYD command; the only difference being that a format=dbd option is<br />
specified.<br />
For more details, see Retrieving Logged Data (P88).<br />
Fixed Format Data<br />
Logged data may also be unloaded to a file as fixed format records, as described in Fixed Format Mode /H (P23). This is<br />
primarily intended for use with legacy host applications such as DeLogger.<br />
To retrieve data in fixed format, use COPYD format=fixed.<br />
Free Format Data<br />
Data may also be unloaded in traditional dataTaker "free format" mode, as described in Free Format Mode /h (P23). This<br />
format may be customised using a number of parameter and switch settings.<br />
To retrieve data in fixed format, use COPYD format=free.<br />
UM-0085-B2 <strong>DT80</strong> <strong>Series</strong> User’s <strong>Manual</strong> Page 25
Part B – Channels<br />
Channel Definitions<br />
A channel definition defines a measurement to be taken. It is therefore the fundamental building block that you use when<br />
programming the <strong>DT80</strong>.<br />
Channel definitions are normally enclosed in a schedule definition. The schedule definition specifies when to take the<br />
measurements. The channel definitions specify what to measure, on which terminals and how to sample and process the<br />
data value.<br />
A sample schedule definition is shown below<br />
RA2S 2DS 3R(4W) 2*V(0.1,GL3V,"Speed~km/h",FF0) 9CV(W)=9CV+1<br />
This shows four channel definitions which are part of the "A" schedule. Each time this schedule runs (which will be every 2<br />
seconds), four measurements will be taken:<br />
1. The logic state of digital channel 2 will be sampled<br />
2. A resistance connected to analog channel 3 (4-wire connection) will be measured<br />
3. A voltage connected to analog channel 2 (* and # terminals) will be measured and displayed as a speed value<br />
4. An internal general purpose variable will be updated (incremented)<br />
Let us now examine the syntax of a channel definition more closely.<br />
A channel definition consists of up to four components<br />
the channel type is a mnemonic code which tells the <strong>DT80</strong> what sort of quantity is being measured, or what sort of<br />
sensor is attached. In the above example the channel types are DS (digital state), R (resistance), V (voltage) and CV<br />
(channel variable). A channel definition must always include a channel type.<br />
a channel number prefix is required for most channel types. This specifies which channel to measure. In the above<br />
example we are measuring digital channel 2, analog channel 3, analog channel 2* and internal variable #9<br />
channel options are enclosed in round brackets after the channel type and further specify how the channel is to be<br />
measured and processed. In the above example, the 3R, 2*V and 9CV channels have user-specified options, the<br />
2DS channel does not.<br />
some channel types are "writable" (e.g. internal variables and digital output channels) and therefore allow a value to<br />
be assigned using an expression. In the above example the 9CV channel definition contains an expression.<br />
UM-0085-B2 <strong>DT80</strong> <strong>Series</strong> User’s <strong>Manual</strong> Page 26
Channel Numbers<br />
A <strong>DT80</strong> channel number identifies a particular channel within a certain class of channels. The following table lists the<br />
various classes of <strong>DT80</strong> channels. As can be seen, each class has its own range of channel numbers.<br />
channel class terminal labels channel numbers applicable channel types<br />
analog<br />
1 – 16 (DT85)<br />
1 – 5 (<strong>DT80</strong>)<br />
1 (DT81)<br />
1 – 20 (CEM20)<br />
digital<br />
counter<br />
1D – 8D (<strong>DT80</strong>/85)<br />
1D – 4D (DT81)<br />
1C – 4C<br />
1 – 16 (DT85)<br />
1 – 5 (<strong>DT80</strong>)<br />
1 (DT81)<br />
1 – 2 (DT82E)<br />
n01 – n20<br />
(n = CEM20 number)<br />
V HV I L R BGI BGV AS F FW Tx AD5xx CU NI<br />
LMx35 LMxx PT3xx TMPxx YSxx<br />
plus optional * + – #<br />
modifier<br />
1 – 8 (<strong>DT80</strong>/85) C DB DBO DN DNO DS DSO<br />
1 – 4 (DT81/82E)<br />
1 – 4 HSC<br />
1 – 2 (<strong>DT80</strong>/85) PE<br />
1 (DT81)<br />
relay RELAY 1 RELAY<br />
LED Attn 1 WARN<br />
serial<br />
1 – 3 (<strong>DT80</strong>/85)<br />
2 – 3 (DT81)<br />
SERIAL MODBUS<br />
2 (DT82E)<br />
1 (<strong>DT80</strong>/85 only) SSPORT<br />
TCP/IP 4 MODBUS<br />
power output 12V 1 (DT85 & Ser. 2 only) SSPWR<br />
SDI-12<br />
5D – 8D (<strong>DT80</strong>/85) 5 – 8 (<strong>DT80</strong>/85) SDI12<br />
4D (DT81/82E) 4 (DT81/82E)<br />
channel variable internal 1 – 1000 CV<br />
system variable internal 1 – 53 SV<br />
string internal 1 – 50 $<br />
timer internal 1 – 4 ST<br />
temperature internal<br />
no number (DT8x) REFT<br />
reference<br />
1 – 15 (CEM20)<br />
special internal no number D T DELAY CALC &name CMRR IBAT R100 VANA<br />
VBAT VC VDD VEXT VLITH VREF VRELAY VSYS<br />
VZERO<br />
The "applicable channel types" column lists the different ways in which a physical input can be measured. For example,<br />
analog channel 1 can be used to measure a voltage (specified by entering 1V), or a PT385 RTD (1PT385) or a frequency<br />
(1F). All of these channel types fall into the analog class, so when we talk about channel 1 we are talking about analog<br />
channel 1.<br />
Because each channel type is a member of one class only, there is never any confusion about which "channel 1" is being<br />
referred to. 1C refers to digital input 1 because, from the above table, the C (counter) channel type is in the digital class.<br />
1HSC, on the other hand, refers to counter input 1 because the HSC (high speed counter) channel type is in the counter<br />
class.<br />
An analog channel number can be suffixed by a modifier character, which identifies the pair of terminals between which to<br />
measure, as shown in the following table:<br />
Modifier<br />
Measure voltage between<br />
none + and -<br />
* * and #<br />
+ + and #<br />
– - and #<br />
# # and AGND/EXT# (normally only used for current measurements)<br />
Thus the channel ID 3V defines a measurement between the + and – terminals, while 3*V, 3+V and 3-V define<br />
measurements between the *, + or – terminals (respectively) and the # terminal.<br />
UM-0085-B2 <strong>DT80</strong> <strong>Series</strong> User’s <strong>Manual</strong> Page 27
Channel Number Sequence<br />
A channel ID that contains two channel numbers separated by two decimal points (for example, 1..3) defines a<br />
continuous sequence of channels. If the channel IDs include terminal modifiers then the sequence will include all terminal<br />
modifiers between that of the first channel ID and that of the second (inclusive, in the order *, +, –, #, and only where valid<br />
for the channel type). For example<br />
Sequence<br />
is equivalent to<br />
1..4V<br />
1V 2V 3V 4V<br />
1#..3#I 1#I 2#I 3#I<br />
1+..3-R(3W) 1+R(3W) 1-R(3W) 2+R(3W) 2-R(3W) 3+R(3W) 3-R(3W)<br />
Channel Types<br />
The following table lists all of the channel types supported by the <strong>DT80</strong>. For each channel type, the table shows:<br />
<br />
<br />
<br />
<br />
<br />
<br />
the channel type mnemonic (e.g. HV). Remember that in most cases this will be prefixed by a channel number. Refer<br />
to Channel Numbers (P27) for details of the allowable range of channel numbers for each channel type.<br />
whether the channel type is "writable" (shown in the Channel Type column). Writable channel types can be assigned<br />
a value, e.g. 2C=200 or 1CV=(2CV+3)+SIN(5CV)<br />
the default channel options for this channel type. These override the standard default values shown in the channel<br />
option table. See also Channel Options (P35).<br />
what the channel factor does for this channel type<br />
the units in which data will be returned. By default, the indicated units string will be shown on the display and<br />
appended to free format returned data, although it can be overridden if required.<br />
references to further details about the channel type<br />
Category<br />
Voltage<br />
Current<br />
Channel<br />
Type<br />
V<br />
HV<br />
Signal\ Sensor Details<br />
Voltage<br />
input ranges are ±3V,<br />
±300mV & ±30mV<br />
Higher Voltage<br />
input ranges are ±30V,<br />
±3V & ±300mV<br />
Default Channel<br />
Options<br />
(U)<br />
Note 1<br />
(A)<br />
I Current (100,T)<br />
Note 1, 2<br />
L 4-20mA current loop (100)<br />
Note 2<br />
(I,3W)<br />
Resistance R Resistance by 2, 3 or<br />
4-wire methods, 10k<br />
maximum.<br />
Bridge<br />
Frequency<br />
Temperature<br />
BGI<br />
BGV<br />
F<br />
FW<br />
TB, TC,<br />
TD, TE,<br />
TG, TJ,<br />
TK, TN,<br />
TR, TS,<br />
TT<br />
PT385<br />
PT392<br />
NI<br />
4-wire bridge, 3-wire<br />
simulated bridge<br />
current excitation<br />
4 & 6-wire bridges,<br />
voltage excitation<br />
.<br />
(350,II,<br />
3W)<br />
(V,4W)<br />
Frequency measurement (30,T)<br />
Note 1<br />
Vibrating Wire Strain<br />
Gauge frequency<br />
<strong>DT80</strong>G/85G only<br />
Thermocouples Type B,<br />
C, D, E, G, J, K, N, R, S<br />
and T<br />
Platinum RTDs<br />
( = 0.00385, 0.00392)<br />
Nickel RTD<br />
( = 0.005001)<br />
Channel<br />
Factor<br />
scaling<br />
factor<br />
scaling<br />
factor<br />
current<br />
shunt Ω<br />
current<br />
shunt Ω<br />
offset<br />
adjust Ω<br />
Note 4<br />
arm<br />
resistance<br />
Ω<br />
offset<br />
adjust ppm<br />
Note 4<br />
sample<br />
period ms<br />
(200,MD350) sample<br />
period ms<br />
(T)<br />
Note 1<br />
(100,3W,<br />
II)<br />
(1000,3W,<br />
I)<br />
scaling<br />
factor<br />
0°C resistance<br />
Ω<br />
0°C resistance<br />
Ω<br />
Output<br />
Units<br />
mV<br />
V<br />
mA<br />
%<br />
Ohm<br />
ppm<br />
ppm<br />
Hz<br />
More Information<br />
Voltage (P232)<br />
Current (P235)<br />
Resistance (P237)<br />
Bridges (P240)<br />
Bridges (P240)<br />
Frequency (P252)<br />
Hz Strain Gauges –<br />
Vibrating Wire (P253)<br />
degC<br />
Note 3<br />
degC<br />
Note 3<br />
degC<br />
Note 3<br />
Temperature –<br />
Thermocouples (P244)<br />
Temperature – RTDs<br />
(P247)<br />
UM-0085-B2 <strong>DT80</strong> <strong>Series</strong> User’s <strong>Manual</strong> Page 28
Category<br />
Time, Date<br />
and System<br />
Timers<br />
Delay<br />
Channel<br />
Type<br />
CU<br />
YS01<br />
YS02<br />
YS03<br />
YS04<br />
YS05<br />
YS06<br />
YS07<br />
YS16<br />
YS17<br />
AD590<br />
AD592<br />
TMP17<br />
LM135<br />
LM235<br />
LM335<br />
LM34<br />
LM35<br />
LM45<br />
LM50<br />
LM60<br />
TMP35<br />
TMP36<br />
TMP37<br />
T<br />
writable<br />
D<br />
writable<br />
1ST<br />
2ST<br />
3ST<br />
4ST<br />
writable<br />
DELAY<br />
writable<br />
System Data SV<br />
some are<br />
writable<br />
Variables<br />
CV<br />
writable<br />
Signal\ Sensor Details<br />
Copper RTD<br />
( = 0.0039)<br />
Thermistors: Yellow<br />
Springs 400XX series<br />
Semiconductor current<br />
source types<br />
(Analog Devices)<br />
Semiconductor (zener<br />
diode) voltage output<br />
types<br />
Semiconductor voltage<br />
output types<br />
Time of day<br />
Day or date<br />
System timers<br />
Increment every<br />
sec (1ST), min (2ST),<br />
hour (3ST), day (4ST)<br />
Delays schedule<br />
execution for nominated<br />
time<br />
System variable<br />
Channel variables:<br />
general purpose holders<br />
for data, calculation<br />
results<br />
Default Channel<br />
Options<br />
(100,3W,<br />
II)<br />
(3W,I)<br />
(100,V,U)<br />
Note 2<br />
(2,V)<br />
(V)<br />
(60)<br />
(60)<br />
(24)<br />
(7)<br />
Channel<br />
Factor<br />
0°C resistance<br />
Ω<br />
parallel<br />
resistor Ω<br />
current<br />
shunt Ω<br />
scaling<br />
factor<br />
offset<br />
adjust °C<br />
Note 4<br />
range<br />
scaling<br />
factor<br />
scaling<br />
factor<br />
IV Integer variables scaling<br />
factor<br />
Calculation CALC Temporary holder for<br />
scaling<br />
writable calculation result<br />
factor<br />
Reference &name Last measurement value<br />
Text $<br />
writable<br />
Serial<br />
Modbus<br />
for channel called name<br />
General purpose text for<br />
headings, etc. (max. 80<br />
characters each)<br />
SERIAL Transmit to and receive<br />
from serial device<br />
SDI12 Control SDI-12 sensors<br />
using digital channels 5-8<br />
SSPORT Enable/disable serial<br />
writable sensor port (not DT81)<br />
MODBUS Read/control Modbus<br />
sensors<br />
scaling<br />
factor<br />
(P53) timeout<br />
ie. P53 specifies (sec)<br />
default timeout<br />
(AD0,R1) scaling<br />
factor<br />
delay (ms)<br />
Note 6<br />
(MBI,MES,<br />
TO3,RT0)<br />
scaling<br />
factor<br />
Output<br />
Units<br />
degC<br />
Note 3<br />
degC<br />
Note 3<br />
degC<br />
Note 3<br />
degC<br />
Note 3<br />
degC<br />
Note 3<br />
More Information<br />
Temperature –<br />
Thermistors (P246)<br />
Temperature – AD590<br />
<strong>Series</strong> IC Sensors (P248)<br />
Temperature – LM135<br />
<strong>Series</strong> IC Sensors (P250)<br />
Temperature – LM35<br />
<strong>Series</strong> IC Sensors (P249)<br />
Time (P31)<br />
Counts System Timers (P32)<br />
ms<br />
State<br />
State<br />
Delay (P33)<br />
Note 6<br />
System Variables (P33)<br />
Channel Variables (nCV)<br />
(P61)<br />
Rainflow Cycle Counting<br />
(P71)<br />
Calculation Only<br />
Channels (P62)<br />
Reference Channels<br />
(P62)<br />
Text (P32)<br />
Generic Serial Channel<br />
(P275)<br />
SDI-12 Channel (P270)<br />
Serial Interface Power<br />
Control (P284)<br />
Modbus Channel (P288)<br />
UM-0085-B2 <strong>DT80</strong> <strong>Series</strong> User’s <strong>Manual</strong> Page 29
Category<br />
Power<br />
Output<br />
Digital<br />
Input<br />
Digital<br />
Output<br />
Channel<br />
Type<br />
SSPWR<br />
writable<br />
Default Channel<br />
Options<br />
Channel<br />
Factor<br />
delay (ms)<br />
Note 6<br />
Output<br />
Units<br />
State<br />
Signal\ Sensor Details<br />
Enable/disable 12V power<br />
output (<strong>DT80</strong> <strong>Series</strong> 2/DT85<br />
only)<br />
DS Digital state input (1 bit) State<br />
DN Digital nybble input (4<br />
bits)<br />
(15) bit mask<br />
Note 5<br />
DB Digital byte input (8 bits) (255) bit mask<br />
Note 5<br />
AS Digital state input on an (2500) threshold<br />
DSO<br />
writable<br />
DNO<br />
writable<br />
DBO<br />
writable<br />
analog channel<br />
Output on a single digital<br />
channel.<br />
Nybble output on a group<br />
of digital channels<br />
Byte output on a group of<br />
digital channels<br />
(mV)<br />
delay (ms)<br />
Note 6<br />
(15) bit mask<br />
Note 5<br />
(255) bit mask<br />
Note 5<br />
Nybble<br />
Byte<br />
State<br />
State<br />
Nybble<br />
Byte<br />
More Information<br />
Controlling 12V Power<br />
Output (P223)<br />
Digital Inputs (P260)<br />
Analog Logic State Inputs<br />
(P258)<br />
Digital Outputs (P261)<br />
Counter<br />
Internal<br />
Maintenance<br />
RELAY<br />
writable<br />
WARN<br />
writable<br />
C<br />
writable<br />
HSC<br />
writable<br />
PE<br />
writable<br />
REFT<br />
1=Relay output closed<br />
0=Relay output open<br />
1=Attn LED on<br />
0=Attn LED off<br />
Pulse count on digital<br />
input (0 to range-1)<br />
High Speed Up Counter<br />
(0 to range-1)<br />
Phase Encoder<br />
Reference temperature of<br />
<strong>DT80</strong> or CEM20 terminal<br />
block<br />
VBAT Terminal voltage of<br />
internal 6V lead acid<br />
battery<br />
VLITH Internal Lithium<br />
memory-backup battery<br />
voltage.<br />
IBAT Internal main battery<br />
current<br />
VREF Analog 2.5V voltage<br />
source reference<br />
VZERO Analog zero voltage<br />
reference<br />
delay (ms)<br />
Note 6<br />
delay (ms)<br />
Note 6<br />
range<br />
range<br />
scaling<br />
factor<br />
scaling<br />
factor<br />
scaling<br />
factor<br />
scaling<br />
factor<br />
scaling<br />
factor<br />
scaling<br />
factor<br />
R100 Internal 100 Ohm Shunt scaling<br />
factor<br />
VANA Internal analog 3.8V rail<br />
scaling<br />
voltage<br />
factor<br />
VDD Internal 3.3V rail voltage scaling<br />
factor<br />
VSYS Internal system supply rail<br />
scaling<br />
voltage<br />
factor<br />
VRELAY Internal relay supply<br />
scaling<br />
voltage<br />
factor<br />
VEXT Raw voltage onto system<br />
scaling<br />
from external supply<br />
factor<br />
CMRR Common-mode rejection<br />
ratio at maximum gain<br />
Table 1: <strong>DT80</strong> Channel Types<br />
State<br />
State<br />
Counts Counters – Low Speed<br />
(P265)<br />
Counts Counters – High Speed<br />
(P266)<br />
Counts Phase Encoders (P268)<br />
degC<br />
Note 3<br />
V<br />
V<br />
mA<br />
V<br />
mV<br />
Ohms<br />
mV<br />
mV<br />
mV<br />
mV<br />
V<br />
dB<br />
Temperature –<br />
Thermocouples (P244),<br />
CEM20 Temperature<br />
Reference (P303)<br />
Battery flat if below 5.6V.<br />
Replace battery if below<br />
2.8V.<br />
Positive if charging,<br />
negative if discharging<br />
Notes<br />
1. Input termination is on by default (T) for <strong>DT80</strong>/81 <strong>Series</strong> 1 for non-attenuated measurements between + and -<br />
terminals<br />
2. If the current shunt value is specified (as the channel factor) then that value is used. Otherwise, if the measurement<br />
uses the <strong>DT80</strong>'s internal shunt on the # terminal (e.g. 3#I), then the <strong>DT80</strong> uses the actual calibrated resistance of its<br />
shunt. Otherwise, the external shunt is assumed to be 100.0 ohms.<br />
UM-0085-B2 <strong>DT80</strong> <strong>Series</strong> User’s <strong>Manual</strong> Page 30
3. Alternatively, parameter P36 can be set to force all temperatures to be returned in degF, degR or K.<br />
4. Offset corrections are subtracted from the measured value.<br />
5. The bitmask specifies which channels are affected by a multi-bit read or write. Channels where the corresponding<br />
bitmask bit is zero are not affected. For example 1DNO(3)=0 will set digital outputs 1D and 2D low but the state of<br />
outputs 3D and 4D will be unchanged.<br />
6. The delay channel factor can be used in conjunction with the R channel option to generate a fixed width pulse output.<br />
Note: use delay carefully as it prevents execution of any other schedules, measurements or outputs during the delay.<br />
Internal Channel Types<br />
The <strong>DT80</strong> has its own internal channels, which can be read in exactly the same way as the obvious "external" channels. Use<br />
the channel types below.<br />
Time<br />
The <strong>DT80</strong>’s real-time clock/calendar has a resolution of 0.1ms, based on a 24-hour clock. Time is read in the same way as<br />
any channel, but without a channel number. That is, sending<br />
T<br />
returns<br />
Time 11:45:10.213<br />
This channel type is writable, so you can set the time by sending:<br />
T=12:20:00<br />
Time can be in several formats, selected by parameter P39 as follows:<br />
P39= Format Example<br />
0 (default) Hours:minute:seconds.subseconds<br />
P41 controls the number of sub-second digits between 0 and 6;<br />
default is 3 digits<br />
11:45:10.003<br />
1 s.s (decimal seconds) since midnight 42310.003<br />
2 m.m (decimal minutes) since midnight 705.1667<br />
3 h.h (decimal hours) since midnight 11.7528<br />
If the time is assigned to a channel variable (see Channel Variables (nCV) (P61)) then the CV will contain the number of<br />
seconds since midnight, e.g.<br />
T(=1CV) 1CV<br />
Time 17:40:50.748<br />
1CV 63650.7<br />
You can also set the time using a CV, e.g.<br />
1CV=7200 T=1CV<br />
1CV 7200.0<br />
Time 02:00:00.000<br />
See also Setting the System Time(P205).<br />
Date<br />
The current date can also be returned and set:<br />
D<br />
Date 22/05/2005<br />
D=25/12/2010<br />
Date 25/12/2010<br />
Date can be in several formats, selected by P31 as follows:<br />
P31= Format Example<br />
0 Day number DDDDD 86<br />
1 (default) European DD/MM/YYYY 28/03/2002<br />
2 North America MM/DD/YYYY 03/28/2002<br />
3 ISO YYYY/MM/DD 2002/03/28<br />
If the date is assigned to a channel variable then the CV will contain the number of seconds since 1-Jan-1989. The date can<br />
also be set from a CV, e.g.<br />
D(=1CV) 1CV=1CV+86400 D=1CV<br />
Date 04/03/2010<br />
1CV 668176400.0<br />
Date 05/03/2010<br />
System Variables<br />
The following system variables (see System Variables (P33)) return date related information which can then be tested in<br />
alarms:<br />
UM-0085-B2 <strong>DT80</strong> <strong>Series</strong> User’s <strong>Manual</strong> Page 31
12SV returns the current date/time as decimal days since 1-Jan-1989<br />
15SV returns the day number of the year (0-365)<br />
20SV returns the day of the month (1-31)<br />
21SV returns the month (1-12)<br />
22SV returns the year (1989-9999)<br />
Text<br />
Fifty 80-character text channels (1$ – 50$) are available for labelling, data headings, site identification, <strong>DT80</strong> identification,<br />
and so on.<br />
Define the string by sending, for example<br />
2$="my text string^M^J"<br />
Then, the string is returned (unloaded) whenever n$ is included in a channel list.<br />
Text channels can also be set based on data returned via the serial channel. Control String – Input Actions (P280)<br />
Control characters may be included in the text string, e.g. ^M for carriage return.<br />
Internal Maintenance<br />
There are several internal maintenance channels, which are read in the same way as normal channels. These allow, for<br />
example, the terminal voltage of the <strong>DT80</strong>'s internal batteries to be measured. See the Internal Maintenance section of the<br />
<strong>DT80</strong> Channel Types table (P28).<br />
System Timers<br />
There are four internal reloading system timers, which are read in the same way as channels. The four timers increment at<br />
the following rates, and reset to zero when their range (maximum value) is reached:<br />
System<br />
Timer<br />
Channel<br />
Type<br />
Increments<br />
Every Default range Provides<br />
1 1ST 1 second 60 (1 minute) Second of the minute<br />
2 2ST 1 minute 60 (1 hour) Minute of the hour<br />
3 3ST 1 hour 24 (1 day) Hour of the day<br />
4 4ST 1 day 7 (1 week) Day of the week:<br />
(0 = Sunday, 1= Monday, etc.)<br />
System timers are normally synchronised to the previous midnight or Sunday, and increment at the beginning of each<br />
second, minute, hour or day.<br />
If the <strong>DT80</strong>'s date/time is set, the system timer channels will be updated to match the new time.<br />
The range of a system timer can be set using the channel factor. For example, 2ST(15) will count from 0 to 14, resetting<br />
every quarter hour, on the quarter hour.<br />
If the range is set to 0 then the timer will not reset, except at midnight (1-3ST) or midnight Sunday (4ST)<br />
If a system timer is explicitly set to a value, e.g. 1ST=12, then it will no longer necessarily be synchronised to the actual<br />
time. In this example, after being set 1ST will count up from 12 to 60, at which point it will reset back to 0 and start counting<br />
again. It will always differ from the time-of-day seconds count by a fixed offset.<br />
If a system timer's range is set, it will automatically be resynchronised to the actual time. Therefore 2ST(60) can be<br />
entered at any time to return 2ST to its default behaviour.<br />
If a system timer is set to a value outside its range, it is immediately adjusted so that it is in range. When you enter nST=x,<br />
you are actually doing nST=x mod range. Thus 2ST=62 will actually set 2ST to 2.<br />
Examples<br />
Assume the time is now 12:34:56. Then:<br />
2ST<br />
2ST 34 (34 minutes past the hour – counter resets on the hour)<br />
2ST(0)<br />
2ST 754 (754 minutes since midnight – counter resets at midnight only)<br />
2ST(22)<br />
2ST 6 (754 mod 22 – counter resets at midnight and every 22 minutes thereafter)<br />
2ST=1<br />
2ST 1 (counter is no longer synchronised to midnight)<br />
2ST(22)<br />
2ST 6 (setting range value resynchronises timer to current time)<br />
2ST will now increment every minute, resetting back to 0 each time it reaches 22. When midnight comes around, it will again<br />
be reset to 0.<br />
UM-0085-B2 <strong>DT80</strong> <strong>Series</strong> User’s <strong>Manual</strong> Page 32
Delay<br />
It is often useful to insert a fixed delay into a <strong>DT80</strong> program. There are two ways of doing this, each for a particular purpose.<br />
As discussed in Executing Commands in Schedules (P52), there is a distinction between channel definitions and<br />
commands. Channel definitions (1V, T, 5SDI12 etc) are executed as part of a schedule. Any commands (U, G, DELDATA<br />
etc.) triggered by the schedule (using ALARM or DO statements) will be queued but not executed until the schedule<br />
completes.<br />
The DELAY=n channel definition will insert a delay of n ms between two channel definitions. For example:<br />
RA20S 1WARN=1 DELAY=1000 1WARN=0<br />
will turn on the Attn LED, wait one second, then turn it off. (There are more better and more compact ways to do this, e.g.<br />
1WARN(1000,R)=1; the above is simply to illustrate a point.)<br />
On the other hand, the PAUSE n command will insert a delay of n ms between two commands. The following will do a similar<br />
thing to the previous example:<br />
RA20S DO{SATTN; PAUSE 1000; CATTN}<br />
In this case the SATTN and CATTN commands are used to turn the Attn LED on and off, rather than the 1WARN channel.<br />
Delay Accuracy<br />
The actual delay will not necessarily be exactly as specified. For delays of 20ms or less it will be close (within 1ms). For<br />
longer delays the resolution is +/- 16ms however it is guaranteed that the duration will be at least the specified time.<br />
For the DELAY channel type, the PT (precise timing) channel option may be specified to force a precise delay time, even if<br />
the duration is greater than 20ms. For example:<br />
DELAY(PT)=1000<br />
Note however that during this time all logger operations including communications, display updates and sampling will be<br />
suspended.<br />
Note Performing long delays using the DELAY channel or the PAUSE command is not recommended as it can prevent the<br />
timely evaluation of other schedules. This is true regardless of whether the PT option is specified.<br />
System Variables<br />
System variables provide various pieces of information about the state of the <strong>DT80</strong> and its current job. All system variables<br />
are read-only except where indicated as writable in the table below.<br />
As with any other channel type, SVs are, by default, displayed to one decimal place. Use the FFn channel option to vary this<br />
if required, e.g. 14SV(FF2)<br />
System<br />
Variable Function Notes Writable<br />
1SV Free space in the internal file system (B:) in kBytes<br />
2SV Used space in the internal file system (B:) in kBytes<br />
3SV Free space in USB memory device (A:) in kBytes, 0 if no memory device present<br />
4SV Used space in USB memory device (A:) in kBytes, 0 if no memory device present<br />
5SV External power status 0 = external power not connected<br />
1 = external power connected<br />
6SV Build number of the <strong>DT80</strong>’s firmware e.g. = 2 for firmware version 6.18.0002<br />
7SV Job loaded flag 0 = no current job<br />
1 = a job is loaded<br />
8SV Mains frequency setting in Hz (P11) Can be used to change P11 within a schedule <br />
9SV USB memory device presence 0 = none<br />
1 = USB memory device inserted<br />
10SV ID of the owning schedule 0 = RX schedule<br />
1 = RA schedule<br />
<br />
11 = RK schedule<br />
12 = immediate schedule<br />
11SV Returns 0.0 Can be used as thermocouple reference<br />
channel for cases where the thermocouple<br />
output is already compensated, e.g.<br />
RA1S 11SV(TR) 1TT<br />
12SV Decimal days since base date (00:00, 1-Jan-1989)<br />
13SV <strong>DT80</strong> serial number<br />
14SV Version number of the <strong>DT80</strong>’s firmware e.g. = 6.18 for firmware version 6.18.0002<br />
15SV Day number of the current year (integer) 0 = 1st of January<br />
16SV Host RS-232 port input handshake line states Bitmask, 0 to 15<br />
8 = RI, 4 = DCD, 2 = DSR, 1 = CTS<br />
17SV Host RS-232 port output handshake line states Bitmask, 0 to 3<br />
2 = DTR, 1 = RTS<br />
<br />
18SV Serial Channel input handshake line states (RS232 Bitmask, 0 to 1<br />
UM-0085-B2 <strong>DT80</strong> <strong>Series</strong> User’s <strong>Manual</strong> Page 33
System<br />
Variable Function Notes Writable<br />
mode only)<br />
1 = CTS<br />
Serial Channel output handshake line states Bitmask, 0 to 1<br />
19SV<br />
(RS232 mode only)<br />
1 = RTS<br />
20SV Current day of the month 1 - 31<br />
21SV Current month 1 - 12<br />
22SV Current year 1989 - 5999<br />
25SV<br />
Status of a modem connected to the <strong>DT80</strong>’s Host<br />
RS-232 port<br />
0 = no modem connected (direct connection<br />
assumed)<br />
1 = modem connected and no call in progress<br />
2 = modem connected and call in progress<br />
26SV Status of last NTP attempt 0 = no NTP requests have been attempted<br />
1 = time adjustment in process<br />
2 = last request successful<br />
-1..-5 = last request unsuccessful<br />
27SV Time discrepancy as at last NTP request in milliseconds<br />
29SV Status of last unload attempt 0 = no unloads have been attempted<br />
1 = unload in progress<br />
2 = last unload was successful<br />
-1..-9 = FTP connection error<br />
-10..-19 = transfer error<br />
-20..-29 = source store file error<br />
-99 = unload aborted by user<br />
30SV Number of logged data records for RX schedule -1 = no current job; or no storefile has been<br />
31SV Number of logged alarm records for RX schedule created for the specified schedule in the current<br />
job<br />
32SV Number of logged data records for RA schedule<br />
33SV Number of logged alarm records for RA schedule<br />
52SV<br />
53SV<br />
<br />
Number of logged data records for RK schedule<br />
Number of logged alarm records for RK schedule<br />
Table 2: <strong>DT80</strong> System Variables<br />
<br />
<br />
UM-0085-B2 <strong>DT80</strong> <strong>Series</strong> User’s <strong>Manual</strong> Page 34
Channel Options<br />
Overview<br />
All channel types can be modified in various ways by channel options, which define the way in which the input channel is<br />
managed when sampled. There are channel options that specify the type of sensor excitation, the termination of the input<br />
channel, scaling and linearization of the input signal, the format and destination of channel data, fixed channel gain values,<br />
resistance and bridge wiring methods, statistical operations on the channel data, and so on.<br />
As shown below, channel options are placed in round brackets immediately following the channel ID (channel number and<br />
type). If multiple channel options are specified then they should be separated by a comma (no spaces).<br />
RA2S 1TK 3R(4W) 2*V(0.1,GL3V,"Speed~km/h",FF0)<br />
In the above example:<br />
<br />
<br />
<br />
The first channel, 1TK, has no channel options specified so it will measure the thermocouple using default settings.<br />
The second channel (3R) includes the 4W channel option, which specifies that a 4-wire resistance measurement<br />
should be taken.<br />
Finally, the 2*V channel is in this case used to read a speed sensor which outputs a voltage that is directly<br />
proportional to speed (10mV per km/h). The 0.1 channel option is the channel factor, which for a voltage channel is<br />
interpreted as a simple scaling factor (mV * 0.1 = km/h). The GL3V (gain lock) option tells the <strong>DT80</strong> to select the 3V<br />
measurement range (rather than auto-ranging). The last two options concern the presentation of the data on the LCD<br />
display and in returned real-time data when in free format (/h) mode. In particular, they define the channel name and<br />
units, and specify that no decimal places be displayed (FF0).<br />
The channel's data will therefore be returned/displayed as:<br />
Speed 72 km/h<br />
instead of the default:<br />
2*V 721.3 mV<br />
Only certain channel options can be applied to each channel type. If an inappropriate channel option is applied (or an<br />
incompatible combination of options), the <strong>DT80</strong> notifies by returning an E3 - Channel option error message.<br />
The same channel can be put in the list more than once, with the same or different channel options. The <strong>DT80</strong> treats each<br />
occurrence as a separate measurement.<br />
A Special Channel Option — Channel Factor<br />
The <strong>DT80</strong>’s channel factor channel option is simply a floating point number. This number is interpreted in different ways<br />
depending on the channel type, as indicated by the following table.<br />
Channel Type<br />
Channel Factor’s function<br />
V, HV, Tx, LMx35, CV, SV, CALC, Scaling factor – for example, 1V(5.5) means multiply the reading by 5.5<br />
&name, MODBUS, SDI12, internal<br />
channels e.g. VBAT, REFT<br />
I, L, AD5xx, TMP17 (current) Resistance (ohms) of the external current shunt (the <strong>DT80</strong> uses this value and<br />
the voltage it measures across the shunt to calculate current flow)<br />
BGI (current excited bridge) Bridge arm resistance (ohms)<br />
BGV (voltage excited bridge) Offset adjustment (ppm)<br />
PT3xx, NI, CU (RTD)<br />
Resistance of the RTD element at 0°C (ohms)<br />
YSxx (thermistor)<br />
Value of connected parallel resistance (ohms)<br />
R (resistance)<br />
Offset adjustment (ohms)<br />
AS (state)<br />
Logic threshold value (mV)<br />
F, FW (frequency) Sample Period (ms)<br />
C, HSC, STx (counter, timer) Count modulo value (reset after every n counts)<br />
DN, DB, DNO, DBO (digital multiple) Bitmask (only channels with 1 in bitmask are read/output)<br />
DSO, WARN, RELAY, SSPWR Delay time (ms)<br />
(digital output)<br />
SERIAL<br />
Timeout (sec)<br />
For example, the three channel definitions in the schedule command<br />
RA30S 1V(10.1) 4PT385(200.0) 2DSO(100,R)=0<br />
contain channel factor channel options that instruct the <strong>DT80</strong> to do the following:<br />
UM-0085-B2 <strong>DT80</strong> <strong>Series</strong> User’s <strong>Manual</strong> Page 35
scale (multiply) the voltage measured on input channel 1 by 10.1<br />
<br />
use 200.0 (instead of the default 100.0 at 0°C) when calculating the temperature represented by the signal from<br />
the RTD on channel 4<br />
output a 100ms pulse on digital channel 2.<br />
Multiple Reports<br />
The <strong>DT80</strong> samples each channel in the channel list once every scan. However, by adding additional channel option sets<br />
(each set enclosed in round brackets) you can generate additional reports. That is, you can report the same data value in<br />
different ways.<br />
The first channel option set determines how the channel is sampled, and must include all sampling options required for the<br />
channel. These channel options are listed above the configuration line in the Channel Option Table (P38). Second and<br />
subsequent option sets may only contain reporting options (those below the configuration line.<br />
Multiple reports are particularly useful for statistical reports (see Statistical Report Schedules (P50)) in that several different<br />
statistical operations can be performed on the same data set.<br />
For Example:<br />
RA1H 3YS04(II,AV)(MX)(TMX)(MN)(TMN)<br />
defines five option sets. The first option set specifies one sampling option (II – use 2.5mA excitation) and returns the<br />
average temperature value, calculated over the period (1 hour in this case) since the last report scan. The remaining option<br />
sets will return the maximum reading over the same interval, the time at which it occurred, the minimum and the time of<br />
minimum.<br />
Remember that the first option set can contain options from any part of the channel option table, while subsequent option<br />
sets can only contain options from below the configuration line.<br />
Mutually Exclusive Options<br />
Options grouped by a shaded rectangle in the Mutual Exclusions column of the table below are mutually exclusive. If more<br />
than one channel option from a mutual exclusion group is placed in a channel list, only the last one specified is recognised.<br />
Order of Application<br />
The <strong>DT80</strong> applies channel options in a specific order, regardless of the order in which they are specified in a channel<br />
definition. The channel option table below lists the channel options more or less in the order of application.<br />
In general terms, the ordering is as follows:<br />
1. First, the raw value is sampled, taking note of sampling options, i.e. those relating to the physical measurement<br />
process. These include options in the input termination (T, U) , input attenuator (A, NA), resistance/bridge wiring (3W,<br />
4W), gain lock (GL30V, GL3V, GL300MV, GL30MV) and excitation (I, II, V, E, N) categories, along with NSHUNT,<br />
2V, ESn and MDn.<br />
The raw value may then be linearised according to the channel type, e.g. for thermocouples the appropriate<br />
polynomial will be applied to convert millivolts into a temperature value (in the units specified by P36).<br />
The resulting linearised value is then further processed as follows.<br />
2. The channel factor is then applied, if specified. For most channel types this is a simple scaling (multiplier) value.<br />
3. A user specified scaling option – a span (Sn), polynomial (Yn), thermistor scaling (Tn) or intrinsic function (Fn) – is<br />
then applied.<br />
4. The resulting scaled and linearised value may then be manipulated using a data manipulation option – difference<br />
(DF), time difference (DT), rate of change (RC), reading per time (RS) or integrate (IB).<br />
5. A digital manipulation option for measuring the timing of signal transitions may then be applied (TRR, TRF, TFR,<br />
TFF, TOR or TOF)<br />
6. The data value processed up to this point may then be used as a reference value for other measurements (TR, BR or<br />
TZ)<br />
7. The data value may then be accumulated using one or more statistical options (each one in a separate option set).<br />
Statistical channel options include AV, SD, MX, MN, TMX, TMN, DMX, DMN, IMX, IMN, INT, NUM and H (histogram).<br />
8. Finally, the resultant value after applying the above options (or values if multiple option sets are used) may be stored<br />
in a channel variable using =CV and op=CV options. Return, logging and/or display of the data may be disabled using<br />
the NR, NL, ND and W options, and output formatting can be specified using FFn, FEn and FMn and "name~units".<br />
UM-0085-B2 <strong>DT80</strong> <strong>Series</strong> User’s <strong>Manual</strong> Page 36
Default Channel Options<br />
All channel options have default values. The <strong>DT80</strong> follows a 3-step procedure to determine what options to apply:<br />
1. Start with the basic set of default options specified in the channel option table.<br />
2. If the channel type specifies any default options then they are applied, overriding any conflicting basic default options.<br />
Default options for each channel type are listed in the channel type table refer Table 1: <strong>DT80</strong> Channel Types (P30)<br />
3. Finally, if an option is explicitly specified in the channel definition then that setting is used, overriding any default<br />
setting. If more than one mutually exclusive option is specified then only the last one is used, e.g. 1V(AV,MX) is<br />
interpreted as 1V(MX). (If you want to output both the average and the maximum then use two separate option sets,<br />
i.e. 1V(AV)(MX).)<br />
For example, if you specify:<br />
1R(4W)<br />
then you are really specifying:<br />
1R(U,NA,N,ES0,MD10,FF1,I,3W,4W)<br />
In this case the basic default options are (U,NA,N,ES0,MD10,FF1). The R channel type specifies (I,3W) as its<br />
default options, so the (I) option (200µA excitation) overrides the (N) option (no excitation). Then the user specifies (4W)<br />
which overrides the R channel type's default wiring option setting (3W).<br />
UM-0085-B2 <strong>DT80</strong> <strong>Series</strong> User’s <strong>Manual</strong> Page 37
Channel Option Table<br />
Category Channel Option<br />
Input T<br />
Termination<br />
(<strong>DT80</strong>/81 <strong>Series</strong><br />
U<br />
1 only)<br />
default<br />
Input<br />
Attenuators<br />
Resistance<br />
and Bridge<br />
A<br />
NA<br />
default<br />
3W<br />
4W<br />
Mutual<br />
Excl<br />
Function<br />
Terminate +, – inputs with<br />
1M to AGND terminal<br />
Unterminate +, – inputs<br />
Enable ÷10 input<br />
attenuators<br />
Disable input attenuators<br />
3-wire measurement<br />
4-wire measurement<br />
Range of<br />
Option (n)<br />
Comment<br />
Provides input bias current path to ground to<br />
prevent inputs "floating" – particularly when<br />
independent (differential) inputs are used.<br />
Not required on <strong>DT80</strong> <strong>Series</strong> 2 or DT85 as a<br />
ground path is always present.<br />
Attenuators default ON for HV, AS channel<br />
types, OFF for other types.<br />
Specifies the number of wires run between<br />
the <strong>DT80</strong> and the resistance or bridge. More<br />
wires generally mean better accuracy.<br />
Gain lock<br />
Excitation<br />
(none)<br />
default<br />
GL30V<br />
GL3V<br />
GL300MV<br />
GL30MV<br />
I<br />
II<br />
Auto-range over 3 gain<br />
ranges<br />
Lock channel gain for<br />
±30V input signal range<br />
Lock channel gain for<br />
±3V input signal range<br />
Lock channel gain for<br />
±300mV input signal<br />
range<br />
Lock channel gain for<br />
±30mV input signal range<br />
Supply 200µA current<br />
excitation on * terminal<br />
Supply 2.5mA current<br />
excitation on * terminal<br />
V Supply approx. 4.5V<br />
voltage excitation on *<br />
terminal<br />
Selects between 3V, 300mV, 30mV ranges if<br />
input attenuators disabled<br />
Selects between 30V, 3V, 300mV ranges if<br />
input attenuators enabled<br />
Valid only if input attenuators are enabled<br />
Valid only if input attenuators are disabled<br />
Precision current source. Low excitation<br />
current minimises self-heating in resistive<br />
temperature sensors and allows high<br />
resistances to be measured.<br />
Precision current source. Higher excitation<br />
current allows more accurate measurement<br />
of low resistances (< 700Ω).<br />
Voltage source is not regulated<br />
Channel<br />
Factor<br />
Reference<br />
Offset<br />
E<br />
N<br />
default<br />
value<br />
Extra Samples ESn<br />
default = 0<br />
Measurement<br />
Delay<br />
Low Threshold LT<br />
Connect external<br />
excitation source (EXT *<br />
terminal) to channel's *<br />
terminal<br />
No excitation by <strong>DT80</strong><br />
(assumes externally<br />
applied excitation)<br />
Linearise/scale the<br />
measured value<br />
2V Measure relative to 2.5V<br />
rather than 0V<br />
MDn<br />
default = 10<br />
Perform n additional<br />
samples and average<br />
them<br />
After selecting channel,<br />
delay for n ms before<br />
starting measurement<br />
Set low input voltage<br />
thresholds for high speed<br />
counters<br />
depends<br />
on chan<br />
type<br />
Excite terminal (*) may be used as a<br />
shared-terminal input channel<br />
A scale factor or other parameter specific to<br />
channel type (see the channel factor column<br />
in Table 1: <strong>DT80</strong> Channel Types (P30))<br />
Used with F channel type to set threshold to<br />
+2.5V (suitable for TTL level input signals)<br />
rather than the default of 0V.<br />
0 to 30000 Can reduce noise. Total measurement time<br />
is n+1 mains periods. Analog channel types<br />
only.<br />
0 to 30000 Specifies the settling time required before a<br />
sensor can be measured. Default is 350ms<br />
for FW channel. Analog channel types only.<br />
Valid for 1HSC, 2HSC (<strong>DT80</strong>/81/85) and<br />
1PE (not DT81) channels.<br />
UM-0085-B2 <strong>DT80</strong> <strong>Series</strong> User’s <strong>Manual</strong> Page 38
Mutual<br />
Excl<br />
Category Channel Option Function<br />
Reset R Reset channel after<br />
reading<br />
Internal Shunt<br />
(<strong>DT80</strong>/81 <strong>Series</strong><br />
1 only)<br />
NSHUNT<br />
Disconnect internal 100R<br />
shunt between # terminal<br />
and AGND<br />
Range of<br />
Option (n)<br />
Comment<br />
Valid for C, HSC, ST and CV channel types,<br />
which are reset to 0 after returning their<br />
current value.<br />
Also valid for digital output channel types<br />
(DSO, DNO, DBO) which invert the state of<br />
each bit after returning its value.<br />
Allows # terminal to be used for shared-input<br />
voltage measurements<br />
Delay PT Force precise timing Valid for DELAY, DSO, WARN and RELAY<br />
channel types. Forces a precise (+/- 1ms)<br />
delay time even for long delays.<br />
Scaling Sn Apply span n 1 to 50<br />
(poly &<br />
Applies a previously-defined span<br />
See Spans (Sn) (P58))<br />
SRn Apply reversed span n<br />
span index<br />
is shared) Applies a span in reverse<br />
See Spans (Sn) (P58))<br />
Yn<br />
Apply polynomial n<br />
Applies a previously-defined polynomial<br />
See Polynomials (P59)<br />
Fn Apply intrinsic function n. 1 to 7 n Function<br />
1 1/x<br />
2 √x<br />
3 Ln(x)<br />
4 Log(x)<br />
5 Absolute(x)<br />
6 X 2<br />
Data<br />
Manipulation<br />
Digital<br />
Manipulation<br />
Reference<br />
Channel<br />
Tn<br />
DF<br />
DT<br />
RC<br />
RS<br />
IB<br />
TRR<br />
TRF<br />
TFR<br />
TFF<br />
TOR<br />
TOF<br />
TR<br />
Apply thermistor scaling<br />
(correction) n<br />
Difference<br />
Δx<br />
Time difference<br />
Δt<br />
Rate of change<br />
Δx / Δt<br />
Reading / time difference<br />
x / Δt<br />
"Integrate"<br />
( x – Δx / 2 ) Δt<br />
Time from rising edge to<br />
rising edge<br />
Time from rising edge to<br />
falling edge<br />
Time from falling edge to<br />
rising edge<br />
Time from falling edge to<br />
falling edge<br />
Time of rising edge<br />
Time of falling edge<br />
Use this channel's value<br />
as thermocouple<br />
reference junction<br />
temperature<br />
7 Gray code to binary conversion (16<br />
bit)<br />
1 to 20 Applies a previously-defined thermistor<br />
scaling equation<br />
See Thermistor Scaling(P59) and<br />
Temperature – Thermistors(P246)).).<br />
Returns the difference (xUnits) between the<br />
latest reading and the previous reading<br />
Time difference (seconds) between the latest<br />
reading and the previous reading<br />
Rate of change (xUnits per second) based on<br />
latest and previous readings and their<br />
respective times<br />
Rate of change (xUnits per second). Useful<br />
when the sensor reading is already a<br />
difference (e.g. resetting counters)<br />
"Integration" with respect to time (xUnits .<br />
seconds) between the latest and the previous<br />
readings (area under curve)<br />
Normally used for digital channels.<br />
If used on analog channels then channel<br />
factor is interpreted as a threshold value.<br />
Any non-thermocouple temperature sensor<br />
measuring isothermal block temperature.<br />
If already compensated use 11SV(TR) as<br />
reference channel (11SV always returns 0.0).<br />
TR channel temperature is used for all<br />
subsequent thermocouple measurements in<br />
this schedule<br />
UM-0085-B2 <strong>DT80</strong> <strong>Series</strong> User’s <strong>Manual</strong> Page 39
Category<br />
SDI-12<br />
Modbus<br />
Channel Option<br />
TZ<br />
Mutual<br />
Excl<br />
Function<br />
Use this channel's value<br />
to correct the <strong>DT80</strong>'s<br />
electrical zero<br />
Range of<br />
Option (n)<br />
BR<br />
Use this channel's value<br />
as bridge excitation<br />
voltage<br />
ADn Sensor address 0 to 9<br />
Rnnn Register to read 1 to 999<br />
CM<br />
Configure sensor to<br />
measure continuously<br />
ADn Sensor address (serial) 1 to 247<br />
Comment<br />
This zero would be measured at the<br />
isothermal block<br />
TZ channel zero is used for all subsequent<br />
thermocouple measurements in this<br />
schedule<br />
BR channel voltage used for all subsequent<br />
BGV measurements in this schedule<br />
See SDI-12 Channel (P270)<br />
See Modbus Channel (P288)<br />
AD"ip-addr" Sensor address (TCPIP) IP address<br />
Rt:rrrrr:b Register(s) to read or<br />
write<br />
0:0 to<br />
4:65536<br />
MBtype<br />
data type: int16,<br />
unsigned16, int32,<br />
I, U, L, F,<br />
LE, FE<br />
float32, Enron int32,<br />
Enron float32<br />
MEorder<br />
32-bit word order: S, R<br />
standard, reversed<br />
TOn comms timeout (sec) 1 to 255<br />
RTn max retries 0 to 25<br />
MUIDn unit id 0 to 255<br />
Serial Channel "commands" Input and output actions ASCII text See Generic Serial Channel (P275)<br />
Rainflow Cycle RAINFLOW<br />
Analysis<br />
CONFIGURATION LINE (see Multiple Reports (P36))<br />
Statistical AV<br />
Average of channel<br />
readings<br />
SD<br />
Standard deviation of<br />
channel readings<br />
See Statistical<br />
Channel<br />
Options (P68)<br />
MX<br />
MN<br />
TMX<br />
TMN<br />
DMX<br />
DMN<br />
IMX<br />
IMN<br />
INT<br />
Maximum channel<br />
reading<br />
Minimum channel reading<br />
Time of maximum<br />
channel reading<br />
Time of minimum channel<br />
reading<br />
Date of maximum channel<br />
reading<br />
Date of minimum channel<br />
reading<br />
Instant (time and date) of<br />
maximum<br />
Instant (time and date) of<br />
minimum<br />
Integral for channel<br />
(using time in seconds)<br />
See Rainflow Cycle Counting (P71)<br />
These channel options link the channel to the<br />
statistical sub-schedule RS. The channel is<br />
sampled at times determined by the RS<br />
trigger (which defaults to 1S).<br />
At the report time as determined by the report<br />
schedules, the statistical summary is<br />
reported. If insufficient samples have been<br />
taken before the reporting time, an error is<br />
reported (NotYetSet).<br />
.<br />
Variables<br />
See Channel<br />
Variables<br />
(nCV) (P61)<br />
NUM<br />
Number of samples in<br />
statistical calculation<br />
Hx:y:m..nCV Histogram x, y ±1e18<br />
m, n<br />
1-1000<br />
=nCV<br />
+=nCV<br />
Assign channel reading to<br />
channel variable.<br />
nCV = reading<br />
Add channel reading to<br />
channel variable.<br />
1 to 1000<br />
1 to 1000<br />
Divide data range x to y into discrete buckets<br />
and accumulate in CVs the number of<br />
samples in each bucket<br />
See Histogram (Hx:y:m..nCV) (P70)<br />
Channel variables are like memory registers<br />
in a calculator. They can be assigned directly<br />
(e.g. 1CV=2.5), or assigned a channel<br />
reading at scan time (e.g. 1V(=7CV)).<br />
UM-0085-B2 <strong>DT80</strong> <strong>Series</strong> User’s <strong>Manual</strong> Page 40
Category<br />
Destination<br />
Output Data<br />
Format<br />
Channel Option<br />
–=nCV<br />
*=nCV<br />
/=nCV<br />
=m..nCV<br />
(MODBUS<br />
channel only)<br />
Mutual<br />
Excl<br />
Function<br />
nCV = nCV + reading<br />
Subtract channel reading<br />
from channel variable.<br />
nCV = nCV – reading<br />
Multiply channel variable<br />
by channel reading.<br />
nCV = nCV * reading<br />
Divide channel variable by<br />
channel reading.<br />
nCV = nCV ÷ reading<br />
Assign values to a range<br />
of CVs<br />
Range of<br />
Option (n)<br />
1 to 1000<br />
1 to 1000<br />
1 to 1000<br />
Comment<br />
The contents of a variable can also be read,<br />
modified and then updated. For example<br />
1V(/=7CV) means that the value of 7CV is<br />
divided by the reading on channel 1 and the<br />
result is returned to 7CV.<br />
Note that these actions occur only at report<br />
time and not during statistical sampling.<br />
NR No return Channels tagged with NR are not returned to<br />
the host computer (they may still be logged or<br />
displayed).<br />
NL No log Channels tagged with NL are not logged<br />
(they may still be returned or displayed).<br />
ND No display Channels tagged with ND are not displayed<br />
on the LCD (they may still be returned or<br />
logged).<br />
W Working channel Same as (NR,NL,ND)<br />
Working channels are usually used to hold<br />
intermediate values in calculations.<br />
LM Log alarm measurement Log the value being tested in an alarm.<br />
Ignored for non-alarm channels.<br />
FFn<br />
default = 1<br />
FEn<br />
FMn<br />
BGmin:max<br />
Fixed-point format<br />
n=decimal places<br />
Exponential format,<br />
n=decimal places<br />
Mixed: FF or FE,<br />
n=significant digits<br />
0 to 7<br />
0 to 7<br />
0 to 7<br />
Specifies numeric format for display and free<br />
format (/h) real-time data.<br />
For example, FF2 returns 71.46 mV<br />
For example, FE2 returns 7.14e1 mV<br />
FMn uses exponential format if exponent is<br />
less than –4 or greater than n<br />
Show value as a bargraph on the display.<br />
Channel name<br />
and Units<br />
Table 3: <strong>DT80</strong> Channel Options<br />
"name"<br />
User-specified name<br />
Default units<br />
"name~unit" User-specified name<br />
User-specified units<br />
"name~" User-specified name<br />
No units<br />
"~unit"<br />
No channel name<br />
User-specified units<br />
"~" No channel name<br />
No units<br />
ASCII text Allows channel name and/or units to be<br />
overridden for display and free format (/h)<br />
real-time data.<br />
Max 24 characters for user-specified channel<br />
name; 10 characters for units.<br />
UM-0085-B2 <strong>DT80</strong> <strong>Series</strong> User’s <strong>Manual</strong> Page 41
Part C – Schedules<br />
Schedule Concepts<br />
What are Schedules<br />
Schedules are the workhorses of the <strong>DT80</strong>. They are the underlying structures that you use to manage the repetitive<br />
processes of the <strong>DT80</strong> such as<br />
scanning input channels<br />
evaluating calculations<br />
processing alarms<br />
managing output channels<br />
returning data to a host computer<br />
logging data.<br />
The <strong>DT80</strong> supports the following schedules:<br />
11 general purpose schedules, A-K, which can be triggered by a variety of different events<br />
a polled schedule, X, which is normally triggered by a poll command from the host computer (although most of the<br />
other triggers can also be applied to it, making it effectively a 12 th general purpose schedule)<br />
the immediate schedule, which executes once immediately after being entered<br />
the statistical schedule, which collects and accumulates data to be returned as statistical summaries by the other<br />
schedules.<br />
Schedule Syntax<br />
A typical schedule definition is shown below:<br />
RA"Test1"("B:",DATA:OV:14D)2S 1TK 6R(4W) 7TT<br />
Schedule<br />
ID<br />
Schedule<br />
Name<br />
Schedule Options<br />
Figure 7: Components of a typical schedule command<br />
Schedule<br />
Trigger<br />
Channel List<br />
A schedule consists of a number of parts. Firstly the Schedule ID, next the schedule options and finally the schedule trigger.<br />
There are no spaces between the different parts<br />
Schedule ID<br />
RA"Test1"("B:",DATA:OV:14D)2S 1TK 3R(4W) 2DS<br />
Schedule<br />
ID<br />
Schedule<br />
Name<br />
Schedule Options<br />
Schedule<br />
Trigger<br />
Channel List<br />
The Schedule ID consists of the letter R ("Report schedule") followed by a letter identifying the schedule.<br />
Each schedule has a unique identifier; these are summarized in the following table:<br />
Schedule ID<br />
Quantity<br />
Report schedules (P45) RA, RB, RC, RD, RE, RF, 11 available<br />
RG, RH, RI, RJ, RK<br />
Polled schedule (P49) RX 1 available<br />
Immediate report schedule No schedule ID<br />
Each time you enter an immediate<br />
(P49)<br />
schedule it replaces the previous one, if<br />
any.<br />
Statistical sub-schedule (P50) RS 1 available, but is applied to one or more<br />
of the other report schedules<br />
UM-0085-B2 <strong>DT80</strong> <strong>Series</strong> User’s <strong>Manual</strong> Page 42
Schedule Name<br />
RA"Test1"("B:",DATA:OV:14D)2S 1TK 3R(4W) 2DS<br />
Schedule<br />
ID<br />
Schedule<br />
Name<br />
Schedule Options<br />
Schedule<br />
Trigger<br />
Channel List<br />
The schedule name is optional, and consists of text (max 20 characters) enclosed in double quotes. This name is used in<br />
reports and is normally used to document the purpose of a given schedule.<br />
Schedule Options<br />
RA"Test1"("B:",DATA:OV:14D)2S 1TK 3R(4W) 2DS<br />
Schedule<br />
ID<br />
Schedule<br />
Name<br />
Schedule Options<br />
Schedule options are enclosed in brackets. They define:<br />
Schedule<br />
Trigger<br />
Channel List<br />
where to log the data and alarms generated by the schedule (i.e. internal file system or removable USB device)<br />
the amount of space to allocate for storing data records, and whether old records are to be overwritten when it is full.<br />
the amount of space to allocate for storing alarm records, and whether old records are to be overwritten when it is full.<br />
For more details on how data logging works, see Logging Data (P84)<br />
The schedule option syntax is as follows:<br />
(Dest,DATA:DataOverwrite:DataSize,ALARMS:AlarmOverwrite:AlarmSize:AlarmWidth)<br />
Item Possible Values Explanation<br />
Dest<br />
"A:"<br />
Logged data and alarm information from this schedule will be written<br />
directly to the USB memory device (not normally recommended, see<br />
Logging Options (P86))<br />
"B:"<br />
Logged data and alarm information from this schedule will be stored<br />
on the internal flash disk (default)<br />
DataOverwrite<br />
OV<br />
Data for this schedule will be overwritten when the data store is full<br />
(default)<br />
NOV<br />
Data will not be overwritten when the data store is full. When the data<br />
store fills logging will stop and the Attn LED will flash<br />
DataSize<br />
nB<br />
Allocate n bytes for storing data for this schedule<br />
nKB<br />
Allocate n kilobytes for storing data for this schedule<br />
nMB<br />
Allocate n megabytes for storing data for this schedule<br />
nR<br />
Allocate space for n data records for this schedule<br />
nS Note 1<br />
Allocate space for n seconds worth of data for this schedule<br />
nM Note 1<br />
Allocate space for n minutes worth of data for this schedule<br />
nH Note 1<br />
Allocate space for n hours worth of data for this schedule<br />
nD Note 1<br />
Allocate space for n days worth of data for this schedule<br />
AlarmOverwrite<br />
OV<br />
Alarms for this schedule will be overwritten when the store is full<br />
(default)<br />
NOV<br />
Alarms will NOT be overwritten when the store is full. When the store<br />
fills logging will stop and the ‘Attn’ LED will flash<br />
AlarmSize<br />
nB<br />
Allocate n bytes for storing alarms for this schedule<br />
nKB<br />
Allocate n kilobytes for storing alarms for this schedule<br />
nMB<br />
Allocate n megabytes for storing alarms for this schedule<br />
nR<br />
Allocate space for n alarm records for this schedule<br />
AlarmWidth Wn Allocate n bytes for storing each alarm string (default=60 bytes)<br />
Note 1: These are only valid for time-triggered schedules (not for polled or event triggered schedules). Furthermore, if the<br />
schedule rate is changed after the job has started running then the store file may no longer contain data for the indicated time<br />
span.<br />
Default Schedule Options<br />
All schedule options are optional. Default settings are:<br />
Destination is B: (internal flash drive)<br />
New data and alarms overwrite earlier data/alarms once the store file fills<br />
Space allocated for data is 1MB<br />
UM-0085-B2 <strong>DT80</strong> <strong>Series</strong> User’s <strong>Manual</strong> Page 43
Space allocated for alarms is 100KB<br />
Space allocated for each logged alarm text string is 60 bytes.<br />
Examples<br />
RA"Fred"(DATA:NOV:15D)15M<br />
Schedule A is given the name "Fred". Data and alarms are stored on the internal drive and sufficient space is allocated for<br />
1440 readings (15 days worth, based on a 15 minute scan rate). In this case earlier data is considered more valuable than<br />
later data, so no-overwrite mode is selected. If any alarms are defined in this schedule they will use the default storage<br />
parameters (100KB, overwrite enabled)<br />
Schedule Trigger<br />
RA"Test1"("A:",DATA:OV:14D)2S 1TK 3R(4W) 2DS<br />
Schedule<br />
ID<br />
Schedule<br />
Name<br />
Schedule Options<br />
Schedule<br />
Trigger<br />
Channel List<br />
All schedules have a trigger, which defines when the schedule is to execute the processes assigned to it. Here are the<br />
<strong>DT80</strong>’s schedule triggers:<br />
an interval of time, see Trigger on Time Interval (P45)<br />
an external event (such as a digital input transition), see Trigger on External Event (P46)<br />
an internal event (such as a CV changing), see Trigger on Internal Event (P47)<br />
a poll command, see Trigger on Schedule-Specific Poll Command (P47)<br />
Triggers can also be conditional upon an external or internal state (that is, trigger only while a particular external state or<br />
internal state exists) — see Trigger While (P48).<br />
Channel List<br />
RA"Test1"("A:",DATA:OV:14D)2S 1TK 3R(4W) 2DS<br />
Schedule<br />
ID<br />
Schedule<br />
Name<br />
Schedule Options<br />
Schedule<br />
Trigger<br />
Channel List<br />
Most often schedules will be created that instruct the <strong>DT80</strong> to carry out channel-related tasks, such as scanning one or more<br />
of its input channels and/or setting one or more of its output channels. When these schedules are created, group the channel<br />
details (their IDs and optional instructions) together in a channel list within the schedule. Figure 7 (P42) shows a typical<br />
schedule — notice its schedule header and channel list components.<br />
A channel list may contain just one channel entry or many, and each channel in the list must be separated from the next by<br />
one or more space characters. Similarly, a schedule’s header must be separated from its channel list by one or more space<br />
characters.<br />
The <strong>DT80</strong> processes the channels in a channel list from left to right.<br />
Example — Channel List<br />
The channel list<br />
1V 3R 5..7DS 4TK("Boiler Temp") 3DSO=0<br />
specifies the following channels (each is separated from the next by a space character):<br />
1V — read analog input channel 1 as a voltage<br />
3R — read analog input channel 3 as a resistance<br />
5..7DS — read the state of digital input channels 5 through 7 (inclusive)<br />
4TK("Boiler Temp") — read analog input channel 4 as a type K thermocouple and assign it the name Boiler<br />
Temp<br />
3DSO=0 — set digital state output channel 3 low<br />
Note that the example above is only a channel list and not a complete schedule. Here’s the same channel list used in a<br />
schedule (the schedule header RJ2M has been added):<br />
RJ2M 1V 3R 5..7DS 4TK("Boiler Temp") 3DSO=0<br />
The header identifies the schedule as Report schedule J that runs every 2 Minutes.<br />
A Simple Schedule<br />
A schedule comprises a schedule ID (schedule identifier), a trigger that determines when the schedule runs, and a list of<br />
processes to be carried out every time the schedule runs. For example, the schedule<br />
RA10M 1V 3R<br />
UM-0085-B2 <strong>DT80</strong> <strong>Series</strong> User’s <strong>Manual</strong> Page 44
specifies report schedule A as follows:<br />
<br />
<br />
<br />
<br />
RA — schedule ID<br />
If logging is enabled then data will be stored to the internal flash disk, 1MB will be allocated and old data will be<br />
overwritten when full. This schedule does not define any alarms, so no alarm storage will be allocated.<br />
10M — trigger (run the schedule every 10 minutes)<br />
1V 3R — channel list<br />
Groups of Schedules — Jobs<br />
A <strong>DT80</strong> job is essentially a group of one or more schedules (each specifying a set of processes) that performs the overall<br />
task.<br />
It’s entirely at the user’s discretion how the processes of an overall task are allocated between schedules; there are no<br />
hard-and-fast rules. For example, choose to differentiate schedules on the basis of function or purpose — some collect<br />
primary data, others perform intermediate calculations, others process alarms, and yet others are responsible for returning<br />
and logging data; or choose to assign a schedule to a single channel, such as the <strong>DT80</strong>’s Serial Channel.<br />
See also Jobs (P21).<br />
Types of Schedules<br />
General-Purpose Report Schedules (RA, RB,…RK)<br />
The <strong>DT80</strong> supports eleven general-purpose report schedules, which you use to carry out the repetitive processes of<br />
scanning input channels, evaluating calculations, handling alarms, managing output channels, returning and logging data,<br />
and so on.<br />
These report schedules have the identifiers RA, RB, RC, RD, RE, RF, RG, RH, RI, RJ and RK.<br />
A report schedule executes the processes assigned to it whenever it is triggered. A schedule trigger can be<br />
an interval of time<br />
an external event<br />
an internal event<br />
a poll request from a host computer.<br />
Trigger on Time Interval<br />
0 1 2<br />
3 4 5 6<br />
7<br />
RA2M… RA2M… RA2M… RA2M…<br />
Every 2 minutes<br />
Figure 8: Time interval schedule<br />
Report schedules can be triggered at regular intervals of time, determined by the <strong>DT80</strong>’s real-time clock. Intervals can be an<br />
integer number of seconds, minutes, hours or days:<br />
Trigger Run every n Range<br />
nD Days 1 – 65535<br />
nH Hours 1 – 65535<br />
nM Minutes 1 – 65535<br />
nS Seconds 1 – 65535<br />
nT Milliseconds (Thousandths of seconds) 5 – 65535<br />
none Continuous<br />
Note The schedule first runs on the next multiple of the interval since last midnight (see Time Triggers — Synchronizing to<br />
Midnight (P52)), and subsequently runs every multiple of the interval thereafter. If the interval is not an even multiple of 24<br />
hours, the <strong>DT80</strong> inserts a short interval between the last run of the schedule prior to midnight, and the run of the schedule<br />
beginning at midnight.<br />
Examples — Trigger by Time Interval<br />
The following schedule will execute every 5 seconds:<br />
RA5S<br />
The following schedule will execute continuously (as fast as possible):<br />
RG<br />
UM-0085-B2 <strong>DT80</strong> <strong>Series</strong> User’s <strong>Manual</strong> Page 45
Trigger on External Event<br />
RA1E… RA1C(5)… RA1SERIAL"AbC"…<br />
Any event on<br />
digital input 1<br />
After 5 counts on<br />
counter 1<br />
Figure 9: Various external event schedules<br />
Text AbC arrives on<br />
Serial Channel<br />
Report schedules can also be triggered by external events, which are manifested to the logger as state changes on the<br />
digital input channels nDS, or as pulses on the counter channels nC:<br />
Trigger<br />
nE<br />
n+E<br />
n-E<br />
m..nE<br />
Action<br />
Trigger on a rising or falling transition of digital input channel n<br />
Trigger on a rising transition of digital input channel n<br />
Trigger on a falling transition of digital input channel n<br />
Trigger on a rising or falling transition of any of digital input channels m..n<br />
m..n+E<br />
Trigger on a rising transition of any of digital input channels m..n<br />
m..n–E<br />
Trigger on a falling transition of any of digital input channels m..n<br />
nC(c)<br />
Trigger when low speed counter channel n "wraps around" (i.e. is reset to<br />
0), which will occur when a count value of c is reached.<br />
nHSC(c)<br />
Trigger when high speed counter channel n "wraps around" (i.e. is reset to<br />
0), which will occur when a count value of c is reached.<br />
nSERIAL"text" Trigger on the arrival of characters (from an external serial device) at the<br />
<strong>DT80</strong>’s Serial Channel (serial sensor port if n = 1, host port if n = 2). The<br />
trigger can be of the form<br />
1SERIAL"", where any character arriving triggers the schedule (note that<br />
there is no space between ""), or<br />
1SERIAL"AbC", where arrival of the exact string AbC triggers the<br />
schedule.<br />
See Triggering Schedules (P283).<br />
where:<br />
n is a digital channel number<br />
m..n is a sequence of digital channel numbers (see Digital Channels (P259))<br />
text is a string of characters arriving at the <strong>DT80</strong>’s Serial Channel terminals from an external serial device<br />
Note: For edge triggering the minimum pulse width is approximately 16ms.<br />
Triggering on Preset Counters<br />
If a counter is preset to a value greater than its specified trigger count, the schedule is not triggered. For example, a schedule<br />
set to trigger after 10 counts on digital counter 2 (2C(10)) cannot be triggered if counter 2 is assigned a value of 15.<br />
Examples — Trigger on Digital Channel Event<br />
The schedule header<br />
RC1E<br />
instructs the <strong>DT80</strong> to run report schedule C on every transition of digital input 1D.<br />
The following schedule will run whenever digital input 3D receives a low to high (positive/rising) transition:<br />
RA3+E<br />
Examples — Trigger on Counter Event<br />
The following schedule will run on every 100 th pulse received on high speed counter input 1C:<br />
RA1HSC(100)<br />
In this case counter 1HSC will count from 0 to 99 then reset to 0, at which time the schedule will trigger. This means that if<br />
you read the value of 1HSC within this schedule then it will generally always read 0.<br />
The following schedule will on every second pulse received on digital input 1D:<br />
RA1C(2)<br />
Examples — Trigger on Serial Channel Event<br />
The following schedule will run if the specific character sequence Pasta8zZ is received on the serial sensor port:<br />
RB1SERIAL"Pasta8zZ"<br />
The following schedule will run each time any string is received on the host port (assuming the port has been configured for<br />
serial channel operation):<br />
RG2SERIAL""<br />
UM-0085-B2 <strong>DT80</strong> <strong>Series</strong> User’s <strong>Manual</strong> Page 46
Trigger on Internal Event<br />
RA1CV…<br />
Any change of 1CV<br />
to or from zero<br />
Figure 10: Internal event (CV change) schedule<br />
Report schedules can also be triggered by internal events, this must be specified to the <strong>DT80</strong> as channel variables (CVs)<br />
changing value:<br />
Trigger<br />
nCV<br />
n+CV<br />
n–CV<br />
Action<br />
Trigger on any change of nCV to zero or from zero<br />
Trigger on any change of nCV from zero<br />
Trigger on any change of nCV to zero<br />
where n is the channel variable number. (See Channel Variables (nCV) (P61).<br />
Examples — Trigger on Internal Event<br />
The schedule header<br />
RK6CV<br />
instructs the <strong>DT80</strong> to run Report schedule K upon any change of channel variable 6 to or from zero. For instance, the<br />
schedule RK<br />
will trigger when 6CV changes from 0.0 to 1.0, from 0.06 to 0.0, or from –1.3 to 0.0<br />
will not trigger when 6CV changes from 0.0 to 0.0, 7.0 to 6.0, or from –112.3 to 0.001.<br />
The schedule header<br />
RK12+CV<br />
instructs the <strong>DT80</strong> to run Report schedule K whenever the value of channel variable 12 changes from 0 to any value.<br />
Trigger on Schedule-Specific Poll Command<br />
RAX…<br />
XA poll command from <br />
host computer or <strong>DT80</strong> alarm<br />
Figure 11: Polled schedule<br />
Instead of a time or event trigger, the poll trigger (X) can be applied to a report schedule. Then the schedule can be polled<br />
(that is, information requested) at any time by the appropriate schedule-specific poll command Xa (where a is the schedule<br />
letter).<br />
The poll command can be issued<br />
by a host computer, or<br />
by an alarm action (see Using an Alarm to Poll a Schedule (P81)).<br />
See also Digital Outputs (P261)<br />
Example — Trigger on Schedule-Specific Poll Command<br />
The schedule<br />
RDX 1..3TK<br />
samples analog channels 1 to 3 as type K thermocouples (1..3TK) whenever the <strong>DT80</strong> receives an XD poll command (that<br />
is, whenever it receives the character sequence XD) either from a connected computer, or by means of an alarm action from<br />
within the <strong>DT80</strong>.<br />
Using Poll Commands with Standard Report Schedules<br />
0 1 2<br />
3 4 5 6<br />
7<br />
RA2M… RA2M… RA2M… RA2M…<br />
RA2M…<br />
Every 2 minutes<br />
Additional scan triggered by XA poll command<br />
from host computer or <strong>DT80</strong> alarm<br />
Figure 12: Polling a time interval schedule<br />
XA<br />
A report schedule defined with a time or event trigger can also be polled by its appropriate poll command at any time. For<br />
example, the report schedule<br />
RC5M 1V 2V 3V<br />
normally runs every 5 minutes (5M), but it can also be run at any time by an XC poll command (from the host computer or an<br />
alarm).<br />
For schedules that have a long interval, this is useful for checking that a sensor is functioning.<br />
UM-0085-B2 <strong>DT80</strong> <strong>Series</strong> User’s <strong>Manual</strong> Page 47
Trigger While<br />
While condition<br />
Interval-triggered schedules<br />
TRUE<br />
RA2M… RA2M… RA2M… RA2M…<br />
Event-triggered schedules<br />
RB1E… RD1C(5)… RK1CV…<br />
Poll-triggered schedules<br />
RJX… RGX…<br />
RHX… RIX…<br />
Only these schedule instances are<br />
enabled ready for triggering.<br />
Figure 13: Schedule "while" condition<br />
A report schedule’s trigger can be enabled or disabled by an external condition. This is called the While condition — that is,<br />
trigger only while the external or internal condition is true.<br />
The While condition can be either<br />
states on one or more of the <strong>DT80</strong>’s digital input channels (nDS), or<br />
<br />
internal conditions specified to the <strong>DT80</strong> as states of channel variables:<br />
While clause<br />
:nW<br />
:n~W<br />
:m..nW<br />
:m..n~W<br />
:nCV<br />
:n~CV<br />
Action<br />
Enable schedule While digital input n is high (true)<br />
Enable schedule While digital input n is low (false)<br />
Enable schedule While ANY digital input m to n is high (true)<br />
Enable schedule While ANY digital input m to n is low (false)<br />
Enable schedule While nCV is non-zero<br />
Enable schedule While nCV is zero<br />
Note that the colon (:) is required.<br />
Examples — While Condition<br />
The schedule header<br />
RA1E:2W<br />
instructs the <strong>DT80</strong> to run Report schedule A on every transition of digital input 1 (1E) only while digital input 2 is high (:2W).<br />
The schedule header<br />
RD1S:4~W<br />
instructs the <strong>DT80</strong> to run Report schedule D every second (1S) while digital input 4 is low (:4~W).<br />
The schedule header<br />
RK2H:9W<br />
instructs the <strong>DT80</strong> to run Report schedule K every two hours (2H) while digital input 9 is high (:9W).<br />
The schedule header<br />
RC5M:12CV<br />
instructs the <strong>DT80</strong> to run Report schedule C every 5 minutes (5M) while channel variable 12 is not zero (:12CV).<br />
The schedule header<br />
RF6..8E:5W<br />
instructs the <strong>DT80</strong> to run Report schedule F on any transition of digital channels D6, D7 or D8 (6..8E) while digital input 5<br />
is high (:5W).<br />
Continuous Report Schedules (No Trigger)<br />
RA… RA… RA… RA… RA… RA… RA… RA… RA…<br />
Received by <strong>DT80</strong><br />
Figure 14: Continuous schedule<br />
Report schedules that run continuously can be created. These schedules start scanning as soon as they are received by the<br />
<strong>DT80</strong> (they are not activated by a trigger), and run until it is stopped (by sending a halt command or resetting the <strong>DT80</strong>, for<br />
example).<br />
Define a continuous schedule simply by omitting the trigger from a report schedule.<br />
Example — Continuous Schedule<br />
Sending<br />
RA 1TK 2R(3W) 3TT<br />
causes the <strong>DT80</strong> to scan channels 1, 6 and 7 continuously.<br />
UM-0085-B2 <strong>DT80</strong> <strong>Series</strong> User’s <strong>Manual</strong> Page 48
Special-Purpose Report Schedules<br />
Polled Report Schedule (RX)<br />
RX…<br />
X poll command from<br />
host computer or <strong>DT80</strong>0 alarm<br />
Figure 15: Polled X schedule<br />
The polled schedule is a report schedule with a trigger of "request information now" command issued<br />
<br />
<br />
by a host computer connected to the <strong>DT80</strong> during data acquisition, or<br />
by an alarm action (see Using an Alarm to Poll a Schedule (P81)).<br />
The <strong>DT80</strong> supports one polled schedule. It is specified by the RX schedule ID, and triggered by an X poll command (that is,<br />
by an X character followed by CR) sent from the host computer or from an alarm.<br />
Channels, calculations and alarms included in a polled schedule are processed, reported and/or logged once every time the<br />
<strong>DT80</strong> receives an X poll command.<br />
Note that underneath, the X schedule is really the same as the general purpose schedules. It can therefore be used as a 12 th<br />
general purpose schedule, except that:<br />
<br />
<br />
the continuous trigger is not available. The syntax RX is treated the same as RXX, i.e. it specifies a polled trigger, not<br />
a continuous trigger,<br />
a single X character can be used to poll the schedule, which is treated the same as XX.<br />
Example — Polled Report Schedule<br />
The schedule<br />
RX 1V 2V<br />
runs once every time the <strong>DT80</strong> receives an X (or XX) command.<br />
Immediate Report Schedules<br />
3TK…<br />
Schedule received by <strong>DT80</strong><br />
3TK…<br />
Send * to re-run<br />
Figure 16: Immediate schedule<br />
Instead of scanning according to time or event triggers, immediate schedules run immediately — and once only — when<br />
they are received by the <strong>DT80</strong>.<br />
An immediate schedule is simply a list of input channels, output channels, calculations and/or alarms with no schedule<br />
header (that is, no schedule ID and no trigger). The <strong>DT80</strong> executes the list (up to the next carriage return) immediately and<br />
once only.<br />
Note Any data resulting from an immediate schedule is returned to the host computer, but is not logged.<br />
Example — Immediate Report Schedule<br />
Sending<br />
1TK 2R(3W) 3TT<br />
causes the <strong>DT80</strong> to immediately scan channels 1, 6 and 7 once only and return the data. Notice that this schedule has no<br />
schedule ID and no trigger.<br />
Cautions for Using Immediate Schedules<br />
When programming the <strong>DT80</strong>, give an immediate schedule time to execute before issuing a following BEGIN command,<br />
otherwise the immediate schedule’s data may not be returned. Using DeTransfer can be helpful, by inserting a \W wait<br />
command (for example, \W5, which pauses program execution for five seconds — between immediate schedule commands<br />
and a BEGIN command.<br />
If successive immediate schedules are entered too rapidly, then the channels may be appended as if they were part of a<br />
single schedule. Setting P22=13 (see P22 (P199)) can overcome this by ensuring a return character is placed after each<br />
reading.<br />
Re-Running an Immediate Schedule<br />
The last-entered immediate schedule can be run again by sending the * (asterisk) command — that is, by sending a *<br />
character.<br />
UM-0085-B2 <strong>DT80</strong> <strong>Series</strong> User’s <strong>Manual</strong> Page 49
Statistical Report Schedules<br />
0 1 2<br />
3 4 5 6<br />
7<br />
RA3M 1V(AVE)… RA3M 1V(AVE)… RA3M 1V(AVE)…<br />
Every 3 minutes<br />
Statistical sub-schedule<br />
samples<br />
Statistical result<br />
returned every 3 minutes<br />
Figure 17: Statistical and report schedules<br />
Statistical report schedule<br />
Statistical sub-schedule<br />
A report schedule can instruct the <strong>DT80</strong> to return statistical information (average, SD, max., min.,…) for one or more<br />
channels. The <strong>DT80</strong> does this by<br />
scanning its input channels and executing calculations at frequent intervals of time, then<br />
retaining intermediate values to produce a statistical data summary at longer intervals.<br />
Note that there are two schedules involved:<br />
The primary statistical data is collected at frequent intervals, which are determined by the statistical sub-schedule<br />
RS.<br />
The statistical data summary (average, SD,…) is returned and logged at longer intervals, which are determined by the<br />
report schedule that is requesting the statistical information — the statistical report schedule.<br />
Think of the statistical sub-schedule as a fast schedule (the slave) running within/below its slower statistical report schedule<br />
(the master). This is why RS is called the statistical sub-schedule.<br />
The statistical sub-schedule has its own interval trigger. The default is one second, but you can change that — see<br />
Redefining the Statistical Sub-Schedule’s Trigger (P50) below.<br />
To return statistical data, include — in any report schedule — a statistical channel option for the specific input channels,<br />
calculations, and so on where statistically scanned is required. For example<br />
RA1H 2TT(AV)<br />
returns, every hour (RA1H), the average of one-second readings (because one second is the default scan rate for the<br />
statistical sub-schedule) taken from the type T thermocouple connected to channel 2 (2TT(AV)).<br />
Note:<br />
Simply including a statistical channel option ((AV) in the example above) invokes the statistical sub-schedule.<br />
There is no need to include RS, the statistical sub-schedule’s ID, anywhere (unless you want to alter RS’s trigger —<br />
see Redefining the Statistical Sub-Schedule’s Trigger (P50) below).<br />
For details of the statistical channel options available, see Statistical Channel Options (P68).<br />
Redefining the Statistical Sub-Schedule’s Trigger<br />
The statistical sub-schedule’s trigger can be altered from its default of one second. Define the statistical sub-schedule’s<br />
trigger in the same way as for report schedules (see Changing a Schedule Trigger (P51)), by using the RS schedule ID and<br />
sending an RS… schedule command to the <strong>DT80</strong>. If you don’t specify the RS schedule’s trigger in this way, it defaults to once<br />
per second. Here are some examples:<br />
The schedule header<br />
instructs <strong>DT80</strong> to accumulate specified statistical data<br />
every 10 seconds<br />
RS10S<br />
RS1-E on each 1 to 0 transition of digital input 1<br />
RS<br />
continuously<br />
Statistical Sub-Schedule Halt/Go<br />
The statistical sub-schedule can be halted by sending the HS command, and start it again by sending the GS command.<br />
Important Because statistical sampling of channels stops the moment the HS command is sent, be aware that the reported<br />
statistical summaries do not include data from this halt period. This is most significant for the integral summary.<br />
See also Halting & Resuming Schedules (P52).<br />
Multiple Statistical Information for a Channel<br />
If more than one type of statistical information is required for a channel, then each statistical option must be placed in a<br />
separate channel option list. For example, the channel list<br />
1TT(AV)(SD)(MX)<br />
results in periodic average, standard deviation and maximum data for the 1TT channel.<br />
Insufficient Statistical Samples<br />
If no statistical data has been scanned before being reported, then the reported data value will be set to NotYetSet. This<br />
will also occur if insufficient samples have been taken – for example, the standard deviation (SD) option requires at least<br />
two samples to be able to return a value.<br />
UM-0085-B2 <strong>DT80</strong> <strong>Series</strong> User’s <strong>Manual</strong> Page 50
This condition may occur when<br />
<br />
<br />
<br />
the statistical sub-schedule is event-triggered<br />
the statistical sub-schedule has been halted<br />
a statistical sub-schedule scan interval is longer than its statistical report scan interval.<br />
Example — Statistical Report Schedule<br />
The command<br />
RS10S RA1H 1TT 2TT(AV)(MX)<br />
sets the statistical sub-schedule’s scan rate to 10 seconds (RS10S). The main report schedule returns three temperature<br />
readings: a spot reading of channel 1 each hour (RA1H 1TT), and the average and maximum over the hour from 10-second<br />
samplings of channel 2.<br />
Working with Schedules<br />
Entering Schedules into the <strong>DT80</strong> (BEGIN–END)<br />
Report schedules must be entered into (that is, sent to) the <strong>DT80</strong> as a group. Since the schedules and processes that<br />
comprise a job or program often extend over more than one line, you normally enclose them between the keywords BEGIN<br />
and END to designate the beginning and end of the group. Here’s an example:<br />
BEGIN"walrus"<br />
1DSO=1<br />
3CV(W)=2<br />
RA10S<br />
4TT("Oven Temp")<br />
5TT("Flue Temp")<br />
RB1S<br />
2C("Water Flow")<br />
END<br />
A group of schedules such as this is called a job. In the above example, the job has been named "walrus" and comprises two<br />
report schedules, RA (which measures two thermocouples every 10 seconds) and RB (which measures a counter once a<br />
second). Note also the two "immediate" channels (1DSO and 3CV) which are not part of any schedule. These are executed<br />
once only, when the job is entered.<br />
For more details on how jobs are entered and processed, see Jobs (P54)<br />
Triggering and Schedule Order<br />
When different schedules are due to trigger at the same time, the schedules execute in the order of RA, RB,…RK.<br />
When there are statistical channels in a schedule and the statistical sub-schedule is due at the same time as the report<br />
schedule, the statistical sub-schedule runs prior to the report schedules. You cannot change this order.<br />
Channels within schedules are sampled in the order of entry (left to right).<br />
Changing a Schedule Trigger<br />
The schedule’s trigger can be changed at any time simply by sending a new schedule ID and trigger without any channel<br />
definitions. For example, suppose a schedule had been defined as follows:<br />
RA10M 1V 2DS<br />
This will measure a voltage and a digital input every 10 minutes. If you then send:<br />
RA10S<br />
the schedule will then, from that point on, measure every 10 seconds.<br />
Important If any channel definitions are included on the same line (e.g. RA10S 2V) then this will be interpreted as a whole<br />
new job being entered, which will replace the currently running job.<br />
UM-0085-B2 <strong>DT80</strong> <strong>Series</strong> User’s <strong>Manual</strong> Page 51
Halting & Resuming Schedules<br />
Schedules can be halted individually or as a group using the following commands:<br />
Command<br />
H<br />
HA, HB … HK<br />
HS<br />
Function<br />
Halt all schedules<br />
Halt RA, RB,…RK schedule<br />
Halt the statistical sub-schedule (see Statistical Sub-Schedule Halt/Go (P50))<br />
Schedules can then be resumed ("GOed") individually or as a group:<br />
Command<br />
G<br />
GA, GB … GK<br />
GS<br />
Function<br />
Resume all schedules<br />
Resume RA, RB,…RK schedule<br />
Resume the statistical sub-schedule (see Statistical Sub-Schedule Halt/Go (P50))<br />
Executing Commands in Schedules<br />
It is important to distinguish between commands and channel definitions. Commands (e.g. H, /S, P11=60, DIRJOB,<br />
COPY etc.) are always executed once only, immediately they are received – even if they appear to be within a schedule<br />
definition.<br />
For example, if you enter<br />
RA1+E 1V HB SATTN 4CV=4CV+1<br />
you might expect that when the schedule was triggered (by a positive going edge on digital input 1) it would measure a<br />
voltage (1V), halt schedule B (HB), switch on the Attn LED (SATTN) and increment a channel variable (4CV=4CV+1).<br />
In fact, the HB and SATTN will execute once only, when the job is entered. The 1V and 4CV=4CV+1 are channel<br />
definitions, so they will execute each time schedule A is triggered.<br />
To execute commands within a schedule, the DO construct can be used. This is actually a special case of the ALARM<br />
statement (see Alarms (P74)) – one where the condition is always true. The syntax is the same as ALARM except that there<br />
is no test condition.<br />
So if the above job was rewritten as:<br />
RA1+E 1V DO{HB SATTN} 4CV=4CV+1<br />
then the following actions would be performed each time schedule A is triggered:<br />
Channel 1V is measured, then channel variable 4CV is incremented<br />
The commands HB and SATTN are queued for execution. They will be actioned "as soon as possible" – once all<br />
schedules that are currently due have completed, and any previously queued commands have been executed.<br />
Note that this means that it is not possible to interleave the execution of commands and channels within a schedule.<br />
Channels are always performed first; commands are executed a short time later.<br />
Commands can also be executed conditionally, using the IF construct (which in fact is just a synonym for ALARMR –<br />
repeating alarm), e.g.<br />
RA1M IF(1CV>3.57){XB}<br />
will test the value of 1CV once a minute. If it exceeds 3.57 then schedule B will be triggered.<br />
For more details on ALARM/IF/DO syntax and usage, see Alarms (P74).<br />
Time Triggers — Synchronizing to Midnight<br />
Time triggers for report schedules function in two different ways depending on the setting of the synchronize-to-midnight<br />
switch (/s or /S, see (P201)).<br />
Synchronize-To-Midnight Switch Enabled<br />
If the synchronize-to-midnight switch is enabled (/S, the <strong>DT80</strong>’s default), the intervals of all schedules with time triggers are<br />
synchronized to the previous midnight.<br />
When a time-triggered schedule is entered, the schedules first run on the next multiple of the interval since last midnight, and<br />
subsequently run on every multiple of the interval thereafter.<br />
If the interval is not an even multiple of 24 hours, the <strong>DT80</strong> inserts a short interval between the last run of the schedule prior<br />
to midnight and the next run of the schedule at midnight.<br />
For example, if you send the schedule<br />
RA10H<br />
to the <strong>DT80</strong> at 06:00:00, it first runs at 10:00:00 (4 hours since entry, but 10 hours since midnight) and then at 20:00:00 that<br />
day; then at 00:00:00, 10:00:00 and 20:00:00 the next day; and so on.<br />
If you enter an interval longer than 24 hours then the interval is rounded down to the nearest multiple of 24 hours. So if the<br />
UM-0085-B2 <strong>DT80</strong> <strong>Series</strong> User’s <strong>Manual</strong> Page 52
schedule<br />
RA50H<br />
was entered at 09:00 Monday morning then the schedule will first run at 00:00 Wednesday morning, then every 48 hours<br />
thereafter.<br />
Synchronize-To-Midnight Switch Disabled<br />
If the synchronize-to-midnight switch is disabled (/s), the schedules run at intervals relative to the time that the schedule is<br />
entered. For example, if the same RA10H schedule is sent to the <strong>DT80</strong> at 09:30:00, it first runs at 19:30:00 that day; then at<br />
05:30:00 and 15:30:00 on the next day; at 01:30:00 and 11:30:00 on the following day; and so on. That is, every 10 hours of<br />
elapsed time.<br />
Note that the base time (the time at which the specified schedule interval begins) is reset whenever:<br />
the schedule rate is changed, or<br />
the schedule is restarted (using the G command), or<br />
the system time is changed (using the D=, T= or DT commands)<br />
UM-0085-B2 <strong>DT80</strong> <strong>Series</strong> User’s <strong>Manual</strong> Page 53
Part D – Jobs<br />
What is a Job<br />
A job is a collection of related schedule definitions and commands which together configure the <strong>DT80</strong> to perform a particular<br />
data logging task.<br />
Several different jobs can be stored on the <strong>DT80</strong>'s internal file system, but only one can be active at any one time. Each job<br />
has its own separate data/alarm storage area.<br />
Jobs are identified by their job name, which is a user-defined string of up to 8 characters. If a job name is not specified when<br />
the job is entered, the default name UNTITLED is used.<br />
When the <strong>DT80</strong> is first started or reset, there is no active job. The logger is idle and No current job is displayed on the<br />
LCD to indicate this.<br />
To make the logger do something useful, you need to either:<br />
enter a new job, or<br />
run (load) an existing job.<br />
Once a job has been entered or loaded successfully, it becomes the currently active job and its name will be displayed on the<br />
LCD. If you then enter or load a different job, all schedules and channels defined by the original job are cleared and replaced<br />
by those of the new job.<br />
Entering a Job<br />
To enter a new job you send the required commands and schedule definitions to the logger using one of the communications<br />
ports (USB, Ethernet or RS232). Once the complete job has been entered, the <strong>DT80</strong> will automatically store the job in its<br />
internal file system and activate it.<br />
To begin entering a new job, the BEGIN command is used. This command:<br />
causes the currently active job to be cleared. All defined schedules will stop running.<br />
specifies the name of the new job, e.g. BEGIN"GOOSE" indicates that the new job will be called "GOOSE". (Just<br />
BEGIN by itself is equivalent to BEGIN"UNTITLED".)<br />
places the <strong>DT80</strong> in "job entry mode". After each line of the job is entered the <strong>DT80</strong> will output a job> prompt, rather<br />
than the usual <strong>DT80</strong>> prompt.<br />
As each line of the job is entered the <strong>DT80</strong> executes any commands or immediate channels that it finds. Report schedule<br />
definitions, including their constituent channel definitions are recorded but they are not activated just yet.<br />
The END command marks the end of a job. At this point all schedules defined within the job are activated, and the <strong>DT80</strong> is no<br />
longer in job entry mode.<br />
If an error occurs during job entry, the <strong>DT80</strong> will clear all schedule/channel definitions and ignore the remainder of the job, up<br />
until the END command is seen.<br />
Note In some circumstances the <strong>DT80</strong> will not allow a new job to be entered:<br />
if the "fix schedules" switch (P201) is active (/F) – this prevents any change to the currently active job. (Use /f<br />
command to allow the current job to be changed.)<br />
if a different job with the same name already exists, and it has been locked using the LOCKJOB"jobname" command<br />
– this prevents a stored job being accidentally overwritten. (Choose a different job name, or unlock the existing job<br />
using UNLOCKJOB"jobname".)<br />
if a different job with the same name already exists, and it has logged data or alarms – this prevents data from different<br />
jobs (which happen to have the same name) from being mixed up in the one data file. (Choose a different job name, or<br />
delete the existing job's using DELDATA"jobname" and/or DELALARMS"jobname".)<br />
Note An error message will be returned if you attempt to send more than 255 characters on a single line.<br />
Single Line Jobs<br />
As a shortcut, it is also possible to enter a job simply by entering one or more schedule definitions all on one line, e.g.:<br />
RA1S 1TK<br />
The above is then equivalent to:<br />
BEGIN"UNTITLED" RA1S 1TK END<br />
that is, it will create a new job called "UNTITLED".<br />
Note that entering just a schedule trigger (with no channel definitions after it), e.g.<br />
RA2S<br />
does not create a new job – it simply changes the trigger condition for the currently defined A schedule (if any).<br />
It is recommended that, for clarity, BEGIN and END are always included explicitly when entering a job.<br />
UM-0085-B2 <strong>DT80</strong> <strong>Series</strong> User’s <strong>Manual</strong> Page 54
Loading an Existing Job<br />
The <strong>DT80</strong> can also read job text from a file stored in its internal file system and automatically enter it. This job will then<br />
become the current active job, replacing whatever was previously the current active job.<br />
A new job may be loaded when:<br />
the RUNJOB"jobname" command is issued. This will read the job from the file<br />
B:\JOBS\jobname\PROGRAM.DXC.<br />
the <strong>DT80</strong> is reset. By default, the previously active job will be loaded (See Startup Job (P57))<br />
A USB memory device is inserted. If a file A:\ONINSERT.DXC or A:\serialnum\ONINSERT.DXC is present then<br />
any commands therein will be executed. These may include a job definition, in which case the job will become the<br />
current active job. (See ONINSERT Job (P57))<br />
Job Structure<br />
A typical <strong>DT80</strong> job is shown below (the line numbers are for reference only and are not part of the job)<br />
1<br />
2<br />
3<br />
4<br />
5<br />
6<br />
7<br />
8<br />
9<br />
10<br />
11<br />
12<br />
13<br />
14<br />
15<br />
16<br />
17<br />
18<br />
19<br />
BEGIN"Boiler01"<br />
' No. 1 Boiler monitoring job for <strong>DT80</strong> 03-Dec-2005<br />
/n/u/S/e<br />
P22=44<br />
Y10=4.5,0.312"kPa"<br />
S1=0,50,0,100"L/m"<br />
1DSO=0 ' Enable sensor power relay<br />
RS5S<br />
RB1M 2..3TT("Temp")<br />
RC(DATA:NOV:365D)15M 1V(Y10,AV) 4#L(S1,AV)<br />
RK10S<br />
ALARM1(1V(Y10)>2.25)3DSO<br />
ALARM1(4TT>110.0)3DSO,1CV"Over Temp "{RB5S}"<br />
LOGON<br />
END<br />
Note the following salient points:<br />
Line 1 – the BEGIN command tells the <strong>DT80</strong> to clear the current job and prepare to receive a new one.<br />
Line 2 – anything following a single quote character (up to the end of the line) is considered a comment and is<br />
ignored. Blank lines are also ignored.<br />
Line 3-7 – the first part of a job normally consists of commands to set switches and parameters, define polynomials<br />
and spans, and evaluate any immediate channels.<br />
Line 8 – this line sets the scan rate for the statistical sub-schedule. All channels which include a statistical channel<br />
option, i.e. 1V(AV) and 3#L(AV), will therefore be scanned every 5 seconds. The measured values will not be<br />
logged or returned; they will only be used for accumulating the average values.<br />
Line 10 – defines the B schedule (measure two thermocouples once per minute).<br />
Line 12 – defines the C schedule (report pressure and flow rate values, averaged over a 15 minute period. Note the<br />
use of a polynomial (Y10) to convert the measured voltage in mV to pressure in kPa. Similarly, a span is used to<br />
convert a current loop % value to a flow rate in l/m.)<br />
Line 14-16 – define the K schedule (every 10s check pressure and temperature against limits. If pressure exceeds<br />
2.25kPa then set digital output 3 to LOW (active); if temperature exceeds 110°C then set digital output 3 to LOW, set<br />
1CV=1, output and log an "Over Temp" alarm string, and change the scan rate of schedule B to 5s.)<br />
Line 18 – enables logging for all schedules (by default logging is disabled)<br />
Line 19 – marks the end of the job; all schedules will now be activated.<br />
UM-0085-B2 <strong>DT80</strong> <strong>Series</strong> User’s <strong>Manual</strong> Page 55
Job Commands<br />
A number of commands are provided for managing jobs on the <strong>DT80</strong>.<br />
Listing Job Names<br />
The DIRJOBS command lists the names of all jobs stored in the <strong>DT80</strong> internal file system, e.g.<br />
<strong>DT80</strong>> DIRJOBS<br />
FRED<br />
*GEORGE<br />
+ RON<br />
+ GINNY<br />
UNTITLED<br />
An asterisk (*) indicates the currently active job, if any. Locked jobs are indicated by a plus sign (+).<br />
The CURJOB command simply displays the name of the current active job, e.g.<br />
<strong>DT80</strong>> CURJOB<br />
GEORGE<br />
Specifying Jobs<br />
The following commands act on a specific job or jobs. To specify the job you can enter a jobspec parameter after the<br />
command, where jobspec can be either:<br />
a job name in double quotes, e.g. "FRED", or<br />
an asterisk (*), which will apply the command to all stored jobs, or<br />
nothing, in which case the command will operate on the current active job (an error message will be reported if there is<br />
no currently active job).<br />
Showing Program Text<br />
To show the commands which define a job, use SHOWPROGjobspec, e.g.<br />
<strong>DT80</strong>> SHOWPROG"RON"<br />
Job Program – RON<br />
BEGIN"RON"<br />
RA1S 3TT 1DS<br />
END<br />
Locking Jobs<br />
If a job is locked then its program text cannot be deleted or overwritten. To lock a job use the LOCKJOBjobspec command;<br />
to unlock use UNLOCKJOBjobspec, e.g.:<br />
<strong>DT80</strong>> LOCKJOB*<br />
Locking Job FRED – Done<br />
Locking Job GEORGE – Done<br />
Locking Job RON – already locked<br />
Locking Job GINNY – already locked<br />
Locking Job UNTITLED – Done<br />
Deleting Jobs<br />
The DELJOBjobspec command can be used to delete a job from the <strong>DT80</strong>'s internal file system.<br />
However, this command will fail and the job will not be deleted if any of he following apply:<br />
the job is the current active job and the /F (fix schedules) switch is set (use /f to turn this switch off)<br />
<br />
<br />
the job is locked (use UNLOCKJOB to unlock it)<br />
the job has logged data and/or alarms (use DELDATA and DELALARMS to delete them)<br />
Managing a Job's Logged Data and Alarms<br />
The following commands allow you to manage the data and alarms logged by a job:<br />
LISTD lists details of the number of logged records and the associated time range<br />
COPYD is used to unload data and/or alarms – that is: read data from one or more store files, transform it to the<br />
selected format (e.g. CSV), and output it to the currently active comms port, or a file, or an FTP server<br />
DELD will delete a job's logged data and/or alarms respectively.<br />
For more details on these commands, see Logging and Retrieving Data (P84).<br />
UM-0085-B2 <strong>DT80</strong> <strong>Series</strong> User’s <strong>Manual</strong> Page 56
Startup Job<br />
The <strong>DT80</strong> can automatically load a user-defined job every time it is restarted by a hard reset (SINGLEPUSH command or<br />
power failure or pressing the manual reset button). This allows the <strong>DT80</strong> to operate as a dedicated instrument.<br />
The <strong>DT80</strong>'s behaviour following a hard reset is controlled by the following profile setting:<br />
PROFILE STARTUP RUN<br />
There are three possible settings for this profile:<br />
<br />
<br />
<br />
CURRENT_JOB – the <strong>DT80</strong> will reload the job that was active prior to the reset (if any). This is the default.<br />
NONE – no job will be loaded following hard reset<br />
jobname – the specified job (if it exists) will be loaded following hard reset.<br />
If a "triple push" reset is performed (see Safe Mode (P209)) then the configured startup job will not be loaded.<br />
ONINSERT Job<br />
When a USB memory device is inserted into a <strong>DT80</strong>, the <strong>DT80</strong> first looks for a file on the USB device named<br />
A:\serialnum\ONINSERT.DXC, where serialnum is the serial number of the <strong>DT80</strong> (e.g. SN80322). If found, the<br />
commands in this file are entered into the <strong>DT80</strong> exactly as if they had been received via a comms port.<br />
If the above file is not found, the <strong>DT80</strong> looks for a command file in the root directory, i.e. A:\ONINSERT.DXC; if found it is<br />
loaded into the <strong>DT80</strong> in the same way.<br />
If the USB device contains a suitable ONINSERT.DXC file, a prompt (Run ONINSERT) will be displayed on the LCD to give<br />
you an opportunity to prevent it running. Press OK to immediately run the ONINSERT job, or any other key to prevent<br />
execution. If no key is pressed within 5 seconds then the ONINSERT job will be run.<br />
This auto-programming function means that a single USB memory device can be inserted into a number of <strong>DT80</strong>s, one at a<br />
time, and either:<br />
automatically program all the <strong>DT80</strong>s with the same job — if no serial-number-specific subdirectories containing<br />
ONINSERT.DXC files exist on the USB device and an ONINSERT.DXC file exists at the root level, or<br />
automatically program particular <strong>DT80</strong>s with their own specific job — if serial-number-specific subdirectories<br />
containing ONINSERT.DXC files exist on the USB device, or<br />
carry out a combination of these two options — <strong>DT80</strong>s that do not find a subdirectory named with their serial number<br />
automatically load and run the "standard" ONINSERT.DXC file at the root level, and <strong>DT80</strong>s that find their specific<br />
subdirectory automatically load and run the "specific" ONINSERT.DXC file found there.<br />
These files are typically created by inserting the USB memory device into a PC and copying the required program files to the<br />
required directories.<br />
Alternatively, the <strong>DT80</strong> command:<br />
RUNJOBONINSERT"jobname"<br />
can be used to copy the specified job's program text to A:\serialnum\ONINSERT.DXC.<br />
Similarly,<br />
RUNJOBONINSERTALL"jobname"<br />
will copy the specified job's program text to A:\ONINSERT.DXC.<br />
To delete the ONINSERT.DXC files from the inserted USB memory device, you can use the<br />
DELONINSERT<br />
and<br />
DELONINSERTALL<br />
commands.<br />
UM-0085-B2 <strong>DT80</strong> <strong>Series</strong> User’s <strong>Manual</strong> Page 57
Part E – Manipulating Data<br />
Scaling<br />
Most <strong>DT80</strong> channel types automatically scale measured values so that the returned values are in appropriate engineering<br />
units. For example, the thermocouple channel types (e.g. TK) automatically apply the appropriate scaling polynomial so that<br />
the data is returned in °C. However, a number of additional facilities are provided for applying custom scaling or corrections:<br />
<br />
<br />
<br />
<br />
<br />
<br />
channel factor<br />
spans<br />
polynomials<br />
thermistor scaling<br />
intrinsic functions<br />
expressions<br />
Channel Factor<br />
For many channel types, the channel factor (a channel option consisting of just a floating point number) can be used to<br />
provide a simple multiplication factor. See A Special Channel Option — Channel Factor (P35).<br />
For example, if a high voltage is being measured using an external 12.5:1 voltage divider then the following channel<br />
definition:<br />
1V(12.5)<br />
will multiply the raw reading by 12.5 so that the returned value reflects the actual voltage.<br />
Note that for some channel types the channel factor performs a special function, and therefore cannot be used as a scaling<br />
factor. In these cases a span should be used (see below).<br />
For example, if you are measuring a frequency which has passed through a 100:1 prescaler then you will need to use a span<br />
to scale it.<br />
Spans (Sn)<br />
A span transforms a measured signal value (e.g. mV) into the corresponding physical value (e.g. kPa) using a straight line<br />
function:<br />
Physical range<br />
(°C, for example)<br />
Upper<br />
physical<br />
Lower<br />
physical<br />
b<br />
a<br />
Calibration<br />
c<br />
Lower<br />
signal<br />
Figure 18: Span coordinates<br />
d<br />
Upper<br />
signal<br />
Signal range<br />
(mV, for example)<br />
A span must be defined before it is applied. This is normally done at the start of a job, before any schedules are defined. The<br />
syntax is as follows:<br />
Sn=a,b,c,d"units"<br />
where:<br />
n is the poly/span number (1 to 50), which is used simply to distinguish one span from another. Note that a span and<br />
a polynomial cannot have the same number.<br />
a and b are the physical coordinates of two points on the calibration line (reported or output values)<br />
c and d are the signal coordinates of two points on the calibration line (measured or input values). If not specified, 0<br />
and 100 are assumed.<br />
units replaces the channel's default units text<br />
Spans are particularly suited to 4–20mA current loop inputs. The following defines a span suitable for a current loop sensor<br />
that measures pressure in the range 0-300kPa:<br />
UM-0085-B2 <strong>DT80</strong> <strong>Series</strong> User’s <strong>Manual</strong> Page 58
S2=0,300"kPa"<br />
Note that in this case the default signal coordinates (0 and 100) are used, because the L (current loop) channel type returns<br />
a value in the range 0-100%.<br />
Once defined, a span may be applied to any number of channels in any schedules or alarms using the Sn channel option.<br />
In the following example, two of the above current loop pressure sensors are used, plus a frequency input which passes<br />
through a 10:1 prescaler (frequency divider):<br />
BEGIN"MONKEY"<br />
S1=0,10,0,1"Hz" ' multiply measured freq by 10<br />
S2=0,300"kPa" ' scale 0-100% to 0-300kPa<br />
RA10S 1#L(S2,"Inlet") 2#L(S2,"Outlet") 4F(S1)<br />
END<br />
This will return data in the form:<br />
Inlet 23.9 kPa<br />
Outlet 119.0 kPa<br />
4F 3920 Hz<br />
Note that for the F channel type the channel factor indicates the sample period, so it cannot be used as a scaling factor. A<br />
span is therefore used instead.<br />
A span can also be applied in reverse, using the SRn channel option. Thus<br />
S1=0,100,32,212 1CV(S1)<br />
is equivalent to<br />
S1=32,212,0,100 1CV(SR1)<br />
Polynomials (Yn)<br />
Polynomials are used to define calibrations for non-linear sensors. Each defined polynomial can have up to six polynomial<br />
coefficients.<br />
The <strong>DT80</strong> evaluates a polynomial according to the formula<br />
2 3 4 5<br />
y k0 k1x<br />
k2x<br />
k3x<br />
k4x<br />
k5x<br />
where x is the raw channel reading, and the k’s are coefficient terms.<br />
A polynomial is defined in a similar way to a span:<br />
Yn=k0,k1,k2,k3,k4,k5"units"<br />
where:<br />
n is the poly/span number (1 to 50), which is used simply to distinguish one polynomial from another. Note that a<br />
span and a polynomial cannot have the same number.<br />
k0 … k5 are the polynomial coefficients. If not specified, a coefficient value of zero is assumed<br />
units replaces the channel's default units text<br />
The required coefficients may be supplied by the sensor manufacturer, or they may be determined from a calibration curve or<br />
from measured data points using a least squares regression technique. Various statistical programs are available for this<br />
purpose.<br />
Once defined, a polynomial may be applied to any number of channels using the Yn channel option. For example:<br />
Y1=23.5,0,0.987"deg C"<br />
RA1M 1V(Y1) 2V(Y1)<br />
A "null" polynomial may also be used as a shortcut when defining several channels which all require the same custom units<br />
string, e.g.:<br />
Y9=0,1"m/s"<br />
RA10S 3CV(Y9) 5CV(Y9) 22CV(Y9) 33CV(Y9)<br />
Thermistor Scaling (Tn)<br />
The <strong>DT80</strong> has channel types (e.g. YS03) for many 2-wire YSI thermistors (Yellow Springs Instruments). For other thermistor<br />
types, the <strong>DT80</strong> supports thermistor scaling — the conversion of a resistance reading to a temperature. The <strong>DT80</strong> does the<br />
conversion from resistance to temperature using<br />
1<br />
T <br />
a b(ln<br />
R)<br />
c(ln<br />
R)<br />
3<br />
To apply thermistor scaling, firstly obtain the constant terms a, b and c from the thermistor manufacturer, then define a<br />
UM-0085-B2 <strong>DT80</strong> <strong>Series</strong> User’s <strong>Manual</strong> Page 59
thermistor conversion in a similar way to a polynomial or span:<br />
where:<br />
<br />
<br />
<br />
<br />
Tn=a,b,c"units"<br />
T is the temperature, in Kelvin (K)<br />
n is the thermistor conversion number (1 to 20), which is used simply to distinguish one thermistor equation from<br />
another.<br />
a, b, c are the constants from the above thermistor equation. If not specified, a coefficient value of zero is assumed<br />
units replaces the channel's default units text<br />
Once defined, a thermistor conversion may be applied to any number of resistance channels using the Tn channel option.<br />
For example:<br />
T1=26.5,1.034,8.77e-3"K"<br />
RA1M 3R(T1,"Solvent temp")<br />
See also Temperature – Thermistors (P246).<br />
Intrinsic Functions (Fn)<br />
The <strong>DT80</strong> has seven inbuilt and mutually exclusive intrinsic functions that may be applied as channel options. The intrinsic<br />
functions available are<br />
Fn Description Text Modifier<br />
F1 1/x inverse (Inv)<br />
F2 x square root (Sqrt)<br />
F3 Ln(x) natural logarithm (Ln)<br />
F4 Log(x) base ten logarithm (Log)<br />
F5 Absolute(x) absolute value (Abs)<br />
F6 x * x square (Squ)<br />
F7 Gray code conversion (16-bit) (Gc)<br />
The text modifier is appended to the channel's default units string. If a channel's units string has been explicitly set (using the<br />
"name~units" channel option) then no modifier is appended.<br />
For example, the channel definition<br />
1V(F2) 2F(F1,"period~sec")<br />
will return data in the form:<br />
1V 455.7 mV (Sqrt)<br />
period 1.7 sec<br />
Combining Scaling Options<br />
The span (Sn), polynomial (Yn), thermistor (Tn) and intrinsic function (Fn) channel options are all mutually exclusive. If more<br />
than one are specified then only the last one will be applied.<br />
Channel variables and expressions(P62) can be used if multiple scaling operations need to be combined.<br />
UM-0085-B2 <strong>DT80</strong> <strong>Series</strong> User’s <strong>Manual</strong> Page 60
Calculations<br />
Channel Variables (nCV)<br />
Channel variables (CVs) are memory locations (registers) for holding and manipulating floating-point data. The <strong>DT80</strong> has<br />
1000 channel variables, identified as 1CV to 1000CV.<br />
All channel variables are reset to 0.0 when the <strong>DT80</strong> is reset (SINGLEPUSH) or cleared (RESET).<br />
Reading Channel Variables<br />
A channel variable behaves in much the same way as any other channel type. Its value may be read (i.e. returned and/or<br />
logged) by including the appropriate nCV channel definition in a schedule. For example, sending<br />
12CV<br />
will immediately return the value of channel variable #12, while<br />
RA10S 1..5CV<br />
will report the values of 1CV through 5CV every 10 seconds.<br />
If a CV is being used for holding an intermediate value then you would normally use the W channel option to make it a working<br />
channel (which is not returned or logged).<br />
Setting Channel Variables<br />
A channel variable's value may be set in one of three ways:<br />
the CV is set to the value of an expression, i.e. nCV=expression<br />
any channel's value may be assigned to a channel variable by using the =nCV channel option<br />
certain special channel options (e.g. histogram) return multiple data values, which are written to a specified range of<br />
channel variables.<br />
Some examples of using expressions to set CVs:<br />
1..20CV=10.2 'initialise multiple CVs<br />
RA1S 1V 9CV=9CV+1 'count the number of measurements taken<br />
5CV(W)=3CV*SIN(21CV)+2CV*COS(21CV)<br />
See also Expressions (P64).<br />
The =nCV channel option allows a channel value to be assigned directly to a CV, typically so it can then be used in further<br />
calculations.<br />
This can be used to apply a complicated linearisation equation, e.g.:<br />
1V(=2CV,W) 2CV(S9,"temp~K")=2CV/(LN(2CV+1))<br />
This will measure a voltage and assign it to 2CV (note the W option – we are not interested in logging/returning the raw<br />
voltage value). The value in 2CV is then plugged into the specified expression and the result stored back in 2CV. Finally a<br />
span (S9, which must have been previously defined) is applied and the result is returned with appropriate name and units.<br />
An arithmetic operator may also be applied during the assignment, using the +=nCV, -=nCV, *=nCV and /=nCV channel<br />
options.<br />
These allow a CV to be used as an accumulator, e.g.<br />
RA1M 3C(+=2CV) 2CV("Total")<br />
will report the number of counts received in each one minute period, plus the total counts, i.e.:<br />
3C 192 Counts<br />
Total 192<br />
3C 77 Counts<br />
Total 269<br />
Note also that<br />
1V(/=1CV)<br />
is equivalent to<br />
1V(=2CV) 1CV(W)=1CV/2CV<br />
Storage Precision<br />
Channel variables may be used to store values with magnitudes from 10 -38 to 10 38 . However, it is important to be aware that<br />
values are stored with 24 bits of precision, or approximately 7.25 significant digits when written in decimal form. This means<br />
UM-0085-B2 <strong>DT80</strong> <strong>Series</strong> User’s <strong>Manual</strong> Page 61
that whenever the <strong>DT80</strong> displays a value, it will only be accurate to 7 significant digits. The 8 th digit can be used to distinguish<br />
values which are close together, but its value may be out by a few counts. Any changes in the 9 th or later digits will not be<br />
reflected in the stored value.<br />
This is particularly noticable when incrementing large integer values. For example:<br />
1CV=3600000<br />
RA1S 1CV=1CV+1<br />
1CV 3600000.0<br />
1CV 3600000.8<br />
1CV 3600002.0<br />
In this example 8 significant digits are being displayed, so the last one is not accurate. It would be better in this case to not<br />
display any decimal places, i.e. 1CV(FF0)=1CV+1.<br />
Once the magnitude of the CV value exceeds 2 24 (16,777,216), adding one to it will no longer cause its value to change.<br />
A consequence of this is that if you manually count something using a channel variable (e.g. 1CV=1CV+1) then it will stop<br />
counting once its value reaches 16,777,216. Note that this only applies to manual counting using CVs – hardware and<br />
software counters (HSC and C channel types) can count over the full 32-bit range.<br />
If you need a CV to count beyond 16,777,216 then you will need to use two CVs to hold the count value, e.g.:<br />
1CV=1CV+1 IF(1CV>1000000){2CV=2CV+1 1CV=0}<br />
Naming Channel Variables<br />
As with any other channel type, CV channels can be given name and units strings using the "CVname~Units" channel<br />
option.<br />
The command<br />
NAMEDCVS<br />
will return a summary of all CVs that have been explicitly named, e.g.:<br />
CV S CV Name<br />
Value Units<br />
==========================================<br />
5 A Temp 89.1 Deg C<br />
1 A Speed 23.4 m/s<br />
(The "S" column is the schedule identifier)<br />
Calculation Only Channels<br />
If you need to return a calculated value then a channel variable is often used, e.g.<br />
9CV("sum")=1CV+2CV+3CV<br />
However, if you are just logging the result of this expression, and are not going to do any further calculations with it, then<br />
there is no point storing the result in 9CV.<br />
The CALC channel type is a better choice here. An expression can be assigned to it, and the result will be logged in exactly<br />
the same way as a CV. The only difference is that it does not actually copy the result to any particular channel variable.<br />
For example:<br />
CALC("sum")=1CV+2CV+3CV<br />
Reference Channels<br />
A reference channel is used to reference the value of another channel, which is identified by name. In this way a<br />
measurement can be used is multiple places without having to assign it to a channel variable.<br />
To define a reference, use an ampersand followed by the name of the channel whose value you wish to reference, i.e.<br />
&channel. For example:<br />
RA1S 1V &1V<br />
In this (not very useful) example a voltage is measured once but reported twice – once by the original channel and once by<br />
the reference to the channel.<br />
Names<br />
If the "source" channel has a user-defined name then it must be used when defining a reference, e.g.<br />
RA1S 1V("Voltage12") &Voltage12<br />
If the source channel's name has spaces or special characters (anything other than A-Z, 0-9, or _) then it should be enclosed<br />
in quotes, e.g.<br />
RA1S 1V("Voltage no. 12") 1+TK &"Voltage no. 12" &"1+TK"<br />
Note that name comparisons are not case sensitive, so &BIG is a valid reference to 1R("big").<br />
If there is more than one source channel with the same name (a practice that is not recommended) then the reference will<br />
refer to the first one defined. e.g.<br />
RA1S 1V("a") 1R("a") &a<br />
UM-0085-B2 <strong>DT80</strong> <strong>Series</strong> User’s <strong>Manual</strong> Page 62
defines a reference to the voltage, not the resistance.<br />
Options<br />
A reference channel is a channel in its own right so, like any other channel, it can have its own channel options. However,<br />
because a reference channel does not physically measure anything, sampling options will not be applicable. It can have<br />
reporting options, e.g.<br />
RA1S 1V("Voltage12") &Voltage12(Y1,"Pressure12~kPa")<br />
In the above example a voltage based pressure sensor is sampled. Both the raw voltage and the pressure (calculated by<br />
applying polynomial Y1) are returned.<br />
Reference channels inherit their data type (integer or floating point) and default units from the source channel. For example:<br />
1C &1C<br />
1C 210 Counts<br />
&1C 210 Counts<br />
The reference channel's units can of course be overridden:<br />
1C &1C("~Woozles")<br />
1C 210 Counts<br />
&1C 210 Woozles<br />
Sampling<br />
For a reference channel that is included in a schedule, the source channel must be defined somewhere in the job. The<br />
source channel does not need to occur before the reference to it, but it must be somewhere between the BEGIN and END.<br />
References can be used in the immediate schedule, but in this case the source channel must precede the reference, and it<br />
must be on the same command line.<br />
If the source channel has not been sampled at the time that the reference channel is sampled then the reference channel's<br />
value will be NotYetSet.<br />
Note also that references are read-only; an expression can not be included, e.g.<br />
&1CV=1 'error<br />
Expressions<br />
References can be included in expressions. For example:<br />
1CV=(&1TK+&2TK)/2<br />
will calculate the mean of two previously sampled temperatures.<br />
Examples<br />
Some of the applications of reference channels are listed below. Many of these could also be done using channel variables,<br />
but using references is generally clearer and more efficient.<br />
Same reading scaled two ways<br />
The following will log the same reading in both degrees Celsius and Fahrenheit<br />
S1=32,212,0,100"degF" 1TK(FF2) &1TK(S1,FF2)<br />
Multiple statistics from the same raw data<br />
The following will calculate two different averages from the same raw data<br />
RS1S RA10S 1TK(W)(AV,"10s_ave") RB1M &1TK(AV,"1min_ave")<br />
Testing one reading in multiple alarms<br />
In this example a temperature is sampled once but then tested in three different alarm conditions.<br />
1TK("indoor")<br />
IF(&indoor27)"too hot^M^J"<br />
<strong>Manual</strong>ly Poll Most Recent Sample<br />
References allow you to make an ad hoc query for the most recent value of a channel that is being regularly sampled.<br />
BEGIN"zoo" RA1M 1TK END<br />
&1TK<br />
UM-0085-B2 <strong>DT80</strong> <strong>Series</strong> User’s <strong>Manual</strong> Page 63
Expressions<br />
The <strong>DT80</strong> has a powerful expression evaluation capability, allowing measured values to be manipulated using a variety of<br />
mathematical and logical operations.<br />
An expression consists of one or more operands which are manipulated using operators to produce a numeric result. The<br />
result of an expression can be assigned to any of the channel types identified as "writable" in the table of channel types<br />
(P28). Expressions cannot contain any spaces.<br />
Operands<br />
An expression operand can be either<br />
a numeric constant, e.g. 27 or -2.95 or 2.222e-6 or 0x3fff (hexadecimal)<br />
one of the special constants PI (3.1415927) or E (2.7182818)<br />
a channel variable, e.g. 17CV<br />
a reference to another channel, e.g. &1TK or &"Reactor Temp"<br />
a sub-expression in parentheses, e.g. (1CV+1) or (COS(D2R(3CV))+1). The sub-expression will be evaluated<br />
first and the result will become the operand.<br />
Operators<br />
The following operators are supported. In the following table x and y can be any of the operand types listed above.<br />
Operator Description Type<br />
x+y addition *<br />
x-y subtraction *<br />
x*y multiplication *<br />
x/y division F<br />
x^y x raised to power y F<br />
x%y x modulo y (remainder after division) *<br />
x=y 1 if x greater than or equal to y, otherwise 0 I<br />
x=y 1 if x equals y, otherwise 0 I<br />
x!=y 1 if x equals y, otherwise 0 I<br />
xANDy 1 if x is non-zero and y is non-zero, otherwise 0 I<br />
xORy 1 if x is non-zero or y is non-zero, otherwise 0 I<br />
xXORy 1 if x is non-zero or y is non-zero but not both, otherwise 0 I<br />
-x negative x *<br />
NOTx 1 if x is non-zero, otherwise 0 I<br />
ABS(x) absolute value of x *<br />
SQRT(x) square root of x F<br />
LOG(x) base 10 logarithm of x F<br />
LN(x) base e logarithm of x F<br />
SIN(x) sine of x (x is in radians) F<br />
COS(x) cosine of x (x is in radians) F<br />
TAN(x) tangent of x (x is in radians) F<br />
ASIN(x) arcsine of x (result is in radians) F<br />
ACOS(x) arccosine of x (result is in radians) F<br />
ATAN(x) arctangent of x (result is in radians) F<br />
Sn(x) apply span #n F<br />
SRn(x) apply reversed span #n F<br />
Yn(x) apply polynomial #n F<br />
Tn(x) apply thermistor scaling #n F<br />
Fn(x) apply intrinsic function #n F<br />
D2R(x) x / 57.29576 (convert degrees to radians) F<br />
R2D(x) x * 57.29576 (convert radians to degrees) F<br />
UM-0085-B2 <strong>DT80</strong> <strong>Series</strong> User’s <strong>Manual</strong> Page 64
Data Types<br />
Integers and Floating Point<br />
<strong>DT80</strong> channels can return either a 32-bit integer or a 32-bit floating point value. Digital and counter channels return an<br />
integer value; most other channel types return floating point values.<br />
The Type column in the above table indicates the data type that results from applying the specified operator. Operators<br />
marked F always result in a floating point value, operators marked I result in an integer, and operators marked * result in a<br />
floating point value if either of their operands is a floating point value. Note that a numeric constant is considered to be an<br />
integer unless it has a decimal point or exponent.<br />
Note however that channel variables can only hold floating point values. Thus if an expression result is assigned to a channel<br />
variable then it will always be converted to a floating point value. This is not the case for a CALC channel, which can return<br />
either an integer or a floating point value.<br />
Error Values<br />
If an operand has an error value (e.g. overrange) then the result of any operator will also be an error value. For example,<br />
CALC=&1V/1000<br />
will return a value of OverRange if the original 1V measurement that is being referenced in the expression was overrange.<br />
Operator Precedence<br />
Each operator is assigned a precedence level, as follows:<br />
Precedence Level Operators<br />
1 (highest) - (negative)<br />
2 ^<br />
3 *, /, %<br />
4 +, - (subtract)<br />
5 <br />
6 (lowest) AND, OR, XOR, NOT<br />
When an expression contains more than one operator then the operator with the highest precedence is evaluated first. If the<br />
operators have equal precedence then they are evaluated left to right. Parentheses may be used to create sub-expressions<br />
and thereby alter the order of evaluation.<br />
Examples<br />
Equal precedence operators are evaluated left to right:<br />
3CV=7-2+3 '3CV = 8 (not 2)<br />
Changing evaluation order using parentheses:<br />
4CV=1.5+2*3^2 '4CV = 19.5<br />
4CV=(1.5+2)*3^2 '4CV = 31.5<br />
4CV=((1.5+2)*3)^2 '4CV = 110.25<br />
Negative and subtract operators are different:<br />
2CV=-5^2 'negative: 2CV = 25<br />
2CV=0-5^2 'subtract: 2CV = -25<br />
Logical Expressions<br />
Boolean logic within expressions can be used to return a result that is dependent on a condition being true (1) or false (0),<br />
e.g.<br />
2CV=(1CV*2*(1CV=1000))<br />
returns a value of 1CV*2 if 1CV is less than 1000, or a value of 1CV*4 if 1CV is greater than or equal to 1000.<br />
UM-0085-B2 <strong>DT80</strong> <strong>Series</strong> User’s <strong>Manual</strong> Page 65
Combining Methods<br />
The different scaling and calculation methods can be used together. The following comprehensive examples are the best<br />
way to demonstrate.<br />
Example 1<br />
In this program, a vector average is calculated. The inputs are wind speed and direction.<br />
BEGIN"Wind-01"<br />
'Wind speed calibration 0–50m/s = 0–1000mV<br />
S1=0,50,0,1000"m/s"<br />
'Wind direction 0–2Pi radians (0–360deg) = 0–1000mV<br />
S2=0,6.2832,0,1000"radians"<br />
Y3=0,1"m/s" 'Units text for wind speed report<br />
Y4=0,1"Deg" 'Units text for wind direction report<br />
RA5S 'Schedule to scan every 5 seconds<br />
1V(S1,W) 'Sample wind speed<br />
2V(S2,W) 'Sample wind direction<br />
3CV(W)=3CV+&1V*COS(&2V) 'Sum x components<br />
4CV(W)=4CV+&1V*SIN(&2V) 'Sum y components<br />
5CV(W)=5CV+1 'Number of scans<br />
RB1M 'Calculate, report and log every minute<br />
'Calculate mean magnitude:<br />
6CV(W)=SQRT((3CV*3CV)+(4CV*4CV))/5CV<br />
6CV("Mean Wind Magnitude",Y3,FF1)<br />
'Calculate direction<br />
7CV(W)=R2D(ATAN(4CV/3CV))<br />
'Determine direction quadrant<br />
7CV(W)=7CV+((3CV>0)AND(4CV
Derived Quantities<br />
The <strong>DT80</strong> can automatically compute various commonly used derived quantities such as differences, rates of change,<br />
pulse widths and so on. These are calculated by including the appropriate channel option, as detailed below.<br />
In each case the derived quantity is returned instead of the original reading.<br />
Rates and Integrals<br />
The following derived quantities are calculated based on the current and the previous channel reading.<br />
Channel Option Description Formula<br />
DF Difference Δx<br />
DT Time difference Δt<br />
RC Rate of change Δx / Δt<br />
RS Reading / time difference x / Δt<br />
IB Integrate ( x – Δx / 2 ) Δt<br />
The DF channel option returns the difference between the current and previous measurements; the DT option returns the<br />
time difference and the RC channel option combines the two to return the rate of change (Δx / Δt).<br />
For example,<br />
RA1S 1V(=1CV) 1CV(DF,"DeltaV") 1CV(DT,"DeltaT") 1CV(RC,"RC~mV/s")<br />
1V 29.4 mV<br />
DeltaV 3.9<br />
DeltaT 00:00:00.992 0<br />
RC 4.0 mV/s<br />
In this case four channels are defined in the schedule. The first will measure a voltage, return the reading, and assign it to<br />
1CV. The second channel will compare the newly updated value of 1CV to the value it had when the channel was last<br />
evaluated (one second ago) and return the difference. Similarly the third and fourth channels will return the time difference<br />
(which will in this case always be close to one second) and rate of change, respectively.<br />
The RS option is similar to RC except that the numerator is the actual reading, not the difference. This is intended for use with<br />
channels where the reading is already a difference. In the following example the counter is reset after each reading (using<br />
the R channel option), so the count reading is actually the number of counts since the last reading, so to calculate counts per<br />
second the RS option is used:<br />
RA10S 3C(R,RS,"~counts/s")<br />
Finally, the IB option is used to integrate a signal. It returns the area under a straight line connecting the current to the<br />
previous reading. For example:<br />
RA20S 1V(=1CV,W) 2#I(=2CV,W)<br />
3CV("Power~W",=4CV)=1CV*2CV<br />
4CV(IB,W,+=5CV)<br />
5CV("Energy~J")<br />
The above example will, every 20 seconds, first measure a voltage and a current and assign them to two channel variables.<br />
These are then multiplied to give the instantaneous power in Watts (3CV), then integrated to give the energy used over the<br />
20 second period (4CV). Finally, the energy values are accumulated in channel variable 5CV to give the total energy used.<br />
Edge Timing<br />
A number of channel options are provided for reporting details relating to the timing of digital transitions (edges).<br />
As with the rate and integral options, these derived quantities are calculated based solely on the current and the previous<br />
channel readings.<br />
The TOR and TOF options return the absolute date/time at which a last rising or falling edge occurred. If no edge has<br />
occurred since the last reading then a "zero" date/time value (normally presented as 00:00:00.000,01/01/1989) is<br />
returned.<br />
The following options report the time interval between two edges:<br />
If a rising edge has occurred since the last reading on a channel, and another rising edge has occurred some time<br />
previously, then the TRR option returns the time interval between the two edges, otherwise it returns zero.<br />
If a rising edge has occurred since the last reading on a channel, and a falling edge has occurred some time<br />
previously, then the TFR option returns the time interval between the two edges, otherwise it returns zero.<br />
If a falling edge has occurred since the last reading on a channel, and another falling edge has occurred some time<br />
previously, then the TFF option returns the time interval between the two edges, otherwise it returns zero.<br />
UM-0085-B2 <strong>DT80</strong> <strong>Series</strong> User’s <strong>Manual</strong> Page 67
If a falling edge has occurred since the last reading on a channel, and a rising edge has occurred some time<br />
previously, then the TRF option returns the time interval between the two edges, otherwise it returns zero.<br />
For example:<br />
RA1E 1DS 1DS(TOF,"-edge at") 1DS(TFF,"period")<br />
1DS 0 State<br />
-edge at 15:30:35.015 01/02/2007<br />
period 00:00:00.000 0<br />
1DS 1 State<br />
-edge at 00:00:00.000 01/01/1989<br />
period 00:00:00.000 0<br />
1DS 0 State<br />
-edge at 15:30:45.018 01/02/2007<br />
period 00:00:10.003 0<br />
1DS 1 State<br />
-edge at 00:00:00.000 01/01/1989<br />
period 00:00:00.000 0<br />
In the above example the A schedule runs when a rising or falling edge on digital input 1 occurs, and reports the time at<br />
which each falling edge occurs, as well as the time between successive falling edges (i.e. the period).<br />
Note that it is not possible to set the schedule to only trigger on falling edges (using RA1-E), because then the state of 1DS<br />
would be zero each time the schedule ran. This would mean that no falling edges (i.e. current value = 0, previous value = 1)<br />
would be detected.<br />
Statistical Channel Options<br />
Overview<br />
It is often convenient to sample channels frequently and a return and/or log a statistical summary at longer intervals (see<br />
Statistical Report Schedules (P50)). Statistical channels are sampled during the period between report times (at a rate<br />
governed by the statistical schedule, RS), and the statistical summary is generated and returned at report time, i.e. when the<br />
regular schedule runs.<br />
Channels that require statistical sampling must include a channel option to indicate the statistical information to generate.<br />
Here’s a summary of the statistical channel options — see also the Statistical (P40) category in the Table 3: <strong>DT80</strong> Channel<br />
Options (P41) table:<br />
Channel Option Description Appended to Units<br />
AV Average (Ave)<br />
SD Standard deviation (SD)<br />
MX Maximum (Max)<br />
MN Minimum (Min)<br />
TMX Time of maximum (Tmx)<br />
TMN Time of minimum (Tmn)<br />
DMX Date of maximum (Dmx)<br />
DMN Date of minimum (Dmn)<br />
IMX Instant of maximum (combines DMX and TMX) (Imx)<br />
IMN Instant of minimum (combines DMN and TMN) (Imn)<br />
INT Integral (Int)<br />
NUM Number of samples (Num)<br />
The statistical option is defined by including it as a channel option in parentheses after the channel type. For example:<br />
RA1M 3TT(AV)(NUM)<br />
3TT 103.7 degC (Ave)<br />
3TT 42 (Num)<br />
3TT 110.2 degC (Ave)<br />
3TT 60 (Num)<br />
In this case you will see the Sample LED flash once per second (which is the default rate for RS), but data will only be<br />
returned once per minute. These data consist of average of the samples taken since the A schedule last ran, and the number<br />
of samples (which will normally be 60). Note that a tag, e.g. (Ave), is attached to the units to indicate the statistical function<br />
that has been applied.<br />
UM-0085-B2 <strong>DT80</strong> <strong>Series</strong> User’s <strong>Manual</strong> Page 68
Note There may be fewer than expected samples in the first sample period after starting a schedule. This is because, by<br />
default, schedule execution is synchronised to midnight (see Time Triggers — Synchronizing to Midnight (P52)) so a one<br />
minute schedule will always execute on minute boundaries.<br />
If insufficient statistical samples have been taken at the time when the report schedule runs then an error message returned<br />
and the data value is flagged as "not yet set". The SD and INT options require a minimum of two samples, the others require<br />
at least one sample. To minimise the chance of this condition occurring:<br />
switch off the synchronise to midnight flag (/s), or<br />
ensure that the reporting schedule period is substantially longer than the statistical schedule period.<br />
Statistical Functions<br />
Average (AV)<br />
The average or mean is the sum of all the channel readings divided by the number of readings. It is very useful in reducing<br />
sensor noise.<br />
Standard Deviation (SD)<br />
Standard deviation is a measure of the variability of the data about the average or mean. The variation may be due to<br />
electrical noise or process changes. The units of standard deviation are the same as the channel reading.<br />
Maximum and Minimum (MX and MN)<br />
The maximum and minimum of a set of channel readings can be reported with the MX and MN channel options.<br />
The time at which these occurred can be reported with the TMX and TMN options, the date with DMX and DMN, and the<br />
combined date/time ("instant") with the IMX and IMN channel options.<br />
For example:<br />
RS1M RA30M 1TK(AV) RB1D 1TK(MX)(TMX)(MN)(TMN)<br />
1TK 24.2 degC<br />
1TK 21.9 degC<br />
1TK 19.0 degC<br />
1TK 33.9 degC (Max)<br />
1TK 15:10:00.000 (Tmx)<br />
1TK 12.9 degC (Min)<br />
1TK 04:33:00.000 (Tmn)<br />
The above job measures the temperature once a minute (RS1M). Every 30 minutes the average for the 30 minute period is<br />
returned by the A schedule. Once a day (at midnight), the daily min/max temperatures are returned, along with the times at<br />
which they occurred.<br />
Integration (INT)<br />
The integration channel option returns the integral (area under the curve) with respect to time in seconds using a trapezoidal<br />
approximation. The units of an integration are those of the original reading multiplied by seconds.<br />
In the following example a sensor returns a voltage that is proportional to the flow rate (0-1000mV = 0-0.2 l/s):<br />
BEGIN<br />
RS100T<br />
S5=0,0.2,0,1000"litres"<br />
1CV=0<br />
RA2S 1V(S5,INT,+=1CV,W) 1CV("Fuel Used",FF3)<br />
END<br />
Fuel used 0.012 litres<br />
Fuel used 0.104 litres<br />
Every 100ms, the voltage output from the sensor is measured, scaled by span S5 (yielding a value in litre/s) and the integral<br />
is progressively accumulated (yielding a value in litres). This is then accumulated in 1CV (yielding the total number of litres<br />
used since the schedule started), which is reported every 2 seconds.<br />
Note the differences between the INT and IB options (both of which calculate integrals):<br />
<br />
<br />
The IB option uses two points only (the current value and the previous value) and calculates the area under the curve<br />
using a single trapezoid. It does not involve the statistical schedule.<br />
INT is a statistical option. It calculates the integral using a trapezoid for each sample point measured by the statistical<br />
schedule.<br />
UM-0085-B2 <strong>DT80</strong> <strong>Series</strong> User’s <strong>Manual</strong> Page 69
Multi Value Statistical Options<br />
The statistical options described here are special in that they return multiple values. A channel can only have one return<br />
value, so these options work by setting channel variables.<br />
These channel options do not affect the usual reporting or logging of the channel’s readings.<br />
Histogram (Hx:y:m..nCV)<br />
The <strong>DT80</strong> can be used to generate a histogram (frequency distribution) of channel samples by applying the histogram<br />
channel option, which instructs the <strong>DT80</strong> to<br />
divide the measured data range into a number of intervals called classes<br />
count the number of readings that occur in each class during the histogram period<br />
load each class count into a separate channel variable.<br />
Then use another schedule to read, log and clear the channel variables.<br />
Classes<br />
Number of<br />
Occurrences<br />
(Counts)<br />
Class interval<br />
x<br />
Figure 19: Histogram<br />
Channel Reading<br />
y<br />
In addition, the <strong>DT80</strong> automatically counts the number of under-range, over-range and total readings, and stores these in<br />
three separate channel variables.<br />
The format of the histogram channel option is:<br />
Hx:y:m..nCV<br />
where:<br />
x and y are the lowest and highest channel readings of interest, as shown in the above diagram<br />
m and n denote the range of channel variables (mCV to nCV inclusive) to use for storing count values.<br />
The channel variables are set as follows:<br />
Channel Variable<br />
mCV<br />
...<br />
(n-3)CV<br />
(n-2)CV<br />
(n-1)CV<br />
nCV<br />
Function<br />
number of readings in the lowest class<br />
number of readings in the highest class<br />
number of readings under range (y)<br />
total number of readings including those out of range<br />
The range x..y will therefore be broken up into (n – m – 2) classes.<br />
Example — Histogram<br />
To create a histogram of a temperature channel over five classes requires eight channel variables:<br />
BEGIN"HISTO"<br />
11..18CV=0<br />
RA1S 1TT(H25.0:35.0:11..18CV)<br />
RBX 16CV("Under") 11..15CV 17CV("Over") 18CV("Total")<br />
RCX 11..18CV=0<br />
END<br />
The A schedule will report the temperature once a second. It will also accumulate a histogram with five temperature classes<br />
and intervals of 2°C:<br />
11CV counts readings in the first class (25.0 to 26.999°C interval)<br />
<br />
12CV counts readings in the second class (27.0 to 28.999°C interval)<br />
UM-0085-B2 <strong>DT80</strong> <strong>Series</strong> User’s <strong>Manual</strong> Page 70
13CV counts readings in the third class (29.0 to 30.999°C interval)<br />
<br />
<br />
14CV counts readings in the fourth class (31.0 to 32.999°C interval)<br />
15CV counts readings in the fifth class (33.0 to 34.999°C interval)<br />
The following three CVs will also be updated:<br />
<br />
<br />
<br />
16CV is the number of under-range samples (35°C)<br />
18CV is the total number of samples (sum of 11..17CV)<br />
The B schedule will, when polled, report the current histogram data. Polling the C schedule will clear the histogram data. A<br />
typical histogram report would look like:<br />
XB<br />
Under 7<br />
11CV 19<br />
12CV 33<br />
13CV 102<br />
14CV 71<br />
15CV 22<br />
Over 2<br />
Total 246<br />
Rainflow Cycle Counting<br />
Rainflow cycle counting (also called rainflow analysis) is an internationally-accepted method of fatigue cycle counting<br />
used for monitoring long-term accumulative structural fatigue damage. The process reduces large quantities of cyclic data —<br />
collected from sensors attached to the structure over a long period of time — into relatively simple histograms.<br />
As a structure deflects due to repetitive external influences, measurements produce arbitrary peak and valley sequences<br />
that form closed loops or cycles. Each loop or cycle has a size (the difference between peak and valley magnitudes), and<br />
rainflow analysis accumulates a profile of the number of cycles versus cycle size into a histogram.<br />
A minimum cycle size can be defined that sets a noise rejection level, and cycle sizes below this level are rejected as noise<br />
and are not counted.<br />
The <strong>DT80</strong> implements the ASTM E 1049-85 standard: Standard Practices for Cycle Counting in Fatigue Analysis.<br />
Real-time rainflow analysis can be carried out using the <strong>DT80</strong>’s RAINFLOW channel option, which instructs the <strong>DT80</strong> to<br />
monitor attached strain gauges at regular intervals and reduce the resulting large quantity of data into simple cycle<br />
histograms.<br />
The <strong>DT80</strong> can also produce a formatted report of the accumulated cycle histograms — see Reporting Rainflow Data (P72).<br />
Although the rainflow cycle counting has been optimized for welded steel structures, it can be used to record arbitrary<br />
waveforms from other sources — temperature cycles in a furnace or electrical signals, for example.<br />
Collecting Rainflow Data<br />
Rainflow analysis is defined by the RAINFLOW channel option. Although this is generally used for channels measuring<br />
strain gauge inputs, you can also use it for any type of sensor that is monitoring a process that produces cycles of peaks and<br />
valleys with hysteresis.<br />
The overall range of cycle sizes is divided into a number of smaller cycle size classes and, as the analysis proceeds, the<br />
number of cycles of each size class is counted. These counts are accumulated into the <strong>DT80</strong>’s 32-bit signed Integer<br />
Variables (channel type nIV).<br />
(These integer variables are only for use with rainflow analysis.)<br />
The RAINFLOW channel option requires a maximum cycle size to be specified, a noise rejection level, and a range of<br />
sequential integer variables or channel variables that can be used for accumulating the cycle size counts and other<br />
information. It has the form:<br />
RAINFLOW:a:b:c..dIV<br />
where:<br />
a is the maximum cycle size expressed in the channel type units (for example, ppm)<br />
b is the minimum cycle size for noise rejection expressed as a percentage of a<br />
c and d denote the range of integer variables (cIV to dIV inclusive) to use for storing count values.<br />
Therefore the range of cycle sizes is from zero to the maximum cycle size defined (a), and cycle sizes smaller than b% of a<br />
are rejected and not counted. For example, the channel option<br />
(RAINFLOW:1000:5:c..dIV)<br />
sets the cycle size range to 0–1000 units, and cycle sizes less than 50 (5% of 1000) units are rejected as noise.<br />
The number of variables allocated for the rainflow analysis must be set to the number of cycle size classes required over the<br />
cycle size range, plus seven (7) additional variables for summary data. For example, if you require 10 cycle size classes over<br />
the cycle size range then 17 variables will be needed. The variables can begin at any number in their range of 1 to 500 (c),<br />
and are used sequentially to the last variable number (d).<br />
UM-0085-B2 <strong>DT80</strong> <strong>Series</strong> User’s <strong>Manual</strong> Page 71
The use of variables in the allocated variable range is summarized in the following table. The first column shows how<br />
variables are used within the allocated range, and the last column shows how 20 variables are used. The last 7 variables<br />
contain various summary data.<br />
c..dIV IV Contents<br />
Example:<br />
21..40IV<br />
c+0 Contains the count of cycles for the first cycle size class 21IV<br />
c+1 Contains the count of cycles for the second cycle size class 22IV<br />
c+2 Contains the count of cycles for the third cycle size class 23IV<br />
<br />
d–7 Contains the count of cycles for the last cycle size class 33IV<br />
d–6 Contains the count of cycles that over-ranged the maximum<br />
34IV<br />
cycle size<br />
d–5 Contains the count of all cycles 35IV<br />
d–4 Contains the maximum buffered cycles 0..100 (or 99999 if the buffer has 36IV<br />
overflowed and buffered half-cycles have been lost)<br />
Summary data<br />
d–3 Contains the minimum valley encountered 37IV<br />
d–2 Contains the maximum peak encountered 38IV<br />
d–1 Contains the total number of good points 39IV<br />
d–0 Contains the total number of "in error" points (out of range, for example) 40IV<br />
In practice, some cycles do not close immediately and are buffered until a closure is detected. Variable d–4 contains a count<br />
of these unclosed or "half cycles".<br />
Note: The rainflow channel option can be used on a maximum of 16 channels.<br />
Rainflow cycle data is collected at a rate dependent on the frequency of influences deforming the structure under test. These<br />
might be quite slow events (such as waves crashing against a sea wall), or quite fast (such as a high speed boat hull<br />
travelling through waves).<br />
Place the channel being sampled for rainflow in a schedule that’s triggered fast enough to take sufficient readings during a<br />
cycle to adequately characterise the loop closures. For example, the schedule<br />
RA50T 3BGI(RAINFLOW:a:b:c..dIV,W)<br />
measures the input every 50ms (20 times/sec), and counts loop closures. The W channel option declares this as a working<br />
channel (does not return or log the individual samples of strain-stress.<br />
Reporting Rainflow Data<br />
Rainflow data is collected over long periods of time using the RAINFLOW channel option. Then, periodically, the rainflow<br />
cycle histogram can be retrieved by a computer, using the RAINFLOW command.<br />
To report the rainflow cycle histogram, send the original rainflow channel option exactly as originally defined for the channel,<br />
but as a command. That is, send the command:<br />
RAINFLOW:a:b:c..dIV<br />
The <strong>DT80</strong> returns a tabular report as illustrated below:<br />
RAINFLOW:72:5:1..27IV<br />
Rainflow ( 5% rejection) 01/01/2000 00:03:43<br />
n IV/CV Range Mean Cycles<br />
==============================================<br />
1 1 0.0 0.0 0<br />
2 2 3.6 11.4 27<br />
3 3 7.2 11.3 6<br />
4 4 10.8 12.4 6<br />
5 5 14.4 11.9 6<br />
6 6 18.0 12.8 9<br />
7 7 21.6 12.3 2<br />
8 8 25.2 0.0 0<br />
9 9 28.8 0.0 0<br />
10 10 32.4 0.0 0<br />
11 11 36.0 18.0 1<br />
12 12 39.6 0.0 0<br />
13 13 43.2 0.0 0<br />
14 14 46.8 0.0 0<br />
15 15 50.4 0.0 0<br />
16 16 54.0 0.0 0<br />
17 17 57.6 0.0 0<br />
18 18 61.2 0.0 0<br />
19 19 64.8 0.0 0<br />
20 20 68.4 0.0 0<br />
21 21 >= 72.0 0.0 0<br />
UM-0085-B2 <strong>DT80</strong> <strong>Series</strong> User’s <strong>Manual</strong> Page 72
==============================================<br />
Total cycles 58<br />
Peak/Valley mean 12.6<br />
Max Peak 71<br />
Min Valley -1<br />
Max buffered cycles 11<br />
Valid input points % 100.00<br />
The rainflow report provides a complete summary of the rainflow data for the collection period. The cycle size range for each<br />
class, the number of cycles in each class, and the mean for each class is shown, as well as the summary data.<br />
Although the rainflow report cannot be logged in the <strong>DT80</strong>, the primary cycle count data used to make up the rainflow report<br />
can. For example, the program<br />
BEGIN"Rainflow"<br />
RA50T 2BGI(RAINFLOW:72:5:1..27IV,W)<br />
RB7D 1..27IV<br />
LOGONB<br />
END<br />
logs the histogram data every 7 days. Reports can be created manually after download of the primary cycle count data.<br />
Example — Rainflow Cycle Counting<br />
Capture raw strain gauge data and perform rainflow cycle analysis using the program<br />
BEGIN<br />
RA50T 1BGI(RAINFLOW:1000:5:101..127IV,W)<br />
END<br />
This instructs the <strong>DT80</strong> to<br />
collect current-excited bridge data (1BGI) every 50ms (RA50T) and carry out rainflow analysis over the range of zero<br />
to 1000 ppm<br />
<br />
apply a 5% rejection (that is, cycles smaller than 50ppm are rejected)<br />
accumulate cycles into histogram variables 101 through 127 (101..127); this gives 20 cycle size classes for cycle<br />
counts, and 7 others for summary information.<br />
The matching rainflow report command<br />
RAINFLOW:1000:5:101..127IV<br />
can then be used to return a summary report.<br />
UM-0085-B2 <strong>DT80</strong> <strong>Series</strong> User’s <strong>Manual</strong> Page 73
Part F – Alarms<br />
Alarm Concepts<br />
<strong>DT80</strong> alarms allow decisions to be made based on the magnitude of <strong>DT80</strong> input channels, channel variables, timers, the<br />
clock/calendar, internal channels, system variables and so on. The decision is a true or false result of an alarm condition<br />
test. The true/false result is also known as the alarm state.<br />
The <strong>DT80</strong> can be instructed to carry out actions when an alarm tests true. These actions can be setting the <strong>DT80</strong>’s digital<br />
state outputs, issuing messages, or executing commands to change the <strong>DT80</strong>’s operation.<br />
Alarm transitions can also be logged to the <strong>DT80</strong>'s internal file system for later analysis.<br />
There are two types of alarms:<br />
<br />
<br />
single shot alarms (ALARM command) act once on the transition of the condition test from false to true<br />
repeating alarms (IF and DO commands) act repeatedly each time the enclosing schedule runs, while the condition<br />
tests true<br />
Single-shot alarm RA3S ALARM…<br />
Alarm actions occur once when the alarm becomes true.<br />
Alarm<br />
actions<br />
Alarm=TRUE<br />
Alarm=TRUE<br />
Alarm is tested every 3 seconds<br />
Time<br />
Repeating alarm RA3S ALARMR…<br />
Alarm actions occur every 3 seconds while the alarm is true.<br />
Alarm<br />
actions<br />
Alarm=TRUE<br />
Alarm=TRUE<br />
Alarm is tested every 3 seconds<br />
Time<br />
Figure 20: Comparing single-shot and repeating alarms (3-second schedule example)<br />
Alarm commands can be included in any report schedule, and are processed in sequence with other schedule processes<br />
such as reading input channels and performing calculations.<br />
Alarm Commands<br />
The <strong>DT80</strong> provides three main alarm commands, each with a similar basic syntax:<br />
ALARMn(test)digitalAction"actionText"{actionProcesses}<br />
IFn(test)digitalAction"actionText"{actionProcesses} (ALARMR is also accepted as a synonym for IF.)<br />
DOn"actionText"{actionProcesses}<br />
where:<br />
n is the alarm number, used to distinguish logged alarms (optional)<br />
test is the alarm condition to test<br />
digitalAction is one or two digital output or CV channels which will follow the alarm state (optional)<br />
"actionText" is a text string to output if the alarm condition tests true (optional)<br />
{actionProcesses} is a set of channel definitions and/or commands to be executed if the alarm condition tests true<br />
(optional)<br />
These are explained further in the following sections.<br />
Note that the DO command is the same as IF except that the alarm condition is assumed to be always true.<br />
UM-0085-B2 <strong>DT80</strong> <strong>Series</strong> User’s <strong>Manual</strong> Page 74
Alarm Number<br />
Alarm commands can optionally be given a number (1-255), which is used to identify the alarm when an alarm transition is<br />
logged.<br />
For example:<br />
RA1S ALARM1(2TT30)"Too hot" LOGON<br />
will test a temperature once per second. If the temperature dips below 15°C an alarm record indicating that alarm #1 has<br />
triggered will be logged to the <strong>DT80</strong>'s internal file system. See Logging and Retrieving Data (P84) for more details about the<br />
logging of data and alarms.<br />
Alarm numbers need not be allocated in order, and they need not be unique (although normally they would be) – whatever<br />
you select as the alarm number will be what is logged if the alarm is triggered.<br />
Note that unnumbered alarms, e.g.:<br />
IF(1CV>10){9CV=9CV+1}<br />
are not logged, even if logging is enabled for the schedule<br />
Alarm Condition<br />
The alarm condition compares a channel value to one or two setpoints. The state of the alarm is then set to true or false<br />
based on this test. (Note that in the case of the DO command, no alarm condition is specified – the state of the alarm is<br />
always true.)<br />
Six different types of test are supported:<br />
Condition<br />
Alarm is true if<br />
(chan==setpoint)<br />
channel value is equal to setpoint<br />
(chan!=setpoint)<br />
channel value is not equal to setpoint<br />
(chansetpoint)<br />
channel value is greater than or equal to setpoint<br />
(chan>52)<br />
setpoint is a constant (e.g. 2.77) or channel variable specifier (e.g. 13CV)<br />
Note The equality (==) and inequality (!=) tests should normally only be used where the quantities being compared are<br />
integers. Floating point values are subject to rounding errors. For example, after adding 0.1 to a CV ten times, the result will<br />
not necessarily be exactly 1.0<br />
In addition, a time specifier may be appended to the above. If a time specifier is present, the alarm will only be set true after<br />
the condition has been continuously true for the specified time.<br />
A time specifier has one of the following forms:<br />
Time Specifier<br />
Condition must be continuously true for<br />
/nS<br />
n seconds<br />
/nM<br />
n minutes<br />
/nH<br />
n hours<br />
/nD<br />
n days<br />
Some sample alarm conditions are shown below:<br />
Condition<br />
Alarm is true if<br />
(2R(II)>51.5)<br />
channel 2R value is greater than or equal to 51.5 ohms<br />
(3+V(AV)
Note that by default the value of the channel that is tested in an alarm condition is neither logged nor returned. It will,<br />
however, be displayed, unless you disable this using the ND or W options.<br />
If you want to log or output the channel's value each time it is tested then include the LM (log measurement) option, e.g.<br />
ALARM(1TK(LM)>35)"Hot"<br />
Complex Conditions<br />
As indicated above, only relatively simple condition tests can be included in an alarm command. There are two ways to<br />
perform a more complex test.<br />
Boolean Expressions<br />
An arbitrarily complicated boolean expression can be constructed and assigned to a CV, which can in turn then be tested in<br />
an alarm command. For example:<br />
RA5S<br />
1V(=1CV) 2V(=2CV) 3V(=3CV)<br />
9CV=((1CV>2.2)AND(1CV/2CV=(1CV+2CV)))OR(3CV=0.0)<br />
ALARM(9CV>0.5)"Condition red"<br />
Note that the syntax for boolean expressions is quite different to that used in alarm conditions.<br />
In the above example 9CV will get the value 1.0 if the expression evaluates to true, otherwise 0.0<br />
You can also use the result of a boolean expression in an arithmetic expression, making use of the fact that the value of the<br />
boolean expression is always 1.0 or 0.0. For example,<br />
12CV=4CV*(1CV>2.5)+5CV*(1CV100)OR<br />
ALARM(1+TK>100)OR<br />
ALARM(1-TK>100)AND<br />
ALARM3(T>10:00:00)"Temp Error"{1DBO=12}<br />
produces a single alarm output based on several temperature tests and a time test. The combined alarm becomes true when<br />
any one of 1*TK, 1+TK or 1-TK exceeds 100°C after 10:00:00 am. Notice that the alarm conditions are evaluated<br />
sequentially ("left to right"); the three logical operators (AND, OR or XOR) all have equal precedence.<br />
Note also that the type of alarm (single shot vs. repeating) and the alarm number are solely determined by the last channel in<br />
a chain of concatenated alarm channels e.g.<br />
ALARM27(1CV>1)AND<br />
ALARM5(2CV>4)"boo"<br />
is exactly equivalent to<br />
IF99(1CV>1)AND<br />
ALARM5(2CV>4)"boo"<br />
ie it's a single shot alarm with ID 5.<br />
UM-0085-B2 <strong>DT80</strong> <strong>Series</strong> User’s <strong>Manual</strong> Page 76
Alarm Digital Action Channels<br />
One or two comma-separated digital action channels can be declared for each alarm. These channels will then mimic the<br />
state of the alarm. That is, these outputs are set to their default state if the alarm tests false, and are set to there non default<br />
state if the alarm tests true:<br />
Digital action channels can be:<br />
digital outputs (nDSO)<br />
Attn LED output (1WARN)<br />
latching relay output (1RELAY)<br />
channel variables (nCV)<br />
These will be set according to the following table:<br />
Digital Action Channel Value if Alarm FALSE Value if Alarm TRUE<br />
1 (high/off) 0 (low/on)<br />
1..4DSO (<strong>DT80</strong>)<br />
1..3DSO (DT81)<br />
5..8DSO (<strong>DT80</strong>) 0 (low) 1 (high)<br />
4DSO (DT81)<br />
1WARN 0 (LED off) 1 (LED on)<br />
1RELAY 0 (relay open) 1 (relay closed)<br />
nCV 0.0 1.0<br />
Typically, the digital state outputs are used to annunciate the <strong>DT80</strong> alarm by switching devices such as relays, sirens and<br />
lights, or to directly control actuators and similar equipment.<br />
For example,<br />
RA1M ALARM(4TK2100)2CV,1RELAY"ReactorScram"<br />
checks a temperature every 10s; if it exceeds 2100°C then the relay will close and 2CV will be set to 1.0 until the temperature<br />
drops back below the setpoint. Once this occurs the relay will open and 2CV will be set back to 0.0.<br />
Alarm Action Text<br />
Action text may be included in an alarm command. This text string is automatically returned to the host computer and/or<br />
logged to the internal file system:<br />
once whenever the state of a single-shot alarm (ALARM) goes from false to true, or<br />
<br />
repeatedly at the controlling schedule’s rate while a repeating alarm (IF or DO) remains true.<br />
Up to 245 characters of action text can be included in each alarm.<br />
Note The action text may be truncated when it is logged. A fixed amount of space is allocated in the log file for storing the<br />
alarm text, which is set by the ALARMS:Wn (alarm width) schedule option; see Schedule Options (P43). If the default setting<br />
of 60 is used, each logged alarm string will be truncated to 60 characters.<br />
Setting the alarm message switch (P201) to /z stops the return of the action text to the host – in a similar way to the NR (no<br />
return) channel option.<br />
Destination for Text<br />
Action text is normally enclosed in "double quotes", in which case it is returned to the host computer using the currently<br />
active communication port.<br />
If, however, the action text is instead enclosed in 'single quotes', the actionText is sent exclusively to the RS232 Host Port<br />
on the logger. This is useful for communicating with modems when they are in command mode and when the host port is<br />
used for other purposes.<br />
UM-0085-B2 <strong>DT80</strong> <strong>Series</strong> User’s <strong>Manual</strong> Page 77
Substitution Characters<br />
Special substitution characters can be placed into actionText. These instruct the <strong>DT80</strong> to dynamically insert the following<br />
information when the alarm returns and/or logs its action text:<br />
Alarm text where Substitutes the following Example<br />
! <strong>DT80</strong> serial number, :, alarm number 080035:8<br />
!! ! character !<br />
@<br />
time at which action text was returned<br />
12:13:14.634<br />
(in P39 and P40 format)<br />
@@ @ character @<br />
# date at which action text was returned<br />
17/9/2007<br />
(in P31 format)<br />
## # character #<br />
C standard channel name 2PT385<br />
N user channel name Boiler<br />
R relation (test condition) >100<br />
U channel units degC<br />
V channel value when alarm tested true<br />
100.2<br />
(use FFn etc. channel options to control format)<br />
A A = any letter (A-Z) not valid<br />
other than CNRUV<br />
nFp n = 1-1000, p = 0-7 value of nCV in fixed point format, p decimal places -1257.42 (p=2)<br />
nEp n = 1-1000, p = 0-7 value of nCV in exponential format, p decimal places -1.26E3 (p=2)<br />
nMp n = 1-1000, p = 0-7 value of nCV in mixed format, p significant digits -1.3E3 (p=2)<br />
nF n = 1-1000 same as nF1 -1257.4<br />
nE n = 1-1000 same as nE1 -1.3E3<br />
nM n = 1-1000 same as nM1 -1E3<br />
nA A = any letter (A-Z) not valid<br />
other than FEM<br />
n$ n = 1-50 value of string variable n$ east<br />
n n = 1-1000 same as nF1 -1257.4<br />
character <br />
same as V 100.2<br />
c c = any character c a<br />
Note Substitution characters are not case sensitive (v is equivalent to V)<br />
Special Characters<br />
Special characters may be inserted in alarm strings using control character (e.g. ^M) or backslash (e.g. \013) notation. See<br />
ASCII-Decimal Tables (P314) for more information.<br />
For example,<br />
ALARM(3TT>120)"\192 hautes temp\233ratures!! v \176C^M^J"<br />
will return/log the following string when the specified temperature is exceeded:<br />
À hautes températures! 129.4 °C<br />
In this example the \192 and \233 insert the accented characters, \176 inserts the degree symbol, and ^M^J adds a<br />
carriage return/line feed pair. Note also the !! to generate a single exclamation mark, and the v substitution string, which<br />
is replaced by the channel value.<br />
If the software used to enter the program text supports it, you could alternatively have entered the special characters directly,<br />
i.e.<br />
ALARM(3TT>120)"À hautes températures!! v °C^M^J"<br />
Be aware that many extended ASCII character codes display differently on the <strong>DT80</strong>'s LCD compared with the host<br />
computer. See ASCII-Decimal Tables (P314).<br />
Examples<br />
Text Labels<br />
The DO command in conjunction with alarm text provides a simple way to output a text string in a schedule, e.g.:<br />
RA5M DO"Boiler 1^M^J" 1TK 2TK DO"Boiler 2^M^J" 3TK 4TK DO"^M^J"<br />
will include a heading before each group of measurements:<br />
Boiler 1<br />
1TK 239.4 degC<br />
2TK 99.9 degC<br />
Boiler 2<br />
UM-0085-B2 <strong>DT80</strong> <strong>Series</strong> User’s <strong>Manual</strong> Page 78
3TK 212.4 degC<br />
4TK 90.9 degC<br />
Modem Commands<br />
The schedule command<br />
RC2+E DELAY=500 DO"AT&F E0 Q1 S0=2 ^M"<br />
instructs the <strong>DT80</strong> to output a modem initialization string 500ms after an external event occurs (2+E); for example, when the<br />
modem powers up.<br />
Alarm Action Processes<br />
Action processes can be any <strong>DT80</strong> functions to be executed when an alarm is true. These functions can be reading input<br />
channels, setting output channels, calculations, setting parameters and switches, and so on.<br />
In addition, action processes are a very powerful programming facility for the <strong>DT80</strong>. Use them to perform a wide range of<br />
program-related functions such as re-programming on events, adaptive schedules (see examples below), programmed<br />
calibration cycles, management of digital state outputs, and management of the Serial Channel.<br />
Action processes are also useful with unconditional alarm commands (DO commands) as a means of executing a <strong>DT80</strong><br />
command (as opposed to a channel) within a schedule. See Executing Commands in Schedules (P52) for more details.<br />
Action processes are placed within braces { } as the last element in an alarm command. Each "process" is either:<br />
a channel definition (e.g. 1+V(=1CV) or 3DSO=0), or<br />
a command (e.g. XC or P12=5 or SATTN or LOGONA), or<br />
a schedule trigger re-definition (e.g. RA100T)<br />
Alarm commands cannot be included.<br />
Any number of processes may be included, but they must all be on the same line. Processes can be separated by<br />
semi-colon (;) or space characters.<br />
Order of Execution<br />
When an alarm is triggered, things happen in the following sequence:<br />
1. Digital action channels (if any) are set to the required value<br />
2. Alarm text (if any) is generated and returned/logged<br />
3. Any channels in the action process list are evaluated, left to right. All channels in an alarm process list are treated as<br />
working channels – they are neither returned, logged nor displayed.<br />
4. Any commands or schedule trigger re-definitions are queued for execution, working left to right.<br />
5. Any further channels or alarm commands in the current schedule are executed<br />
6. Any queued commands, including the ones generated by the alarm, are executed.<br />
For example, the job<br />
BEGIN<br />
RA5S ALARM1(3TK>30){XB 1DSO=0 SATTN} 4V(NR)<br />
RC1S 1V<br />
RBX 1SERIAL("{boo!}")<br />
LOGON<br />
END<br />
will perform as follows:<br />
1. Schedules A & C will become due at the same time, because A's scan rate is an exact multiple of C's. A will run first,<br />
because, as noted in Triggering and Schedule Order (P51), A comes before C in the priority order.<br />
2. Channel 3TK exceeds 30 so the alarm is triggered. The alarm is numbered and logging is enabled so an alarm record<br />
will be logged, although the alarm text field will be an empty string.<br />
3. Channel 1DSO is evaluated – output 1D is set low.<br />
4. The command string XB;SATTN; is queued for execution.<br />
5. Channel 4V is evaluated. It's value is logged and displayed but not returned.<br />
6. Schedule A is now finished; schedule C is selected to run next. It does not actually run, however, because there are<br />
queued commands to execute.<br />
7. The XB command is now executed. This causes the B schedule to become due.<br />
8. The SATTN command is executed, which turns on the Attn LED<br />
9. There are no more queued commands so the C schedule can now run. Channel 1V is evaluated and<br />
logged/displayed/returned.<br />
UM-0085-B2 <strong>DT80</strong> <strong>Series</strong> User’s <strong>Manual</strong> Page 79
10. Schedule B is also due, so it now runs. The 1SERIAL channel is evaluated, which causes a string to be sent out the<br />
serial sensor port.<br />
11. There is nothing further to do so the logger idles until schedule C next becomes due.<br />
In most applications the ordering is not particularly important as all of the alarm actions occur within a very short space of<br />
time. However, it can cause surprises in some circumstances, as illustrated below.<br />
Trap – Commands Don't Affect Channels in Same Schedule<br />
Any commands executed in an action process list will not take effect until after all channels have been processed. For<br />
example, if you wanted some measurements to be returned in fixed format mode and some in free format, you might try:<br />
RA1S DO{/H/R} 1V DO{/h/R} 2V ' does not work!<br />
but in fact both channels will be returned in free format mode.<br />
To achieve the desired result you need to do something like:<br />
RA1S 1V DO{/H/R XB}<br />
RBX 2V DO{/h/R}<br />
In this example 1V will be returned in free format mode, then we switch to fixed format mode, then we issue the command to<br />
poll schedule B. Schedule B will then do the same thing: return 2V in fixed format mode, then switch back to free format<br />
mode so that the next time schedule A runs it will return its value in the correct format.<br />
Note In the <strong>DT80</strong>, commands have higher priority than schedules. If there are any queued commands outstanding, they will<br />
be executed ahead of any schedules that happen to be due. However, once a schedule starts executing, it always runs to<br />
completion – any queued commands will be held off until the schedule completes.<br />
Trap – Don't Use DELAY Between Commands<br />
The DELAY=ms function is a channel, not a command. It therefore cannot be used to insert a delay between two<br />
commands. For example, if you wanted to light the Attn LED for 5 seconds to indicate that a measurement was about to be<br />
taken, you might try<br />
RA20M DO{SATTN; DELAY=5000; CATTN; XB} RBX 1V ' does not work!<br />
but this is no good because the DELAY, being a channel, is executed first, then SATTN;CATTN;XB in quick succession.<br />
The PAUSE ms command does the same thing as DELAY except that it is a command, so you can use:<br />
RA20M DO{SATTN; PAUSE 5000; CATTN; XB} RBX 1V ' OK<br />
(The semicolons between commands are optional in most cases. They are included in the above example because they<br />
make the program a little more readable, especially when commands with space-separated parameters are used.)<br />
Note also that a simpler way to implement the above functionality would be to not use commands at all, e.g.:<br />
RA20M 1WARN=1 DELAY=5000 1WARN=0 1V<br />
or, even better:<br />
RA20M 1WARN(5000,R)=1 1V<br />
Examples<br />
Controlling a System<br />
Alarm action processes can be used to control a system or process. This is often preferable to the method used in the<br />
example in Alarm Digital Action Channels (P77) because it allows some hysteresis to be included.<br />
For example,<br />
RA1S<br />
ALARM(1TK75.25)"Heater OFF"{1DSO(W)=1}<br />
is a simple heater control for a water bath. The two alarms work to hold the temperature at 75°C ± 0.25°C.<br />
Adaptive Scheduling<br />
Adaptive scheduling is the dynamic adjustment of the acquisition of data about a system or process as the system or process<br />
changes.<br />
As the examples below show, adaptive scheduling can reduce total data volume while giving greater time resolution when<br />
required.<br />
The schedule:<br />
RA15M<br />
1V("Wind speed",S1,=1CV)<br />
ALARM(1CV>5.25){RA2M}<br />
ALARM(1CV
every 15 minutes.<br />
The following job:<br />
RC30M 1TK("Oven Temp")<br />
RD1M ALARM(5TK>120){GC} ALARM(5TK3CV){XB 2CV(W)=2CV+1 3CV(W)=2^3CV}<br />
RBX LOGONB<br />
1..5TK<br />
END<br />
logs data at increasing intervals as the experiment proceeds. The program calculates the next log point as an incrementing<br />
power of 2 seconds — that is, it logs the temperatures at t = 0, 1, 2, 4, 8, 16,… seconds. The following table lists the values<br />
of the three CVs at the point at which the ALARM statement is executed.<br />
Time (s) 1CV 2CV 3CV<br />
0 1 0 0 Alarm active – B schedule polled<br />
1 2 1 2 Alarm active – B schedule polled<br />
2 3 2 4<br />
3 4 2 4 Alarm active – B schedule polled<br />
4 5 3 8<br />
5 6 3 8<br />
6 7 3 8<br />
7 8 3 8 Alarm active – B schedule polled<br />
8 9 4 16<br />
etc.<br />
(Remember that (1CV>3CV) means 1CV is greater than or equal to 3CV.)<br />
The following example will log all voltage readings that exceed 200mV:<br />
BEGIN<br />
RA1S IF(2V(=1CV)>200){X}<br />
RX 1CV("Vout~mV")<br />
LOGONX<br />
END<br />
Note that assigning to a CV in this way and then reporting the CV value is preferable to including 2V in both schedules.<br />
Executing Commands in Schedules<br />
The following will output a directory listing every time a positive edge is received on digital input 7:<br />
RA7+E DO{DIR"B:"}<br />
Selecting a Job to Run<br />
The following schedule<br />
RA1SERIAL""<br />
1SERIAL("%1d",=1CV)<br />
UM-0085-B2 <strong>DT80</strong> <strong>Series</strong> User’s <strong>Manual</strong> Page 81
IF(1CV>1.5)"OverPressure vMPa^M^J" END<br />
would, when triggered, return text similar to the following if normal (/h) mode was selected:<br />
OverPressure 1.563MPa<br />
In fixed format (/H) mode, however, it would return an alarm record:<br />
A,080035,"B1",2006/04/16,14:32:01,0.254870,0;B,8,1,"OverPressure 1.563MPa^M^J";0078;3D95<br />
An alarm record consists of:<br />
the usual fixed format header and trailer (serial number, job name, timestamp, error check fields)<br />
a 0 to indicate real time (as opposed to logged) data<br />
<br />
the schedule (B)<br />
the alarm number (8)<br />
the transition type (1 – false to true)<br />
the alarm text string (if any). Note that control characters (ASCII code < 32) are not output; they are left in the string in<br />
^x notation.<br />
The real time return of alarm action text or alarm records can be disabled using the /z switch.<br />
Logging Alarms<br />
Alarm records may also be logged to the <strong>DT80</strong>'s internal file system. This will occur if an alarm number is provided (e.g.<br />
ALARM7), and logging is enabled for the enclosing schedule.<br />
As with data, when logged alarm records are unloaded, they will be returned as fixed format records, as illustrated above.<br />
By default, an alarm record is only logged when an alarm is triggered, i.e. its state changes from false to true. However, by<br />
setting parameter P9=3, the <strong>DT80</strong> will also log a record when the alarm goes inactive (true to false).<br />
Also note that numbered IF and DO commands (which are seldom used) will log an alarm record every time their schedule<br />
executes, while their condition is true.<br />
UM-0085-B2 <strong>DT80</strong> <strong>Series</strong> User’s <strong>Manual</strong> Page 82
The following table summarises what is logged, and what is returned for the various types of alarm command.<br />
Alarm Command<br />
ALARM(test)"actionText"<br />
ALARMn(test)"actionText"<br />
IF(test)"actionText"<br />
(or ALARMR)<br />
IFn(test)"actionText"<br />
(or ALARMR)<br />
Parameter 9 Logged<br />
Returned<br />
State/Transition (default P9=1) Transition Type, Alarm Text AlarmText<br />
False to true ↑ x — actionText<br />
Continuing true x — —<br />
True to false ↓ x — —<br />
False to true ↑ P9=1 or 3 1,"actionText" actionText<br />
P9=0 or 2 — actionText<br />
Continuing true x — —<br />
True to false ↓<br />
P9=0 or 1 — —<br />
P9=2 or 3 3,"ALARMn FALSE" —<br />
False to true ↑ x — actionText<br />
Continuing true x — actionText<br />
True to false ↓ x — —<br />
False to true ↑ P9=1 or 3 1,"actionText" actionText<br />
P9=0 or 2 — actionText<br />
Continuing true x 2,"actionText" actionText<br />
True to false ↓<br />
P9=0 or 1 — —<br />
P9=2 or 3 3,"ALARMn FALSE" —<br />
DO"actionText" x x — actionText<br />
DOn"actionText" x x 2,"actionText" actionText<br />
Polling Alarm Inputs<br />
The current values of the channels being tested in alarm conditions can be polled (requested) by the host computer at any<br />
time. There are three commands for polling alarm data:<br />
Command Function<br />
n returns the current input value of alarm n (if n = 0 then all un-numbered alarms are returned)<br />
x returns the current input values of all alarms in schedule x, where x = A, B,…K, X<br />
ALL returns the current input values of all alarms in all schedules<br />
The output of each of these commands consists of:<br />
<br />
<br />
<br />
<br />
the alarm number (An). When un-numbered alarms are polled, the alarm number is returned as A0<br />
the schedule to which the alarm belongs<br />
the alarm condition (so that un-numbered alarms can be distinguished). For an alarm with no condition (i.e. DO), the<br />
word DO is shown<br />
the current value of the channel being tested in the alarm condition<br />
For example<br />
BEGIN<br />
RA2S<br />
ALARM4(2R>50)"High R"<br />
ALARM(1CV-10,10){2CV=2CV+1}<br />
IF(2CV>4){1V(=9CV)}<br />
ALARM5(9CV50 1300.6<br />
A0 A 1CV-10,10 99.0<br />
A0 A 2CV>4 102.0<br />
A5 A 9CV
Part G – Logging and<br />
Retrieving Data<br />
Logging Data<br />
By default, the <strong>DT80</strong> returns measurement data to a host computer in real time. However, the <strong>DT80</strong> can also automatically<br />
record each reading taken for some or all of a schedule’s channels. These data are stored in the <strong>DT80</strong>’s internal memory,<br />
and can be retrieved at a later date, using a USB memory device or via one of the communications ports, or via the web<br />
interface (<strong>Series</strong> 2 only).<br />
Each reading is automatically timestamped.<br />
Logged data is retained in the internal memory until it is explicitly cleared, even if the <strong>DT80</strong> is reset or loses power.<br />
Enabling and Disabling Data Logging<br />
LOGON and LOGOFF Commands<br />
By default, data logging is disabled when a schedule is entered. The following commands switch logging on or off. They may<br />
be entered as part of a job, or they may be sent at any time after a job has started running:<br />
Command<br />
Function<br />
LOGON<br />
Enables logging (data and alarms) for all schedules.<br />
LOGOFF Disables logging (data and alarms) for all schedules.<br />
LOGONsched Enables logging for schedule sched (data and alarms)<br />
LOGOFFsched Disables logging for schedule sched (data and alarms)<br />
For example the following job defines a schedule and enables logging:<br />
BEGIN"LUMPY" RA2M 2V 3V LOGONA END<br />
This will create a store file with the default size. Every two minutes, two voltages will be measured and the results will be<br />
stored, along with the time at which the measurements were taken.<br />
Disabling Data Logging for Specific Channels<br />
If logging is enabled for a schedule then by default all channels defined therein will be logged. To disable logging for specific<br />
channels:<br />
use the NL (no log) channel option, or<br />
<br />
use the W channel option (working channel; do not log, return or display)<br />
How Data and Alarms are Stored<br />
The <strong>DT80</strong> File System<br />
The <strong>DT80</strong>'s internal flash memory is organised as a DOS-compatible file system, which uses files and folders in a similar<br />
way to a desktop computer. When a USB memory device is inserted it is treated in a similar way. Note that:<br />
the USB memory device, if present, is referred to as drive A:<br />
the <strong>DT80</strong>'s internal file system is referred to as drive B:<br />
the <strong>DT80</strong>'s internal RAM disk (a small but higher speed file system) is referred to as drive D:<br />
(The DIR and DIRTREE commands can be used to explore the contents of either drive. For example DIRTREE B: will list<br />
the names of all files and directories on the internal file system.)<br />
The standard internal file system has a capacity of 128Mbyte. The <strong>DT80</strong> stores approximately 90,000 data values per<br />
megabyte of memory, so the internal memory can hold approximately 10,000,000 data values.<br />
The internal RAM disk has a capacity of 128kbyte (approx. 10,000 data values).<br />
Note the RAM disk (D:) may be cleared if all power to the <strong>DT80</strong> is lost (including the lithium memory backup battery). It<br />
should not normally be used for long term data storage.<br />
Store Files<br />
When a job is first entered, a directory (folder) is created on the internal file system: B:\JOBS\jobname. This directory<br />
UM-0085-B2 <strong>DT80</strong> <strong>Series</strong> User’s <strong>Manual</strong> Page 84
contains files which record the job's program text and other details about the job.<br />
For each of the job's schedules that contain loggable channels (that is, channels which do not specify the NL or W options),<br />
a data storage sub-directory for that schedule is then created: B:\JOBS\jobname\sched.<br />
Finally, a store file is created in the schedules data storage directory. Note the following important points:<br />
A store file is a pre-allocated, fixed size file. The size of the file (as returned by the DIR command, for example) does<br />
not change are data is stored.<br />
A store file contains two fixed size sections – one for data (measured channel values), one for alarms (text strings<br />
which are logged when a particular condition is true). The sizes of these sections is configurable on a per-schedule<br />
basis.<br />
A store file is a binary file. The data contained in it are not directly human-readable. See Retrieving Logged Data<br />
(P88).<br />
A store file has a name of the form DATA_sched.DBD.<br />
For example, the job:<br />
BEGIN"BUMPY"<br />
RA2M 2V 3V<br />
RB1S 2DS<br />
RK20S 1V(W)<br />
LOGONA LOGONK<br />
END<br />
would create the following store files:<br />
B:\JOBS\BUMPY\A\DATA_A.DBD<br />
B:\JOBS\BUMPY\B\DATA_B.DBD<br />
Note that no file is created for schedule K because all of its channels are specified as "working", or "non-loggable" channels.<br />
Note also that a file is created for schedule B, even though it initially has logging disabled. This ensures that storage will be<br />
available if logging is enabled (using the LOGONB command) at some later time.<br />
In the above example, the store files would all have the same, default size (approx. 1Mbyte).<br />
How Much Data Can I Store<br />
Each time a schedule executes (assuming logging is enabled for the schedule), it writes one data record to its store file. A<br />
data record consists of the values of all channels defined in the schedule, other than those for which logging has been<br />
disabled (using the NL or W channel options).<br />
As a rule of thumb, one data record uses 10 + (10 x numberOfLoggedChannels) bytes, assuming "normal" channel types<br />
(time/date channels and $ strings require more space)<br />
So for the schedule:<br />
RA1S 1V 2CV(NL) 3TK<br />
each data record will use 30 bytes, so the default 1Mbyte allocation for data is enough for 1,048,576 / 30 = 34,952 data<br />
records. The store file will therefore contain the most recent 9 hours or so of readings, assuming a 1 second scan rate.<br />
How Many Alarms Can I Store<br />
Normally, one alarm record is logged each time a numbered alarm is triggered, i.e. its state goes from false to true. However,<br />
as discussed in Logging Alarms(P82), the true-to-false transition may optionally also be logged, and numbered IF and DO<br />
alarm commands may log a record each time their schedule executes while their condition is true.<br />
As a rule of thumb, one alarm record uses 12 + alarmWidth bytes, where alarmWidth is set using the ALARMS:Wn<br />
schedule option; see Schedule Options (P43). So assuming the default setting of 60 is used, each alarm record will use 72<br />
bytes. The default 100kbyte allocation will therefore store 102,400 / 72 = 1,422 alarm records.<br />
How Fast Can I Log Data<br />
The time taken to log one data record for a schedule is essentially the sum of:<br />
measurement time – the time taken to acquire data for all channels in the schedule. For digital channels and channel<br />
variables (CVs) this is close to negligible; for analog measurements it can be significant (normally at least 30ms per<br />
measurement); for serial channels it can be very significant (possibly many seconds for SDI-12, for example)<br />
processing time – the time taken to perform any linearisation or other data manipulation calculations that may be<br />
required<br />
communications time – the time taken to format and return real time data values over a communications link<br />
logging preparation time – the time taken to generate a data record to be logged<br />
file system time – the time taken to physically write the data to the internal flash disk or external USB device.<br />
The first three of these depend on the job and the logger settings. We can largely eliminate them by defining a job consisting<br />
only of CVs, and switching off real time data returns (/r).<br />
As discussed above, there is a storage overhead associated with each data record; hence 20 records each with one channel<br />
will require more space than one record with 20 channels. The same goes for time – there is a fixed time overhead in<br />
preparing a data record, plus a variable time which depends on the number of channels.<br />
UM-0085-B2 <strong>DT80</strong> <strong>Series</strong> User’s <strong>Manual</strong> Page 85
The following table list some typical logging rates:<br />
Schedule Description Logging rate<br />
/r RA("B:") 1CV log one CV to internal memory 55 records/s<br />
/r RA("B:") 1..20CV log 20 CVs to internal memory 40 records/s<br />
/r RA("A:") 1CV log one CV to 512M USB device 4 records/s<br />
/r RA("A:") 1..20CV log 20 CVs to 512M USB device 3 records/s<br />
/r RA("D:",DATA:100KB) 1CV log one CV to internal RAM disk 120 records/s<br />
There may be some variation in performance depending on the brand and capacity of the USB device, but in general logging<br />
to USB will be around an order of magnitude slower than logging to the internal flash memory.<br />
Logging Options<br />
Various data logging parameters can be changed by means of schedule options. These options are inserted in a schedule<br />
definition just before the schedule trigger. See Schedule Options (P43) for details.<br />
Schedule options can be used to specify:<br />
<br />
<br />
<br />
<br />
the logging destination. Using the "A:" schedule option it is possible to configure a schedule to data directly to a USB<br />
memory device. In this case the store file will be placed in the A:\SNserial-num\JOBS\jobname\sched<br />
sub-directory.<br />
the space allocated for data. This can be specified in bytes, records, or (for time-based schedules) as a time period ("I<br />
want to store 30 days of data")<br />
the space allocated for alarms<br />
whether new data/alarm records are permitted to overwrite old records (OV) or whether logging should stop when the<br />
store file is full (NOV).<br />
For example, the following schedule definition:<br />
RA(DATA:30D)1M 1V 2V LOGONA<br />
will allocate a store file with space for 43,200 data records (30x24x60). No space is allocated for alarms because no alarms<br />
are defined in this schedule.<br />
Note It is normally better to always log data to the internal file system. Logging directly to a USB device is possible, but is<br />
subject to the following caveats:<br />
The logging performance is significantly slower than for the internal drive.<br />
There is the potential for data corruption if the USB device is removed during a write operation. Be sure to always halt<br />
logging and use the REMOVEMEDIA command (see Using a USB Memory Device (P104)) to shut down the device<br />
prior to removing it.<br />
The <strong>DT80</strong>'s USB socket is designed for easy access, and will not necessarily retain a USB device securely over a long<br />
period, particularly if the <strong>DT80</strong> is wall mounted or subject to vibration.<br />
Factors Which May Prevent Logging<br />
When a job is loaded onto the <strong>DT80</strong>, the logger will attempt to create all required store files. If this is not possible then the job<br />
will not be loaded.<br />
Insufficient Space to Create Store File<br />
When a job is entered, the <strong>DT80</strong> attempts to create a store file of the required size. If, however, there is insufficient free<br />
space on the selected logging drive (or it is not present at all) then an error will be reported and the job will not be loaded.<br />
To determine how much space is available on the internal file system for creating new store files, see Checking Logging<br />
Status (P87).<br />
Because the store files are fixed size, a lack of free disk space will normally not be a problem once the job has been started<br />
successfully.<br />
If, however, the job is configured to log direct to a USB device, and the device is removed during operation, then a "Cannot<br />
log" error message will be displayed on the LCD and the Attn LED will start flashing. The schedule will still execute –<br />
channels will be measured and values returned – but no data will be logged.<br />
If the USB device is replaced with a new one during operation then the <strong>DT80</strong> will attempt to create store files on the new<br />
device. If this fails (e.g. there is insufficient free space) then again the job will keep running, with the Attn LED flashing. Once<br />
you insert a USB device on which the store files can be created, then the Attn LED will stop flashing.<br />
Store File Full<br />
Normally, when a store file fills up it will automatically begin overwriting the oldest logged data. However, in some<br />
circumstances the older data may be more valuable than the newest. In these cases you would use the NOV (no overwrite)<br />
schedule option. If this option is set then logging for that schedule will stop when the store file becomes full, and the Attn LED<br />
will start flashing.<br />
UM-0085-B2 <strong>DT80</strong> <strong>Series</strong> User’s <strong>Manual</strong> Page 86
Logging will resume (and the Attn LED will stop flashing) if you delete the logged data from the storefile using the DELD<br />
command.<br />
To determine how many records have been logged to a store file, see Checking Logging Status (P87).<br />
Pre-existing Store Files<br />
When a job is entered, the <strong>DT80</strong> checks whether there are any pre-existing store files associated with the job name. For<br />
example, if you enter a job called "FIDO" (using BEGIN"FIDO" ...) then the <strong>DT80</strong> will check to see if there are any existing<br />
store files under the B:\JOBS\FIDO directory.<br />
If there are existing store files, the <strong>DT80</strong> then checks to see whether the existing store files were created by the same job as<br />
the one being entered (this information is encoded within the store file). Note that to be considered the same, the new job's<br />
program text must be identical to that used to create the store files.<br />
If the new job matches then logging will commence and data will be added to the existing store files.<br />
If, however, the job being entered is not the same as the job used to create the store files then the new job will not be loaded<br />
and an error message will be displayed, e.g.:<br />
Cannot log: job 'FIDO' has existing data/alarms<br />
To get around this you need to either:<br />
rename the new job, or<br />
remove the existing data in the store files, using DELD.<br />
This check ensures that all data in a store file is consistent.<br />
Checking Logging Status<br />
A number of commands can be used while a job is running to monitor the data logging status. You can also determine all<br />
these details via the web interface.<br />
Free Space for Creating New Store Files<br />
To determine how much space is available on the internal file system for creating store files you can use the DIR B:<br />
command (or DIR A: for a USB device). This will list the various files stored in the root directory, and will then show the<br />
remaining free space, e.g.:<br />
3 File(s) 42902196 Bytes free<br />
Alternatively, system variable 1SV (P33) will return the current free space, in kbytes (1kbyte = 1024 bytes), on the internal file<br />
system (or 3SV for a USB device), e.g.:<br />
1SV<br />
1SV 41896.0<br />
Number of Records Logged<br />
To determine how many records have been logged to a store file, and the associated date/time range, you can use the<br />
LISTD command. See LISTD – List Available Data (P88).<br />
The number of logged data and alarm records for each schedule of the current job are also available in system variables<br />
30SV – 53SV (see System Variables (P33)), e.g.<br />
32SV<br />
28.0<br />
UM-0085-B2 <strong>DT80</strong> <strong>Series</strong> User’s <strong>Manual</strong> Page 87
Retrieving Logged Data<br />
Overview<br />
There are several different ways to retrieve logged data from the <strong>DT80</strong>.<br />
<br />
<br />
<br />
<br />
<br />
<br />
Use the Retrieve Data function in dEX. The graphical web-based interface allows you to select the desired time<br />
range, among other options. Data will be downloaded to your computer and saved as a CSV or DBD format file.<br />
Interactively send a data unload command (COPYD) to the logger's command interface, which will output logged data<br />
in CSV, fixed or free format to the active communications port.<br />
Insert a USB memory device and use COPYD to unload data to file(s) on the USB device in the desired format<br />
(CSV/DBD/fixed/free). To automate this process the command can be placed in an ONINSERT file on the USB<br />
device, so that the unload is performed as soon as the USB device is inserted.<br />
Include a COPYD command in your job to periodically unload data to a remote FTP server, or to a file on the internal<br />
file system or USB device.<br />
Use COPYD (manually, or from the job – possibly in response to some event) to unload data to a local archive file. An<br />
archive file is a DBD file which contains a read-only snapshot of the main store file, with any empty space removed.<br />
Archive files can then be unloaded at a later date (using COPYD) into a CSV format file.<br />
Use an FTP client to access the <strong>DT80</strong>'s FTP server and collect any archive files or locally stored CSV files.<br />
Unload Commands<br />
The <strong>DT80</strong> provides three related commands for unloading and managing logged data:<br />
<br />
<br />
<br />
LISTD gives details of the data available to unload, such as the number of logged records and the time range that<br />
they cover.<br />
COPYD is used to extract selected data from store files and save it in the selected format to the selected destination.<br />
DELD is used to remove data from a store file.<br />
These three commands share a similar syntax: the command is followed by zero or more space-separated options. Each<br />
option has the form name=value. The value may optionally be enclosed in quotes, i.e. name="option value". A typical<br />
command line might be:<br />
COPYD start=new dest=a:<br />
Option names and values are not case-sensitive, and the options may be specified in any order.<br />
Option names (not values) may also be abbreviated, so long as the result is not ambiguous. Thus the following is equivalent<br />
to the previous command line:<br />
copyd DEST=A: ST=NEW<br />
All options have a default value, which will be used if the option is not specified.<br />
LISTD – List Available Data<br />
Using LISTD<br />
In its simplest form, the LISTD command will list details for all store files associated with the current job. For example:<br />
LISTD<br />
Job Sch Type Ov Lg Go Recs Capacity<br />
======== === ========== == == == ======== ========<br />
*SAMPLE A Data Live Y Y N 46 34952<br />
*SAMPLE A Data Arc 38 38<br />
*SAMPLE B Data Live Y Y N 23 52428 —<br />
*SAMPLE B Alarm Live Y Y N 3 1455<br />
*SAMPLE B Data Arc 19 19<br />
*SAMPLE B Alarm Arc 2 2<br />
First Last File<br />
=================== =================== ===========================================<br />
2010-03-01 09:54:23 2010-03-11 19:32:00 B:\JOBS\SAMPLE\A\DATA_A.DBD<br />
2010-03-01 09:54:23 2010-03-04 18:50:55 B:\JOBS\SAMPLE\002_20100311T193043.DBD<br />
2010-03-01 09:54:24 2010-03-11 19:32:00 B:\JOBS\SAMPLE\B\DATA_B.DBD<br />
2010-03-01 09:54:40 2010-03-11 19:32:00 B:\JOBS\SAMPLE\B\DATA_B.DBD<br />
2010-03-01 09:54:24 2010-03-04 18:50:55 B:\JOBS\SAMPLE\002_20100311T193043.DBD<br />
2010-03-01 09:54:40 2010-03-01 09:54:48 B:\JOBS\SAMPLE\002_20100311T193043.DBD<br />
(The above listing has been split in order to fit with this manual's page width.)<br />
UM-0085-B2 <strong>DT80</strong> <strong>Series</strong> User’s <strong>Manual</strong> Page 88
Each row of the report describes a store. A store is a set of logged data or alarm records for a particular schedule. Each<br />
store is contained within a store file (.DBD file). There can be multiple stores in the one store file.<br />
There are two different types of store file: live (Live) and archive (Arc).<br />
Live Store Files<br />
Live store files are the files to which data and alarm records are written, as they are sampled. Each schedule (that has<br />
loggable channels) has a live store file called DATA_s.DBD, which contains one data store and/or one alarm store. In the<br />
above example, there are three live stores listed:<br />
schedule A's data store, which currently contains 46 logged data records out of a capacity of 34952<br />
schedule B's data store, which currently contains 23 logged data records<br />
schedule B's alarm store, which currently contains 3 logged alarm records<br />
In this example schedule A does not have any alarms defined, so it does not have an alarm store in its live store file.<br />
For each live store, the following information is listed:<br />
Ov (Overwrite) column: indicates whether old records will be overwritten by new ones. (This is controlled by the OV<br />
and NOV schedule options, see Schedule Options (P43).)<br />
Lg (Log) column: indicates whether logging is currently enabled for this schedule. (This is controlled by the LOGON<br />
and LOGOFF commands, see LOGON and LOGOFF Commands (P84).)<br />
Go column: indicates whether the schedule is currently running. (This is controlled by the G and H commands, see<br />
Halting & Resuming Schedules (P52).)<br />
Recs column: current number of logged records<br />
Capacity column: maximum number of records that can be stored. (This is controlled by the DATA and ALARMS<br />
schedule options, see Schedule Options (P43).)<br />
First column: timestamp of the oldest logged record in the store<br />
Last column: timestamp of the newest logged record in the store<br />
File column: name of the store file that contains this store<br />
Archive Files<br />
An archive file contains a "snapshot" of a live store file. Archive files have the same format (.DBD) as live store files, except<br />
that all empty space is removed for each store.<br />
Archive files are created by using the COPYD command to unload data from a live store file in .DBD format and save it to a<br />
file. By default, archive files have an automatically generated file name which indicates the date and time at which they were<br />
created.<br />
An "archive file" is therefore really just an unload output file, as is a CSV file. The difference is that because it is still in the<br />
logger's native .DBD format, the <strong>DT80</strong> knows exactly what is in it – which schedules, channels, time ranges and so on.<br />
Archive files will therefore appear in a LISTD report, whereas CSV format files will not. You can also selectively unload data<br />
from an archive file the same as you would from a live store file.<br />
In the sample LISTD output shown above, one archive file has been created, named 002_20100311T193043.DBD. The<br />
name indicates that it was created on 11-Mar-2010 at 19:30:43. The file name does not indicate anything about the time<br />
range covered by the records therein – this information is obtained from the LISTD report.<br />
In this case the archive file contains three stores:<br />
a snapshot of schedule A's data store, which contains 38 data records<br />
a snapshot of schedule B's data store, which contains 19 data records<br />
a snapshot of schedule B's alarm store, which contains 2 alarm records<br />
Notice that for an archive file, the number of records in each store is always equal to the capacity.<br />
Also note that the Ov, Lg and Go columns are not applicable for archive files, as you cannot log new data to an archive file.<br />
Orphans<br />
You may occasionally see the word [orphan] displayed at the end of a row in a LISTD report. This indicates that the job<br />
used to generate the data in the file is no longer present on the <strong>DT80</strong>. In other words, the store file has lost the "parent" job<br />
that created it – hence the name.<br />
For example:<br />
B:\JOBS\WEST3\000_20100312T143919.DBD [orphan]<br />
indicates that version of the WEST3 job that created the data saved in this archive file no longer exists – it may have been<br />
modified or deleted.<br />
Orphaned live store files should normally never occur, because the <strong>DT80</strong> will refuse to load a job if logged data exists that<br />
was generated by a different job with the same name. Note however that any archive files that may be lying around are not<br />
checked, so if you change the contents of an existing job then its archive files will become orphans.<br />
Orphan store files are ignored by COPYD, so if you wish to keep the data in them you will need to manually copy the files<br />
using the COPY command, or retrieve them using an FTP client.<br />
UM-0085-B2 <strong>DT80</strong> <strong>Series</strong> User’s <strong>Manual</strong> Page 89
LISTD Options<br />
The LISTD command supports a number of options which can be used to filter the results, so the report will only list<br />
information for the data and alarm stores that you are interested in.<br />
Job<br />
By default, LISTD will show details for the currently loaded job only. If there is no currently active job and you just type<br />
LISTD then an error message will be returned.<br />
To show details for all jobs present on the logger, use the job=* option. So continuing the previous example:<br />
LISTD job=*<br />
Job Sch Type Ov Lg Go Recs Capacity<br />
======== === ========== == == == ======== ========<br />
*SAMPLE A Data Live Y Y N 46 34952<br />
*SAMPLE A Data Arc 38 38<br />
*SAMPLE B Data Live Y Y N 23 52428 —<br />
*SAMPLE B Alarm Live Y Y N 3 1455<br />
*SAMPLE B Data Arc 19 19<br />
*SAMPLE B Alarm Arc 2 2<br />
CONFIG A Data Live 204 52428<br />
CONFIG B Data Live 204 34952<br />
First Last File<br />
=================== =================== ===========================================<br />
2010-03-01 09:54:23 2010-03-11 19:32:00 B:\JOBS\SAMPLE\A\DATA_A.DBD<br />
2010-03-01 09:54:23 2010-03-04 18:50:55 B:\JOBS\SAMPLE\002_20100311T193043.DBD<br />
2010-03-01 09:54:24 2010-03-11 19:32:00 B:\JOBS\SAMPLE\B\DATA_B.DBD<br />
2010-03-01 09:54:40 2010-03-11 19:32:00 B:\JOBS\SAMPLE\B\DATA_B.DBD<br />
2010-03-01 09:54:24 2010-03-04 18:50:55 B:\JOBS\SAMPLE\002_20100311T193043.DBD<br />
2010-03-01 09:54:40 2010-03-01 09:54:48 B:\JOBS\SAMPLE\002_20100311T193043.DBD<br />
2010-02-19 14:35:25 2010-02-21 00:10:25 B:\JOBS\CONFIG\A\DATA_A.DBD<br />
2010-02-19 14:35:25 2010-02-21 00:10:25 B:\JOBS\CONFIG\B\DATA_B.DBD<br />
The list is now longer because it contains details for another job that happens to be present on the logger, called CONFIG.<br />
Notice also that the job SAMPLE is prefixed by an asterisk (*) to indicate that it is the currently active job.<br />
The Ov, Lg and Go columns are not shown for the CONFIG job, as they only have meaning for the currently active job.<br />
You can also specify an explicit job name for this option, e.g.<br />
LISTD job=config<br />
Schedule<br />
By default, LISTD returns details for all schedules. If you are only interested in a particular set of schedules then the<br />
sched= option can be used. For example:<br />
LISTD job=config sched=B<br />
Job Sch Type Ov Lg Go Recs Capacity<br />
======== === ========== == == == ======== ======== —<br />
CONFIG B Data Live 204 34952<br />
First Last File<br />
=================== =================== ===========================================<br />
2010-02-19 14:35:25 2010-02-21 00:10:25 B:\JOBS\CONFIG\B\DATA_B.DBD<br />
The value for the sched option is actually a list of schedules to include, e.g.<br />
LISTD sched=ABK<br />
would include details for schedules A, B and K only.<br />
Data and Alarms<br />
By default, LISTD returns details for both data and alarm stores. You can restrict it to one or other of these store types using<br />
the data= and alarms= options. These are both yes/no options so you can select just data, just alarms, or both (selecting<br />
neither, i.e. data=N alarms=N, is generally not useful!)<br />
For example, if you are only interested in alarms:<br />
LISTD data=n<br />
Job Sch Type Ov Lg Go Recs Capacity<br />
======== === ========== == == == ======== ======== —<br />
*SAMPLE B Alarm Live Y Y N 3 1455<br />
*SAMPLE B Alarm Arc 2 2<br />
First Last File<br />
=================== =================== ===========================================<br />
2010-03-01 09:54:40 2010-03-11 19:32:00 B:\JOBS\SAMPLE\B\DATA_B.DBD<br />
2010-03-01 09:54:40 2010-03-01 09:54:48 B:\JOBS\SAMPLE\002_20100311T193043.DBD<br />
UM-0085-B2 <strong>DT80</strong> <strong>Series</strong> User’s <strong>Manual</strong> Page 90
Live and Archive Files<br />
By default, LISTD returns details for both live and archive files. You can select which you want to include using the live=<br />
and archive= options. These are both yes/no options and they work in much the same way as the data= and alarm=<br />
options.<br />
Source Drive<br />
Store files may exist on any of the three file system drives – A: (USB device), B: (internal file system) and D: (RAM disk). By<br />
default, LISTD searches all three drives. Using the src= option you can restrict the search to one or more of these drives.<br />
For example, if you are only interested in seeing what store files are on a USB device you can use<br />
LISTD src=a<br />
Drive letters can be combined, so the default setting is src=abd.<br />
Source Path<br />
By default, LISTD will search for store files in appropriate folders under B:\JOBS, and/or D:\JOBS and/or<br />
B:\Snserial\JOBS. The exact search path depends on the src, job and sched option settings.<br />
Alternatively, you can force a particular root folder to search using the path option. If this option is set to a valid folder path<br />
(which must end in a \ character) then only store files in the specified folder (or any subfolders) will be returned. For<br />
example:<br />
LISTD path=b:\myarchives\<br />
You can also specify a single .DBD file name. LISTD will then list the details for just that store file. For example:<br />
LISTD path= B:\JOBS\SAMPLE\002_20100311T193043.DBD<br />
LISTD Option Summary<br />
The following table summarises the available LISTD options:<br />
Option Value Description Default Value<br />
job= jobname include specified job only<br />
(none)<br />
* include all jobs<br />
(none)<br />
include current job only<br />
sched= schedule-list include specified schedules only XABCDEFGHIJK<br />
data= Y / N include data stores (yes/no) Y<br />
alarms= Y / N include alarm stores (yes/no) Y<br />
live= Y / N include live stores (yes/no) Y<br />
archive= Y / N include archive stores (yes/no) Y<br />
src= drive-list search for store files on specified drives only ABD<br />
path=<br />
folder-path\<br />
file-path<br />
(none)<br />
search for store files in specified folder or sub-folders only<br />
list details for specified store file only<br />
search path based on src, job and sched options<br />
(none)<br />
UM-0085-B2 <strong>DT80</strong> <strong>Series</strong> User’s <strong>Manual</strong> Page 91
COPYD – Unload Data<br />
The COPYD command is used to unload data and alarms from one or more store files. That is, data is read from the source<br />
.DBD file(s), transformed into the desired output format (CSV, DBD etc.), then written to the desired destination (comms port,<br />
file, FTP server).<br />
The COPYD command supports many options, which are used to:<br />
select the data or alarm stores from which you wish to unload,<br />
select the range of data records to unload,<br />
select the format you want it in,<br />
select where you want it to go, and<br />
select what to do with the source data after it has been unloaded.<br />
Selecting the Stores to Unload<br />
The first group of COPYD options are used to select the set of data/alarm stores from which to unload. These options are<br />
identical to those used for LISTD, apart from some different defaults, and are listed in COPYD Option Summary (P97).<br />
Note that by default COPYD does not unload from archive files – specify archive=Y to include them.<br />
Selecting the Range of Data to Unload<br />
The second group of COPYD options allow you to further refine the selection of what data to unload, by specifying a time<br />
range of interest.<br />
Start and End Times<br />
By default, all available data in the selected data/alarm stores will be unloaded. To select a smaller range, use the start=<br />
and end= options.<br />
If the start= option is specified then only records with timestamp later than or equal to the indicated time will be<br />
unloaded.<br />
If the end= option is specified then only records with timestamp less than the indicated time will be unloaded.<br />
The actual start and end times can be specified in a number of different ways. These formats are all based on the ISO8601<br />
time format, which is<br />
yyyy-mm-ddThh:mm:ss.ttt<br />
Time components may be omitted, starting from the subseconds field. If a time component is not specified then 0 is<br />
assumed.<br />
Date components may also be left off, starting with the days field. Missing date components are assumed to be 1. If all date<br />
components are omitted then a date of 'today" is assumed.<br />
If just the date part is specified, the trailing T is still required, to eliminate any possible ambiguities.<br />
Some examples of possible start= and end= option values:<br />
Value<br />
Description<br />
12:05:02.25, 15-Feb-2010<br />
midnight, 15-Feb-2010<br />
2010-02-15T12:05:02.25<br />
2010-02-15T<br />
2010-02T midnight, 01-Feb-2010<br />
13:20 13:20 today<br />
0 midnight today<br />
For example, to unload all data logged between 9:00am and 5:30pm today:<br />
COPYD start=9 end=17:30<br />
Relative times can also be specified by prefixing either the date or time part with a minus sign.<br />
If the date part is relative, i.e.<br />
-ddThh:mm:ss.tt<br />
then this means "the specified time (hh:mm:ss.tt), dd days ago".<br />
If the time part is relative, i.e.<br />
-hh:mm:ss.tt<br />
then this means "the current time, minus the specified offset (hh:mm:ss.tt), rounded down to the smallest specified time<br />
component"<br />
Some examples may clarify this. These assume that the current time is 17:05:22.888, 20-Feb-2010<br />
Value<br />
Description<br />
-1T17:30<br />
5:30pm yesterday (17:30:00.000, 19-Feb-2010)<br />
-7T midnight 7 days ago (00:00:00.000, 13-Feb-2010)<br />
UM-0085-B2 <strong>DT80</strong> <strong>Series</strong> User’s <strong>Manual</strong> Page 92
-0:10 10 minutes ago, rounded down to the minute (16:55:00.000, 20-Feb-2010)<br />
-2 2 hours ago, rounded down to the hour (15:00:00.000, 20-Feb-2010)<br />
-48 48 hours ago, rounded down to the hour (17:00:00.000, 18-Feb-2010)<br />
-48:00:00.000 exactly 48 hours ago (17:05:22.888, 18-Feb-2010)<br />
Calculated times can be specified by replacing either or both of the date and time parts with channel variable references,<br />
mCVT hh:mm:ss.tt or<br />
yyyy-mm-ddTnCV or<br />
mCVTnCV<br />
If a channel variable is used for the date part then the CV value should be in seconds since 1-Jan-1989. The current date, in<br />
seconds since 1-Jan-1989, can be obtained using D(=mCV).<br />
If a channel variable is used for the time part then the CV value should be in seconds since midnight. The current time, in<br />
seconds since midnight, can be obtained using T(=mCV).<br />
For example:<br />
Value<br />
1CVT2:30<br />
T22CV<br />
7CVT8CV<br />
Description<br />
2:30am on the date specified by 1CV<br />
the time specified by 22CV, today<br />
the time specified by 7CV, on the date specified by 8CV<br />
Unloading New Data Only<br />
The start= option may also be set to the special value of new. This will unload all data logged since the last unload.<br />
For example,<br />
RA1H DO{COPYD start=new}<br />
will, every hour, unload all data logged since the last unload.<br />
Unload requests can come from users of the web interface, or users of the command interface, or from schedules in the<br />
running job. If these requests specify start=new then the question then arises: what was the "last unload"<br />
The <strong>DT80</strong> is capable of tracking up to 40 "last unload" points – that is, the time at which a particular user last unloaded a<br />
particular store.<br />
In order to identify the "user", the id= option is used. This is an arbitrary number which is used to track when you last<br />
unloaded data from a store.<br />
If this option is not specified then the default setting of id=0 will be used.<br />
Thus start=new really means "unload all data logged since the last time this store was unloaded with this id value"<br />
For example, suppose Fred has a USB memory device with the following command in its ONINSERT job (see ONINSERT<br />
Job (P57))<br />
COPYD start=new id=27 dest=a:<br />
Every time Fred plugs his memory stick into the <strong>DT80</strong>, it will unload all data logged since he last plugged in his device.<br />
Ginger's memory stick contains a similar ONINSERT job:<br />
COPYD start=new id=111 dest=a:<br />
Because Ginger has used a different id value, when she plugs in her USB device she will get the data logged since she last<br />
plugged in her device.<br />
(This may or may not be the desired behaviour. For example, suppose Fred and Ginger are employed to collect data from<br />
the <strong>DT80</strong> on alternate weeks, with both of them bringing the data back to the same central office. In this scenario you would<br />
normally use the same id value on each device.)<br />
The value used for the id= option can be any integer; the only requirement is that it be different for each of the unload<br />
"users" between which you want to distinguish.<br />
By default, the COPYD command uses a setting of id=0. When an unload is done using dEX (the web interface), it uses a<br />
value of id=1. Thus if you choose to specify an id value, choose a value other than 0 or 1.<br />
Note The <strong>DT80</strong>'s set of stored "last unload" times will be cleared following a hard reset. If you do a start=new unload after<br />
a hard reset has occurred then you will receive all available data.<br />
Lost Unload Data<br />
Suppose that after unloading all new data onto his memory stick, Fred then loses it on the way back to the office. When he<br />
goes back to the <strong>DT80</strong> with a new memory stick, he needs a way of repeating the last unload he did, so that he gets a new<br />
copy of the data he lost, plus anything that has been logged since.<br />
The start=new2 option can help here. This will unload all data logged since the second last unload command, excluding<br />
any start=new2 unloads.<br />
So to recover the lost data, Fred would use the following command:<br />
COPYD start=new2 id=27 dest=a:<br />
which is the same as his normal command, except with new2 rather than new<br />
UM-0085-B2 <strong>DT80</strong> <strong>Series</strong> User’s <strong>Manual</strong> Page 93
If (perish the thought) this unload data was also lost, Fred can simply repeat the same command. This will work because the<br />
unload will start from, as stated above, the second last non-start=new2 unload, which is the same starting point as the<br />
original lost unload. Once he successfully gets the data to the office he can go back to using his regular start=new<br />
command.<br />
Step Size<br />
If you have a very large data set on the logger then it may take considerable time to unload. The step= option allows you to<br />
download a smaller sample of data points so that you can get a quick overview of the data.<br />
To use this feature, specify step=interval, where interval is the required minimum time interval between successive<br />
samples.<br />
For example, the following schedule executes every 100ms so it will log 864,000 samples per day (approx. 20MB)<br />
RA(DATA:1D)100T 1V<br />
To get a quick picture of the day's data you could download samples at, say, 10s intervals rather than 100ms, which would<br />
result in a more manageable 8640 data points. The command for this would be:<br />
COPYD step=10<br />
Fractional times can also be specified, e.g. step=2.5, which would set the minimum interval between unloaded samples<br />
to 2.5 seconds.<br />
Note also that the <strong>DT80</strong> is returning the original samples, just fewer of them. It is not performing any averaging or<br />
minimum/maximum detection, so by using the step= option you may miss peaks in the data.<br />
Selecting the Data Format<br />
The third group of COPYD options is concerned with the format of the unloaded data.<br />
Data Format<br />
Data and alarms can be unloaded in one of four different formats:<br />
CSV format (Comma Separated Value). This is the default. CSV files can be imported into any spreadsheet or data<br />
analysis package.<br />
DBD format. Unloading in this binary format creates an archive file, from which you can then unload at a later date.<br />
DBD files can also be opened by certain PC data analysis packages.<br />
fixed format. This text-based format is similar to CSV, and can be read by applications such as DeLoad.<br />
free format. This text-based format can be customised using the <strong>DT80</strong>'s switch and parameter settings.<br />
These formats are described in more detail in Format of Returned Data (P23).<br />
To set the COPYD output format, use the format= option, which may be set to csv, dbd, fixed or free.<br />
Note Unloading in any of the text based formats (CSV, fixed or free) is significantly slower than unloading in DBD format. If<br />
you have very large store files then you may prefer to unload to DBD, transfer the DBD file(s) to the PC, and then use a utility<br />
such as dump_dbd (or other DBD-aware application) to convert to CSV, rather than doing the conversion on the <strong>DT80</strong>.<br />
Merged Files<br />
By default, COPYD will merge data from the selected store files into a single output file. This is not a true "merge", in that<br />
duplicate records are not eliminated, and records in the resulting file will not necessarily be in time order. However, these<br />
issues are relatively easy to deal with using a host tool such as a spreadsheet package.<br />
For example, suppose there are two jobs on the logger, HEDGEHOG and ECHIDNA. The former has one schedule (A), with<br />
logged data and alarms. ECHIDNA has a two schedules, J and K, with logged data only. Some time ago an archive file was<br />
generated for ECHIDNA.<br />
The source store files on the logger are therefore:<br />
B:\JOBS\HEDGEHOG\A\DATA_A.DBD (data and alarms for HEDGEHOG schedule A)<br />
B:\JOBS\ECHIDNA\J\DATA_J.DBD (data for ECHIDNA schedule J)<br />
B:\JOBS\ECHIDNA\K\DATA_K.DBD (data for ECHIDNA schedule K)<br />
B:\JOBS\ECHIDNA\000_20091225T123409.DBD (archive file containing ECHIDNA J & K data snapshot)<br />
We now wish to retrieve all available data to a USB memory device:<br />
COPYD job=* archive=Y dest=b:<br />
This will then create a single output file:<br />
A:\SN081234\JOBS\001_20100313T181008.CSV<br />
This file will contain, in order, the following elements:<br />
a CSV header row for all of ECHIDNA's channels: J data, K data<br />
schedule J data values from live store file<br />
schedule J data values from archive file<br />
schedule K data values from live store file<br />
schedule K data values from archive file<br />
a CSV header row for all of HEDGEHOG's channels: A data, A alarms<br />
UM-0085-B2 <strong>DT80</strong> <strong>Series</strong> User’s <strong>Manual</strong> Page 94
schedule A data values<br />
schedule A alarm values<br />
It is also possible to unload to separate files, by adding an option:<br />
COPYD job=* archive=Y dest=b: merge=N<br />
This will then create output files similar to the following:<br />
A:\SN081234\JOBS\ECHIDNA\J\001_20100313T181008.CSV (J data from live store file)<br />
A:\SN081234\JOBS\ECHIDNA\K\002_20100313T181008.CSV (K data from live store file)<br />
A:\SN081234\JOBS\ECHIDNA\J\000_20091225T123409.CSV (J data from archive file)<br />
A:\SN081234\JOBS\ECHIDNA\K\000_20091225T123409.CSV (K data from archive file)<br />
A:\SN081234\JOBS\HEDGEHOG\A\003_20100313T181008.CSV (A data and alarms)<br />
Notice that the archive file (which was originally created by merging data from J and K schedules) has now been "unmerged"<br />
into its constituent schedules. Also notice that for data sourced from archive files, the original archive file name is preserved<br />
(apart from the file extension, which was changed to .CSV to suit the new file format).<br />
Merging works in a similar way for other output formats (DBD, fixed and free) – the various parts are combined in the same<br />
order as for CSV.<br />
Selecting the Unload Destination<br />
The dest= option is used to specify where the unloaded data should go. The four broad choices are:<br />
display the data, i.e. return it to the active comms port on which the COPYD command was sent. This is the default for<br />
text-based unload formats. It is not applicable for DBD format unloads, as DBD is a binary format.<br />
write it to file(s) on the internal file system. This is the default for DBD format unloads.<br />
write it to file(s) on a USB memory device<br />
upload the data to an FTP server<br />
To display the data interactively, no option is required as this is the default. For example, just typing<br />
COPYD<br />
will unload all data for the current job to the active comms port, in CSV format.<br />
During an unload to the active comms port, the <strong>DT80</strong> disables real time data and alarm return, command echo and error<br />
messages, to prevent these messages being mixed in with the unload stream. These functions will be re-enabled once the<br />
unload completes.<br />
Local Files<br />
To output to a file or files in the default location on the internal file system, use dest=B:. The actual folder(s) used depend<br />
on the job=, sched= and merge= settings. For example, if a merged file containing multiple jobs is being generated then<br />
it will be placed in B:\JOBS, whereas if only a single job is being unloaded then the resultant file will be placed in the<br />
B:\JOBS\jobname. folder.<br />
The same goes for unloading to a file on the USB memory device, except that this time you would use dest=A:. Files will<br />
then be written to B:\Snserial-num\JOBS or a subfolder of this, depending on the options.<br />
You can also specify an alternative root destination folder, e.g.<br />
COPYD dest=b:\mydir\x1\<br />
(Note that the trailing backslash is required)<br />
This does exactly the same as dest=b:, except that it substitutes b:\mydir\x1\ in place of B:\JOBS\.<br />
Finally, you can also specify an explicit destination file name, e.g.<br />
COPYD dest=a:\mydir\data2009.dbd<br />
This form is not valid for merge=N unloads.<br />
FTP Server<br />
The <strong>DT80</strong> is also able to unload data to files on a remote server, using FTP (File Transfer Protocol).<br />
An FTP transfer is initiated by specifying an FTP Uniform Resource Identifier (URI) as the value of the dest= option. This<br />
URI has the form:<br />
ftp://username:password@host-ip/pathname<br />
where:<br />
username is the user name to use when logging in to the FTP server<br />
password is the password to use when logging in to the FTP server<br />
host-ip is the IP address of the computer running the FTP server. This may be specified in numeric form (e.g.<br />
192.168.1.23), or as a domain name (e.g. ftp.datataker.com).<br />
UM-0085-B2 <strong>DT80</strong> <strong>Series</strong> User’s <strong>Manual</strong> Page 95
pathname is the path (and, optionally, filename) into which to write the unloaded data.<br />
For an FTP transfer, the destination folder(s) are created in the same way as for a local unload. For example:<br />
COPYD job=CAT9 dest=ftp://harryp:snitch@ftp.hsww.edu/transfig/<br />
In this example, the <strong>DT80</strong> will log in to the FTP server ftp.hsww.edu using the username harryp and the password<br />
snitch, create the folder /transfig/CAT9, then unload all data for the CAT9 job to a file such as<br />
002_20100314T090500.CSV in that folder.<br />
If an explicit filename is specified (valid for merge=Y unloads only) then data will be written to that file, e.g.<br />
COPYD dest=ftp://harryp:snitch@ftp.hsww.edu/transfig/my%20data.csv<br />
Note that:<br />
The specified host computer must be accessible to the <strong>DT80</strong>. That is, it must either be on the same local network<br />
segment, or it must be reachable using the <strong>DT80</strong>'s configured gateway address (see Gateway (P178)).<br />
The <strong>DT80</strong> always uses passive mode FTP transfers. Passive transfers are less likely to cause problems with network<br />
firewalls.<br />
If there are special characters, e.g. @ or space, in the username or filename parts of the URI then they must be<br />
escaped, i.e. replaced by a special numeric sequence. Spaces should be replaced with %20 (as in the above<br />
example), while @ characters should be replaced with %40.<br />
If the FTP server is specified by name (rather than numeric IP address) then a DNS (Domain Name Service) server<br />
must be available to the <strong>DT80</strong>. SeeSetting Ethernet Parameters (P180).<br />
Other Options<br />
The final COPYD option is delete=. If this is set to Y then following a successful unload, the records just unloaded will be<br />
deleted from the source DBD file.<br />
In most cases there is no benefit in doing this, and it would also mean that for example the start=new2 feature would no<br />
longer work because the data will no longer be present on the logger.<br />
This option may however be useful if you have a NOV (no overwrite) store file, or if you want to create archive files (possibly<br />
in response to events) where there is no overlap between successive archive files.<br />
Option Conflicts<br />
Certain combinations of COPYD options are invalid, and will result in a "parameter/option conflict" error message. In<br />
particular:<br />
If format=dbd then the step= option is not supported. All records in the specified time range will be unloaded.<br />
If format=dbd then dest=stream is not valid: DBD format data can only be output to a file (either local or on an<br />
FTP server). If DBD format output is specified then the default value of dest is B: rather than stream.<br />
If merge=n then dest=stream and dest=filename are invalid: given that multiple output files are to be created,<br />
the destination must resolve to a folder.<br />
If start=new or end=new (or new2) then the job= option is invalid: tracking of the last unloaded record is only<br />
supported for the current job.<br />
If delete=y then the start= option is invalid: data are always deleted from the start of the storefile<br />
UM-0085-B2 <strong>DT80</strong> <strong>Series</strong> User’s <strong>Manual</strong> Page 96
COPYD Option Summary<br />
The following table summarises the available COPYD options:<br />
Option Value Description Default Value<br />
Store selection options<br />
job= jobname<br />
Unload specified job only<br />
(none)<br />
* Unload all jobs<br />
(none)<br />
Unload current job only<br />
sched= schedule-list Unload specified schedules only XABCDEFGHIJK<br />
data= Y / N Unload data (yes/no) Y<br />
alarms= Y / N Unload alarms (yes/no) Y<br />
live= Y / N Unload from live stores (yes/no) Y<br />
archive= Y / N Unload from archive stores (yes/no) N<br />
src= drive-list Search for store files on specified drives only ABD<br />
path= folder-path\<br />
file-path<br />
(none)<br />
Data Range options<br />
start= yyyy-mm-ddThh:m<br />
m:ss.tt<br />
-ddThh:mm:ss.tt<br />
-hh:mm:ss.tt<br />
mCVThh:mm:ss.tt<br />
yyyy-mm-ddTnCV<br />
mCVTnCV<br />
new<br />
new2<br />
Search for store files in specified folder or sub-folders only<br />
Unload from specified store file only<br />
Search path based on src, job and sched options<br />
Unload records later than or equal to specified timestamp.<br />
Date/time components may be omitted, starting with least<br />
significant.<br />
timestamp is specified time, dd days ago<br />
timestamp is current time, minus the specified offset,<br />
rounded down to the smallest specified time component<br />
date part of timestamp is mCV value (seconds since<br />
1-Jan-1989)<br />
time part of timestamp is nCV value (seconds since<br />
midnight)<br />
date and time parts of timestamp given by mCV and nCV<br />
Unload new records logged since the last unload of this store<br />
with the same id value<br />
Unload new records logged since the second-last unload<br />
(excluding start=new2 unloads) of this store with the<br />
same id value<br />
(none)<br />
start with oldest<br />
logged record<br />
end= as for start=,<br />
except new, new2<br />
Unload records earlier than specified timestamp<br />
end with latest<br />
logged record<br />
id= integer Arbitrary user identifier for tracking last unload time 0<br />
step= number Minimum time interval between successive unloaded records 0<br />
(0 = unload all records)<br />
Output Format options<br />
format= csv, dbd, fixed, Unload data in the specified format<br />
csv<br />
free<br />
merge= Y / N Generate a single merged output file (yes/no) Y<br />
Unload Destination options<br />
dest= stream<br />
Unload to active comms port (CSV/fixed/free format only)<br />
(requires merge=Y)<br />
stream<br />
(CSV/fixed/free), or<br />
B: Unload to B:\JOBS and/or subfolders<br />
B: (DBD)<br />
A: Unload to A:\Snserial-num\JOBS and/or subfolders<br />
path\<br />
Unload to path and/or subfolders<br />
path\filename Unload to file filename (requires merge=Y)<br />
ftp://user:pwd@ Unload to path on FTP server and/or subfolders<br />
ip/path/<br />
ftp://user:pwd@ Unload to file filename on FTP server (requires merge=Y)<br />
ip/path/filename<br />
Other options<br />
delete= Y / N Delete records from source files after successful unload N<br />
Aborting an Unload<br />
The Q (quit unload) command can be used to abort all current and pending COPYD unloads. It has no effect on unloads<br />
initiated via the Retrieve Data function in dEX.<br />
UM-0085-B2 <strong>DT80</strong> <strong>Series</strong> User’s <strong>Manual</strong> Page 97
Detecting Unload Status<br />
The system variable 29SV can be used to determine the success or otherwise of the last COPYD command.<br />
29SV Meaning<br />
0 No unloads have been attempted<br />
1 Unload in progress<br />
2 Last unload was successful<br />
-1 FTP connection error: can't find server name (name invalid or can't connect to DNS server)<br />
-2 FTP connection error: can't connect to server (computer not present or no FTP server running)<br />
-3 FTP connection error: unexpected response from server (rare)<br />
-4 FTP connection error: invalid username<br />
-5 FTP connection error: invalid password<br />
-6<br />
FTP connection error: error selecting binary mode on server (rare)<br />
-7 FTP connection error: error creating or changing to specified directory on server (user may not have<br />
permission to create directories)<br />
-10 FTP transfer error: no response from server (server may be overloaded)<br />
-11 FTP transfer error: could not create the destination file (directory or read-only file exists with same name)<br />
-12 FTP transfer error: could not open data connection (server may be overloaded)<br />
-13 FTP transfer error: could not read file from logger disk (rare)<br />
-14 FTP transfer error: server aborted transfer (server may have been shut down)<br />
-15 FTP transfer error: error sending or receiving (connection may have dropped out)<br />
-16 File transfer error: could not open destination file (directory or read-only file exists with same name)<br />
-17 File transfer error: could not write to file (disk may be full)<br />
-20 Source store file error: problem accessing file<br />
-21 Source store file error: store file is corrupted<br />
-22 Source store file error: some other problem<br />
-99 Unload was aborted by user (Q command)<br />
For example, the following program will scan a thermocouple once a minute and unload data to an FTP server once a day. If<br />
the transfer fails then it will retry indefinitely at 10 minute intervals. Schedule C checks whether a retry is required by polling<br />
29SV – if it is found to be negative then Schedule B is retriggered, using the XB command.<br />
BEGIN"JOB1"<br />
29SV(W)=0<br />
RA1M 1TK LOGONA<br />
RB1D DO{COPYD start=new dest=ftp://ronw:carrot@ftp.hsww.edu/dada/}<br />
RC10M IF(29SV(LM,"FTP status")100){1..2CV(W)=0; COPYD format=dbd}<br />
LOGONA<br />
END<br />
In this example, a small store file is declared for schedule A (capacity 200 records). The channel of interest (2V) is measured<br />
and logged once per second, with old values being overwritten. When digital input 1D (1DS) goes low we counting samples,<br />
accumulating the count in 1CV. After a further 100 samples have been taken schedule A will then execute the COPYD<br />
command, which will create an archive file on the local file system. The end result is that each archive file that is created will<br />
contain 100 samples taken just prior to the trigger event, and 100 samples taken immediately after.<br />
Note If data are being logged at a relatively fast rate, the earliest samples may be overwritten before they can be copied into<br />
UM-0085-B2 <strong>DT80</strong> <strong>Series</strong> User’s <strong>Manual</strong> Page 98
the archive file, which may result in fewer than expected pre-trigger records being present in the archive file. In the above<br />
example there might be 198 samples in the archive (98 pre-trigger, 100 post-trigger)<br />
If you need to have exactly the right number of samples then you should halt sampling for the duration of the archive<br />
operation, i.e.:<br />
IF(1CV>100){1..2CV(W)=0; HA; COPYD format=dbd; GA}<br />
DELD - Delete Logged Data<br />
The DELD command is used to delete data and alarms from one or more store files.<br />
The DELD command options are used to:<br />
select the data or alarm stores from which you wish to delete records<br />
select the range of data records to delete<br />
The options used to select the set of data/alarm stores from which to delete are identical to those used for LISTD, apart from<br />
some different defaults, and are listed in DELD Option Summary (P99).<br />
Note that by default DELD does not delete archive files – specify archive=Y to include them.<br />
You can specify a range of data to delete using the end= option, which works in the same way as the equivalent COPYD<br />
option. That is, you can delete all data older than the specified time.<br />
Note that DELD does not support the start= option.<br />
For example, to delete all logged data for the current job which is older than 30 days, including data in archive files, use:<br />
DELD archive=Y end=-30T<br />
Some points to note:<br />
Once the required records have been deleted from an archive file, if the archive file is then empty then the file will be<br />
deleted.<br />
Live store files are not deleted, even if all records have been deleted.<br />
If any orphan store files are found (live or archive) then they will be deleted.<br />
DELD Option Summary<br />
The following table summarises the available DELD options:<br />
Option Value Description Default Value<br />
Store selection options<br />
job= jobname<br />
Delete records for specified job only<br />
(none)<br />
* Delete records for all jobs<br />
(none)<br />
Delete records for current job only<br />
sched= schedule-list Delete records for specified schedules only XABCDEFGHIJK<br />
data= Y / N Delete data (yes/no) Y<br />
alarms= Y / N Delete alarms (yes/no) Y<br />
live= Y / N Delete from live stores (yes/no) Y<br />
archive= Y / N Delete from archive stores (yes/no) N<br />
src= drive-list Search for store files on specified drives only ABD<br />
path= folder-path\ Search for store files in specified folder or sub-folders only (none)<br />
file-path<br />
Unload from specified store file only<br />
(none)<br />
Search path based on src, job and sched options<br />
Data Range options<br />
end= yyyy-mm-ddThh:m Delete records earlier than specified timestamp. Date/time delete all records<br />
m:ss.tt<br />
components may be omitted, starting with least significant.<br />
-ddThh:mm:ss.tt timestamp is specified time, dd days ago<br />
-hh:mm:ss.tt timestamp is current time, minus the specified offset,<br />
rounded down to the smallest specified time component<br />
mCVThh:mm:ss.tt date part of timestamp is mCV value (seconds since<br />
1-Jan-1989)<br />
yyyy-mm-ddTnCV time part of timestamp is nCV value (seconds since<br />
midnight)<br />
mCVTnCV<br />
date and time parts of timestamp given by mCV and nCV<br />
new<br />
Delete records logged prior to the last unload of this store with<br />
the same id value<br />
new2<br />
Delete records logged prior to the second-last unload<br />
(excluding start=new2 unloads) of this store with the<br />
same id value<br />
id= integer Arbitrary user identifier for tracking last unload time 0<br />
UM-0085-B2 <strong>DT80</strong> <strong>Series</strong> User’s <strong>Manual</strong> Page 99
Deleting Store Files<br />
Deleting Jobs<br />
A job's store files are physically deleted when the job is deleted using DELJOB (see Deleting Jobs (P56)). However, note<br />
that as a safeguard against accidental deletion, you first need to "empty" the store files using DELD .<br />
Therefore, to delete all trace of job WEST3, you could send the following sequence:<br />
DELD j=west3<br />
Deleting: WEST3 A Data<br />
Deleting: WEST3 B Alarms<br />
DELJOB "west3"<br />
Deleting: WEST3<br />
Done<br />
Deleting All Jobs<br />
The DELALLJOBS command is a quick way of deleting all jobs and their store files.<br />
This command will:<br />
halt and delete the current job, including any logged data and alarms<br />
delete all other stored jobs and logged data, i.e. all files under the B:\JOBS directory.<br />
Note that the program files for any locked jobs will not be deleted. Use the UNLOCKJOB command first.<br />
Background Commands<br />
<strong>DT80</strong> commands are normally executed sequentially – if you type two commands in quick succession then the second one<br />
will not be carried out until the first command has been completed.<br />
However, if a large amount of data has been logged then the COPYD command can take a significant amount of time to<br />
execute. This could potentially cause subsequent commands to be delayed for a long time, which is undesirable in many<br />
applications.<br />
To address this problem, the COPYD command is designated as a background command. Background commands can<br />
execute "in parallel" with other commands.<br />
When a background command is started (e.g. you type COPYD), the transfer will commence but you will notice that the<br />
<strong>DT80</strong>> prompt is returned immediately, indicating that further commands may be entered and they will be acted on<br />
immediately, even though the unload operation is still in progress. Similarly, if an ALARM statement triggers an action<br />
command then it will be executed immediately, without having to wait for the background command to complete.<br />
There are situations, however, where sequential execution is required. For example, it is common to execute a COPYD<br />
dest=a: command to copy logged data to a USB memory device, followed by a REMOVEMEDIA command to shut down<br />
the USB port to allow the memory device to be removed. Clearly the REMOVEMEDIA command can only be carried out once<br />
the COPYD command has finished.<br />
The <strong>DT80</strong> uses the following rules:<br />
1. A sequence of commands on the same command line always executes sequentially. So if you enter:<br />
COPYD; HA; COPYD; SATTN<br />
all on the one line, or if you include them all in a single alarm command string, e.g.<br />
RA1D DO{ COPYD; HA; COPYD; SATTN }<br />
then the HA; COPYD; SATTN commands will be delayed until the first COPYD completes.<br />
2. If a background command is in progress and you attempt to execute another background command then the new<br />
command will be delayed until the first command completes. Because of Rule 1, any commands that occur after the<br />
new command on the same command line will also be delayed.<br />
For example, the command line<br />
COPYD dest=A:; REMOVEMEDIA<br />
will operate as expected, i.e. the REMOVEMEDIA will not be executed until the copy completes.<br />
By contrast,<br />
COPYD dest=A:<br />
REMOVEMEDIA<br />
will likely cause various error messages to be returned, because the REMOVEMEDIA will execute in parallel with the<br />
COPYD, causing the memory device to be shut down prematurely.<br />
Simultaneous Unloads<br />
Because of Rule 2 above, only one COPYD command can execute at any one time – if you or your job tries to start a second<br />
then it will remain pending until the first unload completes.<br />
It is permissible, however, to perform a web unload (using the dEX Retrieve Data function) at the same time as a COPYD<br />
unload or another web unload.<br />
UM-0085-B2 <strong>DT80</strong> <strong>Series</strong> User’s <strong>Manual</strong> Page 100
Obsolete Commands<br />
The COPYD, LISTD and DELD commands replace a number of other unload related commands. These commands are still<br />
supported but are considered obsolete and may be removed in future firmware versions.<br />
The following table lists the commands (not all possible combinations are shown), and their current equivalents.<br />
Old command<br />
Replacement<br />
U<br />
COPYD format=free alarms=N src=AB<br />
A<br />
COPYD format=free data=N src=AB<br />
/H U COPYD format=fixed alarms=N src=AB<br />
Usch<br />
COPYD format=free alarms=N src=AB sched=sch<br />
U"job"sch<br />
COPYD format=free alarms=N src=AB sched=sch job=job<br />
U"job"sch(start)(end) COPYD format=free alarms=N src=AB sched=sch job=job start=start<br />
end=end (format of start and end is a little different)<br />
U"job"sch "ftp-URI" COPYD format=free alarms=N src=AB sched=sch job=job dest=ftp-URI<br />
COPYDATA<br />
COPYD format=dbd archive=Y src=B dest=A:<br />
MOVEDATA<br />
COPYD format=dbd archive=Y src=B dest=A: delete=Y<br />
ARCHIVE<br />
COPYD format=dbd src=B dest=B:<br />
DIRJOB<br />
LISTD archive=N<br />
DIRJOB*<br />
LISTD archive=N job=*<br />
DELDATA<br />
DELD alarms=N<br />
DELALARMS<br />
DELD data=N<br />
UM-0085-B2 <strong>DT80</strong> <strong>Series</strong> User’s <strong>Manual</strong> Page 101
The <strong>DT80</strong> File System<br />
Internal File System (B:)<br />
The <strong>DT80</strong> uses a Windows compatible FAT16/FAT32 file system for storing logged information (data and alarms) and<br />
system information. The internal file system uses flash memory, so all files will be preserved even if the <strong>DT80</strong> is reset or<br />
loses all power. The size of this file system for a standard <strong>DT80</strong> is 128Mbyte.<br />
The internal file system is used to store information such as:<br />
<br />
<br />
<br />
<br />
<br />
<br />
<br />
<br />
program text for stored jobs (e.g. B:\JOBS\MYJOB\PROGRAM.DXC)<br />
store files (e.g. B:\JOBS\MYJOB\A\DATA_A.DBD)<br />
archive files (e.g. B:\JOBS\MYJOB\A\009_20100401T090002.DBD)<br />
other unload output files (e.g. B:\MYDATA\MYJOB\A\021_20100101T190012.CSV)<br />
current profile settings (B:\INI\USER.INI)<br />
system event and/or error logs (B:\EVENTS\EVENT.LOG and ERROR.LOG)<br />
web interface files (e.g. B:\WWW\index.html)<br />
documentation files (e.g. B:\DOC\DT8x Users <strong>Manual</strong>.pdf)<br />
Note Path and file names shown above are for illustrative purposes only, and may change in future firmware revisions.<br />
A typical directory listing (see File Commands (P104)) of the internal file system might look like:<br />
DIRTREE B:<br />
Volume in drive B has no label.<br />
2006/02/06 12:13 133120 - FAILSAFE<br />
2006/02/06 12:13 - EVENTS<br />
2006/02/08 12:17 1501 - EVENT.LOG<br />
2006/02/06 12:36 - INI<br />
2006/02/08 10:56 199 - USER.INI<br />
2006/02/07 10:50 213 - USER.BAK<br />
2006/02/06 12:14 - JOBS<br />
2006/02/06 15:17 - SPARROW<br />
2006/02/06 15:17 - A<br />
2006/02/06 15:56 4208 - DATA_A.DBD<br />
2006/02/06 15:19 3028 - 001_20060206T151936.DBD<br />
2006/02/06 15:56 4208 - 002_20060206T155654.DBD<br />
2006/02/06 16:33 4208 - 003_20060206T163356.DBD<br />
2006/02/07 13:02 138 - STATUS14<br />
2006/02/07 13:02 121 - PROGRAM.DXC<br />
2006/02/06 16:01 - UNTITLED<br />
2006/02/08 10:53 95 - STATUS14<br />
2006/02/08 10:53 41 - PROGRAM.DXC<br />
2006/02/07 13:03 - DTCAN169<br />
2006/02/07 13:03 - A<br />
2006/02/07 13:03 1051584 - DATA_A.DBD<br />
2006/02/07 13:03 - D<br />
2006/02/07 13:03 1049104 - DATA_D.DBD<br />
2006/02/07 13:03 3466 - STATUS14<br />
2006/02/07 13:03 17523 - PROGRAM.DXC<br />
25 File(s) 63074304 Bytes free<br />
In this example there are three jobs stored on the <strong>DT80</strong>: SPARROW (one schedule; three archive files have been created at<br />
various times; in the case of the first one the store file was not yet full at the time it was created, hence its size is smaller than<br />
the others), UNTITLED (no schedules have logging enabled, hence no store files) and DTCAN169 (two schedules with<br />
logged data).<br />
UM-0085-B2 <strong>DT80</strong> <strong>Series</strong> User’s <strong>Manual</strong> Page 102
External USB Devices (A:)<br />
An external USB memory device plugged into the <strong>DT80</strong> can be used to store:<br />
<br />
<br />
<br />
<br />
<br />
<br />
store files (e.g. A:\SN081234\JOBS\MYJOB\A\DATA_A.DBD) for schedules that are configured to log directly<br />
to the USB device (using the "A:" schedule option)<br />
archive files (e.g. A:\SN081234\JOBS\MYJOB\A\001_20060401T090002.DBD)<br />
an ONINSERT job (A:\SN081234\ONINSERT.DXC) which will run when the memory device is inserted into this<br />
<strong>DT80</strong><br />
an ONINSERT job (A:\ONINSERT.DXC) which will run when the memory device is inserted into any <strong>DT80</strong><br />
other files which have been manually copied from the <strong>DT80</strong>, e.g. event logs<br />
other files not related to the <strong>DT80</strong><br />
Notice that <strong>DT80</strong> related files are always stored in a subtree whose name is based on the <strong>DT80</strong> serial number. This allows<br />
data from a number of different <strong>DT80</strong>s to be collected on the one USB device.<br />
A typical directory listing (see File Commands (P104)) of a USB device might look like:<br />
DIRTREE A:<br />
Volume in drive A is JD1<br />
2006/02/06 12:40 - SN080043<br />
2006/02/06 12:40 - JOBS<br />
2006/02/06 12:40 - UNTITLED<br />
2006/02/06 12:40 - A<br />
2006/02/06 12:40 1048784 - DATA_A.DBD<br />
2006/02/07 13:36 - DTCAN169<br />
2006/02/07 13:36 - A<br />
2006/02/07 13:36 8928 - 001_20060207T133615.DBD<br />
2006/02/07 13:36 - D<br />
2006/02/07 13:36 4788 - 002_20060207T133615.DBD<br />
2006/01/27 10:46 - SN080122<br />
2006/01/27 10:46 202 - ONINSERT.DXC<br />
2006/02/07 17:46 - JOBS<br />
2006/02/07 17:46 - XAM<br />
2006/02/07 17:46 - A<br />
2006/02/07 17:46 1048784 - DATA_A.DBD<br />
2006/02/07 17:46 - B<br />
2006/02/07 17:46 1048784 - DATA_B.DBD<br />
18 File(s) 125306880 Bytes free<br />
In this case the memory device has been used in two different <strong>DT80</strong>s. Serial number 080043 has logged some data directly<br />
to the device as part of job UNTITLED, while archive files have been created for job DTCAN169 – probably using<br />
COPYDATA. Serial number 080122 has logged data directly to store files on the device, and it also has an ONINSERT job<br />
defined, which will run whenever the memory device is plugged into <strong>DT80</strong> serial number 080122.<br />
Supported USB Device Types<br />
For an external USB memory device to be recognised by the <strong>DT80</strong>, the device must:<br />
draw no more than 100mA from the USB bus, and<br />
support the standard USB "mass storage" device class interface (this includes most USB "memory sticks", MP3<br />
players and USB hard disks, but does not include devices such as USB printers, modems and so on), and<br />
have the primary disk partition formatted using a FAT16 or FAT32 file system.<br />
USB memory devices are nearly always shipped pre-formatted using a FAT16/FAT32 file system.<br />
If a memory device is inserted that is not properly formatted, the <strong>DT80</strong> will display:<br />
USB device unrecognised<br />
on the LCD.<br />
Formatting a USB Memory Device<br />
The FORMAT A: command (see File Commands (P104)) can be used to re-format the device. This will delete all data from<br />
the device. Alternatively the device can be formatted in a Windows based computer.<br />
Note For larger capacity USB memory devices (1Gbyte and above), it is recommended that you always format the device in<br />
the logger before using it for the first time. This is because the <strong>DT80</strong> will format the device in a way that maximises<br />
performance and minimises the time taken to read the device each time it is inserted. In particular:<br />
for capacities in the range 1-2GB, the <strong>DT80</strong> will create a FAT16 file system, whereas Windows will normally format the<br />
device as FAT32 by default. FAT16 is less space-efficient if there are many small files, but it is faster.<br />
UM-0085-B2 <strong>DT80</strong> <strong>Series</strong> User’s <strong>Manual</strong> Page 103
for capacities 4GB and above, the <strong>DT80</strong> will create a FAT32 file system. It will, however, select a larger allocation unit<br />
size to maximise speed at the expense of space efficiency.<br />
Note that even though Windows and the <strong>DT80</strong> may use different formatting parameters, Windows will always be able to read<br />
a <strong>DT80</strong>-formatted device, and vice versa.<br />
Using a USB Memory Device<br />
Startup<br />
When a USB memory device is first plugged in, the <strong>DT80</strong> needs to read various information from the device before it can be<br />
used. This process can take several seconds (possibly a minute or more for large media), but it is a background operation so<br />
sampling and logging can continue. The <strong>DT80</strong> displays<br />
Reading USB device<br />
on the LCD while this operation is in progress.<br />
Once the USB device is ready, it can be accessed in the same way as the internal drive.<br />
Removal<br />
Important The USB device must not be removed while it is being accessed. Doing so may result in data corruption.<br />
To safely remove a USB device, you should always first issue the REMOVEMEDIA command. This command is also one of<br />
the default options on the front panel function menu (P109). This command will:<br />
1. suspend logging for any schedules that are configured to log directly to the USB memory device. This will cause an<br />
error message to be returned, and the Attn LED will start flashing.<br />
2. make sure that all required information has been fully copied to the device and all files are closed<br />
3. shut down the device. If the device has an indicator light, it should now be off.<br />
If you change your mind and want to keep using the device, you will now need to remove it and then re-insert it.<br />
File Commands<br />
The <strong>DT80</strong> provides a number of general purpose file manipulation commands. These will work both for files stored on the<br />
internal file system (B:) and an external USB memory device (A:), if one is present.<br />
Command<br />
COPY source dest<br />
DIR path<br />
DIRTREE path<br />
TYPE source<br />
DEL source<br />
DELTREE path<br />
FORMAT A:<br />
FORMAT B: DELETEALL<br />
Function<br />
reads the file source and creates a copy called dest<br />
lists the contents of directory path. If path is not specified, B:\ is assumed.<br />
lists the contents of directory path and all sub-directories. If path is not specified, B:\ is<br />
assumed.<br />
displays the contents of file source. Use only with text files.<br />
deletes the file source. Use with care!<br />
deletes the directory path and all subdirectories. Use with care!<br />
deletes all files from the USB memory device and re-creates the file system. Use with<br />
care! For best performance, it is recommended that new USB devices be formatted in<br />
the <strong>DT80</strong> before use.<br />
deletes all files from the internal flash drive and re-creates the file system. This<br />
command would normally only ever be used if the <strong>DT80</strong>'s internal compact flash card<br />
was replaced. After executing this command it will be necessary to repeat the firmware<br />
upgrade process in order to re-install system files (e.g. for the web interface) onto the<br />
internal flash drive.<br />
Note These commands are for advanced users only. In most cases the standard <strong>DT80</strong> commands (e.g. DIRJOB,<br />
DELDATA and so on) are preferred. Furthermore, note that file names or locations may be subject to change in future<br />
firmware versions.<br />
The <strong>DT80</strong>'s default directory is B:\. So the command DIR JOBS is equivalent to DIR B:\JOBS.<br />
For example, if you want to copy the <strong>DT80</strong>'s system event log to a USB memory device for later analysis you could use:<br />
COPY EVENTS\EVENT.LOG A:\EVENT_20060219.LOG<br />
Done<br />
Note that wildcards (e.g. "*.LOG") are not supported by any of these commands.<br />
Important The DeTransfer program, which is often used to supervise the <strong>DT80</strong>, has a number of special commands that<br />
begin with a \ (backslash) character. These are interpreted by DeTransfer and not sent to the <strong>DT80</strong>. In order to send a \<br />
character from DeTransfer, you need to enter a double backslash (\\). For example, the above example would be entered<br />
into DeTransfer as follows:<br />
COPY EVENTS\\EVENT.LOG A:\\EVENT_20060219.LOG<br />
This rule applies to DeTransfer only; it does not apply to the "Text" window in DeLogger, nor to the web interface Command<br />
window.<br />
UM-0085-B2 <strong>DT80</strong> <strong>Series</strong> User’s <strong>Manual</strong> Page 104
Data Recovery<br />
Prevention<br />
If you accidentally remove a USB device while it is being accessed, then it is possible that the file system on the USB device<br />
may be corrupted. (The same applies if you remove a USB memory device from a Windows computer without selecting the<br />
"Safely Remove Hardware" option.)<br />
The internal file system or USB memory device may also be corrupted if the logger suddenly loses all power while it is writing<br />
to the disk.<br />
To minimise the chance of data loss due to these causes, remember to:<br />
ensure that the battery link is in place. This will allow the <strong>DT80</strong> to keep operating normally for a period of time, in the<br />
event of an external power failure<br />
always use the REMOVEMEDIA command before removing the memory device if there are schedules logging directly<br />
to the USB device<br />
Note that the <strong>DT80</strong> provides some protection against gradual power failure (e.g. the internal battery becoming discharged).<br />
If it detects that the supply voltage is becoming critically low, the <strong>DT80</strong> will automatically close all store files and force the unit<br />
into low power sleep mode (P229). The <strong>DT80</strong> will remain asleep until the power supply recovers to an adequate level.<br />
Recovery<br />
Media Removal<br />
If a USB device was accidentally removed while it was being logged to, you should plug it into a Windows computer. Before<br />
attempting to open any of the files, run a Windows file system check utility (e.g. type chkdsk drive: at a command prompt,<br />
where drive is the drive letter assigned to the USB device). This will detect and if possible repair any inconsistencies in the<br />
file system structure.<br />
Note that even if there are no file system errors, there may still be corruption in one or more store files (DATA_x.DBD) if they<br />
were being actively logged to at the time of the media removal. Copy the files to the host PC and verify that they can be<br />
opened successfully and all the expected data is there.<br />
If the files appear to be damaged (e.g. they don't open correctly in dump_dbd) then the original files on the USB device<br />
should be deleted before inserting the device back into the <strong>DT80</strong> and re-enabling logging. This avoids having the <strong>DT80</strong><br />
attempt to log data to a damaged file, possibly causing more damage in the process.<br />
Power Failure<br />
If external power was lost and the battery link was not present or the internal battery was flat, then the internal file system<br />
may be corrupted (if it was being written to at the time of the failure).<br />
When power is restored, the <strong>DT80</strong> will attempt to automatically repair the file system (using the B:\FAILSAFE file) if<br />
necessary.<br />
Before re-enabling logging, it would be prudent to manually copy to a USB device the store files for the job that was active at<br />
the time of the failure, e.g.:<br />
COPY B:\JOBS\JOE\A\DATA_A.DBD A:\JOE_SAVE\DATA_A.DBD<br />
and verify that they can be opened on the host PC.<br />
Store File Recovery<br />
If a store file is damaged, contact Datataker for assistance. We may be able to recover data from the file. But note that<br />
prevention is always better than cure.<br />
Badly Formatted Device<br />
In exceptional cases, a severely corrupted memory device may result in a fatal error occurring on the <strong>DT80</strong> when the device<br />
is inserted, and this may cause the <strong>DT80</strong> to reset. If this is the case, you can try holding down the Func/Cancel button while<br />
inserting the memory device. This will cause the <strong>DT80</strong> to not attempt to read the device; instead it will display USB device<br />
unrecognised. You can now reformat the device using the FORMAT A: command.<br />
UM-0085-B2 <strong>DT80</strong> <strong>Series</strong> User’s <strong>Manual</strong> Page 105
Part H – <strong>DT80</strong> Front Panel<br />
The <strong>DT80</strong> front panel user interface comprises:<br />
a 2 line by 16 character back-lit liquid crystal display (not DT81)<br />
6 keys (not DT81)<br />
4 status indicator lights (3 for <strong>DT80</strong> <strong>Series</strong> 1)<br />
The display provides information about data logger status, channel data, alarms and store operation. In addition the display<br />
will indicate conditions that require attention and USB memory device status.<br />
The <strong>DT80</strong> from cannot be programmed from the front panel. However, pre-defined commands can be issued by selecting<br />
from the function list via the front panel.<br />
Figure 21 <strong>DT80</strong> Front Panel<br />
Display<br />
(Not applicable to DT81)<br />
The display normally shows the current value for each channel and alarm in the current job. Each channel or alarm is shown<br />
one at a time. The Up and Down directional keys on the front panel are used to scroll through the available channels, as well<br />
as various status screens. The channels and alarms are arranged in the same order that they are defined in for the current<br />
job.<br />
Displaying Channels and Alarms<br />
When channel data is displayed, the top line of the display shows the channel identification. The default is the channel<br />
number and type. If channel identification text has been entered as a channel option, then the first 16 characters of that text<br />
is displayed.<br />
The bottom line on the display shows the most recent reading as a numeric value or bar graph. If the channel or alarm has<br />
not yet been sampled, the display shows " NotYetSet".<br />
When alarms are displayed the top line of the display identifies the alarm and the state of the alarm – ON or OFF. If the alarm<br />
channel definition includes identification text, then this is displayed when the alarm is not true. If the alarm contains action<br />
text, this is displayed when the alarm is true.<br />
UM-0085-B2 <strong>DT80</strong> <strong>Series</strong> User’s <strong>Manual</strong> Page 106
Example<br />
As an example, assume that the following job has been defined:<br />
BEGIN"MYJOB"<br />
RA1M 1TK("Boiler Temp",FF0)<br />
2LM35<br />
ALARM4(3V>2000)"Over voltage"<br />
1CV(W)=1CV+1<br />
ALARM7(4TT("Oven OK")>107)"Oven Over Temp"<br />
END<br />
The following "screens" will then be available. These can be scrolled through using the Up and Down arrows on the keypad.<br />
Pressing Down<br />
Display screen<br />
Comments<br />
<strong>DT80</strong> V8.04<br />
MYJOB<br />
The default "sign-on" screen indicates the <strong>DT80</strong>'s firmware version number and the name<br />
of the currently loaded job (No current job is displayed if there isn't one)<br />
Date: 23/10/2009<br />
Time: 16:44:02<br />
Battery: 90% ↓<br />
-290mA 6.2V<br />
Eth IP: Auto<br />
192.168.11.160<br />
Current date and time (format can be changed using P31 and P39)<br />
Internal battery status. This shows the approximate battery charge as a percentage, a<br />
charge (↑) or discharge (↓) indicator, battery current (negative=discharging) and the battery<br />
terminal voltage. NC is displayed if the internal battery is not connected.<br />
This screen is not present on models with no internal battery charger, e.g. DT82E<br />
Ethernet port mode (Automatic, <strong>Manual</strong> or Disabled) and current IP address<br />
Boiler Temp<br />
97 C<br />
First user channel (user defined channel name)<br />
Channel 2LM35<br />
17.9 C<br />
Second user channel (default channel name)<br />
Alarm4 OFF<br />
1356.3 mV<br />
Alarm #4 state<br />
Oven Over Temp<br />
117.2 C<br />
Alarm #7 state (alarm text replaces channel name when alarm is active)<br />
Note that channel 1CV is not displayed because it is defined as a working (W) channel. Working channels are neither<br />
logged, returned nor displayed.<br />
Bar Graph<br />
The channel value can be shown as a bar graph instead of a numeric value by using the BG channel option. The BG option<br />
allows the values to be set that represent the left and right side of the graph scale. The channel label can be used to set the<br />
graph scale labels. For example:<br />
Display screen<br />
E--Fuel Level--F<br />
███████<br />
Comments<br />
4V("E--Fuel Level--F",BG10:900)<br />
displays zero scale (no bars) if measured voltage < 10mV; displays full scale (16 bars) if<br />
voltage > 900mV<br />
UM-0085-B2 <strong>DT80</strong> <strong>Series</strong> User’s <strong>Manual</strong> Page 107
Controlling what is shown on the display<br />
All defined channels and alarms will be shown on the display, except for:<br />
<br />
<br />
channels which specify the ND (no display) channel option<br />
working channels (W channel option)<br />
un-numbered alarms<br />
alarms where the channel in the alarm condition is a no-display (ND) or working (W) channel<br />
For example:<br />
4TT<br />
' displayed<br />
3CV(W)=3CV+1<br />
' not displayed<br />
ALARM1(2CV>10)"Quokka" ' displayed<br />
ALARM(2CV>20)"Platypus" ' not displayed<br />
ALARM2(2CV(ND)>30)"Echidna" ' not displayed<br />
Auto-scrolling<br />
The <strong>DT80</strong> may also be configured to automatically scroll through the channel display screens. This is useful in applications<br />
where the <strong>DT80</strong> is mounted behind a glass panel – the display is visible but the keypad is inaccessible.<br />
To enable auto-scroll set the following profile:<br />
PROFILE DISPLAY AUTOSCROLL_INTERVAL=10S<br />
which in this case will automatically switch between channel display screens every 10 seconds. If this profile is set to 0 then<br />
auto-scroll is disabled.<br />
Pressing a key on the keypad while auto-scroll is active will temporarily suspend auto-scroll and allow you to manually<br />
navigate through the screens. By default, auto-scroll will resume (if it is enabled) 30 seconds after the last key press. This<br />
time can be changed using:<br />
PROFILE DISPLAY AUTOSCROLL_DELAY=1M<br />
which in this case will wait one minute before resuming auto-scroll.<br />
Auto-acknowledge<br />
In applications where the keypad is inaccessible, the following profile can be set to automatically aclnowledge (clear) any<br />
pop-up messages after a period of time:<br />
PROFILE DISPLAY AUTOACK_DELAY=1M<br />
Set to 0 to disable this feature.<br />
Pop-up Messages<br />
The display may also show temporary status screens, such as.<br />
Display screen<br />
Comments<br />
Reading USB<br />
device<br />
When a USB device is inserted the <strong>DT80</strong> needs to read certain system information from it<br />
before it can be used.<br />
USB device<br />
unrecognised<br />
Run ONINSERT<br />
Processing<br />
ONINSERT.DXC<br />
Copy→USB 1/3<br />
████████<br />
This indicates that the <strong>DT80</strong> does not recognise the device as a valid USB mass storage<br />
device.<br />
This is displayed briefly following insertion of a USB memory device that contains an<br />
ONINSERT.DXC file. Press OK to allow the file to execute (which is the default), or press<br />
any other key to skip execution of the file.<br />
If the USB memory device contains a file called ONINSERT.DXC then it will be<br />
automatically loaded and run by the <strong>DT80</strong><br />
This indicates progress during a COPYD operation where the destination is set to the USB<br />
device. The numeric counter on the top line indicates the data/alarm store being processed<br />
(store 1 of 3), while the bargraph shows unload progress for each store.<br />
UM-0085-B2 <strong>DT80</strong> <strong>Series</strong> User’s <strong>Manual</strong> Page 108
Display Backlight<br />
The display backlight will normally only stay on for 30 seconds after the last key press. The actual period that the backlight<br />
stays on for after a key press is controlled by P17 in seconds.<br />
Parameter P20 (P198) can be used to further control the operation of the backlight, for example setting P20=0 will cause the<br />
backlight to be always off, while P20=1 will leave the backlight always on (except while the logger is sleeping).<br />
User Defined Functions<br />
(Not applicable to DT81)<br />
The user can define up to 10 named macros called functions. These functions can be executed by the user via the LCD and<br />
keypad of the <strong>DT80</strong>.<br />
Defining Functions<br />
Functions are defined using the following profile settings, one pair for each of the 10 available functions:<br />
PROFILE FUNCTION F1_LABEL=label<br />
PROFILE FUNCTION F1_COMMAND=command string<br />
These will define the label to display on the LCD (up to 16 characters), and the command string to execute when the function<br />
is selected. Substitute F2, F3 etc. in the profile key names to define further functions.<br />
Enclose label or command string in double quotes if they contain spaces or special characters.<br />
For example:<br />
Command<br />
PROFILE FUNCTION F1_LABEL=Start<br />
PROFILE FUNCTION F1_COMMAND=G<br />
PROFILE FUNCTION F2_LABEL="Temp \176F"<br />
PROFILE FUNCTION F2_COMMAND=REFT(S2,=5CV)<br />
PROFILE FUNCTION F3_LABEL=Upload<br />
PROFILE FUNCTION F3_COMMAND="copyd<br />
start=new dest=ftp://x.com/unit42/"<br />
PROFILE FUNCTION F4_LABEL=Clear<br />
PROFILE FUNCTION F4_COMMAND=1..20CV(W)=0<br />
Selecting Functions<br />
Description<br />
This function would display Start and when selected would<br />
issue the G or go command to the logger which would start<br />
all schedules<br />
This function would display Temp °F and when selected<br />
would measure the logger's internal temperature and store<br />
the scaled value to channel variable 5CV<br />
This would display Upload and when selected would unload<br />
new data to an FTP server<br />
This function would display Clear and would set channel<br />
variables 1-20 back to zero.<br />
Pressing the Cancel/Func key will cause the function list to be shown on the display. One function is shown at a time, and<br />
only those functions which have a command defined are shown. The up and down direction keys can be pressed to scroll<br />
through the list of functions. Once the desired function is visible on the display it can be executed by pressing the OK/Edit<br />
key. If you wish to exit the function list without executing any function then press the Cancel/Func key to cancel the function<br />
selection process.<br />
After selecting the function to execute, the display will indicate that the function selected has been initiated.<br />
Default Functions<br />
Following reset, the <strong>DT80</strong> automatically defines three commonly used functions:<br />
Remove USB – disables USB memory device to allow safe removal<br />
Copy logged data – unload all logged data for current job to USB memory device<br />
Auto Ethernet IP – sets Ethernet port to AUTO and forces the <strong>DT80</strong> to re-acquire an IP address<br />
These can be redefined or removed if desired by changing the profile settings.<br />
UM-0085-B2 <strong>DT80</strong> <strong>Series</strong> User’s <strong>Manual</strong> Page 109
Keypad operation<br />
(Not applicable to DT81)<br />
Direction Keys<br />
The up and down direction keys allow scrolling through the available channels, alarms and status<br />
screens on the display. When the function list is shown, then the up and down direction keys allows<br />
scrolling through the list of available of functions.<br />
The left and right direction keys are not currently used.<br />
OK (Edit) Key<br />
The OK/Edit key is used to select a function to execute when the function list is displayed. The edit<br />
function will be used in a later firmware version that supports editing of values.<br />
Cancel (Function) Key<br />
The Cancel/Func key is used to enter the function list display. It can be pressed again to exit the<br />
function list without selecting a function.<br />
Special Key Sequences<br />
Entering Bootstrap Mode<br />
Holding down the OK/Edit key during the logger reset or power-up sequence will force the logger into bootstrap mode. This<br />
would only be required if there is a corruption of the firmware in the logger.<br />
Status Indicator Lights<br />
Sample Indicator<br />
The Sample indicator is illuminated whenever any channel in the current job is sampled. This includes all analog, digital and<br />
internal channels.<br />
Disk Indicator<br />
The Disk indicator is illuminated whenever the internal disk is reading or writing. For example, the disk indicator will<br />
illuminate when writing data to the internal data store or when unloading data from the data store.<br />
Power Indicator (not <strong>DT80</strong> <strong>Series</strong> 1)<br />
This indicator flashes every 3 seconds while the logger is awake. A long "LED on" time followed by a short "LED off" time<br />
indicates that the logger is externally powered; a short "on" time followed by a long "off" time indicates battery power.<br />
Attn Indicator<br />
This LED is used to:<br />
<br />
<br />
<br />
warn that an unexpected <strong>DT80</strong> reset has occurred (flashing)<br />
warn that logging has been partially or fully suspended (flashing)<br />
indicate a warning state under the control of a user program (continuously on)<br />
UM-0085-B2 <strong>DT80</strong> <strong>Series</strong> User’s <strong>Manual</strong> Page 110
Unexpected Reset<br />
A message such as the following may be displayed following <strong>DT80</strong> reset, in conjunction with a flashing Attn LED. Press any<br />
key to clear the message and the flashing LED.<br />
Display<br />
<strong>DT80</strong> restarted<br />
Power loss<br />
Comments<br />
The <strong>DT80</strong> lost power, both external and the internal battery. This message may also be<br />
displayed if the hardware reset button (accessed using a paper clip) is pressed.<br />
<strong>DT80</strong> restarted<br />
Safe mode<br />
A "triple-push" reset was performed (by pressing the hardware reset button three times<br />
within 10s), which temporarily restores factory settings<br />
<strong>DT80</strong> restarted<br />
SW exception<br />
<strong>DT80</strong> restarted<br />
All mem cleared<br />
This indicates a possible problem with the <strong>DT80</strong> firmware. Contact Datataker Support if<br />
you see this message.<br />
The <strong>DT80</strong> lost power, and all internal RAM has been cleared, probably due to the internal<br />
Lithium memory backup battery being flat. Programs and logged data will not be affected<br />
but you will need to reset the <strong>DT80</strong>'s time/date.<br />
Logging Suspended<br />
If data for one or more schedules cannot be logged for some reason then the <strong>DT80</strong> will continue to run the job but it will flash<br />
the Attn LED and display a message such as the following. Pressing a key will clear the message from the display, but the<br />
Attn LED will keep flashing until space is made available (e.g. by deleting data or inserting a USB device)<br />
Display<br />
Comments<br />
Cannot log<br />
Data full<br />
One or more schedules have been set to "no-overwrite" mode (NOV schedule option), and<br />
the allocated space is now full<br />
Cannot log<br />
No USB device<br />
The "A:" schedule option (log directly to USB device) has been specified, but no USB<br />
device is inserted.<br />
User Control<br />
You can also turn the Attn LED on or off using the SATTN (Set Attention) and CATTN (Clear Attention) commands.<br />
Alternatively, the 1WARN channel type (which works in the same way as a digital output channel) may be used.<br />
For example:<br />
RA1S ALARM1(3TT>500)"Meltdown"{SATTN}<br />
will cause the LED to come on and stay on if the alarm is triggered, and<br />
RA1S 1CV=(1CV+1)%10 IF(1CV==0){1WARN(R,200)=1}<br />
will give a 200ms flash every tenth time the schedule is scanned.<br />
UM-0085-B2 <strong>DT80</strong> <strong>Series</strong> User’s <strong>Manual</strong> Page 111
Part I – Web Interface<br />
What is the Web Interface<br />
The <strong>DT80</strong> provides an embedded web interface that provides simple, intuitive access to the logger’s operations using a<br />
standard web browser. You can view current sensor readings, job status and access data and other files stored in the file<br />
system.<br />
The standard web interface is built into the logger’s firmware. It does not need to be installed on the logger or on your PC.<br />
Simply use your existing browser to browse to the logger’s IP address and the home page will be displayed.<br />
Note The <strong>DT80</strong> web interface is a predominantly read-only interface; that is, it is intended for monitoring a logger that has<br />
already been programmed.<br />
dEX vs. Classic Web Interface<br />
The <strong>DT80</strong> actually features two web interfaces:<br />
dEX, also known as the enhanced web interface, is available on all <strong>Series</strong> 2 loggers. This uses Adobe Flash<br />
technology to provide a full-featured and easy to use interface.<br />
The classic web interface is available on <strong>Series</strong> 1 and <strong>Series</strong> 2 loggers. This HTML-based interface has fewer<br />
features than the enhanced interface, but it is customisable and is also more suitable for slow connections and<br />
small-screen web clients.<br />
The following table summarises the differences between the two web interfaces:<br />
Feature<br />
dEX<br />
Classic web<br />
interface<br />
Display basic logger information (serial number, firmware version etc.) yes yes<br />
Display schedule status (log/run status, number of logged records, etc.) yes yes<br />
Display current channel values in tabular form yes yes<br />
Display event logs yes yes<br />
Display user manual, release notes, etc. yes yes<br />
Graphically configure the logger, i.e. define schedules, channels and global yes -<br />
settings without using the logger command language<br />
Display selected channels in a configurable "mimic" displays, including trend yes -<br />
charts<br />
Unload data and save to CSV or DBD file yes -<br />
Text command window (similar to DeTransfer) yes -<br />
Display current parameter, switch and profile settings yes -<br />
Display current job's program text yes -<br />
Display file system free/used space breakdown yes -<br />
Display TEST and SERVICEDATA command response yes -<br />
User customisable branding (images, web links, help pages) yes -<br />
Menu options can be selectively disabled or restricted yes -<br />
Suitable for low bandwidth connection e.g. dial-up modem - yes<br />
Suitable for small screen client e.g. PDA - yes<br />
User customisable HTML pages - yes<br />
Connecting to the Web Interface<br />
In order to access the <strong>DT80</strong> web interface, a TCP/IP connection between the <strong>DT80</strong> and the PC is required. You can connect<br />
the <strong>DT80</strong>'s Ethernet port to a local area network, or directly to the PC using an Ethernet cross-over cable, or you can set up<br />
a serial connection to one of the <strong>DT80</strong>'s serial ports (USB, host or serial sensor) using the PPP protocol. See Ethernet<br />
Communications (P177) and PPP Communications (P188) for more details.<br />
Once a TCP/IP connection has been established, all you need to do is type the <strong>DT80</strong>'s IP address into the address field of<br />
your browser. The web interface home page should then be displayed.<br />
Home Page<br />
For <strong>Series</strong> 1 loggers, when you enter the <strong>DT80</strong>'s IP address into your browser you will be immediately directed to the home<br />
page for the classic web interface (<strong>Series</strong> 1 loggers do not support dEX). See Classic Web Interface (P141) for more details.<br />
If you are using a "small screen" browser e.g. Internet Explorer Mobile, you will also be directed to the classic web interface.<br />
For <strong>Series</strong> 2 loggers, you have the choice of running either dEX or the classic interface. The first screen you will see after<br />
UM-0085-B2 <strong>DT80</strong> <strong>Series</strong> User’s <strong>Manual</strong> Page 112
owsing to the <strong>DT80</strong>'s IP address is the Logger Home screen, as shown below.<br />
Figure 22: Logger home page<br />
The Logger home page provides four options, which are organised into two tabs. With the High speed connection tab<br />
selected, you can:<br />
<br />
<br />
<br />
click Configure the logger to launch the dEX configuration builder. This allows you to configure the <strong>DT80</strong> using a<br />
graphical interface, rather than the logger's command language.<br />
click Monitor the logger to launch the dEX web interface, which allows you to monitor the current state of the <strong>DT80</strong>,<br />
unload data and use the command interface.<br />
click Customise dEX to launch an application which allows you to customise or restrict parts of the web interface. See<br />
Customising the Web Interface (P137). Note that this option will not be present if the web interface configuration tool<br />
has been deleted from the logger by an administrator.<br />
To launch the classic web interface, select the Low speed connection tab, then click Launch web interface.<br />
Once the desired interface (dEX or classic) starts up, you may wish to bookmark its home page so that in the future you can<br />
go straight to it, bypassing the Logger home screen. See also Preventing Configuration Changes (P140).<br />
When configuring the logger, it is often convenient to have the dEX configuration builder running in one browser tab, and the<br />
dEX web interface running in another. You can then easily switch between them without having to return to the Logger Home<br />
page.<br />
Starting dEX<br />
The dEX Configuration Builder and the dEX web interface are Adobe Flash applications. When you select either of these<br />
options on the Logger home screen, the following sequence of events takes place:<br />
1. A check is made to see if the browser contains the required Adobe Flash plug-in. This plug-in is a software component<br />
produced by Adobe Systems Inc. which allows the web browser to run Flash applications such as the <strong>DT80</strong> web<br />
interface. The plug-in is also sometimes referred to as the "Flash Player". The Flash Player only needs to be installed<br />
once, so it is likely that your computer will already have it installed.<br />
2. If the Flash Player is not already installed, or it is older than Version 10.0, then the browser will automatically attempt<br />
to download the required plug-in from the Internet and install it. The exact sequence of events will vary from browser to<br />
browser. You may receive various security alerts during this process which you will need to approve in order for the<br />
installation to complete. You may also require administrative rights for your computer; check with your IT department.<br />
3. The selected dEX application will now be automatically downloaded from the logger onto your computer. The size of<br />
this file is approximately 1-2Mbyte, so this will take a few seconds over an Ethernet connection and considerably<br />
longer over a modem link. During this time a progress bar will be displayed.<br />
UM-0085-B2 <strong>DT80</strong> <strong>Series</strong> User’s <strong>Manual</strong> Page 113
4. The Flash Player will then launch the dEX application and the configuration builder or web interface main screen will<br />
appear in the web browser.<br />
Note If your computer does not have the Flash Player installed, and does not have an Internet connection, then you will need<br />
to obtain and install the Flash Player manually. Using a computer which does have Internet access you can download the<br />
Flash Player package from www.adobe.com, transfer the installation file onto your computer and then launch it to install<br />
Flash Player.<br />
Note If you press the Refresh or Reload button on your browser then the above process will be repeated. That is, the<br />
application will be re-downloaded and will then restart at the Welcome page. Most screens within the web interface<br />
application include an Update button – use this button (not the browser Refresh button) to update displayed information.<br />
Browser Requirements<br />
An Adobe Flash plug-in is available for most popular web browsers, including:<br />
Microsoft Internet Explorer Version 7 or later<br />
Mozilla Firefox<br />
Apple Safari<br />
Google Chrome<br />
Once the plug-in is installed (which, as described above, is normally an automatic process), any of these browsers can be<br />
used to access the <strong>DT80</strong> Web Interface.<br />
Note that JavaScript needs to be enabled in the browser options (this is normally the default).<br />
dEX Configuration Builder<br />
Using the Configuration Builder<br />
The dEX configuration builder is used to graphically define the <strong>DT80</strong> configuration. You can define schedules, channels<br />
and global settings, then load the configuration onto the logger and start it running.<br />
The following screenshot shows the general configuration builder screen layout:<br />
Figure 23: Typical configuration builder display<br />
UM-0085-B2 <strong>DT80</strong> <strong>Series</strong> User’s <strong>Manual</strong> Page 114
Tree View<br />
The area on the left of the screen shows a tree view of the current configuration. As configuration elements (channels and<br />
schedules) are defined, entries are added to the tree view. This part of the interface thus gives an overview of the<br />
configuration, showing which channels belong to which schedules.<br />
The tree contains three "levels", with each level's entries indented further to the right.<br />
At the top level there is a single entry for the logger as a whole. This entry represents the logger's global settings, such<br />
as profile settings and statistical schedule rate.<br />
Beneath that are the schedules. In the screenshot three schedules have been defined: the built-in On logger<br />
activation entry represents the immediate schedule, and is followed by two user schedules, A and B (a.k.a<br />
"Schedule_1" and "Schedule_2").<br />
Finally, at the third level are the channels: in this case, "Indoor", "Outdoor" and "WindSpeed".<br />
If you highlight an entry in the tree, its details will be displayed in the large properties pane area which occupies most of the<br />
screen area. The border between the tree view and the properties pane can be dragged left or right to adjust the width of<br />
these two areas.<br />
If you double click on a tree entry, its name will become editable. This allows you to rename an existing schedule or channel.<br />
At the bottom of the tree view area are three buttons. The arrows are used to re-order items in the tree by moving the<br />
highlighted entry up or down. The Recycle Bin button will delete the highlighted entry.<br />
Finally, the small triangles next to the logger and schedule tree view entries can be used to hide/unhide all of their constituent<br />
entries, which can reduce clutter when you are working on a large configuration.<br />
Properties Pane<br />
The large properties pane on the right hand side is used to display all of the detailed settings for the selected tree view item.<br />
The layout of this area varies depending on the type of entry selected on the tree – logger, schedule or channel:<br />
If the Logger tree entry is selected, the properties pane shows some basic details of the logger, such as the model and<br />
the number of CEMs connected. This is also the place to set any of the <strong>DT80</strong>'s profile settings.<br />
If a schedule tree entry is selected then details of the schedule's trigger and storage options are shown.<br />
If a channel entry is selected (as is the case on the screenshot) then in most cases the top part of the properties pane<br />
will show the selected wiring configuration and channel number, while the lower part will feature a number of tabs<br />
containing detailed settings.<br />
Menu<br />
The menu bar across the top works in the same way as the menu bar in any other window-based application. Note that many<br />
of the menus have cascading sub-menus, as shown in the screenshot.<br />
Figure 24: Typical configuration builder menu<br />
Five menus are provided:<br />
The File menu is used to clear the current configuration or load an existing configuration, which may be either the<br />
logger's current configuration or a locally saved file. This menu also allows you to save a completed configuration to<br />
the logger, which will also "activate" the configuration, i.e. it will start running.<br />
The Edit menu simply duplicates the functions of the tree view buttons.<br />
The View menu allows you to view the logger program generated from your current settings.<br />
UM-0085-B2 <strong>DT80</strong> <strong>Series</strong> User’s <strong>Manual</strong> Page 115
The Add menu is used to define new tree entries – schedules and channels.<br />
Finally, the Help menu identifies the version of the configuration builder. It also provides links to various useful files on<br />
the <strong>DT80</strong>, including the user manual and firmware release notes.<br />
Banner Area<br />
The banner area along the top of the screen contains:<br />
<br />
<br />
a Logger Home button, which returns you to the Logger Home page<br />
the dataTaker logo on the right hand side will jump to the dataTaker website, www.datataker.com<br />
Note Navigating away from the configuration builder using the Logger Home button, or the dataTaker web link, or pressing<br />
the browser Refresh button will all cause any unsaved configuration entries to be lost. Be sure to save your work (using File<br />
/ Save to disc...) before leaving the configuration builder.<br />
It is often convenient to have the configuration builder running in one browser tab, and the dEX web interface running in<br />
another. You can then easily switch between them without having to return to the Logger Home page.<br />
Defining Schedules<br />
When the configuration builder starts up, two pre-defined schedules are shown: the immediate schedule (On logger<br />
activation) and one user schedule (A).<br />
If you click on schedule A's entry in the tree view its details will be displayed in the properties pane.<br />
Figure 25: Schedule configuration<br />
By default, the configuration builder sets a new schedule to a 5 second trigger. To change this time, simply set the Trigger<br />
Every control. To define other types of schedule trigger (e.g. event triggered, manual trigger), click on Advanced<br />
Triggering, which will cause more controls to appear.<br />
The Conditions area is used to define the schedule "while" condition (see Trigger While (P48)) – where, for example, a<br />
schedule will only trigger while a certain digital input is active. By default, there is no while condition.<br />
To set the schedule storage parameters, click on the Storage tab. This allows you to define various schedule options such<br />
as store file size and whether you want old data to be overwritten by new.<br />
Note that the On logger activation (immediate) schedule does not have a trigger or any storage options, so if you select it<br />
the properties pane will be blank.<br />
To add a new schedule, select the Add menu, then Schedule. This will add a new entry to the tree view, and display it with<br />
the name editable. Enter a name for the schedule then click the green tick.<br />
To change the priority order of schedules, select a schedule on the tree and use the up/down arrow buttons at the bottom of<br />
the tree view to move it up or down. Note that if the schedule order is changed then the schedule identifier (A, B etc.) will<br />
change but the schedule name will remain the same. The topmost user schedule in the tree is always schedule A.<br />
UM-0085-B2 <strong>DT80</strong> <strong>Series</strong> User’s <strong>Manual</strong> Page 116
Defining Channels<br />
In the configuration builder, the <strong>DT80</strong>'s channel types are categorised as follows:<br />
Measurement channels include all analog, digital and internal channel types<br />
Control channels are digital outputs<br />
Serial channels currently include the SDI12 channel type only<br />
<br />
Reference, Calculation and Delay channels refer to the &chan, CALC and DELAY channels<br />
<br />
<strong>Manual</strong> channels allow entry of a channel definition using the <strong>DT80</strong> command language. Use this for any channel<br />
types not directly supported by the configuration builder.<br />
To add a new channel:<br />
1. In the tree view, select the schedule to contain the new channel, or select any existing channel within that schedule.<br />
2. Select the Add menu, then find the required channel type.<br />
3. An entry for the channel will be added to the tree. Enter a name for the channel, and click the green tick (or press<br />
Enter).<br />
4. For most measurement channels, you now need to select a wiring diagram from the available choices on the<br />
properties pane, and select the channel number.<br />
5. If required, the other channel options in the tabs in the lower part of the properties pane can now be set.<br />
Note All channel names in a configuration must be unique.<br />
Measurement and Serial Channels<br />
All measurement and serial channel types have a similar properties pane layout, as shown in Figure 23.<br />
The control at the top of the screen specifies the specific channel type. In some cases this control is used to further refine the<br />
channel type selected in the Add menu, in other cases it is a fixed value. In the example shown, Thermocouple was<br />
selected in the Add menu, then K-type thermocouple was selected on this control.<br />
Next comes the wiring configuration and channel number controls. These must both be set in order for the configuration<br />
builder to generate a correct logger program.<br />
The remainder of the options are presented in five tabs in the lower part of the properties pane. These all have default<br />
settings; however you should check that these defaults match your requirements.<br />
General Settings<br />
The most important setting on this tab is the Log and display this value checkbox. For intermediate calculation channels<br />
(working channels) this should normally be cleared to avoid cluttering the logged data with intermediate channels.<br />
Note that the configuration builder does not support individual control of channel value display, logging and return (ND, NL<br />
and NR channel options).<br />
This tab also sets the units string that will be included in CSV data headings and shown on the display (assuming that the<br />
"log and display" checkbox is ticked)<br />
You can also assign the measured value to a channel variable. You may want to do this if the value is to be made available<br />
to a Modbus client system, for example. If you want to use the value in a calculation, then it is easier to just use a direct<br />
reference to the channel in the calculation; there is no need to assign it to a CV.<br />
Some channel types may include other controls on this tab. For example, for an SDI-12 channel the device and register<br />
addresses are specified here.<br />
Scaling<br />
The Scaling tab is where you define either a simple scaling factor (channel factor), or a span or polynomial. Selecting<br />
"Spans and Polynomials" will bring up a list of defined spans and polynomials on the left hand side. Clicking on an entry will<br />
show its details in the area on the right.<br />
UM-0085-B2 <strong>DT80</strong> <strong>Series</strong> User’s <strong>Manual</strong> Page 117
Figure 26: Defining a polynomial<br />
Initially, no spans or polynomials will be defined. To add one, click the Add button, select Span or Polynomial, then enter<br />
the required coefficients. In the above screen shot, the following polynomial has been defined:<br />
22.5 + 1.236x – 0.000275x 2<br />
Note that span and polynomial definitions are shared between channels. If you now define a new channel, all previously<br />
entered spans and polynomials will be available for selection. This means that if you select an already defined polynomial<br />
and then edit it (change the coefficient values) then you may be affecting other channels. A warning is displayed when an<br />
existing span/polynomial is selected to remind you of this.<br />
Statistics<br />
The Statistics tab is used to define additional statistical report values for the selected channel.<br />
Figure 27: Defining additional statistical report values<br />
For each row that is ticked, an additional measurement value will be calculated and reported. So in the above example a total<br />
of four values will be logged: the original measurement, plus the average, minimum and maximum values calculated over the<br />
period since the time the enclosing schedule was executed.<br />
If any statistical values are defined for a channel, the channel will then be sampled at the statistical schedule rate, rather than<br />
the rate of the channel's own schedule. It will, however, still be logged at its own schedule's rate.<br />
The statistical schedule rate is a global setting, which is set by clicking on the top level "logger" entry in the tree view.<br />
For example, if the statistical schedule rate is set to its default of 1 second, and the above channel's schedule is set to its<br />
default rate of 5 seconds, then the sensor will be sampled once per second. Every 5 seconds it will log the instantaneous<br />
value of the sensor, plus the average, minimum and maximum, calculated over the previous 5-second period.<br />
For each selected statistical value, an automatically generated channel name is used (e.g. "Indoor12_AV"), which consists<br />
of the channel name plus a suffix describing the statistical operation.<br />
You can choose not to log a calculated statistical value. For example, it may be being used as an input to a calculation<br />
channel.<br />
UM-0085-B2 <strong>DT80</strong> <strong>Series</strong> User’s <strong>Manual</strong> Page 118
Finally, each statistical value may optionally be assigned to a channel variable. You may want to do this if the value is to be<br />
made available to a Modbus client system, for example.<br />
Event/Alarm<br />
This tab is used to create an alarm channel. This will test the channel's measured value against a setpoint and then take<br />
some action if the condition is satisfied. Alarms are also referred to as "events" in the configuration builder.<br />
The first step in defining an alarm is to specify the alarm condition.<br />
Figure 28: Defining an alarm condition<br />
In the above example, the alarm condition will be true if the channel value is outside the range -5 to +45.<br />
The next step is to define the actions to perform.<br />
Figure 29: Defining alarm actions<br />
The checkbox at the top specifies whether the actions should be repeated each time that the alarm condition tests true, or<br />
whether they should be performed once, when the alarm condition goes from false to true. In <strong>DT80</strong> parlance, the former is an<br />
IF channel, while the latter is an ALARM.<br />
The Output text field specifies the alarm text, which will be logged to the schedule's alarm store when (or while) the alarm is<br />
triggered. Special "substitution characters" can be included, which will cause the <strong>DT80</strong> to insert certain dynamic values. In<br />
the example above, the V and U sequences will be replaced by the channel value and units respectively. The logged<br />
alarm string will therefore be something like:<br />
Temp outside range: 49.2 degC<br />
As well as being logged, the alarm text is also sent to the <strong>DT80</strong>'s currently active comms port. If the Send to Host Port<br />
option is set then it will instead be sent to the host RS232 port, regardless of which port is currently active. This is typically<br />
used for sending modem control messages.<br />
The Command field specifies one or more <strong>DT80</strong> commands to perform when (or while) the alarm is triggered. In this case<br />
the command string is:<br />
9CV=9CV+1; XD<br />
which will increment channel variable 9CV, then manually trigger schedule D.<br />
UM-0085-B2 <strong>DT80</strong> <strong>Series</strong> User’s <strong>Manual</strong> Page 119
The state of the alarm (true or false) can also be mirrored on up to two digital outputs or channel variables. To enable this<br />
feature, choose one or two of the outputs in the list on the left and drag them to the two areas on the right. In the above<br />
example the Relay contact output has been selected, so the <strong>DT80</strong> relay output will now be closed whilst the alarm is active.<br />
To remove an action, click the red cross.<br />
Advanced<br />
The Advanced tab contains various other options, which will vary according to the channel type. For example, an analog<br />
channel might include input gain lock settings, while a frequency input channel might have a sample period setting.<br />
For most channel types, data manipulation options (e.g. rate of change) can also be selected here.<br />
Control Channels<br />
Control channels are outputs, so many of the options to do with sampling or processing the channel return value are not<br />
relevant. Consequently there is only one tab for these channel types.<br />
In the configuration builder, three different digital output channel types are provided (LED driver, Relay driver and Logic<br />
state). These all translate to the logger DSO channel type, the only difference between them is in the displayed graphics for<br />
the wiring diagrams and controls.<br />
A typical properties pane display for a control channel is shown below.<br />
Figure 30: Defining a control channel<br />
For digital outputs, the channel number is selected by choosing the appropriate wiring diagram, rather than setting a<br />
separate control (as is the case for analog channels).<br />
The controls in the lower part of the properties pane select whether the control output state should be on, off, set according<br />
to a CV value (on if the CV is non-zero, off if it is zero) or inverted.<br />
You can also specify that the output should be pulsed – that is, set to the specified state for the indicated time, then inverted.<br />
Thus in the above example the <strong>DT80</strong> relay will be held closed for 500ms then released.<br />
Special Channel Types<br />
Reference<br />
A reference channel gets its value from another previously measured value. Thus if you add a reference channel you will be<br />
asked to select which existing channel you wish to reference.<br />
Other than that, a reference channel is configured in a similar way to any other measurement channel, i.e. the same five tabs<br />
of options are displayed.<br />
References are useful in alarms. You can define multiple alarm channels, all of which are testing a reference to a single<br />
measurement against different setpoints.<br />
Note Reference channels cannot be added to the On Logger Activation (immediate) schedule, and channels in the On<br />
Logger Activation schedule cannot themselves be referenced.<br />
UM-0085-B2 <strong>DT80</strong> <strong>Series</strong> User’s <strong>Manual</strong> Page 120
Calculation<br />
A calculation channel gets its value from an mathematical expression, which may include references to other measurement<br />
channels. The result of the calculation can be logged, have statistics applied to it, and so on – the same as any other<br />
measurement channel.<br />
The configuration builder provides an "expression builder" to make it easier to enter a valid expression. This will appear<br />
when you click inside the Calculation field.<br />
Figure 31: Defining a calculation<br />
The three boxes below the calculation entry field list the available maths functions, operators and previously defined<br />
channels that can be referenced. Clicking on any of the items in these boxes will insert it into the calculation entry field. You<br />
can also edit the calculation field manually.<br />
In the above example, the calculation channel is working out the mean of two separate thermocouple readings.<br />
Delay<br />
The Delay channel inserts a fixed delay between the execution of the channels immediately above and below it in the tree<br />
view.<br />
<strong>Manual</strong> Channel<br />
This channel type allows you to manually define one or more channels. It is useful for situations where the configuration<br />
builder does not directly support the <strong>DT80</strong> channel type you wish to use – for example the generic serial channel (SERIAL).<br />
Anything you type here will be copied verbatim to the generated <strong>DT80</strong> program – no syntax or consistency checking is<br />
performed by the configuration builder.<br />
One substitution that will be made, however, is that any occurrences of $name will be replaced by the actual name of the<br />
manual channel, as shown in its tree view entry.<br />
Global Settings<br />
Clicking on the top entry in the tree view will display the logger's global settings.<br />
CEMs<br />
If your logger has CEMs connected then the Number of CEMs field must be set correctly, otherwise you will not be able to<br />
enter select the channel number for any CEM-connected sensors.<br />
Note also that the configuration builder assumes that the CEMs' addresses are set sequentially starting at 1. That is, if you<br />
specify that two CEMs are connected then they must be set to addresses 1 and 2.<br />
Statistical Schedule<br />
The statistical schedule rate is a global logger setting. Any channels which are configured to report statistical values will be<br />
sampled at this rate, which should always be faster than the channel's schedule's trigger rate.<br />
Profile Settings<br />
When you start a new configuration, the displayed profile settings will be initialised by reading them from the logger. You may<br />
then change any of these settings by clicking on the appropriate item in the Value column, changing it then clicking<br />
anywhere else to save the changed value.<br />
Any non-default profile settings have the value highlighted in red.<br />
Regardless of whether you modify them or not, the displayed profile settings become part of the configuration and will be<br />
included as part of the logger program generated by the configuration builder.<br />
Note that changing certain profile settings (e.g. Ethernet IP address) may result in the configuration builder not being able to<br />
communicate with the <strong>DT80</strong>. A warning will be displayed in these cases.<br />
Managing Configurations<br />
The File menu is where you manage the logger configurations that you create with the configuration builder.<br />
Backing up Configurations<br />
You can save the configuration that you are working on to your computer using the Save to disc... option on the File menu.<br />
UM-0085-B2 <strong>DT80</strong> <strong>Series</strong> User’s <strong>Manual</strong> Page 121
By default, dEX configuration files have a .dex file extension.<br />
Likewise, you can open a saved configuration by selecting Open from disc...<br />
Activating a Configuration<br />
Once your configuration is complete, you can save it to the logger and it will then start running. The process is as follows.<br />
1. Select Save to logger on the File menu.<br />
2. The configuration builder will first check whether there is an existing job on the logger which has the same name as<br />
that used by the configuration builder (which is CONFIG), and which has existing logged data. If so, a warning will be<br />
displayed, indicating that any logged data for the existing job is about to be deleted. If you want to keep the data from<br />
the existing job then click Cancel, other wise click Continue and it will be deleted.<br />
3. The current logger configuration will then be reset so any currently running job will be stopped. If the logger is nearby<br />
you will hear the relays click as it performs the normal re-calibration that occurs whenever a soft reset is performed.<br />
4. The new configuration will now be upload onto the <strong>DT80</strong>. This may take 30 seconds or more.<br />
5. If all goes well the new configuration will start running immediately. If the <strong>DT80</strong> detects an error in the configuration<br />
then the error message generated by the <strong>DT80</strong> will be displayed – in this case the logger will now have no current job.<br />
6. Once the configuration has been activated successfully, you can click the Logger Home button and switch over the<br />
dEX web interface, which will allow you to monitor the data being collected by your new configuration.<br />
Note If there are any channels which do not have a wiring or reference source selected then you will be prompted to<br />
complete the definition of these channels before activating the configuration.<br />
dEX Web Interface<br />
Using the Web Interface<br />
The following screenshot shows the general web interface screen layout:<br />
Figure 32: Welcome Screen<br />
The <strong>DT80</strong> web interface comprises the following main elements:<br />
<br />
<br />
The large properties pane on the right hand side is used to display various "screens" of information. Its contents will<br />
change depending on which screen you select.<br />
The menus on the left hand side are used to select which screen to display. There are five menus: Status, Retrieve<br />
Data, Measurement, Command, and Help. Clicking on a menu button causes its list of menu items (screens) to be<br />
revealed, and the most recently selected screen will be displayed in the properties pane.<br />
In the above screenshot, the Status menu is selected. This menu has eight screens: Welcome, Schedules, Storage,<br />
UM-0085-B2 <strong>DT80</strong> <strong>Series</strong> User’s <strong>Manual</strong> Page 122
Diagnostics, Program, Parameters, Profiles and Switches. The Welcome screen is the one that is currently<br />
displayed. If you then clicked on Parameters, for example, then the Parameters screen would be displayed in the<br />
properties pane area.<br />
Clicking on the four small triangles at the far left will hide (or restore) the menu, to allow more space for the properties<br />
pane.<br />
Note By using the web interface configuration tool, it is possible to disable or restrict some of the menu options. The<br />
sample displays shown in Figure 32 and throughout this section assume that all options are available (which is the<br />
factory default).<br />
The purple strip above the properties pane contains the name of the selected menu (Logger Status in this case) and<br />
may contain controls (buttons etc.) which relate to the currently displayed screen. In this case there is one button:<br />
Update, which will cause the displayed information to be updated. At the right hand edge of this area is the circular<br />
activity indicator. This symbol will be animated while the web interface is actively communicating with the logger.<br />
The banner area along the top of the screen contains four controls: Firstly, the Logger home button provides a link<br />
back to the Logger Home page (Figure 22). Secondly, the dataTaker logo is a link to the Datataker website<br />
(www.datataker.com). Thirdly, there is a Full Screen link in the top right corner. This link will display the web interface<br />
so it covers the entire screen. All browser controls will be hidden, as will the Windows task bar and desktop. To exit<br />
this mode press Esc or click the Exit Full Screen link. Note that all keyboard input, other than the Esc key (and certain<br />
Windows keystrokes e.g. Alt-Tab), is disabled while in full screen mode. Finally, there is an About link, which displays<br />
the version number of the web interface.<br />
Note By using the web interface configuration tool, it is possible to customise the banner area to show different logos<br />
and web links.<br />
Along the bottom of the screen is the status bar. This displays the current time and date according to the PC's clock.<br />
Other status or error messages may also be displayed here.<br />
If the browser window is resized then all elements of the <strong>DT80</strong> web interface will resize appropriately. If the browser window<br />
is too small, however, then scroll bars will appear.<br />
Many of the controls and other screen elements in the <strong>DT80</strong> web interface include tool tips. If you move the cursor over the<br />
item and hold it there, a small yellow box will appear containing a brief description of the item.<br />
Status Screens<br />
The Status menu allows you to select one of eight different screens, each showing useful information about the current<br />
status of the <strong>DT80</strong>.<br />
Welcome Screen<br />
The Welcome screen, as shown in Figure 32, is the first screen displayed when the web interface is started. It includes the<br />
following basic information about the connected logger:<br />
name of the currently loaded job, if any<br />
current date and time, according to the <strong>DT80</strong>'s real-time clock. Press Update to update the display.<br />
the logger product type, including model number and series (e.g. <strong>DT80</strong>-2 for a <strong>DT80</strong> <strong>Series</strong> 2)<br />
the logger serial number<br />
the version number of the logger's firmware<br />
UM-0085-B2 <strong>DT80</strong> <strong>Series</strong> User’s <strong>Manual</strong> Page 123
Schedules Screen<br />
Figure 33: Schedules Screen<br />
The Schedules screen shows the status of each of the schedules in the current job.<br />
The schedules are presented in tabular form, one row per defined schedule. For each schedule the following information is<br />
displayed:<br />
<br />
schedule ID (e.g. A) and user-defined name, if any<br />
whether the schedule is running or halted (in the above example all six schedules are running)<br />
whether logging is enabled for the schedule (in this case logging is enabled for all schedules except schedule E)<br />
the number of logged data and alarm records. The bar graphs give an indication of the percentage of the allocated<br />
storefile space that contains data. For schedules operating in overwrite mode (which is the default), the bar graph is<br />
shown in blue. For schedules in non-overwrite mode (e.g. RA(DATA:5H:NOV)1S), the bargraph is shown in red if<br />
the storefile is greater than 80% full, otherwise green.<br />
the timestamp of the oldest logged record (data or alarm)<br />
the timestamp of the newest logged record (data or alarm)<br />
Press Update to update the displayed details.<br />
Click on a column heading to re-sort the table based on the data in that column. The small triangle shows which column is the<br />
current sort key.<br />
Note also the yellow tool tip in the above screen shot, which pops up if you move the mouse cursor over the bar graphs. This<br />
shows the storefile mode (overwrite/non-overwrite), the number of logged records and the size in records of the store.<br />
UM-0085-B2 <strong>DT80</strong> <strong>Series</strong> User’s <strong>Manual</strong> Page 124
Storage Screen<br />
Figure 34: Storage Screen, showing details for the internal file system (B:)<br />
The Storage screen provides an overview of the amount of space used and available on the <strong>DT80</strong>'s internal file system, or<br />
on a connected USB memory device.<br />
Select the drive to display (B: drive – internal, or A: drive – USB device) using the control at the top of the screen.<br />
The displayed pie chart contains up to four segments:<br />
Free (green) – this space is unused<br />
Current job (orange) – space used by current job, including program text storage, data and alarm files, and any saved<br />
archive files. Remember that the data and alarm storefiles are pre-allocated, fixed size files, so the same amount of<br />
space will be used regardless of the actual number of data points or alarms that have been logged (see How Data and<br />
Alarms are Stored (P84)). If there is no current job loaded then this segment will not be present.<br />
Other job(s) (dark blue) – space used by other jobs which have previously been defined but which are not currently<br />
active. If these jobs and their logged data are no longer required then this space can be recovered using the DELJOB<br />
command (see Deleting Jobs (P56)).<br />
Non job files (light blue) – this includes all other files stored on the drive, such as the web interface, user manual,<br />
event log, and so on.<br />
The actual space used (in bytes) for each segment can be displayed by holding the mouse cursor over the legend on the<br />
right hand side of the screen.<br />
For the USB drive (A:) only two segments are shown: Free and Used.<br />
Diagnostics Screen<br />
Figure 35: Diagnostics Screen, showing Self Test output<br />
The Diagnostics screen provides functions which may be helpful when diagnosing a problem with the <strong>DT80</strong>. You can:<br />
display the event log, which records events such as resets and power failures (Event Logs (P211))<br />
execute a self test, which verifies correct hardware operation (TEST Command (P210))<br />
UM-0085-B2 <strong>DT80</strong> <strong>Series</strong> User’s <strong>Manual</strong> Page 125
generate a full service report. This includes the above items, plus several other details regarding the state of the<br />
logger (SERVICEDATA Command (P212)). The report also contains details relating to the web client (i.e. your PC and<br />
browser).<br />
To perform the desired function, press the appropriate button. If this is the first time you have selected the function then it will<br />
be performed immediately and after a short pause the data will appear. If you have previously selected the function then the<br />
previously collected data will be displayed; press Update if desired to repeat the operation.<br />
Program Screen<br />
The Program screen simply displays a listing of the program text for the current job, similar to the SHOWPROG command.<br />
Parameters, Profiles and Switches Screens<br />
These three screens list the current settings for the three different groups of <strong>DT80</strong> configuration settings, namely:<br />
<br />
<br />
<br />
numbered parameters (e.g. P11, P15 etc.), each of which has a numeric value (P198)<br />
named profile settings, each of which has a string value (P202)<br />
switches (e.g. /H, /R etc.), each of which is either on or off (P201)<br />
Each screen has a similar format, showing the setting name, a brief description and the current value. For example the<br />
Profiles screen is shown below.<br />
Figure 36: Profiles Screen<br />
Items which have been changed from their factory default setting have their values highlighted in red. So in the above<br />
Profiles screenshot, the GATEWAY and IP_ADDRESS settings have been altered; the others are still on their default<br />
setting.<br />
If you place the mouse cursor over a non-default (red) value then a tool tip will pop up showing the default value.<br />
As with all other screens, pressing the Update button will update the displayed values.<br />
Data Retrieval<br />
Unloading Data Using the Web Interface<br />
The Retrieve Data screen allows you to transfer logged data and alarms from the <strong>DT80</strong> to your computer. There are two<br />
variants of this screen:<br />
The Basic screen will be shown by default. You can retrieve data and/or alarms for the current job: either all logged<br />
data, or a specified time range, or just the new data (that is, data logged since you last retrieved data)<br />
The Advanced screen (see Figure 37) is the same, except it also shows details relating to the number of logged<br />
data/alarm records for each schedule (similar to the Schedules screen (P124)). You can also select the schedules for<br />
which to retrieve data.<br />
This process is essentially the same as unloading the data, using the COPYD command (see Retrieving Logged Data<br />
(P88)), in that the logged data is read out of the logger's store files and saved in CSV or DBD form.<br />
CSV data is in form that can be loaded directly into a spreadsheet application such as Excel.<br />
DBD format is the logger's native binary format, which is generally quicker to transfer. DBD files can be opened by the<br />
dataTaker dump_dbd utility and certain data analysis packages.<br />
UM-0085-B2 <strong>DT80</strong> <strong>Series</strong> User’s <strong>Manual</strong> Page 126
Figure 37: Retrieve Data Screen (Advanced View)<br />
The general procedure for retrieving data is:<br />
1. Specify the data format and the extent of the data and/or alarms to be retrieved, using the various controls (described<br />
further below)<br />
2. Press Retrieve Now<br />
3. A "Save As" dialog will be displayed where you can enter a filename. The selected data will be saved to this file in CSV<br />
or DBD format.<br />
4. Locate the saved file and open it using a suitable application<br />
Specifying the Data Range<br />
Time Range<br />
The range of data to be retrieved is specified using the control at the top of the screen. The options are as follows:<br />
<br />
<br />
<br />
All (which is the default) will retrieve all available data/alarms. The displayed start and end times indicate the<br />
approximate time range that will be retrieved. Press Update to update these values.<br />
Range allows you to specify an explicit date/time range. Clicking on the start or end date fields will display a calendar<br />
control, as shown in Figure 38 below. Use the left and right arrow buttons to select the month, then click on the<br />
required day. The currently selected date is highlighted in blue, while today's date is shown in grey. Click outside the<br />
calendar control to dismiss it without changing the selected date.<br />
When using the Range option it is helpful to select the Advanced screen so you can see the time range for each<br />
schedule's logged data/alarms.<br />
New Data Only will retrieve all data logged since the last unload. As with the All option, the displayed start and end<br />
times indicate the approximate time range that will be retrieved. Press Update to update these values.<br />
Note For the New Data Only option, "unload" means a web interface data retrieval by any browser session. In other words,<br />
"since the last unload" does not necessarily mean "since your last unload". The New Data Only feature should therefore<br />
normally only be used where data is being collected by a single web user.<br />
Figure 38: Date Selection Control<br />
UM-0085-B2 <strong>DT80</strong> <strong>Series</strong> User’s <strong>Manual</strong> Page 127
Data or Alarms<br />
The two checkboxes below the range control should be self-explanatory – they select whether data, alarms or both will be<br />
retrieved. The default is to retrieve both data and alarms.<br />
Data Format<br />
Select DBD or CSV format. DBD will normally be faster to transfer, but CSV can be opened by more applications.<br />
Schedules<br />
If the Advanced screen is selected then a table showing the status of each schedule is shown in the lower part of the screen.<br />
This has the same format as the Schedules status screen, with the addition of a Get column containing a checkbox for each<br />
schedule.<br />
If a schedule's checkbox is ticked than data and/or alarms for that schedule will be retrieved; if it's not then it won't.<br />
Retrieving Data<br />
When you click on the Retrieve Now button, the web interface will first query the logger to obtain an estimate of the number<br />
of records that will be returned, given the selections you have made. If the <strong>DT80</strong> indicates that there is no data to retrieve<br />
than a message to that effect will be displayed and the unload will be cancelled.<br />
Next, the web interface will start the actual data download. At this point the "Save As" dialog will be displayed. Note that a<br />
default filename will be automatically generated, in the following format:<br />
serial_jobname_yyyymmddThhmmss.CSV (or .DBD)<br />
where serial is the <strong>DT80</strong>'s serial number, jobname is the name of the current job and the rest is the date and time at which<br />
the data retrieval was performed. A different name or location may be specified if desired.<br />
A progress dialog will now be displayed. The bar graph gives an approximate indication of the percentage completion.<br />
Once the process is complete, "Done" will be displayed; you can now open the file using your preferred application. A<br />
spreadsheet application (e.g. Excel) provides many analysis and charting capabilities.<br />
CSV Data Format<br />
Data and alarms are returned in standard Comma Separated Value (CSV) format.<br />
The file consists of a number of rows. Each row is terminated by a CR-LF sequence.<br />
Each row consists of a number of fields (columns), separated by commas. (Semi-colons (;) will be used if the <strong>DT80</strong> has<br />
been configured to use a comma as the decimal point character.)<br />
Each row consists of the following fields, in order:<br />
timestamp (e.g. 2007/12/15 20:49:45.905)<br />
timezone. Currently, this field will always have the value "n", meaning "no timezone"<br />
data values for first schedule (zero or more fields, one for each loggable channel). Numeric data values are specified<br />
in "mixed" format (may be either standard or exponential format), to 8 significant digits and trailing zeroes after the<br />
decimal point are trimmed. String values are enclosed in quotes, with any control characters represented in ^c form<br />
(e.g. a CR character would appear as ^M).<br />
alarm number, alarm state (0-3) and alarm text (see Alarm Records (P82)) for first schedule (three fields; only present<br />
if schedule has one or more loggable alarm channels)<br />
data values for second schedule (if any)<br />
alarm number, alarm state and alarm text for second schedule (if any)<br />
(and so on, for each schedule)<br />
The first row in the file is a header row, which contains a descriptive name for each field. For example, the name of a data<br />
value field has the form " chanName (units)", e.g. "Reactor4 (degC)"<br />
The first block of rows after the header row contain all data records for the first schedule. The next block of rows contain all<br />
alarm records for the first schedule. Then comes the data records for the second schedule, and so on.<br />
In other words, the CSV data is generated in schedule order, not in time order. However, once it is loaded into a spreadsheet<br />
it is a trivial exercise to re-sort by the timestamp field.<br />
UM-0085-B2 <strong>DT80</strong> <strong>Series</strong> User’s <strong>Manual</strong> Page 128
Displaying Real-Time Measurements<br />
The web interface provides two ways of viewing real-time measurements:<br />
all channels can be displayed in tabular form, one row for each defined channel<br />
up to 6 channels can be displayed using a variety of graphical mimic displays<br />
Channel List Screen<br />
Figure 39: Channel List Screen<br />
The Channel List screen lists all channels defined in the current job. For each channel, the following information is<br />
displayed:<br />
Run – if green then the channel's schedule is running<br />
Name – channel name<br />
Value – channel value as at the last update (press Update to immediately update all values)<br />
Units<br />
Alarm – If the channel is an alarm channel (i.e. the channel is the quantity being tested in an ALARM or IF command)<br />
then this column indicates the state of the alarm – active (ringing bell) or inactive (quiet bell). If the channel is not an<br />
alarm channel then this column is blank.<br />
Timestamp – the time at which the indicated value was recorded<br />
Log – if green then logging has been enabled for the channel, and its enclosing schedule.<br />
Input – the channel's default (standard) name<br />
Schedule – the name of the schedule containing this channel<br />
By default, working channels are not displayed in the channel list. (A working channel is one with the W channel option<br />
specified, which means that it is not displayed, returned or logged.) However, if you tick the Show Hidden Channels<br />
checkbox then all channels will be displayed.<br />
As with most other screens, the displayed information can be immediately updated by pressing Update. It can also be set to<br />
automatically update, by selecting Auto in the upper right of the screen. You can then specify the number of seconds<br />
between updates.<br />
Note that automatic updates will only continue while the Channel List screen is displayed. If you select a different screen then<br />
the web interface will stop requesting updates from the logger.<br />
UM-0085-B2 <strong>DT80</strong> <strong>Series</strong> User’s <strong>Manual</strong> Page 129
Mimics Screen<br />
Figure 40: Typical Mimic screen<br />
The Mimics screen can be used to present selected channel values in a way that resembles traditional control panel<br />
indicators.<br />
Up to five separate mimic screens can be defined, using the web interface configuration tool (see Customising the Web<br />
Interface (P137)).<br />
Each mimic screen provides space for between one and sixteen mimic displays, arranged in a grid layout, as shown in the<br />
screenshot. Initially, all display positions will be blank, with a single Add mimic... button in each display position. The<br />
general procedure for setting up a mimic screen is as follows:<br />
1. First ensure that the required job is loaded and is working as required.<br />
2. Create a mimic by clicking on the Add mimic... button in the desired display position. You will then fill in various details<br />
specifying the type of mimic (bar graph, meter, etc.), the channel, and various other options.<br />
3. Repeat the above to define more mimics. If required, existing mimics can be changed using the Configure control. It<br />
is not necessary to define mimics for all six positions.<br />
4. When you are happy that all mimics are working as required, press Save Mimics. This will save your mimic<br />
configuration to a file on the logger. The next time you connect to that logger (using any PC), your mimic setup will be<br />
automatically retrieved and displayed.<br />
Types of Mimics<br />
Eight different types of mimics are available:<br />
Dial Meter – a pointer which moves across a graduated scale<br />
Bar Graph – a variable height vertical bar with a graduated scale<br />
Thermometer – a bar graph in the shape of a bulb thermometer<br />
Compass – a circular compass display for indicating a bearing in degrees<br />
Digital Panel – a numeric display, similar to a digital panel meter<br />
LED – simulates a single or bi-colour LED<br />
State Indicator – indicates one of two states using two LEDs<br />
History List – displays a numeric value, along with previous samples<br />
Chart – displays a trend chart for one or more channels<br />
On each mimic page you can present 1-16 channels using any combination of these mimic types.<br />
Creating a Mimic<br />
To create a mimic, choose one of the six display positions and click the Add Mimic... button. If you want to replace an<br />
existing mimic, then you will first need to delete the old one by clicking on the X button in the top right of the mimic's display<br />
position.<br />
When you click on Add Mimic..., a dialog box will be displayed (Figure 41) where you can specify<br />
the type of mimic<br />
the channel whose value you want to display<br />
Once these have been set, press OK to create the mimic.<br />
UM-0085-B2 <strong>DT80</strong> <strong>Series</strong> User’s <strong>Manual</strong> Page 130
Figure 41: Mimic creation dialog<br />
Configuring the Mimic<br />
Once a mimic has been created, it will be displayed in the selected position and will begin automatically updating at the<br />
default rate, or the rate you set on the mimic creation dialog.<br />
You can now change various aspects of the mimic by clicking on the mimic's Configure link in the lower left corner. This will<br />
bring up a configuration dialog box. The contents of this dialog will vary according to the mimic type. A typical mimic<br />
configuration dialog (for the Dial Meter type) is shown in Figure 42.<br />
Figure 42: Configuration dialog for Dial Meter mimics<br />
UM-0085-B2 <strong>DT80</strong> <strong>Series</strong> User’s <strong>Manual</strong> Page 131
For a given mimic type, the configuration settings may include:<br />
<br />
<br />
<br />
<br />
<br />
<br />
<br />
<br />
<br />
<br />
<br />
<br />
Variable to display – specifies the channel to display<br />
Custom variable label – the name of the channel (as set on the logger) can be overridden here<br />
Update Rate – specifies how often the mimic will request an updated channel value from the logger<br />
Units – this text string will be displayed in the lower right corner. Typically this would be set to Logger's to display the<br />
channel's units string as specified in the logger program.<br />
Minimum, Maximum, Label Steps – defines step size and extent of graduated scale for those mimic types that have<br />
one (Bar Graph, Thermometer and Dial Meter)<br />
Upper threshold, Range colour, Lower Threshold – divides the range of the mimic into three bands; a separate<br />
scale or indicator colour can be specified for each band.<br />
Decimal Places – number of digits after the decimal point in channel value when displayed numerically<br />
Show Measured Value – for mimic types which do not display the numeric channel value as part of their main<br />
graphic, this option allows you to include a small numeric channel value display.<br />
Threshold – for bi-state mimic types (State Indicator and LED), the mimic will be displayed in the "active" state if the<br />
channel value exceeds this threshold value<br />
Colour – for some mimic types, the colour of the main graphic element can be adjusted. For bi-state mimics, both the<br />
"active" and "inactive" colours can be specified.<br />
Size – for some mimic types, the size of the main graphic element can be adjusted (LED radius, bar graph width, panel<br />
meter font size, etc.)<br />
State Labels – for State Indicator mimics, you can customise the text displayed next to each LED.<br />
Once all required mimics have been created and configured, press Save Mimics (top right), which will save your mimic<br />
setup to a file on the logger.<br />
Note that only one mimic configuration can be stored on the logger. When you press Save Mimics, any previously stored<br />
mimic configuration will be overwritten.<br />
Saved mimics will be automatically reloaded whenever you connect to the logger using the web interface and display the<br />
Mimics screen.<br />
Chart Mimics<br />
About Charts<br />
The trend chart mimic is the most sophisticated of the mimic types. It can retrieve historical data from the <strong>DT80</strong> and plot one<br />
or more channels on a "chart recorder" type display.<br />
Figure 43: Typical chart mimic<br />
Up to 5 different channels can be plotted on each chart mimic, and up to two Y axes can be defined.<br />
The above screenshot shows a typical chart mimic shortly after the job was started. The chart has been configured to show<br />
the last 20 minutes worth of data, and the job has been running for about 12 minutes. The blue trace (temperature) uses the<br />
left hand axis, while the red trace (sine wave) uses the right hand axis.<br />
The Y axis range can either be set manually (as is the case here) or automatically.<br />
Moving the cursor over a trace will display details of an individual sample point, as shown in the screenshot, while moving the<br />
cursor over the green area on the left will display a legend showing the channel name for each trace colour.<br />
Each trace stores and displays up to 1000 data points, which may be fewer than the actual number of data points logged<br />
over the displayed time interval. If this is the case then the trend chart will actually show a sample of the actual logged data.<br />
Be aware that this sampling of the data may cause narrow peaks in the data to be missed, and not displayed.<br />
Defining a Chart<br />
Defining a chart is similar to defining any other mimic. Click the Add a mimic... button on any unused mimic space, which will<br />
bring up the mimic creation dialog (Figure 41). Select Chart as the mimic type and press Create mimic.<br />
After creating the mimic, click the chart mimic's Configure button to bring up the chart configuration dialog.<br />
UM-0085-B2 <strong>DT80</strong> <strong>Series</strong> User’s <strong>Manual</strong> Page 132
Figure 44: Chart configuration dialog<br />
The dialog has three main parts:<br />
In the top part, select the schedule from which this chart's channels will come (all channels plotted on the one chart<br />
must be part of the same schedule). Also specify the reload interval - the web interface will request new data from the<br />
<strong>DT80</strong> at this rate.<br />
The centre part of the dialog lists the traces that will be plotted. Use the + and – buttons to add or remove traces from<br />
this list. Remember that only channels from the selected schedule will be available to add.<br />
Details for the selected trace are displayed on the right hand side, including the source channel, a label (defaults to the<br />
channel name), trace colour and the Y axis (1 or 2) against which it will be plotted.<br />
The lower part of the dialog has a tab for the time axis and the two Y axes. For the Y axes you can specify manual or<br />
automatic scaling and the axis label.<br />
Press Commit changes to apply the indicated settings.<br />
Don't forget to press Save mimics (top right of the screen) to save all mimics to the logger – otherwise they will be lost when<br />
you close or reload the browser window.<br />
Remapping Mimics<br />
If you make a change to a configuration that already has mimics defined then dEX will attempt to re-map the mimics to the<br />
new configuration, according to the following rules:<br />
If there is a channel in the new configuration that has the same name as the mimic's configured channel then the<br />
mimic will be automatically remapped to that channel.<br />
Otherwise, a window will pop up giving you the option to either (a) delete the mimic, or (b) manually remap it to one of<br />
the channels in the new configuration.<br />
For example, suppose you have defined a configuration with two channels: "1CV" and "Temp", and have then defined three<br />
mimics: a panel meter showing 1CV, a thermometer showing Temp and a chart showing both.<br />
If you now change the configuration so that "Temp" is renamed to "KilnTemp", then a dialog box similar to the following will<br />
be displayed:<br />
UM-0085-B2 <strong>DT80</strong> <strong>Series</strong> User’s <strong>Manual</strong> Page 133
Figure 45: Mimic remapping dialog<br />
This window lists all defined mimics and chart traces. If a channel with matching name was found in the new configuration<br />
(as is the case for the 1CV panel meter and chart trace) then the mimic is displayed in green and the mimic is automatically<br />
remapped to the matching channel.<br />
If there is no channel with the same name in the new configuration then the mimic will be displayed in red.<br />
For each mimic or trace, select whether you want to delete the mimic or remap it to one of the new configuration's channels<br />
("1CV" or "KilnTemp"). If you choose to remap a mimic to a new source channel (as is the case for the thermometer mimic)<br />
then the mimic is displayed in purple.<br />
Once this has been done for all mimics in the list, press Update mimics.<br />
By default, the updated mimics will be automatically saved to the logger. If you don't want this to happen (e.g. the change you<br />
made to the configuration was a temporary test only) then clear the (Also update the saved mimics) checkbox.<br />
Note If matching channels can be found for all defined mimics then the mimic remapping dialog will not be displayed.<br />
UM-0085-B2 <strong>DT80</strong> <strong>Series</strong> User’s <strong>Manual</strong> Page 134
Command Window<br />
Figure 46: Command Window<br />
The Command Window screen provides access to the <strong>DT80</strong>'s command interface. This allows you to send commands to<br />
the <strong>DT80</strong> and see its responses, much as you would using DeTransfer. In the above screenshot, the command window has<br />
been used to send the DIR"B:" command (seen in the lower Send pane) and the logger's response has been captured in<br />
the upper Receive pane.<br />
Enabling the Command Window<br />
When the Command Window is first selected, it will be disabled, and it will not be possible to type anything in the Send<br />
pane. To enable the command interface, you need to first select the mode: Normal mode (default) or Snoop mode (tick the<br />
checkbox), then press Enable.<br />
In Normal mode, the web interface will automatically send the sequence /h/E/M/R when you press the Enable button.<br />
This makes the command interface easier to use by ensuring that fixed format mode is switched off (/h), and that command<br />
echo, messages and data return are switched on. When you subsequently press Disable or select a different screen, the<br />
web interface will send /e/m/r.<br />
In Snoop mode, nothing is sent when you enable or disable the interface. This allows you to "snoop" a logger to see what it<br />
is outputting, without affecting its state.<br />
The box to the right of the Snoop Mode checkbox indicates the IP address and TCP port number to which the command<br />
window is "connected". These are not editable.<br />
The three purple buttons above the Receive pane allow you to change the relative sizes of the Send and Receive panes.<br />
Note If you switch to a different web interface screen then the command window will be automatically disabled. If you then<br />
return to the Command Window screen, it will be automatically re-enabled in the same mode (Normal or Snoop). The<br />
contents of the Send and Receive panes will have been preserved. (They will, however, be cleared if you reload the web<br />
interface, e.g. by pressing the browser's Refresh/Reload button.)<br />
Sending Commands<br />
Once the command window has been enabled, you will be able to type standard <strong>DT80</strong> commands into the lower Send pane.<br />
Controls will be familiar to DeTransfer users:<br />
Entered text is not sent to the logger until you press Enter or click one of the "Send" buttons<br />
Press Enter to send to the logger all text on the line on which the cursor is positioned.<br />
Click Send All to send all text in the Send pane to the logger<br />
Click Send Selection to send all text in the Send pane that you have highlighted.<br />
Press Shift-Enter to insert a line break. Nothing will be sent to the logger. This is useful for entering a sequence of<br />
commands or a multi-line job which you will later send all in one hit.<br />
The Windows copy and paste mechanism may be used to paste text into the Send pane.<br />
UM-0085-B2 <strong>DT80</strong> <strong>Series</strong> User’s <strong>Manual</strong> Page 135
Click Clear to erase all text from the Send pane.<br />
Note to DeTransfer users: The web interface command window does not interpret any "backslash" sequences. This means<br />
that to send a "\" character to the logger you enter "\", not "\\".<br />
Viewing Logger Output<br />
Once the command window has been enabled, all output from the logger's command interface will be displayed in the top<br />
Receive pane.<br />
The Receive pane has a 32 kbyte memory buffer for storing received text. As text is received, it is added to the buffer. Once<br />
the buffer becomes full, the oldest data is discarded.<br />
The Receive pane normally displays the newest received data, but you can review data which has scrolled out of the display<br />
are by using the scroll bars. However, if data is being returned quickly then this will be awkward because the Receive pane<br />
will keep jumping back to display the newest data.<br />
The Pause button is useful here – it temporarily stops screen display updates so you can scroll back through the receive<br />
buffer. Note that incoming data will still be captured while the screen is paused. When you un-pause the display (by clicking<br />
on the Pause button a second time) all captured text will be added to the receive buffer and displayed.<br />
Other Features<br />
Special Characters<br />
The Special Character Mode control specifies how incoming control and non-printable characters are handled. When this<br />
control is set to Off, all characters are written to the receive buffer "as is". When set to one of the other values, any incoming<br />
characters with ASCII codes in the range 0-31 or 127-255 will be replaced by a text string identifying the character. For<br />
example, if Decimal is selected then an incoming ESC character (ASCII 27) will be replaced with the string [27].<br />
To send a special character, enter the special sequence _char(n), where n is the required ASCII code (1-255) in the Send<br />
window at the point you want the special character to be inserted. For example:<br />
1$="abc_char(88)def"<br />
will result in 1$ being set to abcXdef (character "X" has ASCII code 88)<br />
Delays<br />
It is sometimes useful to insert a delay between commands. This can be done using the special sequence _wait(n),<br />
where n is the number of seconds to wait. This command must be specified on a line by itself. For example, if you enter the<br />
following in the Send pane:<br />
SINGLEPUSH<br />
_wait(5)<br />
DIR<br />
and press Send All, then the web interface will send SINGLEPUSH, pause for 5 seconds, then send DIR.<br />
Macros<br />
If the mouse cursor is moved over the status line area at the bottom of the screen then a set of six macro buttons will appear,<br />
labelled, by default, Macro 1 through Macro 6. These buttons allow you to save commonly used command sequences and<br />
then send them with a single click.<br />
To define a macro button, hold down the Ctrl key and click one of the buttons. A window will pop up, allowing you to set:<br />
the label for the button<br />
the commands to send (_char and _wait sequences may be included)<br />
other options, such as whether you want to be prompted before the command is sent<br />
Pressing Save will save the macro definitions to a file on the logger, from which they will be automatically retrieved when you<br />
next connect to that logger.<br />
Help<br />
These screens provide:<br />
some general tips on using the web interface<br />
links to documentation files (user manual, release notes, etc.) stored on the logger.<br />
links to video tutorials stored on the logger.<br />
links to useful resources on the Datataker web site (www.datataker.com)<br />
information on how to report a problem or get help<br />
The video tutorials give an introduction to the enhanced web interface. These files may have been pre-installed on your<br />
<strong>DT80</strong> but are not normally included in firmware upgrade packages. Note that the files take up a significant fraction of the<br />
available internal storage space. If they are no longer required then they can be deleted using the DELVIDEOS command.<br />
UM-0085-B2 <strong>DT80</strong> <strong>Series</strong> User’s <strong>Manual</strong> Page 136
Customising the Web Interface<br />
Overview<br />
Several aspects of the enhanced web interface can be customised to suit site requirements:<br />
<br />
<br />
<br />
<br />
<br />
Selected menu items can be disabled to help prevent unauthorised or accidental changes to the logger configuration.<br />
For example, access to the Command window can be removed.<br />
Up to 5 mimic screens can be defined, each with up to 16 mimics.<br />
Help pages can be customised to provide site specific information, OEM details, etc.<br />
The default dataTaker "branding" of the interface can be replaced. For example, if you are an integrator or OEM you<br />
could place your company logo and web links into the banner area of the web interface.<br />
Users can be prevented from adding or editing mimics.<br />
The Web Interface Configuration Tool<br />
To run the Web Interface Configuration Tool, select Customise dEX on the Logger home page (Figure 22). This will display<br />
a pop-up window, similar to that shown below.<br />
Figure 47: Web interface configuration tool<br />
The configuration tool is laid out in a similar way to the web interface itself. There is a menu of options down the left hand side<br />
which allow you to switch between different categories of settings. The pane on the right displays settings related to the<br />
selected category.<br />
The Save settings button at the lower right will save all settings to the logger. This only needs to be done once; it is not<br />
necessary to save the settings for each category separately. After pressing the Save button, you should see a confirmation<br />
message pop up after a few seconds.<br />
The X symbol at the top right will close the configuration tool and return to the Logger home page. Any changes made since<br />
you last pressed Save settings will be discarded.<br />
Finally, the Restore defaults button at bottom left will reset all settings to factory defaults, and save them to the logger. See<br />
also Restoring Factory Settings (P140).<br />
UM-0085-B2 <strong>DT80</strong> <strong>Series</strong> User’s <strong>Manual</strong> Page 137
Status menu<br />
The settings in this category allow items in the web interface's Status menu to be selectively disabled.<br />
For example, if you wish to prevent the current <strong>DT80</strong> program being viewed via the web interface then you should uncheck<br />
the Include 'Diagnostics' menu and Include 'Program' menu options (as well as the Command menu; see below)<br />
Retrieve menu<br />
These settings allow Retrieve menu items to be disabled.<br />
Unchecking the two options ('basic retrieve' and 'advanced retrieve') in this category will prevent users downloading data<br />
from the <strong>DT80</strong> to their computer.<br />
Measurement menu<br />
The settings on the Measurement menu page allow you to:<br />
create or delete mimic pages.<br />
disable the List all channels menu item in the web interface (which displays channels and values in tabular form)<br />
Figure 48: Customising mimic pages<br />
By default, the web interface provides a single mimic page, which has space for up to 6 mimics arranged as 2 rows x 3<br />
columns, as depicted in Figure 40.<br />
Up to 5 mimic pages can be defined, and each can have its own arrangement of mimics, from one single mimic up to a 4x4<br />
grid of mimics.<br />
The Custom mimic page area of this screen lists the names of the currently defined mimic pages – these names will appear<br />
in the web interface Measurement menu. In the example shown in Figure 48, two mimic pages have been defined, one<br />
called Indoor and one called Outdoor.<br />
To add a mimic page, click the + button, or to edit an existing page click on the page's name, then click Edit. A dialog box will<br />
be displayed allowing you to set the page's name, description (which the web interface will display in the title area directly<br />
above the mimics), and layout (number of rows and columns).<br />
To delete a page, click on its name and press –. To change the order in which they will be displayed, click on the page's<br />
name, then click Up or Down.<br />
Command menu<br />
This page simply allows you to disable the web interface's command window.<br />
UM-0085-B2 <strong>DT80</strong> <strong>Series</strong> User’s <strong>Manual</strong> Page 138
Help menu<br />
This page is similar to the Measurement menu settings page, in that it allows you to:<br />
<br />
<br />
disable some or all of the standard help pages (that is, disable some or all of the items on the web interface's Help<br />
menu)<br />
create custom help pages, which will be accessible under the web interface's Help menu.<br />
Custom help pages are text files which you will need to create using a text editor. As well as plain text, these files may also<br />
contain certain HTML tags, which allows for some basic formatting (bold, italic, bullet points etc.) as well as web links, as<br />
depicted in the somewhat contrived example below.<br />
Figure 49: Sample custom help page<br />
If you wish to create a help file with HTML formatting, the easiest way to get started is probably to download the file<br />
b:\www\flash\customHelp\customHelpExample.html (which generates the sample help page shown in<br />
Figure 49) from the <strong>DT80</strong> to your PC and use it as a starting point. This can be done by entering the following URL into a web<br />
browser:<br />
ftp://ip-address/www/flash/customHelp<br />
then right clicking on the file customHelpExample.html in the displayed file list and selecting Save Link as... or Save<br />
Target as...<br />
Once you have created and saved a help file on your PC, you can add it using the Help menu page in the web interface<br />
configuration tool. As with the Measurement menu page, click + to add a help page, enter a name and description, then<br />
click on the Source field and select Load help page from computer. You can then navigate to the required file, and it will<br />
be automatically uploaded to the <strong>DT80</strong>.<br />
If you need to edit an existing help page, first make the changes to the copy on your computer, then select the help page from<br />
the list and press Edit. As before, select Load help page from computer and navigate to the (updated) file, which will then<br />
be uploaded to the logger, thereby replacing the old version.<br />
Note If you upload a new version of an existing help page, as described above, it is necessary to clear the browser cache<br />
before running the web interface. This will force the browser to load the new page rather than its older cached copy. (In<br />
Internet Explorer, clear the cache by selecting "Delete Browsing History..." then select "Temporary Internet Files".)<br />
Branding<br />
The Branding category allows you to customise certain visual elements on the web interface. Currently, this is limited to the<br />
colour used for the thin border around the interface, and in the thick band above the main properties pane (by default, purple)<br />
UM-0085-B2 <strong>DT80</strong> <strong>Series</strong> User’s <strong>Manual</strong> Page 139
Security<br />
The Security settings allow you to:<br />
<br />
<br />
disable all changes to defined mimics. This means that the Add a mimic buttons, as well as existing mimics'<br />
Configure and Close (X) controls (see Figure 40) will no longer be present.<br />
disable full screen mode, which will remove the Full screen link at the top right of the screen.<br />
Preventing Configuration Changes<br />
Once the web interface has been fully configured, you can set up the <strong>DT80</strong> so that the Logger home screen is bypassed,<br />
which effectively prevents users from running the configuration tool. To do this you can change the web server "document<br />
root" to point directly to the enhanced user interface, as follows:<br />
PROFILE HTTP_SERVER DOC_ROOT=B:\\WWW\\FLASH\\<br />
(If entered using DeTransfer, use \\\\ rather than \\.)<br />
This means that when a user enters http://ip-address into their browser, they will jump straight to the enhanced web<br />
interface, thereby bypassing the Logger home page. Note that this will also prevent users from running the classic web<br />
interface.<br />
Restoring Factory Settings<br />
The configuration tool's Restore defaults button will restore the enhanced web interface to the default look and<br />
functionality. However it will not delete any images or custom help pages that you may have uploaded to the <strong>DT80</strong>. If<br />
required, these can be manually deleted from the B:\WWW\flash\images and B:\WWW\flash\customHelp<br />
folders using the DEL command (see File Commands (P104)).<br />
UM-0085-B2 <strong>DT80</strong> <strong>Series</strong> User’s <strong>Manual</strong> Page 140
Classic Web Interface<br />
The <strong>DT80</strong> classic web interface is standards compliant which helps to make the interface accessible from a wide variety of<br />
web browsers. It has also been designed to be usable even on small-screen devices such as PDAs and mobile phones.<br />
For advanced users, the web interface can also be customised by developing new web pages and loading them onto the<br />
<strong>DT80</strong>'s internal file system.<br />
Browser Requirements<br />
The web interface uses a minimum of browser functions to provide its interface. The browser must however support XHTML<br />
1.0, CSS 1 and JavaScript to fully support the <strong>DT80</strong>'s web interface.<br />
The following browsers have been used and found to be compatible<br />
Microsoft Internet Explorer Version 6 or later<br />
Mozilla Firefox<br />
Google Chrome<br />
Pocket Internet Explorer (on Windows Mobile 5 and Windows Mobile 2003)<br />
Opera 8.x or later, Opera Mobile and Opera Mini<br />
Apple Safari<br />
Mobile Explorer<br />
Palm Web Browser 2.x (Palm Garnet OS)<br />
Sony PlayStation Portable Web browser<br />
Navigating the Web Interface<br />
The built-in web interface consists of the five pages – Home, Details, Status, Admin and Help. The design of the web<br />
interface follows a tab based metaphor where each tab represents a HTML page.<br />
Figure 50: Navigation tabs<br />
To navigate the web interface, simply click on the desired tab heading. The Home page is displayed by default when the web<br />
interface is first loaded.<br />
Home Page<br />
The Home page displays the data logger’s model, firmware version, serial number, the current job name and the current<br />
date and time.<br />
Figure 51: Home page<br />
The page does not provide any functionality other than the display of data logger general information.<br />
UM-0085-B2 <strong>DT80</strong> <strong>Series</strong> User’s <strong>Manual</strong> Page 141
Channels Page<br />
The Channels page displays a table listing all channel entries defined for the current job. This table shows the most recent<br />
measurement for each channel, along with the time that the measurement was taken.<br />
Note that any channels defined as working channels (W channel option) will not be included.<br />
Figure 52: Channels Page<br />
The Channels page is updated every 30 seconds. The time at which the table was last updated is displayed on the top-right<br />
corner of the channel listings table.<br />
Status Page<br />
The Status page displays status information for each defined schedule in the current job. The following information is<br />
displayed for each schedule:<br />
<br />
<br />
<br />
<br />
<br />
<br />
<br />
Schedule Name<br />
Schedule Trigger<br />
Schedule Status – whether it is active or halted.<br />
Schedule Logging State – enabled or disabled<br />
The number of data records / alarms logged<br />
The capacity of the schedule's store file<br />
The timestamp for the first and last data / alarm records stored<br />
Figure 53: Status Page<br />
All schedules configured for the current job will be displayed when this page is loaded.<br />
The schedule navigation links at the top of the page ( A – X ) allow you to jump directly to a particular schedule.<br />
Finally, the Top link displayed below each schedule's data provides a quick way to scroll back to the top of the page.<br />
UM-0085-B2 <strong>DT80</strong> <strong>Series</strong> User’s <strong>Manual</strong> Page 142
Files Page<br />
The Files page provides the ability to view files stored on the <strong>DT80</strong>'s file system. Direct links are provided for the system<br />
event and error logs (see Event Logs (P211)), and the remainder of the file system can be browsed using FTP.<br />
Figure 54: Files Page<br />
To view a log file, simply click on the desired log file link. The log file will then be displayed. Click on the Back link to return<br />
to the Files page.<br />
Figure 55: Event Log Page<br />
To access files stored on the <strong>DT80</strong>'s internal file system, or in a connected USB memory device, click on the desired FTP<br />
link. This will then display the directory listing of the drive. Clicking on a file link will then initiate an FTP download of the<br />
selected file.<br />
Using these links is equivalent to typing an ftp:// URL into the browser as described in Using the <strong>DT80</strong> FTP Server<br />
(P186). Note however that the web interface links provide read-only (anonymous) access only.<br />
Click on the web browser’s Back button to navigate back to the Files page.<br />
Help Page<br />
The Help page provides troubleshooting and help information, and a link to the Technical Support web page on the<br />
Datataker website.<br />
There is also a link to the <strong>DT80</strong> <strong>User's</strong> <strong>Manual</strong> (PDF format), which is normally pre-loaded onto the <strong>DT80</strong>'s internal file<br />
system in the B:\doc subdirectory. If the link does not work, verify that the directory and file are present. If required, the<br />
manual can be loaded back onto the logger by repeating the firmware upgrade process.<br />
UM-0085-B2 <strong>DT80</strong> <strong>Series</strong> User’s <strong>Manual</strong> Page 143
Customising the Classic Interface<br />
This section describes some of the technical features of the <strong>DT80</strong> web interface. These allow advanced users to replace the<br />
built-in web interface with a customised web user interface.<br />
Web Application Programming Interface (API)<br />
The <strong>DT80</strong> provides an application programming interface (API) so that you can build custom web pages that can view and<br />
display data from the logger. The API consists of a set of server-side include (SSI) directives. SSI directives are placed in<br />
HTML pages, and evaluated on the logger when the HTML page is requested. HTML pages that contain SSI directives are<br />
known as SHTML pages, and typically have a .shtml file extension.<br />
When an SHTML page is requested, it is scanned by the web server (logger) for these directives. Once found, the logger<br />
interprets the directive and performs the required action. The output is then sent as part of the response back to the web<br />
browser.<br />
Server-Side Include (SSI) Directives<br />
An SSI directive consists of a special sequence of characters which is placed within an HTML page. The format is as<br />
follows:<br />
where:<br />
<br />
<br />
<br />
<br />
are the opening and closing identifiers that must be specified when applying an SSI directive.<br />
directive is the name of the directive to be executed.<br />
attribute is the name of an attribute, and value is the value it is set to. Each SSI directive has a set of valid attributes<br />
that can be specified to control the operation of the directive. One or more attribute-value pairs can be specified.<br />
For example<br />
<br />
inserts the SSI directive named echo, which contains one attribute var whose value is set to 1CV.<br />
<strong>DT80</strong> SSI Directives<br />
The <strong>DT80</strong> web server supports five SSI directives, which are summarised in the table below. Each directive requires the<br />
indicated attribute to be set. In addition, one or more optional attributes may be included.<br />
Directive<br />
Required Attribute Function<br />
echo var Inserts the current value of the indicated variable<br />
channeltable schedule Inserts an HTML table containing, for each channel, its schedule, name,<br />
most recent value, units and timestamp – similar to the Channels page<br />
measure channel Samples the indicated channel (certain channel types only) and inserts the<br />
measured value<br />
reading channel Inserts the most recent value of the indicated channel, plus timestamp<br />
include file<br />
or<br />
Inserts the contents of the indicated text file, specified as a path relative to<br />
the document root (DOC_ROOT profile setting<br />
virtual Inserts the contents of the indicated text file, specified as an absolute path<br />
Optional Attributes<br />
One optional attribute is supported, which may be applied to any of the above directives in addition to their standard attribute:<br />
Directive Attribute Function<br />
any cond Evaluate the directive if and only if the indicated condition is true<br />
The following sections discuss each directive in more detail.<br />
#echo Directive<br />
This directive inserts a specific piece of information into the HTML page.<br />
SSI Directive<br />
Description<br />
<br />
Inserts the current date.<br />
e.g. 2006/05/02.<br />
<br />
Inserts the current time.<br />
e.g. 11:45:23.<br />
Inserts the model number of the logger.<br />
e.g. <strong>DT80</strong>.<br />
UM-0085-B2 <strong>DT80</strong> <strong>Series</strong> User’s <strong>Manual</strong> Page 144
Inserts the value of channel variable nCV. The (FFd) part is optional,<br />
and specifies the number of decimal places to display (default is one<br />
decimal place)<br />
e.g. 23.4.<br />
Inserts the value of system variable nSV. The (FFd) part is optional,<br />
and specifies the number of decimal places to display (default is no<br />
decimal places)<br />
e.g. 23200<br />
Inserts the name of the current running job (or no current job if<br />
none).<br />
e.g. MYJOB.<br />
Inserts the schedule name associated with schedule s.<br />
e.g. SchWebA.<br />
Inserts the trigger string for schedule s.<br />
e.g. 1S.<br />
Inserts the run status (active/halted) for schedule s.<br />
e.g. active.<br />
Inserts the logging state (enabled/disabled) for schedule s.<br />
e.g. disabled.<br />
<br />
e.g. 2001.<br />
<br />
e.g. 2301.<br />
<br />
e.g. 2006/05/02 14:15:12.<br />
<br />
e.g. 2006/05/02 15:15:12.<br />
<br />
e.g. 2006/05/02 11:15:12.<br />
<br />
Inserts the timestamp of the latest alarm for schedule s.<br />
e.g. 2006/05/02 14:13:12.<br />
#channeltable Directive<br />
This directive inserts a table of channel values.<br />
SSI Directive<br />
Description<br />
Inserts an HTML table containing a header row, plus a row for each<br />
defined channel in the current job, excluding working channels and<br />
immediate channels.<br />
Each row contains the following columns:<br />
schedule identifier (A – K, X)<br />
<br />
<br />
<br />
<br />
channel name<br />
most recent value of the channel<br />
units string<br />
time at which most recent measurement was taken<br />
As above, but only channels belonging to schedule s are included.<br />
Sample HTML output generated by the #channeltable directive is as follows:<br />
<br />
<br />
<br />
<br />
<br />
<br />
<br />
<br />
<br />
<br />
Schedule<br />
UM-0085-B2 <strong>DT80</strong> <strong>Series</strong> User’s <strong>Manual</strong> Page 145
Name<br />
Value<br />
Units<br />
Timestamp<br />
<br />
<br />
<br />
<br />
A<br />
1V<br />
1.234<br />
mV<br />
2006/04/07 12:12:11<br />
<br />
<br />
A<br />
Geyser Temp<br />
122.8<br />
degC<br />
2006/04/07 12:12:11<br />
<br />
<br />
C<br />
Gravy Press<br />
69.9<br />
MPa<br />
2006/04/05 12:42:01<br />
<br />
<br />
<br />
Note that the CSS (Cascading Style Sheet) class ids in the table and colgroup tags have been used to style the table. To<br />
change the style (colours, spacing, etc.), create another CSS file, reusing the same class ids. By default, the table will be<br />
displayed without any styles applied.<br />
#measure Directive<br />
This directive is used to perform a input channel measurement. This is executed in the Immediate schedule and the data<br />
gathered is not logged.<br />
SSI Directive<br />
Description<br />
Evaluates the specified <strong>DT80</strong> channel definition, e.g. 2R(4W), as an<br />
immediate channel, waits for it to complete, then inserts the<br />
measured value<br />
e.g.: 44.0<br />
#reading Directive<br />
This directive is used to return the most recent reading for the specified channel. The channel is assumed to have been<br />
already defined in a schedule in the current job.<br />
SSI Directive<br />
Description<br />
Inserts the most recent reading for the specified existing <strong>DT80</strong><br />
channel, and the time at which the reading was taken.<br />
e.g. 2009/03/16 20:41:39.298 19.66 degC<br />
#include Directive<br />
This directive is used to insert the contents of another file into a HTML page.<br />
SSI Directive<br />
Description<br />
Inserts the contents of the file rel-file (specified as a relative path,<br />
e.g. footer.htm) into the current HTML page.<br />
<br />
Inserts the contents of the file abs-file (specified as an absolute path,<br />
e.g. b:\events\event.log) into the current HTML page.<br />
UM-0085-B2 <strong>DT80</strong> <strong>Series</strong> User’s <strong>Manual</strong> Page 146
The #include directive may be nested, i.e. a file that has been included may itself then include another file, up to a<br />
maximum of three levels.<br />
cond Attribute<br />
This attribute may be included by any SSI directive, in addition to its normal attribute. It specifies a condition – if the<br />
condition is met then the SSI directive is processed, otherwise it is ignored. This provides a way to conditionally include web<br />
page elements based on the status of the <strong>DT80</strong>.<br />
condition value<br />
cond = SchDefined(s)<br />
cond = DataStored(s)<br />
cond = AlarmsStored(s)<br />
Description<br />
Process directive if the specified schedule has been defined<br />
Process directive if any data have been logged for the specified schedule<br />
Process directive if any alarms have been logged for the specified schedule<br />
For example:<br />
<br />
will only include the indicated file if schedule A is defined in the current job.<br />
Building A Custom Web Page<br />
This section provides a brief overview of the process of setting up a custom web page for the <strong>DT80</strong>. It is assumed that the<br />
reader has a good working knowledge of HTML and the <strong>DT80</strong>.<br />
All custom pages will need to be loaded into a directory of your choice on the <strong>DT80</strong>'s internal file system (B:).<br />
Creating the SHTML Page<br />
An SHTML page can be created with any HTML or text editor. Let’s create a page that is titled "My Custom dataTaker Web<br />
Page" that will contain an image and display the following logger data:-<br />
The current job name<br />
The name of schedule A for the current job<br />
The value from channel variable 1<br />
This is what the SHTML page will look like when viewed in a web browser:-<br />
UM-0085-B2 <strong>DT80</strong> <strong>Series</strong> User’s <strong>Manual</strong> Page 147
The SHTML mark-up for this page is as follows:<br />
<br />
<br />
My Custom dataTaker Web Page<br />
<br />
<br />
My Custom dataTaker Web Page<br />
<br />
Job Name:<br />
<br />
Schedule Name:<br />
<br />
Channel Variable (1CV):<br />
<br />
<br />
<br />
Notice the SSI directives (red).<br />
Note The SHTML page filename must be saved with the following extensions:- .shtml, .shm or .sht. The SHTML page will<br />
not be rendered correctly if these extensions are not used.<br />
Custom Home Page<br />
It is recommended that a central (Home) page is used when building a custom web interface. The Home page can be an<br />
HTML or SHTML page. Set the Home page filename to index.htm or index.shm.<br />
The <strong>DT80</strong> web server will automatically looks for a file with one of these names if the user types just the IP address into their<br />
browser (i.e. no filename specified).<br />
Storing the Custom Web Pages<br />
To test the custom web pages they need to be loaded onto the <strong>DT80</strong>'s internal file system.<br />
Connect to the logger's FTP server, specifying the configured username and password – files cannot be written to the file<br />
system using the default anonymous username. Then upload the files to a directory on the internal drive, e.g.<br />
B:\www\custom.<br />
Customising the Built-in Web Interface<br />
As an alternative to creating the web interface from scratch, you can also use the built-in web pages as a starting point and<br />
customise them as required.<br />
Start by using an FTP client to copy all files from b:\www\html to b:\www\custom, then customise as required.<br />
Using the Custom Web Pages<br />
If you loaded the custom web interface into the b:\www\custom directory then you can either:<br />
access it by typing http://ip-addr/custom into the web browser, or defining a bookmark for this URL<br />
replace the interface selector page (b:\www\index.html) with an alternative page which contains a link to your custom<br />
interface, or which contains an automatic redirection, e.g.:<br />
<br />
<br />
<br />
Click here<br />
<br />
In this way a user which just enters the logger's IP address is automatically directed to the custom interface, but can still<br />
access the standard classic interface, for example, by typing http://ip-addr/html.<br />
Automatic Page Refresh<br />
If required, a custom web page can be made to automatically refresh by including the following line within the page header:<br />
<br />
<br />
<br />
...<br />
<br />
...<br />
In this example the page will refresh every 30 seconds.<br />
UM-0085-B2 <strong>DT80</strong> <strong>Series</strong> User’s <strong>Manual</strong> Page 148
Part J – Modbus Interface<br />
About Modbus<br />
Modbus is a simple communications protocol which is widely used in SCADA (supervisory control and data acquisition)<br />
systems. Modbus provides an efficient and standardised way to transport digital states and data values between a remote<br />
terminal unit (RTU) or programmable logic controller (PLC) and a supervisory computer.<br />
Servers and Clients<br />
In a Modbus-based SCADA system, each RTU/PLC acts as a Modbus server, or slave. These servers/slaves listen for and<br />
reply to requests from a Modbus client, or master system. A Modbus client is typically a computer that provides a mimic<br />
display, user interface and various data logging and alarm functions.<br />
Modbus can operate using a broad range of communications media. These fall into two main categories:<br />
a serial connection, typically RS232, RS422 or RS485<br />
a TCP/IP network, which can use a variety of physical link types e.g. Ethernet, wireless, fibre-optic, serial (PPP)<br />
The <strong>DT80</strong> is capable of operating as a Modbus server; that is, it can act like an RTU or PLC device. This allows the <strong>DT80</strong> to<br />
be easily integrated into any Modbus-based SCADA system. No special drivers are required for the client system.<br />
A Modbus client system can directly read or write any <strong>DT80</strong> channel variable (CV) or digital I/O channel.<br />
The <strong>DT80</strong> can also operate as a Modbus client, where it can read data from Modbus sensors in the same way that it reads<br />
data from SDI-12 or serial sensors. See Modbus Channel (P288) for more details.<br />
The remainder of this section describes the operation of the <strong>DT80</strong> as a Modbus server.<br />
In general terms, the procedure for setting up the <strong>DT80</strong> in a Modbus environment is:<br />
1. Establish a physical connection (TCP/IP or serial) between the Modbus client system and the <strong>DT80</strong>.<br />
2. Load a job onto the <strong>DT80</strong> that scans the required channels at the required rates. The job should also load the<br />
measured values into channel variables.<br />
3. Configure the client system to poll the Modbus addresses corresponding to the <strong>DT80</strong> CVs and digital I/Os of interest.<br />
Note Even if there is no job loaded, the <strong>DT80</strong>'s Modbus server is still active and the client can query or set any CV or digital<br />
channel.<br />
Connecting to a Modbus Network<br />
The <strong>DT80</strong> supports both TCP/IP and serial Modbus networks.<br />
TCP/IP Connection<br />
Up to five Modbus client systems can simultaneously connect to the <strong>DT80</strong> using TCP/IP.<br />
The first step in setting up Modbus over TCP/IP is to establish a working TCP/IP connection between the client system and<br />
the <strong>DT80</strong>. This involves assigning an IP address to the <strong>DT80</strong>, along with a couple of other settings, depending on whether<br />
Ethernet or PPP is used. See Ethernet Communications (P177) and PPP Communications (P188) for more details.<br />
By default, the <strong>DT80</strong>'s TCP/IP Modbus server is always enabled. It will listen for connection requests from client systems<br />
which are directed to TCP port 502 (which is the standard port number for Modbus). If required, this port number may be<br />
changed using the following <strong>DT80</strong> command:<br />
PROFILE MODBUS_SERVER TCPIP_PORT=port<br />
where port is the desired port number (1-65535).<br />
To disable the <strong>DT80</strong>'s TCP/IP Modbus server, set the port number to zero, i.e.<br />
PROFILE MODBUS_SERVER TCPIP_PORT=0<br />
Serial Connection<br />
A serial Modbus network has one client (master) system connected to one or more server (slave) devices. Serial networks<br />
using the RS485 or RS422 standards support multi-drop, i.e. multiple slaves connected to one master. RS232 or USB can<br />
also be used for point-to-point connections (single master and single slave).<br />
Slave devices on a serial Modbus network are identified by an 8-bit slave address (1-247). Every slave device on a<br />
particular serial network must have a unique address. (Slave addresses are not required on a TCP/IP Modbus network,<br />
because the slaves are identified by their IP address.)<br />
The <strong>DT80</strong> can be connected to a serial Modbus network using either the serial sensor port, the host RS232 port, or the USB<br />
port.<br />
Serial Sensor Port<br />
The serial sensor port can be used to connect to a Modbus client via a multi-drop (RS422/485) or point-to-point<br />
(RS232/422/485) link.<br />
UM-0085-B2 <strong>DT80</strong> <strong>Series</strong> User’s <strong>Manual</strong> Page 149
In order to use Modbus on the serial sensor port it is necessary to set the port function, as follows:<br />
PROFILE SERSEN_PORT FUNCTION=MODBUS<br />
You may also need to configure the baud rate or other serial parameters to suit the system to which you are connecting.<br />
Modbus systems commonly use 19200 baud, 8 data bits, 1 stop bit, even parity, no flow control.<br />
For more details on setting up the port and the possible wiring configurations, see Serial Sensor Port (P169).<br />
Note Do not use software flow control (SWFC) on a Modbus serial connection. This is because flow control characters<br />
(XON/XOFF) may legitimately appear in Modbus data, and if they do then they will be stripped out. This will cause data<br />
errors.<br />
Host RS232 Port<br />
The host RS232 port can be used for a point-to-point serial Modbus connection.<br />
As with the serial sensor port, the port function must be set:<br />
PROFILE HOST_PORT FUNCTION=MODBUS<br />
along with the serial parameters to match the connected system.<br />
For more details on setting up the port and the possible wiring configurations, see Host RS-232 Port (P168).<br />
USB Port<br />
A USB connection can also be used where the client system is within a few metres of the <strong>DT80</strong>.<br />
USB is convenient because you don't have to set serial parameters. The port function does need to be set, however:<br />
PROFILE USB_PORT FUNCTION=MODBUS<br />
For more details, see USB Port (P160).<br />
Slave Address<br />
To enable Modbus operation on the serial sensor port, it is also necessary to set the <strong>DT80</strong>'s slave address. This is done<br />
using the following profile setting:<br />
PROFILE MODBUS_SERVER SERSEN_ADDRESS=addr<br />
where addr is the desired address (1-247). Setting the address to zero (which is the default) will disable Modbus on the serial<br />
sensor port.<br />
In the same way, Modbus can be enabled on the host RS232 and USB port using:<br />
PROFILE MODBUS_SERVER HOST_ADDRESS=addr<br />
PROFILE MODBUS_SERVER USB_ADDRESS=addr<br />
Again, the default setting is zero, which means "disabled".<br />
Modbus Registers<br />
The Modbus Data Model<br />
The Modbus protocol defines a simple data model. It specifies that any Modbus slave device contains the following<br />
resources:<br />
an array of single bit coils (digital outputs). When setting up a Modbus client application, a particular coil is normally<br />
referenced using a 5-digit number in the range 00001-09999, or a 6-digit number 0:00001-0:65536 (depending on the<br />
Modbus client implementation). In this manual the 6-digit notation will be used.<br />
an array of single bit discrete inputs (digital inputs), numbered 10001-19999, or 1:00001-1:65536<br />
an array of 16-bit input registers, numbered 30001-39999, or 3:00001-3:65536<br />
an array of 16-bit output registers (a.k.a holding registers), numbered 40001-49999, or 4:00001-4:65536<br />
As can be seen, the first digit of the register number indicates the type of register – 0, 1, 3 or 4 for coil, discrete input, input<br />
register or output register respectively. This usage is, however, just a convention. This digit is not part of the actual address<br />
transmitted in the Modbus message.<br />
A further potential source of confusion is the fact that the actual transmitted address is zero-based, so register number<br />
x:00003 is actually transmitted as address 0002.<br />
Note In some Modbus client applications, register numbers are entered using these raw protocol addresses, while in others<br />
you specify register numbers including the initial "register type" digit, as described above. The documentation for the<br />
particular package should make clear which convention it uses.<br />
The protocol then defines a set of messages which allow the client to:<br />
read the current value of one or more of the slave's coils, discrete inputs, input registers or output registers<br />
write to one or more of the slave's coils or output registers.<br />
A given type of Modbus slave device will support some quantity of each type of resource – for example a hypothetical device<br />
might support 16 coils, 16 discrete inputs, 4 input registers and no output registers.<br />
Furthermore, it is common for the different register arrays to overlap. In the example device mentioned above, the 16 coils<br />
and discrete inputs may actually refer to the same physical hardware – in this case 16 bi-directional I/O pins. So for this slave<br />
device, if a client wrote a "1" to coil 0:00007, it would then read the same value back if it did a read from discrete input<br />
UM-0085-B2 <strong>DT80</strong> <strong>Series</strong> User’s <strong>Manual</strong> Page 150
1:00007.<br />
Accessing <strong>DT80</strong> Channels via Modbus<br />
The <strong>DT80</strong> maps blocks of Modbus registers onto certain <strong>DT80</strong> channels (channel variables and digital channels), as<br />
specified in the following tables. The Modbus client can therefore directly access any of these <strong>DT80</strong> channels by transmitting<br />
a request to read or write the associated Modbus register(s).<br />
The first table shows the action taken by the <strong>DT80</strong> in response to requests by the client system to read particular Modbus<br />
registers:<br />
Register number as<br />
specified in Modbus<br />
client application Type of register to read Action taken by <strong>DT80</strong><br />
0:00001-0:01000 coil 1-1000<br />
1:00001-1:01000 discrete 1-1000<br />
returns current state of channel variable 1..1000CV (0 if CV value is 0.0,<br />
otherwise 1)<br />
3:00001-3:01000<br />
4:00001-4:01000<br />
input reg 1-1000<br />
output reg 1-1000<br />
0:04001-0:04053 coil 4001-4053<br />
1:04001-1:04053 discrete 4001-4053<br />
3:04001-3:04053 input reg 4001-4053<br />
4:04001-4:04053 output reg 4001-4053<br />
returns current value of channel variable 1..1000CV<br />
returns current state of system variable 1..53SV (0 if SV value is 0.0,<br />
otherwise 1)<br />
returns current value of system variable 1..53SV<br />
0:08001-0:08009 coil 8001-8009 returns current state of digital output 1..8DSO or 1RELAY<br />
1:08001-1:08008 discrete 8001-8008 returns current state of digital input 1..8DS<br />
3:08001-3:08008 input reg 8001-8008 returns current state of digital input 1..8DS as a numeric value (0 or 1)<br />
4:08001-4:08009 output reg 8001-8009 returns current state of digital output 1..8DSO or 1RELAY as a numeric<br />
value (0 or 1)<br />
The next table shows the action taken by the <strong>DT80</strong> in response to a write request:<br />
Register number as<br />
specified in Modbus<br />
client application Type of register to write Action taken by <strong>DT80</strong><br />
0:00001-0:01000 coil 1-1000 sets channel variable 1..1000CV to 0.0 or 1.0<br />
4:00001-4:01000 output reg 1-1000 sets channel variable 1..1000CV to the specified value<br />
0:04001-0:04053 coil 4001-4053 sets system variable 1..53SV to 0.0 or 1.0 (writable SVs only)<br />
4:04001-4:04053 output reg 4001-4053 sets system variable 1..53SV to the specified value (writable SVs only)<br />
0:08001-0:08009 coil 8001-8009 sets digital output 1..8DSO or 1RELAY to the specified value<br />
4:08001-4:08009 output reg 8001-8009 sets digital output 1..8DSO or 1RELAY to the specified value (0 if the<br />
specified value is 0, otherwise 1)<br />
If the Modbus client attempts to access any register outside the ranges specified above then the <strong>DT80</strong> will return a Modbus<br />
error response and ignore the request.<br />
Note that for the DT81, Modbus registers x8001-x8004 correspond to channels 1..4DS and 1..4DSO. Accessing registers<br />
x:08005-x:08008 will not cause an error, but it will not do anything either, because these channels are not present on the<br />
DT81. Register x:08009 corresponds to the 1RELAY channel, as with the <strong>DT80</strong>.<br />
Data Types<br />
Modbus input and output registers are 16 bits wide. The Modbus standard does not, however, define how these bits are to<br />
interpreted, other than stating that the most significant byte of a register value is transmitted first ("big endian" format).<br />
By default, the <strong>DT80</strong> interprets a Modbus register as a signed 16-bit integer in the range -32768 to 32767. If a CV or SV's<br />
value is outside this range then the associated Modbus register will "saturate", i.e. the value 32767 will be returned if the<br />
CV/SV value is greater than 32767, and the value -32768 if the value is less than -32768. Also, the CV/SV value will be<br />
rounded to the nearest integer.<br />
There are, however, a number of options for dealing with data values that cannot be represented by a 16-bit integer value:<br />
the register can be treated as an unsigned 16-bit integer (0-65535)<br />
the value can be scaled, typically by a power of ten, to give the required precision or range. For example a scaling<br />
factor of 100 would permit values in the range -327.68 to 327.67 to be returned.<br />
multiple registers can be combined to return a single larger value, e.g. a pair of registers could return a 32-bit quantity.<br />
Clearly, both the slave device and the client system must agree on how a given Modbus register is to be interpreted. It is no<br />
good if the device encodes the value 40000 as an unsigned 16-bit number (9C40 hexadecimal) but then the client interprets<br />
it as a signed number and displays it as -25536.<br />
The only solution is to explicitly configure the required data types on both the slave and the client. For the <strong>DT80</strong>, this is done<br />
using the SETMODBUS command.<br />
The SETMODBUS Command<br />
By default, all CV values are transferred to and from the <strong>DT80</strong> as signed 16-bit integers, with no scaling factor. The<br />
SETMODBUS command is used to specify alternative data types and scaling factors.<br />
UM-0085-B2 <strong>DT80</strong> <strong>Series</strong> User’s <strong>Manual</strong> Page 151
The format of the command is as follows:<br />
SETMODBUS channels format scaling<br />
where:<br />
channels specifies a single channel variable, or a range (e.g. 1CV or 20..29CV)<br />
scaling is an optional floating point scaling factor by which the channel value will be multiplied before being returned.<br />
Conversely, when the client writes a value, it will be divided by the scaling factor before being written to the CV.<br />
format is an optional code that specifies the data type, as follows:<br />
Format code Data type Comments<br />
MBI signed 16-bit integer Default setting. Returns -32768 or 32767 if the scaled return value is<br />
outside the valid range.<br />
MBU unsigned 16-bit integer Returns 0 or 65535 if the scaled return value is outside the valid range.<br />
MBLS<br />
(or MBL)<br />
MBLR<br />
MBFS<br />
MBFR<br />
(or MBF)<br />
signed 32-bit integer,<br />
standard word order<br />
signed 32-bit integer,<br />
reversed word order<br />
32-bit floating point,<br />
standard word order<br />
32-bit floating point,<br />
reversed word order<br />
Upper 16 bits of nCV are returned in Modbus register n. Lower 16 bits are<br />
returned in register n+1. Returns -2,147,483,648 or 2,147,483,647 if the<br />
scaled return value is outside the valid range.<br />
Lower 16 bits of nCV are returned in Modbus register n. Upper 16 bits are<br />
returned in register n+1. Returns -2,147,483,648 or 2,147,483,647 if the<br />
scaled return value is outside the valid range.<br />
Returned as a single precision IEEE-754 floating point number. Upper 16<br />
bits of nCV are returned in Modbus register n. Lower 16 bits are returned in<br />
register n+1.<br />
Returned as a single precision IEEE-754 floating point number. Lower 16<br />
bits of nCV are returned in Modbus register n. Upper 16 bits are returned in<br />
register n+1.<br />
If format and scaling are not specified, the current settings for the indicated range of CVs are displayed.<br />
Any number of these SETMODBUS commands can be issued (typically at the start of the <strong>DT80</strong> job) to configure the required<br />
channels.<br />
Note The SETMODBUS command only supports channel variables. However some system variables may have values<br />
outside the range -32768 to 32767, or may have a fractional part. Such SVs can be assigned to a CV, for which an<br />
appropriate data type and/or scaling factor can then be set, e.g.:<br />
SETMODBUS 1CV MBLS<br />
3SV(=1CV)<br />
Example<br />
This example illustrates some of the technicalities relating to Modbus transfers.<br />
Consider the following job:<br />
BEGIN"PERCY"<br />
SETMODBUS 7CV MBF<br />
SETMODBUS 9..10CV MBU 100<br />
SETMODBUS 11CV MBL<br />
7CV=23.91 8CV=42 9CV=490.22 10CV=921.0 11CV=75535.9<br />
END<br />
If a Modbus client then requests input registers 3:00007-3:00012 it will receive the following raw data:<br />
Register Value (hex / decimal) Comments<br />
3:00007 47AE<br />
The 32-bit value 41BF47AE is the IEEE754 representation of 23.91<br />
3:00008 41BF<br />
3:00009 BF7E / 49022 490.22 multiplied by scaling factor (100)<br />
3:00010 FFFF / 65535 overflow: 921.0 x 100 = 92100 is too big for an unsigned 16-bit integer<br />
3:00011 0001 / 1<br />
The 32-bit value 00012710 equals 75536 decimal<br />
3:00012 2710 / 10000<br />
To make sense of this, the client software must support the 32-bit data formats used by the <strong>DT80</strong>, and it must be told the data<br />
type of each register (or register pair).<br />
Note Be aware that for 32-bit data types, the word order (i.e. whether the upper or lower 16 bits comes first) is not proscribed<br />
by the Modbus standard, so naturally both orderings are widely used. Most client software can be configured to support<br />
either ordering.<br />
Note that in this example 7CV and 11CV are spread across two registers apiece (3:00007-8 and 3:00011-12 respectively),<br />
which makes channel variables 8CV and 12CV effectively inaccessible via Modbus. They can still be used in the program<br />
(e.g. setting 8CV=42 in the above program is perfectly OK and won't interfere with 7CV); it's just that they cannot (easily) be<br />
accessed by a Modbus client.<br />
Note also that some Modbus clients require that all 32-bit register pairs start on an odd-numbered register. That is, you can<br />
return a 32-bit value using registers 30001-30002, but not using registers 30002-30003.<br />
UM-0085-B2 <strong>DT80</strong> <strong>Series</strong> User’s <strong>Manual</strong> Page 152
Putting It All Together<br />
In this example, a greenhouse is monitored by a <strong>DT80</strong>. Three thermocouples on analog inputs 1-3 monitor the temperature<br />
at various points. The <strong>DT80</strong> is required to log the temperatures every 15s and switch on an extractor fan (by setting digital<br />
output 1D low) if any of the temperatures exceed a programmable setpoint. A sensor attached to the fan produces a voltage<br />
proportional to fan speed (1.25mV/rpm) and this is fed into analog input 4. Digital output 2D is connected to a watering<br />
system valve.<br />
The <strong>DT80</strong> is connected to an Ethernet network. In a central office an operator runs a Modbus-capable SCADA package. She<br />
wants to be able to:<br />
check current temperatures<br />
set the current extractor fan setpoint<br />
check the status of the extractor fan (fan RPM and state of control output)<br />
switch the watering system on or off<br />
check how many data and alarm records have been logged<br />
The following sections discuss how this might be achieved.<br />
<strong>DT80</strong> Configuration<br />
It is assumed that the <strong>DT80</strong>'s Ethernet connection has already been set up. This can be verified by entering its IP address<br />
into DeTransfer or a web browser and checking that the <strong>DT80</strong>'s command or web interface is accessible. If you cannot<br />
connect to these services then you probably won't be able to connect to the Modbus server either. See Ethernet<br />
Communications (P177) for more information.<br />
Once TCP/IP connectivity has been established, a suitable <strong>DT80</strong> job can be entered:<br />
BEGIN"GERANIUM"<br />
SETMODBUS 1..4CV MBI 10 ' temperatures & setpoint<br />
SETMODBUS 5..7CV MBL 1 ' logged data,alarm recs (32 bit)<br />
SETMODBUS 9CV MBI 1 ' fan RPM<br />
4CV(W)=30.0 ' default setpoint<br />
' update every 15 sec<br />
RA(DATA:30D,ALARMS:500KB)15S<br />
1TK(NR,=1CV)<br />
2TK(NR,=2CV)<br />
3TK(NR,=3CV)<br />
' set 10CV=1 if at least one temp over limit<br />
' set 11CV=1 if all temps under limit<br />
' allow +/- 1 degC hysteresis<br />
10CV(W)=(1CV>4CV+1)OR(2CV>4CV+1)OR(3CV>4CV+1)<br />
11CV(W)=(1CV.5)"Fan OFF^M"{1DSO=1}<br />
32SV(W,=5CV) ' num logged data recs for sched A<br />
33SV(W,=7CV) ' num logged alarm recs for sched A<br />
4V(W,0.8,=9CV) ' fan speed 1.25mV/rpm<br />
LOGONA<br />
END<br />
This job sets up the following CVs for access by the Modbus client:<br />
1CV, 2CV and 3CV contain the three measured temperatures. A scaling factor of 10.0 is applied so that it can be<br />
returned with one decimal place (range -3276.8 to +3276.7)<br />
4CV is designed to be accessed as an output register, i.e. the Modbus client writes to it. This channel variable is used<br />
as the temperature setpoint, so it is scaled in the same way as the other temperature CVs.<br />
5CV and 7CV return the number of logged data and alarm records for the main A schedule. In this example the store<br />
file size is relatively large (30 days data @ 15s scans), so the number of logged records may exceed the capacity of a<br />
single 16-bit register. They are therefore defined as 32-bit long integers (MBL). (Channel variables 6CV and 8CV<br />
have been skipped because their associated Modbus registers are used for returning the 32-bit 5CV and 7CV<br />
values.)<br />
9CV returns the fan speed in RPM. A standard 16-bit integer is OK here. (The SETMODBUS command for this CV<br />
could have been omitted because the values it is setting are the default values.)<br />
Notice that all Modbus-accessible CVs have been grouped into one contiguous block. This is not essential, but it will improve<br />
the efficiency of the Modbus link because the client can request all relevant CVs in one command.<br />
The digital channels of interest are 1DSO (fan control) and 2DSO (watering system). Since the Modbus client can access<br />
these channels directly, there is no need to include them in the <strong>DT80</strong> job.<br />
One final point is that because all relevant data are returned by Modbus, there is no point having the <strong>DT80</strong> return real time<br />
data via its standard command interface – it would just clutter the screen if the operator ever needed to connect to the <strong>DT80</strong><br />
UM-0085-B2 <strong>DT80</strong> <strong>Series</strong> User’s <strong>Manual</strong> Page 153
using DeTransfer. All channels are therefore set to "working'" (W) or "no return" (NR) channels.<br />
Modbus Client Configuration<br />
It is now necessary to configure the SCADA software package to suit the <strong>DT80</strong> channel usage described above. This is<br />
highly application dependent but in very general terms the steps involved will typically include:<br />
configuring communications details<br />
designing a mimic screen incorporating the required measurement and control fields<br />
associating each element of the mimic with the correct Modbus register address<br />
So in this case the first step might be to select the software package's "generic PLC" device driver and then create a "<strong>DT80</strong>"<br />
device instance. As a minimum, the <strong>DT80</strong>'s IP address would need to be entered here. If the driver or application provides a<br />
"test" facility, you may at this point be able to try manually reading and writing specific Modbus registers.<br />
The mimic screen for this application might consist of:<br />
three thermometer displays showing the measured temperatures<br />
an entry field where the operator can set the desired setpoint<br />
two numeric indicators showing number of logged data and alarm records<br />
a fan icon with on/off and RPM indicators<br />
a button to turn the watering system on or off.<br />
The final step would typically then be to edit the properties of each control and indicator to specify their behaviour. This would<br />
generally mean specifying:<br />
which slave device to use. This may involve selecting the <strong>DT80</strong>'s "device instance" from a list of connected Modbus<br />
slave devices.<br />
the Modbus register number<br />
the data type (signed or unsigned or floating point, 16 or 32 bits, byte/word ordering)<br />
the scaling factor. This is often presented as a span, similar to a <strong>DT80</strong> span (P58). That is, you specify the "device<br />
range" (min/max returned value) and the corresponding "display range" (min/max value to display) – which then<br />
creates a linear scaling curve.<br />
the scan rate (how often to read/write the value from/to the <strong>DT80</strong>)<br />
other details such as units.<br />
So the setup for this application might be something like:<br />
Mimic<br />
Element<br />
Modbus<br />
Reg Data Type Device Range Display Range Units Comments<br />
"temp1" 3:00001 signed 16-bit -3276 to 3276 -327.6 to 327.6 degC 1CV (input reg)<br />
"temp2" 3:00002 signed 16-bit -3276 to 3276 -327.6 to 327.6 degC 2CV (input reg)<br />
"temp3" 3:00003 signed 16-bit -3276 to 3276 -327.6 to 327.6 degC 3CV (input reg)<br />
"setpt" 4:00004 signed 16-bit -3276 to 3276 -327.6 to 327.6 degC 4CV (output reg)<br />
"num_data" 3:00005 signed 32-bit, -1 to 1000000 -1 to 1000000 recs 5CV (input reg)<br />
MSW first<br />
"num_alm" 3:00007 signed 32-bit, -1 to 1000000 -1 to 1000000 recs 7CV (input reg)<br />
MSW first<br />
"fan_rpm" 3:00009 signed 16-bit 0 to 32767 0 to 32767 rpm 9CV (input reg)<br />
"fan_state" 0:08001 n/a n/a n/a on/off 1DSO (coil)<br />
"water" 0:08002 n/a n/a n/a on/off 2DSO (coil)<br />
Notice how input register numbers are prefixed by "3", output registers by "4" and coils (output bits) by "0".<br />
Note Different Modbus client packages may specify Modbus register numbers in different ways. For example, register<br />
3:0001 may be specified as "30001", "300001", "input register 0001", or "input register, address 0000". In all cases the<br />
message transmitted to the <strong>DT80</strong> is identical; the difference is just in how you enter it into the software.<br />
Troubleshooting<br />
Setting P56=4 will enable the output of diagnostic messages which allow you to see received and transmitted Modbus<br />
messages as they occur. For example:<br />
P56=4<br />
Modbus RX 192.168.1.60:1168: 00000000001301 041000000000000000000000000000000000 (25)<br />
Modbus RX 192.168.1.60:1168: 00010000001301 041000000000000000000000000000000000 (25)<br />
Modbus RX HOST: 01 041000000000000000000000000000000000552c (21)<br />
UM-0085-B2 <strong>DT80</strong> <strong>Series</strong> User’s <strong>Manual</strong> Page 154
This shows a message received from a Modbus client at IP address 192.168.1.60 (port 1168) which has total length of 12<br />
bytes. The data is shown in hexadecimal form. The first part is the TCP/IP-specific header, which comprises: a transaction<br />
identifier (0000, used to match up requests and replies), a protocol identifier (0000 indicates Modbus), the number of<br />
following bytes (0006) and the slave address (01 – not applicable for TCP/IP). The actual Modbus frame follows: 04 for<br />
"read input registers" function code, starting address 0000 and length 0008. This is therefore a request to read the values of<br />
1CV to 8CV.<br />
The <strong>DT80</strong> then replies with the same function code (04), the byte count (10), and 8 x 16-bit data values (all zero in this case).<br />
This exchange is then repeated; notice that the client has incremented the transaction identifier, which is now 0001.<br />
A serial Modbus message is then received on the host port, addressed to slave ID 01. Again, this is a request to read 1CV to<br />
8CV. Note that serial Modbus also includes a checksum on the end (f1cc).<br />
Assuming that the <strong>DT80</strong> has been configured for address 1, using<br />
PROFILE MODBUS_SERVER HOST_ADDRESS=1<br />
then it will respond to the message as shown.<br />
UM-0085-B2 <strong>DT80</strong> <strong>Series</strong> User’s <strong>Manual</strong> Page 155
Part K – Communications<br />
Overview<br />
The <strong>DT80</strong> is very flexible and provides many communications options. To understand how these fit together and what<br />
combinations are possible, it is helpful to think of communications in terms of the following hierarchy:<br />
<br />
<br />
<br />
<br />
<br />
<br />
Clients are software programs (e.g. a web browser, or the job running on the logger) that initiate communications to or<br />
from the <strong>DT80</strong>.<br />
These clients use services that are provided by the logger (e.g. web server, command interface).<br />
The services are in turn implemented using particular communications protocols (e.g. FTP, Modbus).<br />
These protocols cause data to be physically transmitted using one of the <strong>DT80</strong>'s physical communications ports (e.g.<br />
Ethernet port, USB port)<br />
The data travels via a physical connection to one of these ports (e.g. USB cable, Ethernet LAN connection)<br />
Finally, at the other end of the physical connection is the physical device with which the <strong>DT80</strong> is communicating (e.g.<br />
PC, serial sensor)<br />
This is illustrated in Figure 56 (P158), and described further below. Later sections will explain common usage scenarios in<br />
more detail.<br />
Services<br />
The <strong>DT80</strong> provides eight basic services through which it can communicate with a host computer or other device:<br />
a command interface, to which a host computer sends ASCII commands and from which it receives ASCII data and<br />
other responses. All of the various commands and responses described in this manual are sent to the <strong>DT80</strong> via its<br />
command interface. See The Command Interface (P159).<br />
a web interface (dEX). This allows the <strong>DT80</strong> to be monitored and configured remotely using a standard web browser,<br />
such as Microsoft Internet Explorer. See Web Interface (P112).<br />
an FTP server. The File Transfer Protocol is a standard TCP/IP based protocol, which allows files to be efficiently<br />
transferred between the <strong>DT80</strong>'s file system and that of a host computer. These transfers are initiated by the host<br />
(client) computer. See Using the <strong>DT80</strong> FTP Server (P186).<br />
an FTP client. This allows transfer of data between the <strong>DT80</strong>'s file system and that of a host computer, initiated by the<br />
current job on the <strong>DT80</strong>. See Retrieving Logged Data (P88).<br />
a Modbus server. This allows the <strong>DT80</strong> to be monitored and controlled by a Modbus client system (typically a SCADA<br />
package). See Modbus Interface (P149).<br />
a Modbus client. This allows Modbus sensors to be polled under the control of the current job on the <strong>DT80</strong>. See<br />
Modbus Channel (P288).<br />
an SDI-12 data recorder function. This allows SDI-12 sensors to be polled under the control of the current job on the<br />
<strong>DT80</strong>. See SDI-12 Channel (P270).<br />
a generic serial facility, where data strings are transferred to and from a PC or serial sensor device under the control<br />
of the current job on the <strong>DT80</strong>. See Generic Serial Channel (P275).<br />
Protocols<br />
A communications protocol is a set of rules governing what is transmitted over a communications link. The <strong>DT80</strong><br />
implements certain communications protocols, which are used to provide the services listed above.<br />
There are two classes of protocols:<br />
serial protocols, which operate on the <strong>DT80</strong>'s serial ports (USB, host, serial sensor)<br />
TCP/IP network protocols, which require a TCP/IP connection between the host computer and the <strong>DT80</strong>. (The<br />
process of establishing a TCP/IP connection will be discussed below.)<br />
Serial Protocols<br />
The <strong>DT80</strong>'s serial ports (USB, host, serial sensor) all support the following serial protocols:<br />
the serial command interface protocol. This consists simply of <strong>DT80</strong> commands and responses transmitted directly<br />
over a point-to-point serial connection.<br />
the serial Modbus protocol. The <strong>DT80</strong> only implements the slave (server) side of this protocol.<br />
the generic serial protocol.<br />
UM-0085-B2 <strong>DT80</strong> <strong>Series</strong> User’s <strong>Manual</strong> Page 156
PPP (point to point protocol), which allows a TCP/IP connection to be established over a serial link. This then provides<br />
similar capabilities to the Ethernet port, i.e. all TCP/IP-based protocols can then operate using this link.<br />
The <strong>DT80</strong> implements a PPP server only. A PPP client (e.g. a PC) can establish a PPP connection to the <strong>DT80</strong>, but<br />
the <strong>DT80</strong> cannot establish a PPP connection with a PPP server (e.g. and Internet service provider).<br />
Note that each serial port can only support one of these protocols at a time.<br />
The SDI-12 protocol is only supported on the SDI-12 capable I/O terminals (5D-8D).<br />
TCP/IP Protocols<br />
TCP/IP based protocols are used to communicate between devices that have an IP address set (IP = Internet Protocol). An<br />
IP address can be assigned to the <strong>DT80</strong>'s Ethernet port, and to any serial port on which a PPP connection has been<br />
established.<br />
The <strong>DT80</strong> supports the following TCP/IP protocols:<br />
the network command interface protocol. This consists simply of <strong>DT80</strong> commands and responses transmitted via<br />
TCP port 7700.<br />
the network Modbus protocol (TCP port 502), which a SCADA system uses to access the <strong>DT80</strong>'s Modbus server,<br />
and the <strong>DT80</strong> uses to access other Modbus devices.<br />
the Hypertext Transfer Protocol (HTTP) (TCP port 80), used for accessing the <strong>DT80</strong>'s web server.<br />
the File Transfer Protocol (FTP) (TCP port 21). This allows files to be transferred between the <strong>DT80</strong> and another<br />
computer.<br />
Multiple protocols can be active on the one physical port at the same time.<br />
Physical Ports<br />
The <strong>DT80</strong> has the following physical communications ports:<br />
Ethernet port – supports TCP/IP protocols<br />
USB port – supports serial protocols (and TCP/IP protocols if PPP is used)<br />
host RS232 port – supports serial protocols (and TCP/IP protocols if PPP is used)<br />
serial sensor port (RS232/422/485) – supports serial protocols (and TCP/IP protocols if PPP is used)<br />
4 SDI-12 ports (5D-8D) (1 port for DT81: 4D) – supports SDI-12 protocol only<br />
About the Communications Diagram<br />
Figure 56 (P158) shows the various communications options available on the <strong>DT80</strong>. The diagram may appear slightly<br />
intimidating; the following notes may help in deciphering what it is trying to indicate.<br />
The outer dashed line represents the boundary of the <strong>DT80</strong> itself. The physical comms ports (blue boxes) therefore<br />
appear on the boundary between "inside" and "outside".<br />
The green ellipses represent clients – things which initiate communications actions. Clients are generally software<br />
applications. As can be seen, most of these are external to the <strong>DT80</strong> (i.e. running on some external computer system),<br />
the exception being the <strong>DT80</strong>'s current job.<br />
The pink boxes at the bottom represent physical devices connected to the <strong>DT80</strong>, and the lines connecting these to the<br />
<strong>DT80</strong>'s communications ports (blue) represent physical communications links.<br />
All other boxes are not physical things, but rather they represent aspects of the <strong>DT80</strong>'s functionality. Broadly speaking,<br />
the lines connecting these boxes indicate a "uses" relationship. For example, a "SCADA system" client uses the<br />
<strong>DT80</strong>'s "Modbus server" service, which may then use the "serial Modbus" protocol, which may then use the USB port.<br />
Where multiple lines converge on a single point (e.g. on either side of the physical port boxes), this indicates "choose<br />
one". For example, the USB port can use either the PPP protocol, or the serial Modbus protocol, or the serial<br />
command protocol, or the generic serial protocol. It cannot use more than one protocol at the same time. Similarly, the<br />
Ethernet port can physically connect either directly to a PC (using a "crossover" cable), or to a local or wide area<br />
network (LAN/WAN) by connecting to a network switch or hub.<br />
Where multiple lines join to a box but not at a single point, this implies that simultaneous operation is possible. For<br />
example, the serial command protocol can operate on both the USB and host RS232 ports at the same time if you<br />
wish. Likewise, any or all of the TCP/IP based protocols can be used over the Ethernet port at the same time.<br />
UM-0085-B2 <strong>DT80</strong> <strong>Series</strong> User’s <strong>Manual</strong> Page 157
web browser<br />
FTP client<br />
SCADA<br />
system<br />
DeTransfer,<br />
DeLoad etc.<br />
<strong>DT80</strong><br />
Clients<br />
Current job<br />
web<br />
interface<br />
FTP<br />
server<br />
FTP<br />
client<br />
Modbus<br />
server<br />
Command<br />
Interface<br />
Modbus<br />
client<br />
Generic<br />
serial<br />
SDI-12<br />
data<br />
recorder<br />
Services<br />
HTTP FTP Network<br />
Modbus<br />
Network<br />
Command<br />
Serial<br />
Modbus<br />
Serial<br />
Command<br />
Generic<br />
Serial<br />
SDI-12<br />
TCP/IP<br />
protocols<br />
TCP/IP<br />
serial<br />
protocols<br />
Protocols<br />
PPP<br />
Ethernet<br />
Port<br />
USB<br />
Port<br />
Host<br />
RS232<br />
Port<br />
Serial<br />
Sensor<br />
Port<br />
5D 6D 7D 8D<br />
digital I/O<br />
Physical<br />
Ports<br />
Modem<br />
LAN/WAN<br />
Phone<br />
Network<br />
RS232,<br />
RS422,<br />
RS485<br />
Physical<br />
Connections<br />
Modem<br />
PC<br />
PC<br />
FTP<br />
server<br />
PC<br />
PC<br />
serial<br />
sensor<br />
PC<br />
PC<br />
serial<br />
sensors<br />
SDI-12<br />
sensors<br />
Connected<br />
Devices<br />
Figure 56: <strong>DT80</strong> communications options<br />
UM-0085-B2 <strong>DT80</strong> <strong>Series</strong> User’s <strong>Manual</strong> Page 158
The Command Interface<br />
Connecting to the Command Interface<br />
As shown in Figure 56 (P158), the command interface can operate over a serial link ("serial command" protocol), and/or over<br />
a TCP/IP network ("network command" protocol). In other words, you can send commands from a computer to the <strong>DT80</strong> via:<br />
<br />
a direct connection to the USB port (P160)<br />
a direct RS232 connection to the host RS232 or serial sensor port, using a crossover ("null modem") cable (P172<br />
<br />
<br />
<br />
a fixed or dial-up modem, which is connected to the RS232 port (P172).<br />
a TCP/IP network, which is connected to the Ethernet port (P177).<br />
a point-to-point TCP/IP connection, using PPP. This may use the USB, host RS232 (with or without modem) or serial<br />
sensor port.<br />
Arbitration<br />
The <strong>DT80</strong>'s command interface may be set up to operate over more than one type of communications link at the same time..<br />
In this situation, the <strong>DT80</strong> automatically switches between each link as required, responding back through the link from<br />
which the most recent communication was received.<br />
You can therefore switch to a new comms interface at any time, simply by sending a <strong>DT80</strong> command (or just a carriage<br />
return character) via that interface.<br />
Broadcasting Data<br />
Up to ten different computers can be simultaneously "connected" to the <strong>DT80</strong> command interface using TCP/IP.<br />
Although there can only be one active command interface connection at any one time, it is possible for the <strong>DT80</strong> to<br />
"broadcast" data to a number of computers simultaneously.<br />
All output text generated by the <strong>DT80</strong> (command echoes, messages, returned/unloaded data etc.) is sent to:<br />
the active command interface connection (which may be RS232, USB or TCP/IP), and<br />
all currently open TCP/IP connections (if any)<br />
In this way a number of computers can be connected to the <strong>DT80</strong> via a TCP/IP network and passively "listen" to the stream<br />
of returned data generated by the <strong>DT80</strong>.<br />
Command Interface Operation<br />
Characters received via the command interface are buffered until a carriage return (CR) character is received. This buffer<br />
can hold 255 characters, so this is the maximum line length that can be sent to the <strong>DT80</strong>.<br />
Once a CR is received, the <strong>DT80</strong> will:<br />
1. wait until any currently executing schedule completes<br />
2. echo the received command line (after converting it to uppercase). Command echo can be disabled using the /e<br />
switch command.<br />
3. process the command.<br />
4. output the <strong>DT80</strong>> prompt, to indicate it is ready for the next command.<br />
Note that it is not necessary to wait until a command completes before sending the next command, as the <strong>DT80</strong> provides<br />
additional buffering for subsequent command lines. Each type of comms channel provides some form of automatic flow<br />
control to ensure that these buffers do not overflow when a large number of command lines are sent at once.<br />
Detecting <strong>DT80</strong> Presence<br />
Host software can detect the presence of a <strong>DT80</strong> by sending a DEL character (ASCII 127). If this character is received at any<br />
time, the <strong>DT80</strong> will respond with
Remove a password by sending<br />
PASSWORD=""<br />
Note The password is cleared if the <strong>DT80</strong> performs a hardware or SINGLEPUSH reset.<br />
Accessing Password-Protected Command Interface<br />
To establish communication at any time, simply send the password followed by a carriage return. If the password is correct,<br />
the <strong>DT80</strong> responds with Accepted and opens the comms port.<br />
The port stays open until you send the SIGNOFF command, or while there is comms activity. If there is no communication<br />
for a period of time defined by P14 (default is 600 seconds), the port will time out and close.<br />
Is the Command Interface Protected<br />
Send the command<br />
PASSWORD<br />
to determine if a command interface password has been set. The <strong>DT80</strong> responds with 1 if a password has been set,<br />
otherwise 0.<br />
USB Port<br />
Configuring the USB Port<br />
USB is much simpler to configure than RS232 because the baud rate, framing and flow control settings are all fixed by the<br />
USB standard. The <strong>DT80</strong>'s USB interface always operates at the standard USB "full speed" rate (12Mbps).<br />
Note that the USB port supports direct connections only. USB modems are not supported.<br />
The only setting that can be specified is the port function. This is set using the PROFILE command (see Profile Settings<br />
(P202)), e.g.<br />
PROFILE USB_PORT FUNCTION=MODBUS.<br />
The possible settings for the USB port FUNCTION parameter are:<br />
COMMAND (default) – the port accepts <strong>DT80</strong> commands sent directly over the serial interface. The port will<br />
automatically switch to PPP mode if an incoming PPP connection is detected. When the PPP connection is closed the<br />
port will go back to accepting direct commands.<br />
PPP – the port accepts PPP connections only.<br />
SERIAL – data transmission and reception is controlled by the current job, using the 3SERIAL channel.<br />
MODBUS – the port receives and processes incoming serial Modbus requests.<br />
MODBUS_MASTER – the port is used for polling a Modbus sensor device, as specified in the current job using the<br />
3MODBUS channel.<br />
DISABLE – the port is disabled. This setting reduces power consumption.<br />
The remainder of this section will assume that the USB port function has been set to COMMAND.<br />
About DtUsb<br />
In order to use the <strong>DT80</strong>'s USB port, it is first necessary to install the dataTaker DtUsb driver software on your computer.<br />
Once DtUsb is installed, it provides two separate "interfaces" to allow application programs to communicate with the<br />
<strong>DT80</strong>.over USB:<br />
a TCP/IP interface, which allows full access to all of the <strong>DT80</strong>'s TCP/IP services, including the dEX web interface<br />
a secondary "virtual COM port" interface, where the USB port appears as a standard serial COM port. This allows<br />
applications such as DeTransfer to establish a serial connection to the logger over USB in the same way that they<br />
would using RS232 (although note that DeTransfer can also perform most of its functions over a TCP/IP interface)<br />
UM-0085-B2 <strong>DT80</strong> <strong>Series</strong> User’s <strong>Manual</strong> Page 160
PC<br />
Web Browser<br />
TCP/IP interface<br />
127.1.1.1<br />
<strong>DT80</strong><br />
DtUsb<br />
USB<br />
Port<br />
USB cable<br />
USB<br />
Port<br />
DeTransfer<br />
Applications<br />
COM port interface<br />
COM6<br />
Figure 57: Using DtUsb to communicate with the <strong>DT80</strong> over USB<br />
Note that only one of these interfaces can be active at any one time.<br />
By default, the TCP/IP interface will be active, so when the logger USB cable is plugged in, the logger will then become<br />
visible at IP address 127.1.1.1 (this address may vary).<br />
If, however, you shut down the TCP/IP part of DtUsb then the logger's virtual COM port (shown as COM6 in the diagram) will<br />
become available.<br />
In most cases, it is simpler and more flexible to perform all communications via the TCP/IP interface.<br />
Installing DtUsb<br />
DtUsb is supplied on the dataTaker Resource CD shipped with your logger. It may also be downloaded from the dataTaker<br />
web site, www.datataker.com.<br />
Note It is recommended that you install DtUsb before connecting the <strong>DT80</strong>'s USB cable to the computer.<br />
System Requirements<br />
DtUsb requires Windows XP or later. It also requires Microsoft .NET Version 2.0 or later. If you have Windows Vista or later<br />
then .NET should already be installed; it may also have been installed by another application on your computer. The DtUsb<br />
installation program will check whether .NET is present during installation.<br />
You will need administrator rights for your computer in order to install DtUsb. Once it is installed, a normal user account can<br />
be used.<br />
Installation Procedure<br />
The following procedure will install DtUsb on to your computer. Do not connect the <strong>DT80</strong>'s USB cable to the computer until<br />
instructed to do so.<br />
Note Depending on your Windows version, you may receive various prompts during the DtUsb installation processes<br />
requesting your permission to run software published by Thermo Fisher Scientific. Answer Yes or Continue to these.<br />
1. Ensure that you are logged in to your computer as an administrator.<br />
2. Insert the dataTaker Resource CD. The CD menu program (see below) should start automatically; if it doesn't then<br />
use Windows Explorer to locate DtAutoRun.exe on the CD and double click it.<br />
If you are installing from an installation package downloaded from the dataTaker website then save the downloaded<br />
package and double click to run it. Skip to Step 5.<br />
UM-0085-B2 <strong>DT80</strong> <strong>Series</strong> User’s <strong>Manual</strong> Page 161
3. Select <strong>DT80</strong> range...<br />
4. Select Install USB driver<br />
5. DtUsb actually consists of two parts: DtUsb Driver (the low level "plug and play" USB driver) and DtUsb (which<br />
provides the TCP/IP interface). Both of these will now be installed, starting with DtUsb Driver.<br />
Click Next<br />
UM-0085-B2 <strong>DT80</strong> <strong>Series</strong> User’s <strong>Manual</strong> Page 162
6. After the drivers have been copied to your computer a confirmation screen similar to the following will be displayed.<br />
Check that two green ticks are displayed.<br />
Click Finish<br />
7. The DtUsb installer will now start. If you are installing from the CD and do not have .NET 2.0 or later on your computer<br />
it will now be installed (after you accept the Microsoft license agreement), then the DtUsb installer will continue. (If you<br />
are using a downloaded DtUsb package then the installer will terminate if .NET is not present and you will need to<br />
obtain it from the Microsoft website.)<br />
Accept the DtUsb license agreement and click Install<br />
UM-0085-B2 <strong>DT80</strong> <strong>Series</strong> User’s <strong>Manual</strong> Page 163
8. Once DtUsb has been installed a confirmation screen will be displayed.<br />
Click Finish<br />
9. Now connect the <strong>DT80</strong> to the computer using the USB cable. This will trigger the Windows "plug and play" process to<br />
complete driver installation.<br />
You may notice a flurry of activity in the system tray area. The actual sequence of events depends on your operating<br />
system.<br />
For Windows XP, the drivers that you pre-installed in Step 5 will be automatically installed with a minimum of<br />
fuss. A couple of "New hardware found" balloon messages will appear, then finally it should say "Your new<br />
hardware is ready to use"<br />
For Windows Vista, you will be asked whether you want to locate and install driver software, or do nothing.<br />
Specify that you do want to locate and install drivers. It will then search for the drivers on Windows Update.<br />
Assuming you have a working internet connection, it should find the drivers there and install them. If not then the<br />
Windows Update search will time out and it will install the drivers that you pre-installed in Step 5. Eventually<br />
Windows should report that "Your new hardware is ready to use".<br />
For Windows 7, the initial prompt will be skipped and it will go straight to Windows Update. As with Vista, if this<br />
is successful then it will install the drivers it finds there, otherwise it will eventually time out and use the<br />
pre-installed drivers.<br />
Note that DtUsb Driver actually consists of two separate Windows drivers – a USB driver and a virtual COM port<br />
driver. You may therefore see the above "plug and play" process occur twice, once for each driver.<br />
10. Once the two parts of DtUsb Driver have been installed, DtUsb should notice that a logger has been connected. A new<br />
icon should appear in the system tray.<br />
11. DtUsb will now automatically launch your default web browser and display the dEX home page.<br />
12. If desired, you may now log off as administrator and log in as a normal user. DtUsb will be loaded automatically when<br />
any user logs in to the computer.<br />
Using DtUsb<br />
DtUsb is a background process, which is started automatically when any user logs in to the computer. It will, however, do<br />
nothing until a <strong>DT80</strong> is connected via USB.<br />
When a <strong>DT80</strong> is connected, DtUsb will:<br />
UM-0085-B2 <strong>DT80</strong> <strong>Series</strong> User’s <strong>Manual</strong> Page 164
establish a PPP connection to the logger over the USB link (PPP is a protocol that allows TCP/IP traffic to be passed<br />
over a point-to-point serial link)<br />
provide a local IP address, typically 127.1.1.1, which effectively becomes the <strong>DT80</strong>'s IP address.<br />
display the purple icon in the task bar, which will remain visible whilst the logger is connected<br />
optionally, automatically launch your default web browser and display the dEX home page<br />
Applications such as a web browser, FTP client, DeTransfer or a Modbus client can then connect to the logger's services<br />
using the 127.1.1.1 address, and DtUsb will forward their requests on to the logger.<br />
Note DtUsb assumes that all logger services are operating using their default port numbers. If you experience problems<br />
accessing a particular service, check the following <strong>DT80</strong> profile settings<br />
PROFILE COMMAND_SERVER PORT=7700<br />
PROFILE HTTP_SERVER PORT=80<br />
PROFILE MODBUS_SERVER TCPIP_PORT=502<br />
Remember also that the USB port function must be set to COMMAND (which is the default) in order for DtUsb to work, i.e.<br />
PROFILE USB_PORT FUNCTION=COMMAND<br />
DtUsb GUI<br />
For the most part, DtUsb is intended to be invisible – its main purpose is simply to provide a TCP/IP connection over USB so<br />
that dEX and other logger services can be accessed.<br />
However, DtUsb does include a simple graphical user interface (GUI). To access this, double click on the purple icon while a<br />
logger is connected. Alternatively, you can find a link to DtUsb on the Windows Start menu, in the dataTaker folder.<br />
The DtUsb GUI comprises three screen, selected by clicking on the tabs along the top. Each screen contains the same three<br />
buttons along the bottom:<br />
Quit will terminate DtUsb, which will mean that the logger's TCP/IP services will no longer be available. This should<br />
normally only be used if you wish to use the direct "COM port" interface to the logger, rather than the TCP/IP interface.<br />
Hide will close the GUI, but DtUsb will keep running. Closing the window with the red X button will do the same thing.<br />
Apply will apply any changes you have made on the Configuration tab.<br />
Loggers Screen<br />
Figure 58: Main DtUsb screen<br />
The Loggers tab shows a list of all connected loggers, along with their IP addresses and the port numbers to use to access<br />
their services.<br />
For the HTTP (web) and FTP services, links are provided which will open a web browser window. The HTTP link will display<br />
the dEX home page, while the FTP link will display the web browser's inbuilt FTP client, allowing you to browse the logger's<br />
file system.<br />
To access the command server (e.g. in DeTransfer) you would create a connection using the indicated IP address and port<br />
number (127.1.1.1 port 7700 in this case). To access the <strong>DT80</strong> Modbus server you would enter a similar thing into your<br />
Modbus client application.<br />
Note that the port numbers may not necessarily be the "normal" ones shown in the example. For example, if there is a web<br />
or FTP server running on your PC then DtUsb will automatically assign different port numbers in order to avoid conflicts – for<br />
example, port 81 instead of port 80 for the web interface.<br />
UM-0085-B2 <strong>DT80</strong> <strong>Series</strong> User’s <strong>Manual</strong> Page 165
Configuration Screen<br />
Figure 59: DtUsb Configuration Screen<br />
This screen allows you to select<br />
<br />
<br />
whether the dEX home page is automatically launched each time a logger is plugged in<br />
the base IP address that DtUsb presents to other applications. This would only need to change if there was some sort<br />
of conflict with other software on your computer.<br />
Sleep Mode<br />
If the <strong>DT80</strong> enters low power sleep mode then its USB interface will be reset. To the host computer, it will look like the USB<br />
cable has been unplugged, so the configured COM port will disappear.<br />
When the <strong>DT80</strong> wakes, the PC will detect that a USB device has been connected, and re-create the COM port. The<br />
application that was using the COM port will, however, most likely not automatically re-connect. For example, DeTransfer<br />
and DeLogger will require you to manually re-establish a connection.<br />
For this reason it is recommended that the logger not be allowed to go to sleep while the USB cable is connected. By default,<br />
low power sleep mode is automatically disabled if a USB cable is connected.<br />
RS-232 Communications<br />
Direct RS-232 Connection<br />
For applications where the <strong>DT80</strong> is to be directly connected to a nearby computer, USB is normally the preferred<br />
communications medium. However, you may wish to use a direct RS232 connection if:<br />
<br />
<br />
<br />
your computer has no available USB ports<br />
you need the <strong>DT80</strong> to go into low power sleep mode between scans, and you want to continue to receive real-time<br />
data returns; or you want to be able to wake the <strong>DT80</strong> by sending a character (See Sleep Mode (P229))<br />
the required cable length is longer than about 5 metres.<br />
Normally the <strong>DT80</strong>'s host RS232 port (P168) is used when making a direct RS232 connection to a host computer. However<br />
the serial sensor port (P169) can also be used.<br />
To set up a direct RS232 connection you will need a "cross-over", or "null-modem" cable. Suitable cables may be ordered for<br />
this purpose (dataTaker product code IBM-6 for host port connection, or CAB-015 for serial sensor port). See Cables (P317)<br />
for wiring information.<br />
It is also possible to use a simpler 3-wire cable (RXD, TXD and GND) although this will mean that hardware flow control is not<br />
possible.<br />
If your computer has no RS232 ports (as is the case for many laptop models) a USB to serial adapter may be used.<br />
Cable Length<br />
Although the RS-232 standard specifies a cable of not more than 4 metres (15 feet), longer cables can be used. It’s possible<br />
to use RS-232 cable runs of 100 metres or more, but to achieve reasonably error-free communication these generally need<br />
to have heavier wires and a slower baud rate may be necessary.<br />
UM-0085-B2 <strong>DT80</strong> <strong>Series</strong> User’s <strong>Manual</strong> Page 166
RS-232 Flow Control<br />
Flow control (or handshaking) is the means by which communicating devices (such as the <strong>DT80</strong> and a host computer)<br />
control each other’s transmission of characters to avoid data loss. The receiver uses flow control to disable transmissions by<br />
the sender if the receiver’s input buffer is at risk of overflowing and thereby losing data.<br />
The <strong>DT80</strong> supports all methods of flow control:<br />
<br />
<br />
<br />
Software flow control (also known as XON/XOFF flow control)<br />
Hardware flow control (also known as RTS/CTS flow control)<br />
No flow control<br />
Software Flow Control<br />
In this mode, the receiver controls the flow of characters by transmitting<br />
the XOFF character (ASCII 19) to stop the sender from sending further characters<br />
the XON character (ASCII 17) to allow the sender to resume sending characters.<br />
If the <strong>DT80</strong> receives an XOFF character, it will stop transmission within two character periods. If no XON is received within<br />
60 seconds (see P26 (P199)) the <strong>DT80</strong> will resume transmitting anyway.<br />
Hardware Flow Control<br />
With hardware flow control, the transmission of characters is managed by the RTS (Request To Send) and CTS (Clear To<br />
Send) signals. For a DTE device such as a computer or the <strong>DT80</strong>:<br />
the RTS signal is an output; the device activates this signal while it is able to receive data<br />
the CTS signal is an input; the device will only transmit if this signal is active.<br />
So if a computer and the <strong>DT80</strong> are set up to communicate using hardware flow control, then the RTS and CTS lines must be<br />
"crossed over". Thus when one end deactivates its RTS signal then the other will see its CTS signal deactivate, causing it to<br />
stop transmitting.<br />
The <strong>DT80</strong> communications cable (product code IBM-6) has the RTS/CTS lines connected in this crossover manner – see<br />
Host Port null modem cable (P317).<br />
Note that for a DCE device (e.g. a modem), the RTS and CTS functions are swapped (as are the TXD and RXD pins). This<br />
allows a "straight through" cable to be used when connecting a <strong>DT80</strong> to a modem.<br />
Hardware flow control is inherently more reliable than software flow control, because the flow control state (send/don't send)<br />
is continuously indicated by the hardware signals. Software flow control can get into difficulties if line noise causes an XON<br />
or XOFF character to be lost, for example.<br />
Hardware flow control is therefore the preferred method. It is not, however, the default because it can only be used if the<br />
cable is wired appropriately and the host computer is configured to use hardware flow control. (In this sense software flow<br />
control is a little more "forgiving").<br />
If the RS232 cable is accidentally disconnected, the <strong>DT80</strong> will no longer see CTS active, so it will stop transmitting. If,<br />
however, this condition persists for more than 60 seconds (see P26 (P199)), the <strong>DT80</strong> will conclude that the host computer is<br />
no longer connected and will stop trying to transmit, until CTS again becomes active.<br />
No Flow Control<br />
The <strong>DT80</strong> can also be set to use no flow control, in which case there is no control of the sender by the receiver. Use this<br />
setting with care, and only where there is no risk of the receiver being over-run by excess data from the sender, otherwise<br />
data loss will occur.<br />
Sleep Mode<br />
If the <strong>DT80</strong> is in low power sleep mode, it can be woken by sending a character to the RS232 port (either host port or serial<br />
sensor port). Note, however, that the character that was sent will be discarded, if other characters are sent immediately<br />
afterwards they may be discarded, too.<br />
It is recommended that the <strong>DT80</strong> be woken by sending a CR character, then waiting at least 500ms before sending any<br />
commands. (Note that the "Wakeup Required" option in DeTransfer can be used to automatically prefix all commands by the<br />
abovementioned wakeup sequence.)<br />
Note that only the RS232 ports can be used to wake the <strong>DT80</strong> in this way, because when the <strong>DT80</strong> goes to sleep any<br />
Ethernet or USB connections are terminated.<br />
This also means that the RS232 port can be used to monitor real time data returns where the <strong>DT80</strong> is configured to go to<br />
sleep between scheduled scans – something which is not possible with the USB or Ethernet port.<br />
UM-0085-B2 <strong>DT80</strong> <strong>Series</strong> User’s <strong>Manual</strong> Page 167
Host RS-232 Port<br />
The <strong>DT80</strong> has a 9-pin male connector for RS-232 serial communication to a computer or modem. The port is configured as<br />
a DTE (Data Terminal Equipment) device, and the pinout is the same as that used on a PC. See RS-232 (P317) for more<br />
details.<br />
Configuring the Host RS-232 Port<br />
There are three parameters that need to be set for any RS232 port, and the <strong>DT80</strong>'s port is no exception:<br />
baud rate (data transfer rate in bits per second) <strong>DT80</strong> default is 57600.<br />
<br />
<br />
serial framing format (number of data bits, parity type, number of stop bits) <strong>DT80</strong> default is "N,8,1" – no parity, 8 data<br />
bits, 1 stop bit.<br />
flow control (mechanism for one computer to tell the other to stop sending) <strong>DT80</strong> default is software flow control<br />
(special characters are used to signal "stop" and "go").<br />
It is essential that both ends of an RS232 link be configured identically – same baud rate, framing and flow control.<br />
A fourth parameter that needs to be set for the <strong>DT80</strong> host port is the port function, which specifies the protocol used by the<br />
port – command, PPP, Modbus or generic serial.<br />
PROFILE Settings<br />
To view the current host port settings use the following command:<br />
PROFILE HOST_PORT<br />
[HOST_PORT]<br />
BPS = 57600<br />
DATA_BITS = 8<br />
STOP_BITS = 1<br />
PARITY = NONE<br />
*FLOW = HARDWARE<br />
FUNCTION = COMMAND<br />
which lists the current baud rate, framing format, flow control and port function. An asterisk indicates a non-default setting.<br />
See Profile Settings (P202)) for more details.<br />
If required, these settings can be changed using individual PROFILE commands, i.e.:<br />
PROFILE HOST_PORT key=value<br />
The following keys are defined:<br />
Key Value Default<br />
BPS<br />
baud rate. Use 300, 600, 1200, 2400, 4800, 9600, 19200, 38400, 57600 or 57600<br />
115200.<br />
DATA_BITS can be 7 or 8 8<br />
STOP_BITS can be 1 or 2 1<br />
PARITY can be N (none), O (odd) or E (even) N<br />
FLOW<br />
NONE (no flow control)<br />
SOFTWARE<br />
SOFTWARE (XON/XOFF)<br />
HARDWARE (RTS/CTS)<br />
FUNCTION port function (see below) COMMAND<br />
For example, the following commands would configure the host port for serial connection to a Modbus client (e.g. a SCADA<br />
system), using the "standard" Modbus settings (19200 baud, 8 data bits, 1 stop bit, even parity, no flow control):<br />
PROFILE HOST_PORT BPS=19200<br />
PROFILE HOST_PORT PARITY=EVEN<br />
PROFILE HOST_PORT FLOW=NONE<br />
PROFILE HOST_PORT FUNCTION=MODBUS<br />
Note that these settings, as with all profile settings, will temporarily revert to default settings in the event of a "triple push"<br />
reset, see Safe Mode (P209)).<br />
Note Do not use software flow control (SWFC) if the port is using a binary (non-ASCII) protocol, such as Modbus or PPP or<br />
some serial sensor protocols. This is because flow control characters (XON/XOFF) may legitimately appear in binary data,<br />
and if they do then they will be stripped out. This will cause data errors.<br />
Port Function<br />
The possible settings for the host port FUNCTION parameter are:<br />
COMMAND (default) – the port accepts <strong>DT80</strong> commands sent directly over the serial interface. The port will<br />
automatically switch to PPP mode if an incoming PPP connection is detected. When the PPP connection is closed the<br />
port will go back to accepting direct commands.<br />
UM-0085-B2 <strong>DT80</strong> <strong>Series</strong> User’s <strong>Manual</strong> Page 168
PPP – the port accepts PPP connections only.<br />
SERIAL – the port is controlled by the current job, using the 2SERIAL channel.<br />
MODBUS – the port receives and processes incoming serial Modbus requests.<br />
MODBUS_MASTER – the port is used for polling a Modbus sensor device, as specified in the current job using the<br />
2MODBUS channel.<br />
DISABLE – the port is disabled. This setting reduces power consumption.<br />
Temporary Settings<br />
The Host RS232 communications parameters can also be temporarily set by the command<br />
PH=baud,parity,databits,stopbits,flow-control<br />
where:<br />
Parameter Settings Default<br />
baud is the required baud rate. Use 300, 600, 1200, 2400, 4800, 9600, 19200, 38400, 57600<br />
57600 or 115200.<br />
parity can be N (none), O (odd) or E (even) N<br />
databits can be 7 or 8 8<br />
stopbits can be 1 or 2 1<br />
flow-control NOFC (no flow control)<br />
SWFC<br />
SWFC (software flow control, i.e. XON/XOFF)<br />
HWFC (hardware flow control, i.e. RTS/CTS)<br />
These parameters may be specified in any order and all are optional. Note that the port function cannot be set using this<br />
command.<br />
For example, the command<br />
PH=115200,HWFC<br />
sets the RS232 port to 115200 baud, no parity, 8 data bits, 1 stop bit, and hardware flow control.<br />
These settings will be reset to their defaults by a hard reset (e.g. SINGLEPUSH).<br />
You can also check the <strong>DT80</strong>'s current RS232 parameters using the PH command, e.g.:<br />
PH<br />
RS232,57600,N,8,1,SWFC<br />
Serial Sensor Port<br />
(Not applicable to DT81/82E)<br />
The <strong>DT80</strong> serial sensor port is normally used to control serial sensor devices. It is, however, a general purpose serial port<br />
which is largely equivalent in functionality to the host RS232 port.<br />
The <strong>DT80</strong> serial sensor port:<br />
can be configured for either the RS-232, RS-422 or RS-485 comms standard. RS-232 supports a single point-to-point<br />
connection; the other standards support multiple devices in a multi-drop configuration (for certain protocols).<br />
has a differential transmitter and receiver that provide for the different serial standards<br />
has RTS/CTS handshake lines (RS232 only)<br />
supports baud rates of 300 to 57600 baud<br />
supports the serial command, serial Modbus, PPP and generic serial protocols<br />
does not provide any modem control functions<br />
Connecting to the Serial Sensor Port<br />
The <strong>DT80</strong> serial sensor port terminals have different functions depending upon the configured serial standard (RS232,<br />
RS422 or RS485).<br />
Terminal RS232 RS422 RS485 Wake<br />
Tx Transmit Data Transmit Data– (A) Data– (A)<br />
Z<br />
Rx Receive Data Receive Data+ (B)<br />
A<br />
<br />
RTS Handshake output Transmit Data+ (B) Data+ (B)<br />
Y<br />
CTS Handshake input Receive Data– (A)<br />
B<br />
<br />
UM-0085-B2 <strong>DT80</strong> <strong>Series</strong> User’s <strong>Manual</strong> Page 169
D<br />
GND<br />
Signal Ground Ground Ground<br />
Figure 60: The <strong>DT80</strong>’s Serial Channel terminals (DTE)<br />
Note that:<br />
<br />
<br />
<br />
The RTS and CTS handshake/control signals are available for RS232 only<br />
The DGND terminal is the signal return (common) for RS232. RS422/485 use differential signalling – the ground is not<br />
used as a reference, but it should still be connected to avoid excessive common mode voltages.<br />
Activity on either of the indicated terminals (i.e. Rx/A and CTS/B) will wake the logger from sleep mode, although the<br />
data in the particular message that woke the logger will be lost. Note also that if the Wake feature is required and<br />
RS485 is being used then it will be necessary to link the Data terminals (Tx/Z and RTS/Y) to the wake-enabled<br />
terminals (Rx/A and CTS/B).<br />
RS232 Connection<br />
The serial sensor port is wired as a DTE device so the data lines must be "crossed over" when connecting to another DTE<br />
device. That is, the <strong>DT80</strong>'s Tx output connects to the sensor's RxD input, and vice versa.<br />
The handshaking signals, if used, must also be crossed over, i.e. RTS connects to CTS and vice versa.<br />
RS232<br />
Device<br />
RxD<br />
TxD<br />
CTS<br />
RTS<br />
GND<br />
Tx Z<br />
Rx<br />
A<br />
RTS<br />
Y<br />
CTS<br />
B<br />
D<br />
GND<br />
Figure 61: Serial sensor port RS232 connection. RTS/CTS connections are optional.<br />
A cable suitable for connecting the <strong>DT80</strong> serial sensor port to a PC serial port may be ordered (dataTaker part number<br />
CAB-015). See also Serial Sensor Port null modem cable (P318).<br />
RS422 Connection<br />
RS422 allows for multi-drop connection, where one or more sensors are connected in parallel. The <strong>DT80</strong> is typically the<br />
"master" device in the network and is therefore wired so that its transmissions will be received by all slave devices. The<br />
slaves' transmit lines are all tied together, which means that only one slave is permitted to transmit at any one time. It is up to<br />
the communications protocol to ensure that this is the case – typically each slave will be assigned a unique address and will<br />
only respond if it receives a request from the master that is addressed to it.<br />
RS422 uses full duplex differential signalling: two wires for transmit (Y and Z) and two wires for receive (A and B). Be sure<br />
to observe the correct signal polarity, as shown in the diagram. Some devices label their terminals as A or B, some as + or –.<br />
T+<br />
(B)<br />
T- R+ R-<br />
(A) (B) (A)<br />
G<br />
N<br />
D<br />
RS422<br />
Slave Device<br />
T+<br />
(B)<br />
T- R+ R-<br />
(A) (B) (A)<br />
G<br />
N<br />
D<br />
RS422<br />
Slave Device<br />
Tx Z<br />
Rx<br />
A<br />
RTS<br />
Y<br />
CTS<br />
B<br />
D<br />
GND<br />
Figure 62: Serial sensor port RS422 connection, assuming that the <strong>DT80</strong> is the designated master device.<br />
RS485 Connection<br />
RS485 uses half duplex differential signalling: there is just one pair of wires, which is used for both transmit and receive. Be<br />
sure to observe the correct signal polarity, as shown in the diagram. Some devices label their terminals as A or B, some as<br />
+ or –.<br />
Notice that with RS485, all devices including the <strong>DT80</strong> are wired symmetrically: there is no distinction between "master" and<br />
"slave", at least from a wiring perspective.<br />
An RS485 network should normally be cabled as a single linear "backbone", with relatively short "stub" connections to each<br />
device. For long cable runs or high baud rates a 100Ω termination resistor at each end of the main cable is recommended.<br />
UM-0085-B2 <strong>DT80</strong> <strong>Series</strong> User’s <strong>Manual</strong> Page 170
100Ω<br />
- +<br />
(A) (B)<br />
G<br />
N<br />
D<br />
RS485 Device<br />
- +<br />
(A) (B)<br />
G<br />
N<br />
D<br />
RS485 Device<br />
100Ω<br />
Tx Z<br />
Rx<br />
A<br />
RTS<br />
Y<br />
CTS<br />
B<br />
D<br />
GND<br />
Figure 63: Serial sensor port RS485 connection<br />
Configuring the Serial Sensor Port<br />
The following parameters need to be set for the serial sensor port:<br />
<br />
port mode (RS232, RS422 or RS485) – default is RS232.<br />
baud rate (data transfer rate in bits per second) – default is 1200.<br />
<br />
<br />
<br />
serial framing format (number of data bits, parity type, number of stop bits) – default is "N,8,1", i.e. no parity, 8 data<br />
bits, 1 stop bit.<br />
flow control (mechanism for one computer to tell the other to stop sending) – default is no flow control.<br />
port function (protocol to be used: command, PPP, Modbus or generic serial) – default is generic serial.<br />
PROFILE Settings<br />
To view the current serial sensor port settings use the following command:<br />
PROFILE SERSEN_PORT<br />
[SERSEN_PORT]<br />
*BPS = 9600<br />
DATA_BITS = 8<br />
STOP_BITS = 1<br />
PARITY = NONE<br />
FLOW = NONE<br />
MODE = RS232<br />
FUNCTION = SERIAL<br />
which lists the current baud rate, framing format, flow control, port mode and port function. An asterisk indicates a<br />
non-default setting. See Profile Settings (P202)) for more details.<br />
If required, these settings can be changed using individual PROFILE commands, i.e.:<br />
PROFILE SERSEN_PORT key=value<br />
The following keys are defined:<br />
Key Value Default<br />
BPS baud rate. Use 300, 600, 1200, 2400, 4800, 9600, 19200, 38400 or 57600. 1200<br />
DATA_BITS can be 7 or 8 8<br />
STOP_BITS can be 1 or 2 1<br />
PARITY can be N (none), O (odd) or E (even) N<br />
FLOW NONE (no flow control)<br />
NONE<br />
SOFTWARE (XON/XOFF)<br />
HARDWARE (RTS/CTS)<br />
MODE signal standard: RS232, RS422 or RS485 RS232<br />
FUNCTION port function (see below) SERIAL<br />
If required, these settings can be changed using individual PROFILE commands. See Profile Settings (P202)) for details on<br />
the possible values for these settings.<br />
For example, the following commands would configure the serial sensor port for the control of serial sensor devices on an<br />
RS485 network, running at 38400 baud<br />
PROFILE SERSEN_PORT BPS=38400<br />
PROFILE SERSEN_PORT MODE=RS485<br />
Note Do not use software flow control (SWFC) if the port is using a binary (non-ASCII) protocol, such as Modbus or PPP or<br />
some serial sensor protocols. This is because flow control characters (XON/XOFF) may legitimately appear in binary data,<br />
and if they do then they will be stripped out. This will cause data errors.<br />
UM-0085-B2 <strong>DT80</strong> <strong>Series</strong> User’s <strong>Manual</strong> Page 171
Port Function<br />
The possible settings for the serial sensor port FUNCTION parameter are:<br />
<br />
<br />
<br />
<br />
<br />
<br />
SERIAL (default) – the port is controlled by the current job, using the 1SERIAL channel.<br />
COMMAND – the port accepts <strong>DT80</strong> commands sent directly over the serial interface. The port will automatically switch<br />
to PPP mode if an incoming PPP connection is detected. When the PPP connection is closed the port will go back to<br />
accepting direct commands.<br />
PPP – the port accepts PPP connections only.<br />
MODBUS – the port receives and processes incoming serial Modbus requests.<br />
MODBUS_MASTER – the port is used for polling Modbus sensor devices, as specified in the current job using the<br />
1MODBUS channel.<br />
DISABLE – the port is disabled. This setting reduces power consumption.<br />
Temporary Settings<br />
The serial sensor port communications parameters can also be temporarily set by the command<br />
PS=mode,baud,parity,databits,stopbits,flow-control<br />
where:<br />
Parameter Settings Default<br />
mode specifies the signal standard: RS232, RS422 or RS485 RS232<br />
baud is the baud rate. Use 50, 75, 110, 150, 300, 600, 1200, 2400, 4800, 9600, 1200<br />
19200, 38400 or 57600.<br />
parity can be N (none), O (odd) or E (even) N<br />
databits can be 7 or 8 8<br />
stopbits can be 1 or 2 1<br />
flow-control NOFC (no flow control)<br />
NOFC<br />
SWFC (software flow control – RS232/RS422 only)<br />
HWFC (hardware flow control – RS232 only)<br />
These parameters may be specified in any order and all are optional. Note that the port function cannot be set using this<br />
command.<br />
For example, the command<br />
PS=RS485,9600<br />
sets the port to RS485 mode, 9600 baud.<br />
These settings will be reset to their defaults by a hard reset (e.g. SINGLEPUSH).<br />
You can also check the <strong>DT80</strong>'s current serial sensor port parameters using the PS command, e.g.:<br />
PS<br />
RS232,1200,N,8,1,NOFC<br />
Modem Communications<br />
Modem (Remote) RS-232 Connection<br />
Another common way of communicating with the <strong>DT80</strong> is to connect its Host RS-232 port to a wired or wireless modem,<br />
which communicates with another modem connected to the host computer at the other end of the comms link. This way, the<br />
<strong>DT80</strong> can be across town or across the world from the host computer, and the link can use PSTN (landline), radio, GSM<br />
(cellular) or satellite communication. This is known as a modem connection to a remote <strong>DT80</strong>.<br />
PC<br />
<strong>DT80</strong><br />
Serial<br />
(COM)<br />
Port<br />
Modem<br />
Phone<br />
Network<br />
Modem<br />
Host<br />
RS232<br />
Port<br />
Figure 64: Modem connection<br />
The "phone network" cloud in the diagram could be:<br />
a dedicated wired or wireless link, e.g. a leased line or a dedicated radio link<br />
UM-0085-B2 <strong>DT80</strong> <strong>Series</strong> User’s <strong>Manual</strong> Page 172
the public switched telephone network (PSTN)<br />
a cellular or satellite mobile network.<br />
The <strong>DT80</strong> supervises the modem using standard Hayes-compatible "AT" commands. Certain command strings are<br />
configurable, to allow the widest possible range of modems to be supported.<br />
The <strong>DT80</strong> can also control the modem’s power supply. If this facility is used, the <strong>DT80</strong> can automatically reset the modem if<br />
it determines that this is necessary. See Powering the <strong>DT80</strong>’s Modem (P175).<br />
Automatic Modem Detection<br />
A <strong>DT80</strong> uses the state of its Host RS-232 port’s DSR terminal to determine whether a modem is connected to the port. (DSR<br />
= "Data Set [i.e. modem] Ready")<br />
If the DSR terminal is not held active by the connected device, the <strong>DT80</strong> assumes that it’s connected directly to the host<br />
computer and operates accordingly.<br />
If the <strong>DT80</strong>’s DSR terminal is held active by the connected device, the <strong>DT80</strong> assumes that it’s connected to a modem and<br />
operates accordingly, initialising the modem, monitoring other Host RS-232 lines to determine when a modem connection to<br />
the host computer has been established, and so on.<br />
<strong>DT80</strong>-to-Modem Cable<br />
As discussed above, for the <strong>DT80</strong> to recognise that it’s connected to a modem and operate accordingly, the <strong>DT80</strong> must see<br />
the signal at the DSR terminal (pin 6 of the <strong>DT80</strong>'s host RS232 port) as active. There are two ways to ensure this:<br />
Connect the <strong>DT80</strong>’s Host RS-232 port to a modem using a straight-through comms cable, as shown in Host Port<br />
modem cable (P317). This will connect the <strong>DT80</strong>'s DSR input to the modem's DSR output. Nearly all modems will drive<br />
the DSR signal active while they are switched on.<br />
If a modem is being used that does not drive its DSR line active when turned on, you can hardwire DSR to DTR at the<br />
<strong>DT80</strong> end of the modem cable. This simulates an active DSR terminal, convincing the <strong>DT80</strong> that it’s connected to a<br />
modem.<br />
The cable will also require the following signals to be connected through to the modem:<br />
RTS and CTS signals, to allow hardware flow control (see RS-232 Flow Control (P169))<br />
DCD signal, to allow the <strong>DT80</strong> to detect when the modem is on-line (see Modem Communications Operation (P175)).<br />
Modem Initialisation<br />
Configuring Your Modem<br />
Modems are highly configurable devices with many different parameters that can be adjusted. To make this long list of<br />
parameters easier to manage, modems normally support a number of different configuration profiles. Each profile consists<br />
of a complete set of parameter values. As a minimum, there would be a fixed factory settings profile, and a<br />
user-configurable default profile. The default profile's settings are automatically loaded when the modem is reset or<br />
powered up.<br />
Although the <strong>DT80</strong> includes support for automatically sending initialisation commands to the modem, it is recommended that<br />
you fully pre-configure the modem, and write the configuration to the modem's default profile, before connecting it to the<br />
<strong>DT80</strong>. This ensures that whenever the modem resets due to power loss or other reason it will start with the correct<br />
configuration.<br />
Sending Modem Commands<br />
Refer to your modem's user's manual for information on how to go about pre-configuring the modem. This is usually done by<br />
connecting the modem to a PC serial port and running a terminal program such as Hyperterminal or DeTransfer so that you<br />
can then send "AT" commands to configure the modem.<br />
You can also use the SSDIRECT command (see Serial Sensor Direct Mode (P284)) to configure a modem that is already<br />
connected to the host port of the <strong>DT80</strong>. To use this feature, connect to the <strong>DT80</strong> using the USB or Ethernet port, then send<br />
the command<br />
SSDIRECT 2<br />
to enable Serial Sensor Direct Mode. You can now interact with a modem attached to the host RS232 port. for example, you<br />
can sent AT commands and see its responses (assuming the modem is in command mode). When you're done, enter<br />
ENDSSDIRECT.<br />
Recommended Option Settings<br />
The following is a list of items that should be set in the modem's default profile. You should check your modem user's manual<br />
to determine the exact command to use for each setting.<br />
It is recommended that you start by resetting the modem to its factory defaults so that you have a known starting point. This<br />
is particularly important if someone else has used the modem before and you are uncertain of the settings used. For most<br />
modems the AT&F command will load the factory default profile. After this command has been issued, you can then set all<br />
other settings as detailed below and as required for your specific application.<br />
UM-0085-B2 <strong>DT80</strong> <strong>Series</strong> User’s <strong>Manual</strong> Page 173
DSR always on: The DSR (data set ready) signal from the modem must be active while the modem is turned on, as<br />
this is how the logger determines that a modem is connected. Most modems do this by default, if not then you must set<br />
the modem do this (typically by using the command AT&S0). If the modem cannot be configured to operate in this way<br />
then the logger must be tricked by connecting DSR to DTR at the logger side, but this should be done as a last resort<br />
as it is not as robust a method. It is important for the logger to know that a modem is connected so that it can avoid<br />
sending normal data output to the modem when the modem is in command mode.<br />
DCD follows carrier state: The DCD (data carrier detect) signal must be set to follow the carrier state, as this is how<br />
the logger determines when a connection has been established with another modem. Most modems do this by default,<br />
if not then you must set the modem to do this (typically using the command AT&C1).<br />
Hardware flow control: We recommend that you always use hardware flow control on the modem and the logger. For<br />
most modems this is the default. It is typically set using the AT&K3 command.<br />
Force reliable (error correcting protocol) mode: You should ensure that the modem connection always uses an<br />
error correcting protocol such as LAPM or MNP. This is required to ensure the flow control information is passed<br />
between the logger and PC based application as well as to eliminate line errors that may corrupt the data<br />
transmission. If an error correcting protocol is not used then line errors and flow control problems can cause data loss.<br />
Many modems will fall back to a non error correcting mode if an error correcting protocol cannot be agreed with the<br />
other modem. This should be avoided as it can cause data loss. Many PSTN modems can be set to force reliable<br />
mode using the AT\N2 command. That is, they will not connect at all if an error correcting protocol is unavailable.<br />
Auto answer: The <strong>DT80</strong> does not issue any commands to the modem to answer a call. Therefore, if dial-in<br />
functionality is required, the modem must be set to auto-answer incoming calls. For most modems the command<br />
ATS0=4 will set the modem to auto-answer incoming calls after 4 rings. This setting may be omitted if you do not<br />
need dial-in functionality, in which case the modem will ignore incoming calls.<br />
Don’t echo commands: Most modems will echo incomming commands. This is not desirable when used with a <strong>DT80</strong><br />
as the echo may be treated as a command by the logger which will only confuse it. For most modems the command<br />
ATE0 will turn off echo of modem commands.<br />
Quiet mode: Most modems will issue messages whenever a command is sent to the modem or a connection is made<br />
or dropped. This is not desirable when used with a <strong>DT80</strong> as the message may be treated as a command by the logger<br />
which will only confuse it. For most modems the command ATQ1 will disable the output of such messages.<br />
DTR hangup: Whenever the logger wants to hang up a connection it will set the DTR (data terminal ready) signal to<br />
inactive. The modem should be set such that it will drop the connection whenever it sees DTR inactive. This behaviour<br />
can be set for most modems with the command AT&D2.<br />
Fixed local baud rate. Most modems will set their local baud rate automatically ("autobaud") to match that of the<br />
connected device, once it sees an AT command from the device. Some modems, such as some GSM/CDMA<br />
modems, will only autobaud up to a particular maximum rate (such as 19200). To use rates above this you must set<br />
the baud rate to a fixed value using a command to the modem. The way to control this varies considerably across<br />
modems. For example on some modems the command AT#BDR can be used to fix the local baud rate.<br />
To ensure reliable communications with the modem under all conditions it is in fact recommended that you always fix<br />
the modem's baud rate. This should be set to match the baud rate of the <strong>DT80</strong>'s host serial port (by default 57600). If<br />
the modem's baud rate cannot be set then you need to ensure that the logger's modem initialisation string (P175)<br />
contains at least one AT command so that the modem can autobaud when it is sent.<br />
Application specific settings. You may need to set other settings in the modem that are particular to your<br />
application.<br />
After entering the required configuration settings, it is necessary to tell the modem to store them into its default profile. This<br />
is normally done using the AT&W command.<br />
To verify that the settngs have been set correctly, power cycle the modem and then send the AT&V command to output the<br />
current settings and check that the initialisation commands above have been set for the active profile.<br />
Example<br />
The following initialisation commands are suitable for PSTN modems that use a Rockwell chipset. They may be suitable for<br />
other types as well. Please check the modem's users manual to confirm that it supports all the AT commands specified here<br />
before using these commands.<br />
AT&F<br />
ATE0Q1&D2S0=4&C1&S0\N2%C2&K3#BDR=24<br />
AT&W<br />
Note If DeTransfer is used to send these commands to the modem then the \ character must be entered as \\. Also note<br />
that because these incantations include a command to fix the baud rate to 57600, the terminal program must be set to 57600<br />
baud, otherwise the subsequent command (AT&W) would not be recognised.<br />
The above AT commands decode as follows:<br />
Command<br />
&F<br />
E0<br />
Q1<br />
&D2<br />
Description<br />
set all parameters to factory defaults<br />
no echo<br />
quiet mode (no messages)<br />
hang up if DTR inactive<br />
UM-0085-B2 <strong>DT80</strong> <strong>Series</strong> User’s <strong>Manual</strong> Page 174
S0=4 auto-answer after 4 rings<br />
&C1<br />
DCD follows carrier<br />
&S0<br />
DSR always on<br />
\N2 don't connect unless error correction is active<br />
%C2 enable V42bis data compression<br />
&K3<br />
enable hardware flow control (RTS/CTS)<br />
#BDR=24<br />
set baud rate to 57600 (24 x 2400) – disable autobaud<br />
&W<br />
write settings to default profile<br />
Modem Initialisation String<br />
The <strong>DT80</strong> automatically attempts to initialise the device attached to its Host RS-232 port when it first detects the DSR signal<br />
as active and in certain other circumstances. This is done by sending the initialisation string specified by the INIT profile<br />
key (HOST_MODEM section, see Profile (P202))<br />
The modem should already have been pre-configured (see Configuring Your Modem (P173)), so the recommended<br />
initialisation string is simply AT, which is the default.<br />
Sending AT will ensure that the modem can autobaud, if it has been configured to do so.<br />
Powering the <strong>DT80</strong>’s Modem<br />
If required, the <strong>DT80</strong> can control power to the modem, so that it can be powered down under program control when not in<br />
use.<br />
This can be done using either:<br />
<br />
<br />
<br />
the RELAY output – see DO5 – Latching Relay Output (P264); use 1RELAY=1 to switch on modem power,<br />
1RELAY=0 to turn off, or<br />
one of the digital outputs 1D-4D driving an external relay – see DO1 – Driving a Relay (P263); use 1DSO=0 to switch<br />
modem power on, 1DSO=1 to turn off, or<br />
the 12V power output (<strong>DT80</strong>/81 <strong>Series</strong> 2 and DT85 only), provided that the modem draws no more than 150mA.<br />
Automatic Modem Power-Down Reset<br />
The <strong>DT80</strong> provides an additional feature where the modem can be automatically reset (by removing and re-applying power)<br />
if it appears to be unresponsive – that is, it has been off-line (i.e. not connected to the remote modem) for a long period of<br />
time (12 hours, by default – set this using the MAX_CD_IDLE profile key).<br />
To enable this feature, send one of the following PROFILE commands:<br />
If the modem is powered from one of the <strong>DT80</strong>’s digital output channels n (where n = 1 to 4), send the command<br />
PROFILE HOST_MODEM EXT_POWER_SWITCH=nDSO<br />
If the modem is powered via the <strong>DT80</strong>’s relay channel, send the command<br />
PROFILE HOST_MODEM EXT_POWER_SWITCH=1RELAY<br />
If the modem is powered via the DT85's 12V power output, send the command<br />
PROFILE HOST_MODEM EXT_POWER_SWITCH=1SSPWR<br />
If the modem is not powered by either of the above, send the command<br />
PROFILE HOST_MODEM EXT_POWER_SWITCH=NONE<br />
to disable the feature.<br />
From then on, the <strong>DT80</strong> will automatically cycle the modem power if it detects it to be unresponsive. It will then send the<br />
configured modem initialisation string.<br />
Modem Communications Operation<br />
Dialling In<br />
As the modem is initialised to automatically answer incoming calls, the <strong>DT80</strong> does not have to monitor the RI signal at its<br />
Host RS-232 port or request the modem to answer the call. But the <strong>DT80</strong> does have to monitor the DCD signal to determine<br />
when a call has been established.<br />
The <strong>DT80</strong> does not communicate via the RS232 host port unless it determines that a call has been established between<br />
itself and a host. When a modem is attached (DSR active), the <strong>DT80</strong> monitors the DCD signal to determine when it can<br />
transmit data and status information, and receive commands:<br />
When DCD is active the <strong>DT80</strong> accepts commands, and returns data and status information – exactly as it would for a<br />
direct connection.<br />
When DCD is inactive the <strong>DT80</strong> ignores any received characters and does not transmit data or status information.<br />
This behaviour ensures that any rubbish characters received outside of a call are ignored, and that the <strong>DT80</strong> does not send<br />
UM-0085-B2 <strong>DT80</strong> <strong>Series</strong> User’s <strong>Manual</strong> Page 175
characters to the modem that the modem may interpret as commands to switch into a different operating state.<br />
Dialling Out<br />
The <strong>DT80</strong> can also initiate an outgoing modem call, which would typically be done in response to an alarm.<br />
SETDIALOUTNUMBER Command<br />
Send the command<br />
SETDIALOUTNUMBER"digits"<br />
to the <strong>DT80</strong> to specify the telephone number to be dialled by the DIAL command to establish a connection to the host<br />
computer.<br />
DIAL Command<br />
The DIAL command causes the <strong>DT80</strong> to instruct its modem to dial out to the telephone number specified by<br />
SETDIALOUTNUMBER. If a call cannot be placed for any reason, the command is ignored. This is often used as an alarm<br />
action command to cause the <strong>DT80</strong> to dial out when an alarm condition arises (see Alarm Action Processes (P79)).<br />
HANGUP Command<br />
The HANGUP command causes the <strong>DT80</strong> to instruct its modem to hang up (disconnect) the current dial-out or dial-in<br />
connection. If there is currently no connection, HANGUP is ignored. This can be used in an alarm action command to cause<br />
the <strong>DT80</strong> to hang up a call in progress when an alarm condition arises.<br />
Example — Modem Control Commands<br />
The use of the <strong>DT80</strong>’s modem control commands is demonstrated in the following program:<br />
BEGIN"FLUFFY"<br />
SETDIALOUTNUMBER"12345678"<br />
RA10M<br />
'Read boiler temp<br />
1TK(=1CV,W)<br />
IF(1CV>120){DIAL}<br />
END<br />
Every 10 minutes, the program checks the boiler temperature and then, if it exceeds 120°C, instructs the modem to initiate a<br />
dial-out to phone number 12345678.<br />
Modem Status<br />
The system variable 25SV (P34) gives an indication of the current state of the modem. It can be used with alarms to<br />
determine the current state of the modem connection and to behave accordingly.<br />
Modem Diagnostics<br />
If you experience problems with setting up a modem, it can be helpful to switch on diagnostic messages by setting P56=16.<br />
These messages are output to the active communications port and indicate events (e.g. DCD signal going active) and <strong>DT80</strong><br />
actions (e.g. initialisation commands sent to the modem) as they occur.<br />
Set P56=0 to disable the diagnostic messages.<br />
Setting Up a Remote Connection<br />
The following is a brief summary of the steps involved in setting up a remote modem connection between the <strong>DT80</strong> and a<br />
host computer.<br />
1. Pre-configure the modem as described in Configuring Your Modem (P173) and save the settings to the modem's<br />
default profile.<br />
2. Connect a local PC to the <strong>DT80</strong> using a USB or direct RS232 connection and run DeTransfer/DeLogger.<br />
3. Set the required profile settings to configure the host port and modem. For example:<br />
PROFILE HOST_PORT FLOW_CONTROL=HARDWARE<br />
PROFILE HOST_MODEM EXT_POWER_SWITCH=3DSO<br />
will set hardware flow control (recommended), and configure modem power control using digital output 3D.<br />
4. Connect power to the modem (in the above example the power would be supplied via a relay driven by 3D).<br />
5. Connect a suitable comms cable between the serial port on the <strong>DT80</strong>’s modem and the <strong>DT80</strong>’s Host RS-232 port.<br />
This cable is normally supplied with the modem, see also <strong>DT80</strong>-to-Modem Cable (P173).<br />
6. At the remote end of the link, connect a suitable comms cable between the serial port on the host computer and the<br />
local modem.<br />
7. On the host computer, configure the modem using the Windows control panel. It is recommended that hardware flow<br />
control and an error-correcting protocol (e.g. V42) are used.<br />
8. On the host computer, launch suitable terminal software, e.g. DeLogger or DeTransfer. Set up a connection to use the<br />
modem.<br />
UM-0085-B2 <strong>DT80</strong> <strong>Series</strong> User’s <strong>Manual</strong> Page 176
9. Attempt to connect to the <strong>DT80</strong> from the host computer.<br />
Visits to Site<br />
If the site is visited where the <strong>DT80</strong> and the modem are installed, the <strong>DT80</strong> can be communicated with directly from a<br />
PC/Notebook by unplugging the cable from the modem to the <strong>DT80</strong> at the <strong>DT80</strong> end and then plugging in a direct RS232<br />
cable from your PC/Notebook to the <strong>DT80</strong>. Differences in the cable wiring allow the <strong>DT80</strong> to determine the type of<br />
connection and to respond appropriately.<br />
Alternatively, a USB cable can be used, in which case the modem cable need not be disturbed.<br />
Ethernet Communications<br />
The <strong>DT80</strong>'s Ethernet port allows you to connect the <strong>DT80</strong> to a TCP/IP based local or wide area network. The <strong>DT80</strong> can then<br />
provide the following services to client computers:<br />
access to the <strong>DT80</strong>'s standard command interface<br />
access to the <strong>DT80</strong>'s built-in web interface (P112)<br />
access to the <strong>DT80</strong>'s Modbus server.<br />
transfer of files (e.g. job files, store files) to or from the <strong>DT80</strong>'s file system, using the FTP protocol (P186)<br />
These client computers may be on the desk next to the <strong>DT80</strong> or, via the Internet, on the other side of the world.<br />
TCP/IP Concepts<br />
In order to operate correctly on a TCP/IP network, the <strong>DT80</strong> must know the following:<br />
its own unique IP address<br />
the subnet mask applicable to the network to which it is connected<br />
(optional) the gateway IP address applicable to the network to which it is connected<br />
(optional) the DNS server address applicable to the network to which it is connected.<br />
IP Address<br />
Every device that is connected to a TCP/IP network must have its own unique identifier, called its IP address, and the <strong>DT80</strong><br />
is no exception. No two devices in the same network can have the same IP address.<br />
An IP address is single 32-bit integer, but it is normally written as four numbers (each in the range 0-255), separated by<br />
periods, e.g. 192.168.2.101.<br />
Assigning an IP Address<br />
There are two methods of assigning an IP address to the <strong>DT80</strong>'s Ethernet port:<br />
it can be manually specified in the <strong>DT80</strong>'s profile. This is termed a static IP address.<br />
the <strong>DT80</strong> can automatically obtain a dynamic IP address from a DHCP server on the local network. Most networks<br />
include a Dynamic Host Configuration Protocol (DHCP) server, which is responsible for providing IP addresses to<br />
computers connected to the network. If a DHCP server is not available then the <strong>DT80</strong> can assign itself an Auto-IP<br />
address.<br />
Note that a DHCP server will typically also automatically set the <strong>DT80</strong>'s subnet mask, gateway and DNS server parameters.<br />
Public and Private Addresses<br />
Traditionally, all IP addresses were "public", which meant that if you knew a particular computer's IP address then you could<br />
connect to it from any computer on any IP network anywhere in the world. This did, however, present some problems. Firstly,<br />
it meant that every computer needed a globally unique IP address, and with the explosive growth of the Internet, IP<br />
addresses are simply running out. Secondly, computers with externally visible IP addresses are potentially vulnerable to<br />
malicious programs on the Internet which attempt to exploit application or operating system "loopholes" in order to gain<br />
control of a computer for nefarious purposes.<br />
Nowadays, the usual practice is to set up private networks, where all computers on the network have a private IP address. In<br />
order for these computers to access web servers and such like on the Internet, all external traffic is passed via a NAT router,<br />
so called because it performs Network Address Translation, i.e. it converts private IP addresses into "real" IP addresses<br />
and vice versa. The end result is that the computers on the private network can "see out", but external systems cannot "see<br />
in" – the router effectively acts as a "firewall" between the secure private network and the Internet.<br />
This is fine for "client" computers such as the one you use for accessing the web or email. For "server" devices (e.g. the<br />
<strong>DT80</strong>, which has internal web and FTP servers), NAT can present a problem if you want to be able to access the <strong>DT80</strong>'s<br />
servers via the Internet. This will be discussed further in Accessing the <strong>DT80</strong> via the Internet (P184).<br />
Private IP addresses normally begin with 10.x.x.x, or 172.16.x.x through 172.31.x.x, or 192.168.x.x, or 169.254.x.x. These<br />
addresses only need to be unique within the local network. Addresses outside these ranges can normally be assumed to be<br />
public IP addresses. Public IP addresses need to be assigned by an Internet Service Provider (ISP).<br />
UM-0085-B2 <strong>DT80</strong> <strong>Series</strong> User’s <strong>Manual</strong> Page 177
Subnet Mask<br />
The <strong>DT80</strong>'s IP address actually consists of two parts:<br />
<br />
<br />
The network number, which identifies the network to which the <strong>DT80</strong> and its neighbours are connected.<br />
The node number, which uniquely identifies this <strong>DT80</strong>. No two devices on the network may have the same node<br />
number. Also known as a host number.<br />
The subnet mask is a property of the network to which the <strong>DT80</strong> is connected and specifies which part of the IP address is<br />
the network number and which is the node number.<br />
For example, the subnet mask 255.255.255.0 specifies that the first three parts of the IP address are the network number,<br />
and the last is the node number within the network. So in this case the IP address 192.168.2.101 would represent node 101<br />
on the "192.168.2" network.<br />
Gateway<br />
The <strong>DT80</strong> can communicate directly with any of the nodes connected to its local network. In many cases this is all the<br />
connectivity that is required.<br />
If, however, the <strong>DT80</strong> needs to be accessed from farther afield then it needs to know how to communicate with computers on<br />
different networks. This is done by assigning one of the computers on the <strong>DT80</strong>'s local network to be a gateway. The IP<br />
address of the gateway is then entered into the <strong>DT80</strong>.<br />
Now, any time the <strong>DT80</strong> wants to talk to a computer on a "foreign" network it will simply passes the data to the designated<br />
gateway and let it sort it out. The gateway may then pass the data on to other gateways, until eventually the data finds its way<br />
to its destination. See also Connection to a LAN (P178).<br />
As hinted above, if you only want to connect your <strong>DT80</strong> to one computer, or to a few computers which are all on the same<br />
local network, then it is not necessary to specify a gateway.<br />
DNS Server<br />
Most networks include a Domain Name System (DNS) server. This is responsible for translating names such as<br />
ftp.datataker.com into numeric IP addresses. If the <strong>DT80</strong> is configured with a valid DNS server address then the current job<br />
will be able to access FTP servers by name rather than having to use a raw IP address.<br />
Connecting to the <strong>DT80</strong> Ethernet Port<br />
Important Do not connect your <strong>DT80</strong> to the network until you’ve configured the <strong>DT80</strong> with a suitable IP address and subnet<br />
mask, or selected the "automatic IP address" option. Connecting a device with an invalid or conflicting IP address may cause<br />
significant disruption to the operation of the network.<br />
The <strong>DT80</strong>'s Ethernet port is designed to connect to any 10-BaseT Ethernet compatible network. The port operates at a<br />
maximum data rate of 10Mbps.<br />
There are two ways to connect to a network:<br />
directly connect the <strong>DT80</strong> to a single host computer using a "cross-over" cable. In this case you are effectively creating<br />
a new mini-network, with just two devices connected – the <strong>DT80</strong> and the host computer.<br />
connect the <strong>DT80</strong> to a spare port on an Ethernet hub, bridge or router, using a standard ("straight through) cable. In<br />
this case the <strong>DT80</strong> will be joining an existing network.<br />
Note that many recent PC and switch/router models incorporate "auto switching" Ethernet ports. Such devices may be<br />
connected to the <strong>DT80</strong> using either a standard or cross-over Ethernet cable.<br />
Direct Connection to a PC<br />
A direct Ethernet connection provides a link between a single PC and the <strong>DT80</strong>.<br />
PC<br />
<strong>DT80</strong><br />
Ethernet<br />
Port<br />
169.254.123.44 169.254.42.199<br />
10BaseT cross-over cable<br />
Ethernet<br />
Port<br />
Figure 65: Direct Ethernet connection<br />
In the above example, the PC and the <strong>DT80</strong> have both assigned themselves Auto-IP addresses, as there is no DHCP server<br />
available. Auto-IP addresses always begin with 169.254; the latter part of the IP address is semi-random.<br />
Connection to a LAN<br />
By connecting the <strong>DT80</strong> to a local area network (LAN), the <strong>DT80</strong> will be accessible by any of the computers on the LAN, and<br />
possibly also by computers on a wide area network or the Internet, depending on how the LAN is set up.<br />
UM-0085-B2 <strong>DT80</strong> <strong>Series</strong> User’s <strong>Manual</strong> Page 178
PC2<br />
Ethernet<br />
Port<br />
10.33.102.8<br />
10.33.102.1<br />
NAT Router<br />
(gateway)<br />
203.54.192.12<br />
ADSL<br />
Internet<br />
modem<br />
192.168.1.1<br />
Ethernet Switch<br />
PC1<br />
to other devices (192.168.1.x)<br />
<strong>DT80</strong><br />
Ethernet<br />
Port<br />
192.168.1.23<br />
192.168.1.7<br />
Ethernet<br />
Port<br />
10BaseT standard cable<br />
Figure 66: Typical Ethernet LAN<br />
In the above example, the <strong>DT80</strong>, PC1, a router, and possibly some other devices are all connected on the same private LAN<br />
"segment", or "subnet". All devices on this particular subnet have IP addresses beginning with 192.168.1. All devices on the<br />
same subnet can communicate with each other directly.<br />
PC2, on the other hand, is connected to a different subnet. It cannot directly communicate with the <strong>DT80</strong>; it needs to go via<br />
the router. In other words the router acts as a "gateway" between the various subnets, and also, in this case, the Internet.<br />
This all happens automatically, provided that all devices are correctly configured. In particular, the gateway address for<br />
each device needs to point to the router. So PC1 and the <strong>DT80</strong> would both have their gateway address set to 192.168.1.1,<br />
while PC2's gateway would be set to 10.33.102.1.<br />
Note that if a DHCP server is present on the LAN (which will usually be the case), and the <strong>DT80</strong> is configured to use it, then<br />
the DHCP server would normally take care of setting all required addresses automatically.<br />
Connection to a Modem-Gateway<br />
Another common connection scenario is where a remote <strong>DT80</strong> is connected to the Internet using a "modem-gateway" device<br />
that integrates the modem, NAT router and switch functions into one box. The modem may be a cable, ADSL or wireless<br />
(GPRS/3G) modem.<br />
203.54.22.177<br />
Integrated<br />
Modem-Gateway<br />
Mobile Network<br />
Access Point<br />
Internet<br />
192.168.0.1<br />
<strong>DT80</strong><br />
192.168.0.2<br />
Ethernet<br />
Port<br />
10BaseT standard cable<br />
Figure 67: Typical Internet connection using an integrated modem-gateway (wireless modem in this case)<br />
The modem-gateway will typically include a DHCP server, which will automatically set up the required network parameters<br />
on the <strong>DT80</strong>, including its IP address.<br />
Ethernet Port Indicators<br />
The two LEDs on the <strong>DT80</strong>’s Ethernet port (P214) indicate the following:<br />
Green LED – Link OK; should come on and stay on as soon as you connect the Ethernet cable<br />
Amber LED – Activity; blinks every time a data packet is received<br />
UM-0085-B2 <strong>DT80</strong> <strong>Series</strong> User’s <strong>Manual</strong> Page 179
If the green LED does not come on then either the <strong>DT80</strong> Ethernet port is not enabled, or the cable is faulty, or the socket you<br />
are connecting to is not connected to an active Ethernet network, or the hub/bridge/router is not powered up.<br />
Note that the amber LED indicates communications activity anywhere on the local network – this activity is not necessarily<br />
directed at the <strong>DT80</strong>.<br />
Note These LEDs will only operate if the <strong>DT80</strong> Ethernet port is enabled. The Ethernet port will only be enabled if its IP<br />
address has been set, or DHCP has been enabled. (See How to set up Ethernet (P181)).<br />
MAC Address<br />
All Ethernet devices have a globally unique 12-digit identifier programmed into them during manufacture. This is called the<br />
MAC Address. The <strong>DT80</strong>'s assigned MAC address can be viewed using the EAA (Ethernet Adapter Address) command,<br />
but it cannot be changed. You should not need to be concerned with this address.<br />
Ethernet Commands<br />
Querying Ethernet Parameters<br />
The current Ethernet parameters can be viewed using the following commands<br />
Command<br />
Description<br />
IP<br />
Returns the <strong>DT80</strong>’s current IP address<br />
IPSN<br />
Returns the <strong>DT80</strong>’s current IP subnet mask<br />
IPGW<br />
Returns the <strong>DT80</strong>’s current IP gateway<br />
EAA Returns the <strong>DT80</strong>’s Ethernet network adapter address Set at factory (read-only)<br />
For example:<br />
IP<br />
192.168.42.15<br />
IPSN<br />
255.255.255.0<br />
IPGW<br />
192.168.42.3<br />
EAA<br />
00-90-2D-00-12-6B<br />
In this example the <strong>DT80</strong> has IP address 192.168.42.15, and is connected to network 192.168.42.0/24. The computer or<br />
router at IP address 192.168.42.3 is the designated gateway for this network. Any data that needs to be sent to a different<br />
network will be sent via this computer.<br />
Setting Ethernet Parameters<br />
All Ethernet parameters are set using profile settings (see Profile (P202)), i.e.<br />
PROFILE ETHERNET key=value<br />
The following keys are defined:<br />
Key Value Default<br />
ENABLE Set to YES to enable the Ethernet port, NO to disable (saves power) YES<br />
IP_ADDRESS IP address of <strong>DT80</strong> Ethernet port. May be set to a static IP address, or AUTO<br />
AUTO (obtain an address from a DHCP server)<br />
SUBNET_MASK Subnet mask for the network segment to which the <strong>DT80</strong> is connected. 255.255.255.0<br />
This setting will be ignored if a valid subnet mask was obtained from the<br />
DHCP server.<br />
GATEWAY<br />
IP address of the gateway computer/router for network segment to which 0.0.0.0<br />
the <strong>DT80</strong> is connected. This setting will be ignored if a valid gateway<br />
address was obtained from the DHCP server.<br />
For example, the following commands would be used to set the parameters in the above example:<br />
PROFILE ETHERNET IP_ADDRESS=192.168.42.15<br />
PROFILE ETHERNET SUBNET_MASK=255.255.255.224<br />
PROFILE ETHERNET GATEWAY=192.168.42.3<br />
Alternatively, if a DHCP server was available on the network then you could simply use:<br />
PROFILE ETHERNET IP_ADDRESS=AUTO<br />
By default, the above command is assigned to one of the <strong>DT80</strong>'s user defined functions, accessible from the front panel; see<br />
User Defined Functions (P109). This makes it easy to enable Ethernet on a new logger without having to connect to it.<br />
Setting DNS Server address<br />
To set the DNS server address use<br />
PROFILE NETWORK DNS_SERVER_1=192.168.42.4<br />
PROFILE NETWORK DNS_SERVER_2=192.168.42.5<br />
UM-0085-B2 <strong>DT80</strong> <strong>Series</strong> User’s <strong>Manual</strong> Page 180
The first setting is for the primary DNS server; the second is for an optional alternative server, which will only be used if the<br />
primary server is offline.<br />
These settings will be ignored if valid DNS server address(es) were obtained from the DHCP server.<br />
How to set up Ethernet<br />
Initial decisions<br />
In order to set up an Ethernet connection to the <strong>DT80</strong>, you need to decide:<br />
whether the <strong>DT80</strong> will connect directly to a PC (Figure 65), or connect to an existing LAN (Figure 66)<br />
whether the <strong>DT80</strong> will use a static (manually configured) or a dynamic (automatic) IP address.<br />
A direct Ethernet connection to a PC will typically be a temporary arrangement, so you would normally choose the automatic<br />
(Auto-IP) IP address option.<br />
For a LAN connection, the automatic (DHCP) option is considerably simpler to set up, as the IP address, subnet mask,<br />
gateway and DNS server addresses will normally all be set automatically.<br />
The main drawbacks of a dynamic IP address are that a) you need to determine what that IP address is, and b) the IP<br />
address may change. If the <strong>DT80</strong> is continuously powered and connected to the network then it will normally retain the same<br />
IP address, but if it is unplugged for a period of time then when it is reconnected then it may receive a different address from<br />
the DHCP server.<br />
If the logger is nearby then this is not a huge problem because you can determine the IP address via the front panel display,<br />
or by making a direct USB connection.<br />
If, however, the logger is remote then it is much more convenient if the IP address is fixed. Similarly, if you plan to allow<br />
access to the <strong>DT80</strong> via the Internet then it will need a static IP address.<br />
Note that the <strong>DT80</strong> does not currently support web-based dynamic DNS services such as dynDNS.com.<br />
Direct Connection to PC – Automatic IP address<br />
1. Check that Ethernet port is enabled<br />
Using the front panel UP and DOWN keys, select the Ethernet IP screen. It should show:<br />
Eth IP: Auto<br />
No cable<br />
If this is not the case then the <strong>DT80</strong>'s Ethernet port has been disabled or set to a static IP address. Connect to the logger<br />
using a USB or serial connection and enter:<br />
PROFILE ETHERNET ENABLE=YES<br />
PROFILE ETHERNET IP_ADDRESS=AUTO<br />
Verify that the display is now correct.<br />
2. Connect Ethernet cable<br />
You can now connect a cross-over Ethernet cable between the <strong>DT80</strong> and the computer. Verify that the green Link LED on<br />
the <strong>DT80</strong>'s Ethernet connector comes on. If the Link LED does not come on then check that:<br />
the cable is a correctly wired cross-over cable<br />
the computer's Ethernet port is enabled (check "Network Connections" in Windows control panel)<br />
3. Check <strong>DT80</strong> IP address<br />
When the Ethernet cable is connected, the <strong>DT80</strong> will begin searching for a DHCP server. When connected directly to a PC,<br />
there will normally be no DHCP server available, so after 10 seconds or so the <strong>DT80</strong> will give up and assign itself an<br />
"Auto-IP" address. The Ethernet IP screen will then change to something like:<br />
Eth IP: Auto<br />
169.254.25.77<br />
If you have a DT81 (which has no front panel display) then you can alternatively send the command:<br />
IP<br />
169.254.25.77<br />
4. Wait for Windows to acquire IP address<br />
Meanwhile, Windows will also be looking for a DHCP server. During this time you may notice an animated icon in the system<br />
tray, which, for Windows XP, will look something like the following:<br />
UM-0085-B2 <strong>DT80</strong> <strong>Series</strong> User’s <strong>Manual</strong> Page 181
Figure 68: Windows XP searching for a DHCP server<br />
Windows normally spends about 60 seconds looking for a DHCP server, then it, like the <strong>DT80</strong>, will give up and assign itself<br />
an Auto-IP address, at which point the system tray icon will disappear.<br />
A message may be displayed at this point warning that the network connection has "limited or no connectivity". This is<br />
normal, and simply indicates that the Internet will not be accessible using this network connection.<br />
5. Test the connection<br />
You should now be able to connect to the <strong>DT80</strong>. For example, you could enter the <strong>DT80</strong>'s IP address (169.254.25.77 in the<br />
above example) into a web browser in order to access the <strong>DT80</strong>'s web interface, or you could create a TCP/IP connection in<br />
DeTransfer or DeLogger, again specifying the <strong>DT80</strong>'s IP address (see Using the Network Command Interface(P186)).<br />
Network Connection – Automatic IP address<br />
The procedure for connecting to an existing LAN using automatic configuration is very similar to the above "direct<br />
connection" scenario:<br />
1. Check Ethernet port<br />
As for the direct connection scenario, check that the display indicates Eth IP:<br />
described above.<br />
Auto. If not then enable the port, as<br />
2. Connect Ethernet cable<br />
You can now connect a standard Ethernet cable between the <strong>DT80</strong> and a network connection point. This might be a wall<br />
socket connected to an office LAN, or a port on a desktop Ethernet switch or router unit.<br />
Verify that the green Link LED comes on on the <strong>DT80</strong>'s Ethernet connector. If the Link LED does not come on then check<br />
that:<br />
the cable is a correctly wired straight through cable<br />
the network access point is active (check with your network administrator)<br />
3. Check <strong>DT80</strong> IP address<br />
When the Ethernet cable is connected, the <strong>DT80</strong> will begin searching for a DHCP server. Within a few seconds it should<br />
receive an IP address and the Ethernet IP screen will then change to something like:<br />
Eth IP: Auto<br />
192.168.11.25<br />
If you have a DT81 then you can alternatively send the command:<br />
IP<br />
192.168.11.25<br />
If the indicated address begins with 169.254 then this indicates that a DHCP server could not be found, so the <strong>DT80</strong> has<br />
reverted to an Auto-IP address. This will still work, provided that all other devices on the LAN are also using Auto-IP<br />
addresses (see Step 4 below). If, however, the other computers on the network have been set up with static IP address then<br />
the <strong>DT80</strong> will need to use a static IP address too (see Network Connection – Static IP address (P183)).<br />
Note If no DHCP server was found, the <strong>DT80</strong> will continue to check for one periodically (every 10 seconds at first, then every<br />
5 minutes). If a DHCP server becomes available then the <strong>DT80</strong> will switch over to the IP address supplied by the server.<br />
4. Check Windows IP address<br />
It is now advisable to verify the IP address of the computer that you want to use to communicate with the <strong>DT80</strong>. One way to<br />
do this is to open a command prompt window and use the ipconfig command. The following response would be typical<br />
for an office LAN:<br />
C:\>ipconfig<br />
Ethernet adapter Local Area Connection:<br />
Connection-specific DNS Suffix . : megacorp.com<br />
IP Address. . . . . . . . . . . . : 192.168.11.44<br />
Subnet Mask . . . . . . . . . . . : 255.255.255.0<br />
Default Gateway . . . . . . . . . : 192.168.11.250<br />
In this case note that both the PC and the <strong>DT80</strong> are connected to the same subnet – their IP addresses both start with<br />
192.168.11. This may not necessarily be the case, as there may be a router (or indeed the Internet) between the <strong>DT80</strong> and<br />
the computer. This should not be a problem provided that both the <strong>DT80</strong> and the computer have a valid "gateway" set.<br />
A response similar to the following indicates that the computer is using an Auto-IP address:<br />
C:\>ipconfig<br />
Ethernet adapter Local Area Connection:<br />
Connection-specific DNS Suffix . :<br />
Autoconfiguration IP Address. . . : 169.254.178.139<br />
Subnet Mask . . . . . . . . . . . : 255.255.0.0<br />
Default Gateway . . . . . . . . . :<br />
UM-0085-B2 <strong>DT80</strong> <strong>Series</strong> User’s <strong>Manual</strong> Page 182
In this case the computer will only be able to communicate with a <strong>DT80</strong> on the same subnet, e.g. one plugged into the same<br />
Ethernet switch.<br />
5. Test the connection<br />
You should now be able to connect to the <strong>DT80</strong>. For example, you could enter the <strong>DT80</strong>'s IP address into a web browser in<br />
order to access the <strong>DT80</strong>'s web interface, or you could create a TCP/IP connection in DeTransfer, again specifying the<br />
<strong>DT80</strong>'s IP address (see Using the Network Command Interface(P186)).<br />
Network Connection – Static IP address<br />
When connecting the <strong>DT80</strong> to an existing Ethernet network using a static IP address, you need to be a little more careful.<br />
Setting the <strong>DT80</strong> to an inappropriate IP address can severely disrupt the operation of the network.<br />
By far the preferred approach here is to ask your network administrator what you should set the <strong>DT80</strong>'s IP address, subnet<br />
mask and gateway to (and which outlet you should connect the Ethernet cable to). You can then simply enter the required<br />
profile settings (using a USB or serial connection) as described in Setting Ethernet Parameters (P180), connect the <strong>DT80</strong>'s<br />
Ethernet cable, and you are ready to test the connection.<br />
If you don't have a "network administrator", then the following general procedure can be used<br />
1. Determine subnet details<br />
The first step is to determine the IP address range in use on the subnet, and the gateway address. This can be done using<br />
the ipconfig command. This should be entered on a computer that is connected to the subnet to which you want to<br />
connect the <strong>DT80</strong> (i.e. one that is connected to the same Ethernet switch). It is assumed that this computer's network<br />
settings are already correctly configured.<br />
C:\>ipconfig /all<br />
. . .<br />
Ethernet adapter Local Area Connection:<br />
. . .<br />
Connection-specific DNS Suffix . : megacorp.com<br />
Description . . . . . . . . . . . : NETGEAR GA311 Gigabit Adapter<br />
Physical Address. . . . . . . . . : 00-1B-2F-28-77-BB<br />
Dhcp Enabled. . . . . . . . . . . : Yes<br />
Autoconfiguration Enabled . . . . : Yes<br />
IP Address. . . . . . . . . . . . : 192.168.11.44<br />
Subnet Mask . . . . . . . . . . . : 255.255.255.0<br />
Default Gateway . . . . . . . . . : 192.168.11.250<br />
DHCP Server . . . . . . . . . . . : 192.168.10.100<br />
DNS Servers . . . . . . . . . . . : 192.168.10.100<br />
192.168.10.111<br />
In this case the subnet mask is 255.255.255.0, which indicates that the first three parts of the IP address (192.168.11)<br />
identify the subnet, while the last part identifies an individual computer. IP addresses on this subnet can therefore range from<br />
192.168.11.1 through 192.168.11.254. If, on the other hand, the subnet mask was 255.255.0.0 then the subnet number is<br />
given by the first two parts of the address. Such a subnet could then contain IP addresses ranging from 192.168.1.1 through<br />
192.168.254.254. If the subnet mask is something other than these then it becomes a little technical and you should ask an<br />
IP expert.<br />
You should also make a note of the Default Gateway address (192.168.11.250 in this case) and the DNS Server addresses<br />
(192.168.10.100 and 192.168.10.111).<br />
2. Select <strong>DT80</strong> IP address<br />
The IP address chosen for the <strong>DT80</strong> must:<br />
have the correct subnet number, as determined above. In this example, the subnet number is 192.168.11.<br />
have a unique host number. So in this example the <strong>DT80</strong> could not use the host number "44" (i.e. have an IP address<br />
of 192.168.11.44), because that has already been taken by the host computer.<br />
This is where it can get tricky. One method of finding a free address is to "ping" various IP addresses to see whether there is<br />
any reply. Be aware that this is not foolproof, but it may be adequate for a small network where you are aware of all the<br />
devices that use it. The procedure is as follows:<br />
1. Switch on all computers and devices that are connected to the network in question and allow them to boot up.<br />
2. From the command prompt window, use the ping utility to test a candidate IP address, e.g.:<br />
ping 192.168.11.10<br />
3. If you see a Reply from 192.168.11.10… response then that address is not free and cannot be used for the<br />
<strong>DT80</strong>.<br />
4. If you see a Request timed out… response then the address can probably be used for the <strong>DT80</strong>.<br />
3. Configure the <strong>DT80</strong><br />
You now have all the information you need and can proceed to configuring the <strong>DT80</strong>. Connect to the <strong>DT80</strong> using a USB or<br />
RS232 connection and enter the appropriate profile settings. For this example (assuming that IP address 192.168.11.10<br />
passed the ping test) you would enter:<br />
UM-0085-B2 <strong>DT80</strong> <strong>Series</strong> User’s <strong>Manual</strong> Page 183
PROFILE ETHERNET ENABLE=YES<br />
PROFILE ETHERNET IP_ADDRESS=192.168.11.10<br />
PROFILE ETHERNET SUBNET_MASK=255.255.255.0<br />
PROFILE ETHERNET GATEWAY=192.168.11.250<br />
PROFILE NETWORK DNS_SERVER_1=192.168.10.100<br />
PROFILE NETWORK DNS_SERVER_2=192.168.10.111<br />
4. Check Ethernet port<br />
Using the front panel UP and DOWN keys, select the Ethernet IP screen. It should show the configured IP address:<br />
Eth IP: No cable<br />
192.168.11.10<br />
If this is not the case then the <strong>DT80</strong>'s Ethernet port has not been properly configured, see Step 3 above.<br />
5. Connect Ethernet cable<br />
You can now connect a standard Ethernet cable between the <strong>DT80</strong> and a network connection point. Verify that the green<br />
Link LED comes on on the <strong>DT80</strong>'s Ethernet connector. If the Link LED does not come on then check that:<br />
the cable is a correctly wired straight through cable<br />
the network access point is active (check with your network administrator)<br />
6. Check <strong>DT80</strong> IP address<br />
When the Ethernet cable is connected, the No cable indication should disappear from the Ethernet IP screen:<br />
Eth IP: <strong>Manual</strong><br />
192.168.11.10<br />
If you have a DT81 then you can alternatively send the command:<br />
IP<br />
192.168.11.10<br />
7. Test the connection<br />
You should now be able to connect to the <strong>DT80</strong>. For example, you could enter the <strong>DT80</strong>'s IP address (192.168.11.10 in this<br />
case) into a web browser in order to access the <strong>DT80</strong>'s web interface, or you could create a TCP/IP connection in<br />
DeTransfer or DeLogger, again specifying the <strong>DT80</strong>'s IP address (see Using the Network Command Interface(P186)).<br />
Accessing the <strong>DT80</strong> via the Internet<br />
One of the major advantages connecting to the <strong>DT80</strong> via its Ethernet port is that you can then potentially access the <strong>DT80</strong><br />
from anywhere in the world via the Internet. That is, you use your computer and its existing Internet connection to access the<br />
<strong>DT80</strong> in much the same way as you would access a web site. This section discusses what is required in order to make this<br />
happen.<br />
There are essentially two possible connection scenarios:<br />
The <strong>DT80</strong> is on a private network, "behind" a NAT (Network Address Translation) router or firewall. This private<br />
network may be a corporate LAN (Figure 66 (P179)), or a single cable between the <strong>DT80</strong> and an integrated<br />
modem-gateway (Figure 67 (P179)).<br />
The <strong>DT80</strong> is connected to the Internet directly, or via a conventional (non-NAT) router.<br />
<strong>DT80</strong> on Private Network<br />
Figure 66 (P179) shows a typical network arrangement where the <strong>DT80</strong> is on a private LAN. In this case the <strong>DT80</strong> has been<br />
configured with a static private IP address, 192.168.1.7, as described in Network Connection – Static IP address (P183).<br />
In this example, the organisation's ISP has allocated a single public IP address (203.54.192.12) which is "shared" by PC1,<br />
PC2, the <strong>DT80</strong> and any other devices on the local network. As far as the outside world is concerned, the whole network<br />
looks like one single computer with one IP address. The NAT router is responsible for maintaining this fiction – it does this by<br />
remembering which local computer made a given request (e.g. to view a particular web page) and making sure that when the<br />
matching reply from the Internet is received (containing the web page itself), then it is forwarded to the correct computer.<br />
Port Forwarding<br />
The <strong>DT80</strong>, however, is acting primarily as a server. It does not initiate requests; it sits there and waits for incoming web or<br />
FTP or command interface requests, then processes them.<br />
It is therefore necessary to tell the NAT router (firewall) to forward such requests to the <strong>DT80</strong>'s IP address. Otherwise, the<br />
router will not know what do with these requests, and simply discard them.<br />
This process is known as port forwarding. You (or your network administrator) will need to configure the router so that<br />
incoming requests using the following TCP/IP ports will be forwarded to the <strong>DT80</strong>'s IP address:<br />
TCP port 80 – allows access to the <strong>DT80</strong>'s web server<br />
TCP port 21 – allows access to the <strong>DT80</strong>'s FTP server (command port)<br />
TCP ports 1024-5000 – allows access to the <strong>DT80</strong>'s FTP server (data port). For "passive mode" FTP transfers, the<br />
<strong>DT80</strong> randomly selects a data port from this range.<br />
UM-0085-B2 <strong>DT80</strong> <strong>Series</strong> User’s <strong>Manual</strong> Page 184
TCP port 7700 – allows access to the <strong>DT80</strong>'s command interface server<br />
TCP port 843 – allows access to the <strong>DT80</strong>'s enhanced web interface<br />
TCP port 502 – allows access to the <strong>DT80</strong>'s Modbus server<br />
ICMP (Internet Control Message Protocol) – allows "ping" requests to be sent to the <strong>DT80</strong>; this can be helpful when<br />
diagnosing network problems<br />
The actual procedure for doing this will vary according to the particular model of router/firewall. Consult the unit's<br />
documentation for more details.<br />
(Note that the above port numbers listed above are the defaults. Some of these can be changed in the <strong>DT80</strong> profile, see<br />
Profile Settings (P202).)<br />
Note You should only enable port forwarding for <strong>DT80</strong> facilities that you wish to make available to the Internet. For example,<br />
if you want to prevent any access to the <strong>DT80</strong> command server then you should not set up port forwarding for port 7700.<br />
Once the NAT router has been set up to forward the required ports, you should now be able to access the <strong>DT80</strong> from outside<br />
the local network using the network's public IP address. So in this example, you could enter http://203.54.192.12<br />
into a web browser and you should see the <strong>DT80</strong> web interface.<br />
Note The public IP address (203.54.192.12) should only be used from computers outside the local network. If you wanted to<br />
access the <strong>DT80</strong> from PC1 or PC2 you would still use the <strong>DT80</strong>'s private address, 192.168.1.7.<br />
Adding a DNS Entry<br />
It is customary (although not essential) to set up a Domain Name System (DNS) entry for an Internet-accessible <strong>DT80</strong>. This<br />
allows you to associate a meaningful name, e.g. mydt80.gigadata.com, with the <strong>DT80</strong>'s public IP address, so users<br />
can just type in the name without having to remember the actual IP address.<br />
Depending on the structure of the local network, this may involve configuring the local DNS server (if any) and/or requesting<br />
that the ISP add an entry to its DNS server. For more details, contact your network administrator or ISP.<br />
Direct Internet Connection<br />
The other possible configuration is where the <strong>DT80</strong> is essentially connected directly to the Internet. A typical setup is shown<br />
in Figure 69 below.<br />
<strong>DT80</strong><br />
Ethernet Switch<br />
Ethernet<br />
Port<br />
203.54.192.13<br />
ADSL<br />
modem<br />
Internet<br />
NAT Router<br />
(gateway)<br />
203.54.192.12<br />
192.168.1.1<br />
Ethernet Switch<br />
PC1<br />
to other devices (192.168.1.x)<br />
Ethernet<br />
Port<br />
192.168.1.23<br />
Figure 69: Typical Ethernet LAN with <strong>DT80</strong> directly connected to the Internet<br />
In this case two public IP addresses have been allocated by the ISP – one (203.54.192.13) for the <strong>DT80</strong> and one<br />
(203.54.192.12) for everything else, via the NAT router.<br />
Because the <strong>DT80</strong> is now effectively directly connected to the ISP's network, its IP address, subnet mask, gateway and DNS<br />
server addresses will need to be set up using values provided by the ISP.<br />
Once the <strong>DT80</strong>'s network profile settings have been set it should be possible to connect to it from either a local computer<br />
(e.g. PC1) or a remote system on the Internet, using its unique public IP address (203.54.192.13).<br />
Note that in this case port forwarding is not required, as requests for the <strong>DT80</strong> no longer pass through the NAT router.<br />
If desired, you can request that your ISP set up a DNS entry so that the <strong>DT80</strong> can be referred to by name, e.g.<br />
mydt80.nanodata.com.<br />
UM-0085-B2 <strong>DT80</strong> <strong>Series</strong> User’s <strong>Manual</strong> Page 185
Using the Network Command Interface<br />
Connecting<br />
To access the <strong>DT80</strong>'s command interface over Ethernet you need to use a terminal program on the host computer that can<br />
send/receive text to a TCP port. DeTransfer and DeLogger support this. By default, TCP Port 7700 is used; this can be<br />
changed in the <strong>DT80</strong> profile if required.<br />
Using DeTransfer, for example, you first need to set up a connection. This is the same as setting up a connection for RS232<br />
or USB, except that instead of specifying a COM port number, you now need to specify an IP address. The following screen<br />
shot illustrates this.<br />
Figure 70: Example software connection for a <strong>DT80</strong> on an Ethernet network (DeTransfer software shown)<br />
Note When creating a new connection the current version of DeTransfer defaults to Port 8. It must therefore be explicitly set<br />
to Port 7700.<br />
If you now press Connect, you should be able to send commands to the <strong>DT80</strong> and receive data, just as you would using USB<br />
or RS232.<br />
Multiple Connections<br />
Up to ten client computers (or ten DeTransfer sessions on the one computer) can simultaneously connect to the <strong>DT80</strong><br />
command interface using the TCP/IP network. This is in addition to a possible USB and/or RS232 connection.<br />
At any one time, only one of these interfaces/sessions can be the active interface. The active interface is the one on which<br />
the most recent <strong>DT80</strong> command was sent.<br />
Whenever the <strong>DT80</strong> transmits something over the command interface (e.g. returned/unloaded data, prompt strings,<br />
messages, etc.), it is send to the current active interface, plus all connected TCP/IP sessions. This provides a way to<br />
"broadcast" data to a number of different computers, each of which operates as a passive listener.<br />
Disconnecting<br />
It is important to note that all Ethernet sessions will be disconnected if the <strong>DT80</strong>:<br />
undergoes a hard reset (SINGLEPUSH, manual reset or power failure)<br />
enters low power sleep mode.<br />
For this reason, the <strong>DT80</strong> normally disables sleep mode while an Ethernet cable is connected (although this can be<br />
overridden by setting P15 to 3 or 4.<br />
If an Ethernet session is disconnected in this way, you may need to manually disconnect then reconnect in DeTransfer.<br />
Using the <strong>DT80</strong> FTP Server<br />
The <strong>DT80</strong> can also function as an FTP (File Transfer Protocol) server. You can use this mechanism to transfer data and<br />
program files to and from the <strong>DT80</strong>. This is done by running an FTP client application on the host computer and using it to<br />
UM-0085-B2 <strong>DT80</strong> <strong>Series</strong> User’s <strong>Manual</strong> Page 186
connect to the <strong>DT80</strong>'s FTP server (by specifying the <strong>DT80</strong>'s IP address).<br />
Passwords<br />
The FTP server supports two types of access:<br />
<br />
<br />
an anonymous login (username ANONYMOUS, password can be anything) provides read-only access to the <strong>DT80</strong>'s<br />
file system.<br />
a full login (using the username and password configured in the <strong>DT80</strong> profile) provides read/write access.<br />
To set the FTP password, use the following profile commands:<br />
PROFILE FTP_SERVER USER=DT<br />
PROFILE FTP_SERVER PASSWORD=TOPSECRET<br />
If, for security reasons, you want to disable the FTP server altogether, enter:<br />
PROFILE FTP_SERVER SUPPORTED=NO<br />
You can also disable anonymous logins, using:<br />
PROFILE FTP_SERVER ALLOW_ANONYMOUS=NO<br />
FTP Client Software<br />
A Windows computer includes at least two different FTP clients that can be used to access the <strong>DT80</strong>'s file system. You can<br />
run the traditional command-line version by typing<br />
ftp ip-address<br />
in a command prompt window (ip-address is the IP address of the <strong>DT80</strong>).<br />
Alternatively, most web browsers will allow you to browse the <strong>DT80</strong> by entering the following URL:<br />
ftp://user:password@ip-address/drive:/, or<br />
ftp://ip-address/drive:/ (for anonymous read-only access)<br />
where:<br />
user and password are the username and password to use.<br />
ip-address is the <strong>DT80</strong>'s IP address<br />
drive is the <strong>DT80</strong> drive to browse (A or B).<br />
The browser should then present a list of available files and folders, through which you can navigate simply by clicking on<br />
links.<br />
Figure 71: Typical file display when connected to <strong>DT80</strong> FTP server<br />
In order to load a file onto the <strong>DT80</strong>, or delete a file, you will need to:<br />
use a true FTP client, as opposed to a web browser. Windows Explorer (not Internet Explorer), or the command line<br />
client are suitable, or there are numerous others available.<br />
specify the configured username and password as set in the profile. For example, with the default settings you could<br />
enter the following into the Windows Explorer address bar:<br />
ftp://DATATAKER:DATATAKER@192.168.1.202/B:/<br />
and then if you drag files into it then they should be uploaded to the logger.<br />
UM-0085-B2 <strong>DT80</strong> <strong>Series</strong> User’s <strong>Manual</strong> Page 187
Troubleshooting<br />
If you experience problems connecting to the <strong>DT80</strong> FTP server, it can be helpful to examine the raw FTP messages that are<br />
being exchanged. To enable display of received and transmitted FTP messages, set P56=8. For example:<br />
P56=8<br />
>> 220 dataTaker FTP Server ready. Type HELP for help<br />
> 331 User name okay, need password.<br />
> 230 User logged in, proceed.<br />
> 215 UNIX Type: L8<br />
> 257 "/" is current directory.<br />
> 250 Requested file action okay, completed.<br />
> 200 Command okay.<br />
> 227 Entering Passive Mode (192,168,1,202,14,183)<br />
> 150 File status okay; about to open data connection.<br />
>> 226 Closing data connection. Transfer succeeded<br />
This shows an anonymous user logging in and requesting a directory listing. Lines beginning with > indicates lines that were transmitted by the <strong>DT80</strong>.<br />
Note that this setting will also show exchanges between the <strong>DT80</strong> and an external FTP server – for example when unloading<br />
or copying archive files to an FTP server (see Retrieving Logged Data (P88)).<br />
PPP Communications<br />
About PPP<br />
Point-to-Point Protocol (PPP) allows TCP/IP-based protocols to be run over the USB, Host RS-232 and/or serial sensor port<br />
of the <strong>DT80</strong>.<br />
A client computer can connect to the <strong>DT80</strong>, via modem or direct cable, in much the same was connecting to a dial-up Internet<br />
Service Provider. (Modem connections are only supported on the host RS232 port.) When a PPP connection is made, the<br />
<strong>DT80</strong> will, like an ISP, verify the supplied username and password and allocate an IP address for the host PC to use for the<br />
duration of the session.<br />
Each of the <strong>DT80</strong>'s three PPP-capable ports has its own IP address, which is in turn different to the IP address for the<br />
Ethernet port. This means that TCP/IP can potentially be active on all four ports simultaneously.<br />
Note For the USB port, the dataTaker DtUsb driver software is used to set up and manage a PPP connection in a simple<br />
manner. See USB Port (P160) for more details. There is no need for any of the PPP configuration described in this section if<br />
you are using the USB port. This section is, however, still applicable if you plan to use a direct RS232 or modem connection.<br />
Setting up PPP<br />
Setting up a PPP connection involves four main steps:<br />
1. Set or verify the required profile settings on the <strong>DT80</strong><br />
2. Install the physical communications link (RS232 cable, modem etc.)<br />
3. Define a "modem device" on the host computer to represent the physical comms link.<br />
4. Define a PPP "network connection" on the host computer, which will use the defined modem device.<br />
This normally needs to be done once only. Once the PPP network connection has been set up and saved on the host<br />
computer, you can then establish a connection as and when required. This process is the same as you would use when<br />
connecting to an Internet Service Provider via a dial-up connection. See Using PPP (P196).<br />
UM-0085-B2 <strong>DT80</strong> <strong>Series</strong> User’s <strong>Manual</strong> Page 188
1. <strong>DT80</strong> Profile Settings<br />
PPP Settings<br />
The <strong>DT80</strong>'s PPP settings can be listed using the PROFILE command:<br />
PROFILE PPP<br />
[PPP]<br />
SERSEN_IP_ADDRESS = 1.0.0.1<br />
SERSEN_REMOTE_IP_ADDRESS = 1.0.1.1<br />
HOST_IP_ADDRESS = 1.0.0.2<br />
HOST_REMOTE_IP_ADDRESS = 1.0.1.2<br />
USB_IP_ADDRESS = 1.0.0.3<br />
USB_REMOTE_IP_ADDRESS = 1.0.1.3<br />
USER = ANONYMOUS<br />
PASSWORD = PASSWORD<br />
These show:<br />
the <strong>DT80</strong>'s IP address for each of the three serial ports. For example, if you establish a PPP connection to the host<br />
RS232 port then by default the <strong>DT80</strong>'s IP address would be 1.0.0.2. You could therefore access the <strong>DT80</strong>'s web<br />
interface by entering http://1.0.0.2 into a web browser, for example.<br />
the IP address that the <strong>DT80</strong> will allocate to the host PC, for each of the three serial ports. So for an RS232 PPP<br />
connection the host computer's IP address would be 1.0.1.2.<br />
the username and password that the host computer must supply when establishing a PPP connection.<br />
These profile settings can be changed in the usual way, e.g.<br />
PROFILE PPP USER=DT<br />
PROFILE PPP PASSWORD=SECRET<br />
There is normally no need to change any of the IP address settings.<br />
Comms Port Settings<br />
The settings for the desired <strong>DT80</strong> port will also need to be set or checked. For example, if the host RS232 port is used then<br />
the current settings can be queried using:<br />
PROFILE HOST_PORT<br />
[HOST_PORT]<br />
BPS = 57600<br />
DATA_BITS = 8<br />
STOP_BITS = 1<br />
PARITY = NONE<br />
*FLOW = HARDWARE<br />
FUNCTION = COMMAND<br />
In order for the port to support PPP, the FUNCTION parameter must be set to COMMAND or PPP:<br />
The COMMAND setting (which is the default for USB and host RS232 ports) means that the port supports both the<br />
regular command interface and PPP, automatically switching between the two when a PPP connection is established<br />
and disconnected.<br />
The PPP setting only allows PPP connections on the port. This provides improved security, especially on modem<br />
links, as a valid username and password must be supplied before a PPP connection can be established.<br />
For the host and serial sensor RS232 ports, the flow control should be set to HARDWARE (RTS/CTS). Software flow control<br />
is not recommended for PPP.<br />
For RS232 ports, also make a note of the baud rate and framing settings – these will be needed when setting up the host PC<br />
end of the connection.<br />
2. Install the Physical Communications Link<br />
The physical communications link over which PPP is to be run should now be installed. This link might be<br />
a null modem (cross-over) RS232 cable, connected between the <strong>DT80</strong> host RS232 or serial sensor port and a PC<br />
RS232 port (or USB to RS232 adapter). For the serial sensor port, RS422/485 may also be used, with an appropriate<br />
adapter at the PC end.<br />
a modem (dial-up, radio, cellular), connected to the <strong>DT80</strong> host RS232 port, with another internal or external modem<br />
connected to the host computer.<br />
You now need to determine the PC COM port. This can be done by attempting to establish a standard command interface<br />
connection, using DeTransfer or DeLogger. Refer to USB Port (P160), RS-232 Communications (P166) or Modem<br />
Communications (P172) for more details. (Note that this will not work if the <strong>DT80</strong> port function has been be set to PPP. Set it<br />
to COMMAND for this test.)<br />
Once you have verified that a connection can be established, be sure to close the connection in DeTransfer. Make a note of<br />
the COM port number.<br />
UM-0085-B2 <strong>DT80</strong> <strong>Series</strong> User’s <strong>Manual</strong> Page 189
3. Install the Windows Modem Device<br />
It is now necessary to set up the "modem device" that Windows will use for communicating over this link. This is done as<br />
follows. Be sure that the cable or modem is plugged in to the host computer before proceeding.<br />
Note When using Windows Vista, note that at various points during this process you may see "Windows needs your<br />
permission" messages. Click Continue in each case.<br />
1. Open the Windows Control Panel.<br />
2. Open the Phone and Modems Options item. This may be listed under the Printers and Other Hardware (XP) or<br />
Hardware and Sound (Vista) category.<br />
3. If the Dialling Rules dialog is displayed, ensure that a valid area code is entered.<br />
4. Once the area code has been set, select the Modems tab:<br />
Figure 72: List of installed modem devices (Windows XP)<br />
This dialog shows all currently installed modem devices. In the above example the computer's internal dial-up modem<br />
is shown (COM3), along with two null modem cables (which, as far as the computer is concerned, are still "modems").<br />
In this case it so happens that the COM4 null modem cable is an RS232 cable, while COM5 is a USB cable – although<br />
this is not apparent in this dialog.<br />
5. If the modem (or null modem cable) that you intend to use for PPP is not listed, then you will need to add it, using the<br />
Add button. This will launch the Windows Add Hardware Wizard.<br />
a) If you are using a direct USB or RS232 null modem cable then tick the Don't detect modem; I will select it from a<br />
list option. (If you are using a modem then you can leave this unticked; Windows will then attempt to automatically<br />
detect it. If this fails then you will need to select the modem type from a list, in the next step.)<br />
b) You should now see a list of different modem types. If you are using a direct USB or RS232 null modem cable then<br />
select the first one in the list, Communications cable between two computers.<br />
c) Select the correct COM port number from the list. If the required COM port number is not listed then double check<br />
that you have closed any connections using that port in DeTransfer or DeLogger.<br />
d) The modem device should now have been added, and you will be returned to the modem list screen (Figure 72).<br />
Verify that the newly added modem device is now present.<br />
6. If a direct RS232 cable is being used then one further step is required. This is not necessary for a direct USB or<br />
modem connection.<br />
a) Select the RS232 cable from the list of modem devices and click Properties.<br />
b) Select the Modem tab and set the Maximum Port Speed field equal to the configured baud rate on the <strong>DT80</strong>, then<br />
press OK.<br />
The final step is to define a Windows "network connection" using the Network Connection Wizard. This process varies<br />
UM-0085-B2 <strong>DT80</strong> <strong>Series</strong> User’s <strong>Manual</strong> Page 190
depending on whether a direct cable or modem connection is used.<br />
4a. PPP Network – Direct Cable Connection<br />
This section describes the process of creating a Windows "network connection", when using a direct USB or RS232 cable<br />
connection. If you are using a modem, see 4b. PPP Network – Modem Connection (P193).<br />
The following is applicable to Windows XP<br />
1. From the Start menu, select Connect to, then Show all connections. This will display a list of currently defined<br />
network connections (if any).<br />
2. Select the New Connection Wizard, or the Create a new connection task. This will start the Network Connection<br />
Wizard.<br />
3. Select Setup an advanced Connection.<br />
4. Select the option to Connect directly to another computer.<br />
5. Specify that you are setting up a Guest connection<br />
6. Enter a name for the connection, e.g. "<strong>DT80</strong> USB ppp"<br />
7. Select the appropriate "Communications cable between two computers" modem device from the list.<br />
8. Specify whether you want the connection to be available just for your Windows user name, or for anyone who uses the<br />
computer.<br />
9. Complete the wizard by specifying whether or not you would like it to create a desktop icon for the connection. (A<br />
desktop icon allows you to establish the PPP connection simply by double clicking on the icon.)<br />
10. The wizard will now display the Connect dialog. (Figure 73; you will see this dialog each time you establish a PPP<br />
connection to the logger.) Press Cancel for now. A few more options should be set before connecting, as detailed<br />
below.<br />
The following is applicable to Windows Vista<br />
1. From the Start menu, select Connect to. This will display a list of currently defined network connections (if any).<br />
2. Select Setup a connection or network. This will start the Network Connection Wizard.<br />
3. Select Setup a dial-up connection.<br />
4. If more there is more than one "modem device" installed then you will be asked to select which one you want to use.<br />
Select the appropriate "Communications cable between two computers" from the list.<br />
5. You will now be prompted for your ISP connection details (telephone number, username and password). For a direct<br />
cable connection the telephone number won't be used so you can enter anything here.<br />
Enter a name for the connection, e.g. "<strong>DT80</strong> USB ppp". The username and password can be left blank for now. Press<br />
Connect.<br />
6. Windows will now attempt to establish the connection. This will fail, so press Skip to skip this step.<br />
7. Windows will report that the connection attempt failed. Select Setup the connection anyway to save the connection<br />
details.<br />
8. Press Close.<br />
Additional Settings<br />
A few further settings are required (these are applicable to both XP and Vista)<br />
1. From the Start menu, select Connect to, then select the PPP connection that you just created. If required, press<br />
Connect.<br />
2. The Connect dialog will now be displayed.<br />
UM-0085-B2 <strong>DT80</strong> <strong>Series</strong> User’s <strong>Manual</strong> Page 191
Figure 73: PPP Connect dialog (Windows XP)<br />
Enter the username and password specified in the <strong>DT80</strong> profile (by default ANONYMOUS and PASSWORD, note these<br />
are case sensitive), and tick the Save this username and password option so you won't have to enter it next time.<br />
Now click Properties.<br />
3. The connection properties page will now be displayed. On the General tab, click Configure.<br />
Figure 74: PPP Modem Configuration for direct cable connection (Windows XP)<br />
For a direct RS232 cable connection, ensure that the Maximum speed setting is set to the configured baud rate of the<br />
UM-0085-B2 <strong>DT80</strong> <strong>Series</strong> User’s <strong>Manual</strong> Page 192
<strong>DT80</strong> serial port in use. For a USB connection this setting is irrelevant. Check that the other settings are as shown in<br />
Figure 74, then press OK.<br />
4. On Windows XP, select the Networking tab, then press Settings. On Windows Vista, select the Options tab then<br />
press PPP Settings. This will display the PPP Settings dialog.<br />
Figure 75: PPP Settings<br />
Set the options as shown. In particular, disable the Enable software compression option, then press OK. This will<br />
reduce the time taken to establish a PPP connection.<br />
5. On the Networking tab, select the Internet Protocol (TCP/IP) option and then click Properties.<br />
6. Click Advanced to display the Advanced TCP/IP Settings dialog.<br />
Figure 76: TCP/IP Settings – uncheck the Use Default Gateway option<br />
Check the settings against those shown in Figure 76. In particular, the Use default gateway option should be<br />
disabled. If this is not done then Windows will attempt to use the PPP connection as its default Internet connection, the<br />
end result being that the Internet will not be accessible from your computer while a PPP connection to the <strong>DT80</strong> is in<br />
progress. (If your computer does not have an Internet connection then this step can be ignored.)<br />
7. Press OK to close the various "properties" dialogs, and return to the Connect dialog (Figure 73). You can now try<br />
establishing a PPP connection, see Using PPP (P196).<br />
4b. PPP Network – Modem Connection<br />
This section describes the process of defining a Windows "network connection" when using a modem connection. It is<br />
assumed that an appropriate "modem device" has already been installed, as described in 3. Install the Windows Modem<br />
Device (P190).<br />
The following is applicable to Windows XP<br />
1. From the Start menu, select Connect to, then Show all connections. This will display a list of currently defined<br />
network connections (if any).<br />
2. Select the New Connection Wizard, or the Create a new connection task. This will start the Network Connection<br />
Wizard.<br />
UM-0085-B2 <strong>DT80</strong> <strong>Series</strong> User’s <strong>Manual</strong> Page 193
3. Select Connect to the Internet.<br />
4. Select Set up my connection manually.<br />
5. Select Connect using a dial-up modem.<br />
6. When prompted for an "ISP Name", enter a name for the connection, e.g. "<strong>DT80</strong> modem ppp"<br />
7. Select which modem you wish to use. If you only have one modem connected then this step will be skipped.<br />
8. Enter the phone number for dialing in to the <strong>DT80</strong> modem.<br />
9. Specify whether you want the connection to be available just for your Windows user name, or for anyone who uses the<br />
computer.<br />
10. Enter the username and password specified in the <strong>DT80</strong> profile (by default ANONYMOUS and PASSWORD, note these<br />
are case sensitive).<br />
Uncheck the Use this account when anyone connects to the Internet option.<br />
Uncheck the Make this the default internet connection option.<br />
11. The wizard will now display the Connect dialog. (Figure 73; you will see this dialog each time you establish a PPP<br />
connection to the logger.) Press Cancel for now. A few more options should be set before connecting, as detailed<br />
below.<br />
The following is applicable to Windows Vista<br />
1. From the Start menu, select Connect to. This will display a list of currently defined network connections (if any).<br />
2. Select Setup a connection or network. This will start the Network Connection Wizard.<br />
3. Select Setup a dial-up connection.<br />
4. If more there is more than one modem installed then you will be asked to select which one you want to use. Select the<br />
correct one from the list.<br />
5. You will now be prompted for your ISP connection details (telephone number, username and password).<br />
Enter the phone number for dialing in to the <strong>DT80</strong> modem.<br />
Enter the username and password specified in the <strong>DT80</strong> profile (by default ANONYMOUS and PASSWORD, note these<br />
are case sensitive).<br />
Enter a name for the connection, e.g. "<strong>DT80</strong> modem ppp".<br />
Press Connect.<br />
6. Windows will now attempt to establish the connection. This will fail, so press Skip to skip this step.<br />
7. Windows will report that the connection attempt failed. Select Setup the connection anyway to save the connection<br />
details.<br />
8. Press Close.<br />
UM-0085-B2 <strong>DT80</strong> <strong>Series</strong> User’s <strong>Manual</strong> Page 194
Additional Settings<br />
A few further settings are required (these are applicable to both XP and Vista)<br />
1. From the Start menu, select Connect to, then select the PPP connection that you just created. If required, press<br />
Connect.<br />
The Connect dialog (Figure 73) will now be displayed. Click Properties.<br />
2. The connection properties page will now be displayed. On the General tab, click Configure.<br />
Figure 77: PPP Modem Configuration for modem connection (Windows XP)<br />
For a modem connection, the Maximum speed setting should normally be set higher than the modem connect speed<br />
(e.g. set to 115200 for a 56kbps modem). Unlike the direct cable connection case, it does not need to match the <strong>DT80</strong><br />
port speed.<br />
The modem error control and compression options should also be enabled. Enabling the modem speaker is optional.<br />
Press OK.<br />
3. On Windows XP, select the Networking tab, then press Settings. On Windows Vista, select the Options tab then<br />
press PPP Settings. This will display the PPP Settings dialog (Figure 75). As with the direct connection, disable the<br />
Enable software compression option, then press OK.<br />
4. On the Networking tab, select the Internet Protocol (TCP/IP) option and then click Properties.<br />
5. Click Advanced to display the Advanced TCP/IP Settings dialog (Figure 76). As with the direct connection, the Use<br />
default gateway option should be disabled to prevent Windows from attempting to use the PPP connection as its<br />
default Internet connection.<br />
6. Press OK to close the various "properties" dialogs, and return to the Connect dialog (Figure 73). You can now try<br />
establishing a PPP connection, see Using PPP (P196).<br />
UM-0085-B2 <strong>DT80</strong> <strong>Series</strong> User’s <strong>Manual</strong> Page 195
Using PPP<br />
Once a PPP connection has been set up, the general day to day process for using it is as follows:<br />
1. Ensure that the physical communications link is plugged in (modem or null modem cable).<br />
2. Establish a PPP connection by "dialing up" to the <strong>DT80</strong> (for a direct cable connection no actual "dialling" occurs).<br />
3. After the connection process completes you will be able to access the <strong>DT80</strong> via the configured IP address for the<br />
serial port in use. For example, if the host RS232 port is being used then the default IP address is 1.0.0.2.<br />
4. When you have finished, the PPP connection can be disconnected. The <strong>DT80</strong>'s IP address (e.g. 1.0.0.2) will no longer<br />
be valid.<br />
See below for more details.<br />
Establishing a Connection<br />
To establish a connection:<br />
1. Select Connect To on the Windows Start menu, then select the "network connection" that you created for the PPP<br />
link.<br />
2. The Connect dialog (Figure 73) will be displayed. Press Connect.<br />
3. If all goes well, a few status messages will be displayed briefly as Windows establishes the physical connection, logs<br />
in to the <strong>DT80</strong>, and then adds the <strong>DT80</strong>'s IP address to its networking configuration.<br />
4. By default, an icon representing the PPP connection will now be displayed in the Windows system tray:<br />
Figure 78: System tray icon for an active PPP connection (Windows XP)<br />
Note that for a USB connection, the indicated "speed" is irrelevant. USB always operates at a fixed rate.<br />
Using the Connection<br />
Once the connection has been established, you can access the <strong>DT80</strong> in much the same way as you would using an Ethernet<br />
connection. By default, the IP addresses for the three <strong>DT80</strong> serial ports are:<br />
1.0.0.1 for the serial sensor port<br />
1.0.0.2 for the host RS232 port<br />
1.0.0.3 for the USB port<br />
The appropriate IP address can then be entered into a web browser, or FTP client, or DeTransfer/DeLogger, etc.<br />
The IP address of the host computer at the other end of the PP link is as above but with a 1 rather than a 0 in the second last<br />
position. So for a host RS232 PPP connection the <strong>DT80</strong>'s IP address is 1.0.0.2, and the host computer's IP address is<br />
1.0.1.2.<br />
Limitations<br />
It is important to note that a PPP connection provides connectivity between the <strong>DT80</strong> and a single host computer only. The<br />
PPP "network" linking the computer and the <strong>DT80</strong> is a private network and is not visible to any other computers.<br />
If you wish to unload logged data to an FTP server via a PPP then the FTP server must be running on the host computer<br />
itself. You could then perform the unload using a <strong>DT80</strong> command such as:<br />
COPYD dest=ftp://anonymous:a@1.0.1.2/mydata/<br />
It is not possible to unload to an FTP server on the Internet via a PPP connection. For that you need an Ethernet connection.<br />
Closing a Connection<br />
To terminate a PPP session, simply right click on the connection's system tray icon and select Disconnect. Alternatively,<br />
use Connect To to bring up the list of all defined network connections, then right click on the appropriate connection and<br />
select Disconnect.<br />
You can also end a PPP session by sending the <strong>DT80</strong> command CLOSEDIRECTPPP. By default, this command will close<br />
all currently active PPP connections. To close a connection on one particular port, specify the port number (1=serial sensor,<br />
2=host, 3=USB), e.g.<br />
CLOSEDIRECTPPP 3<br />
will close the PPP session on the USB port.<br />
A PPP session will also be automatically terminated if the USB cable is disconnected, or the modem connection drops out.<br />
UM-0085-B2 <strong>DT80</strong> <strong>Series</strong> User’s <strong>Manual</strong> Page 196
Troubleshooting<br />
This section discusses a few possible reasons why a PPP connection may fail to connect. The error messages listed here<br />
are the common ones returned by Windows XP. Windows Vista is somewhat less helpful in that it simply indicates that "the<br />
connection failed", which could be due to any of the reasons below.<br />
Error 663 – Modem already in use or not configured properly<br />
This indicates that Windows could not open the specified COM port. Check that:<br />
the cables are properly connected<br />
you specified the correct COM port when creating the Windows modem device<br />
no other programs (e.g. DeTransfer) are currently using the specified COM port.<br />
Error 691 – Access is denied<br />
Check that the username and password specified in the Connect dialog exactly match that configured in the <strong>DT80</strong> profile.<br />
Error 777 – Modem or remote computer is out of order<br />
This indicates that the expected responses were not received from the <strong>DT80</strong>. Check that:<br />
for direct RS232 cable connections, the specified maximum baud rate matches that configured in the <strong>DT80</strong> profile.<br />
the port function setting in the <strong>DT80</strong> profile is set to COMMAND or PPP.<br />
if a modem is used, it appears to be dialling and connecting successfully. If not then check phone number and phone<br />
line.<br />
Slow connection<br />
When connecting, if there is a long pause (up to 60 seconds) during which Registering your computer on the network is<br />
displayed, this normally indicates that Windows is requesting a particular PPP option but that the <strong>DT80</strong> is rejecting it. One<br />
such option is "software compression"; ensure that this option is unchecked in the PPP Settings dialog (Figure 75).<br />
UM-0085-B2 <strong>DT80</strong> <strong>Series</strong> User’s <strong>Manual</strong> Page 197
Part L – Configuration<br />
Configuring the <strong>DT80</strong><br />
Parameters<br />
<strong>DT80</strong> parameters are internal system settings. They are global in their effect, and allow a variety of options to be set. As a<br />
general rule, set the parameters that require changing before programming schedules and alarms.<br />
Parameters are numbered from P0 to P62, although not all numbers are used. Each parameter is an integer; the range of<br />
allowable values varies from parameter to parameter.<br />
Reading Parameters<br />
To read the current setting of a parameter, simply send the parameter’s ID. For example, to read the value of P11:<br />
P11<br />
50<br />
Setting Parameters<br />
Parameters can be set at any time, and new settings generally take effect immediately. For example, send:<br />
P11=60<br />
to set parameter P11's value to 60.<br />
Note Parameters are not channels. The statement P11=60 is a command, and is carried out immediately, even if it<br />
appears within a schedule definition. You can use the DO command to set parameters when a schedule executes – see<br />
Executing Commands in Schedules (P52) for more information.<br />
Parameter Lifetime<br />
All parameter settings are cleared back to their default values when a soft or hard reset (RESET or SINGLEPUSH) is<br />
performed, or if both external and battery power is lost.<br />
To make a parameter setting "permanent", it should be set using the matching profile setting (see Profile Settings (P202)),<br />
e.g.<br />
PROFILE PARAMETERS P11=60<br />
When a parameter is set in the profile, it effectively becomes the new default value. You can still override it temporarily using<br />
the Pnn=xx command, but it will revert to the profile value if a soft or hard reset occurs.<br />
To reset a parameter to its factory default value you can use<br />
PROFILE PARAMETERS P11= to reset a single parameter<br />
PROFILE PARAMETERS= to reset all parameters<br />
FACTORYDEFAULTS to reset all settings, including parameters, switches and profile settings<br />
UM-0085-B2 <strong>DT80</strong> <strong>Series</strong> User’s <strong>Manual</strong> Page 198
The <strong>DT80</strong> recognises the following parameters:<br />
Parameter Specifies Units<br />
P0 Max analog input drift before<br />
re-calibration<br />
Default<br />
Value<br />
Range of<br />
Values<br />
Comment<br />
µV 3 0 to 10000 Voltage measurements may "drift" as the ambient<br />
temperature changes. If the drift is greater than this<br />
amount the <strong>DT80</strong> will automatically re-calibrate itself to<br />
restore accuracy.<br />
P3 Minimum sleep period ms 1500 1 to 30000 The <strong>DT80</strong> will only go to sleep if the sleep duration can<br />
be for at least this period of time<br />
P4 Sleep-to-wake latency ms 800 1 to 30000 Time required by <strong>DT80</strong> to resume normal operation after<br />
P8<br />
Command processor diagnostic<br />
mode<br />
leaving sleep mode<br />
mode 0 0 to 1 If this parameter is set to 1 then each and every<br />
command string will be displayed before being executed.<br />
This can be useful for verifying that alarm actions are<br />
being carried out, as these commands are not normally<br />
echoed.<br />
P9 Logging of alarm state mode 1 0 to 3 0 = do not log alarms<br />
1 = log false to true transitions only<br />
2 = log true to false transitions only<br />
3 = log both transitions<br />
P11 Mains frequency Hz 50 1 to 10000 Sets analog measurement duration to 1/P11 seconds .<br />
Set P11 to the local mains frequency for best noise<br />
P14<br />
Comms ports password<br />
protection timeout<br />
rejection.<br />
seconds 600 1 to 30000 When a password is defined, the <strong>DT80</strong> automatically<br />
signs off after this period of inactivity (see Password<br />
Protection (P159)<br />
P15 Low-power operation Mode 0 0 to 4 0 = Allow sleep if battery powered and Ethernet/USB not<br />
connected<br />
1 = Allow sleep if Ethernet/USB not connected<br />
2 = Do not allow sleep<br />
3 = Allow sleep<br />
4 = Allow sleep if battery powered<br />
See Controlling Sleep (P230)<br />
P16 LED test mode bitmask 0 0 to 32 0 = normal operation<br />
32 = LCD backlight and all LEDs off<br />
1-31: set specific LED pattern, as follows:<br />
bit 0 set = turn on Power LED<br />
bit 1 set = turn on Attn LED<br />
bit 2 set = turn on Disk LED<br />
bit 3 set = turn on Sample LED<br />
bit 4 set = turn on backlight<br />
P17 Delay to low-power mode seconds 30 1 to 30000 Sets how long the <strong>DT80</strong> waits before entering low-power<br />
sleep mode after the last communication or key press<br />
P20 LCD backlight control mode 2 0 to 3 0 = backlight off always<br />
1 = backlight on always<br />
2 = backlight on for P17 seconds after last user activity<br />
e.g. key press<br />
3 = if externally powered: backlight on always; if battery<br />
powered: as for P20=2<br />
P21 Analog subsystem power mode 0 0 to 1 0 = analog subsystem powered during analog<br />
measurement only<br />
P22 Data delimiter character ASCII 32<br />
(space)<br />
P24 Scan delimiter character ASCII 13<br />
(CR)<br />
1 = analog subsystem always powered<br />
1 to 255 In free format mode with units disabled (/h/u), this<br />
character is inserted between the data value and the<br />
next data value<br />
1 to 255 In free format mode with units disabled (/h/u), this<br />
character is inserted at the end of each schedule's data.<br />
Note that CR characters are always followed by LF.<br />
P26 Flow control timeout seconds 60 0 to 30000 If the <strong>DT80</strong> has been prevented from returning data for<br />
this amount of time (e.g. due to XOFF received or CTS<br />
not active) then it will assume that the host computer is<br />
no longer connected and will discard subsequent output<br />
text.<br />
Set to 0 to disable this timeout<br />
P27 3HSC input mode mode 0 0 to 3 Clock source for 3HSC counter<br />
0 = 3C terminal<br />
1 = internal 32768Hz signal, count while 3C terminal is<br />
low<br />
2 = 3C terminal, count while 4C terminal is low<br />
3 = internal 1024Hz signal<br />
P28 12V power output mode mode 0 0 to 3 0 = Auto CEM power. If schedule contains any CEM20<br />
channels then 12V is turned on prior to any analog<br />
measurement, then turned off again at the end of the<br />
schedule if no other schedules are due.<br />
1 = 12V on all the time<br />
UM-0085-B2 <strong>DT80</strong> <strong>Series</strong> User’s <strong>Manual</strong> Page 199
Parameter Specifies Units<br />
Default<br />
Value<br />
Range of<br />
Values<br />
Comment<br />
2 = 12V on all the time including while asleep<br />
3 = manual control of 12V output . CEM20s if used are<br />
assumed to be externally powered.<br />
P31 Date format mode 1 0 to 3 0 = days since 1-Jan-1989<br />
1 = European (DD/MM/YYYY)<br />
2 = North American (MM/DD/YYYY)<br />
3 = ISO (YYYY/MM/DD)<br />
P32 Number of significant digits digits 8 1 to 9 Sets the number of significant digits shown in returned<br />
data or unloaded logged data<br />
P33 Minimum field width characters 0 0 to 80 If non-zero, all data values returned in free format mode<br />
(/h) will be padded with leading spaces so that the total<br />
field width is at least P33 characters.<br />
P36 Temperature units mode 0 0 to 3 Units for all temperature measurements:<br />
0 = ºC Celsius<br />
1 = ºF Fahrenheit<br />
2 = K Kelvin<br />
3 = ºR Rankine<br />
P38 Decimal point character ASCII 46 (.) 1 to 255 In CSV and free format mode (/h) data, this character is<br />
used as the decimal point character. CSV data separator<br />
automatically changed to ";" if this is set to comma (44).<br />
P39 Time format mode 0 0 to 3 0 = HH:MM:SS.TTT<br />
1 = decimal seconds since midnight<br />
2 = decimal minutes since midnight<br />
3 = decimal hours since midnight<br />
P40 Time separator character ASCII 58 (:) 1 to 255 This character is used to separate HH, MM and SS fields<br />
in time values.<br />
P41 Time sub-second digits digits 3 0 to 6 Sets number of decimal places in time values<br />
P50 Time instant format mode 0 0 to 5 Specifies the format to use when returning an absolute<br />
date/time value:<br />
0 = P39P22P31 (time, delimiter, date)<br />
1 = P31P22P39 (date, delimiter, time)<br />
2 = decimal seconds since 1-Jan-1989<br />
3 = decimal minutes since 1-Jan-1989<br />
4 = decimal hours since 1-Jan-1989<br />
5 = decimal days since 1-Jan-1989<br />
P51 Time interval format mode 6 0 to 5 Specifies the format to use when returning a relative time<br />
value:<br />
0 = P39P22d.d (time, delimiter, days)<br />
1 = d.dP22P39 (days, delimiter, time)<br />
2 = decimal seconds<br />
3 = decimal minutes<br />
4 = decimal hours<br />
5 = decimal days<br />
6 = P39 format (hours may be > 24)<br />
P53 Default serial sensor timeout seconds 10 0 to 30000 Max time that the <strong>DT80</strong> will wait for a serial sensor input<br />
or output action to complete.<br />
May be overridden by channel factor<br />
If P53=0 then characters satisfying the input action must<br />
already have been received at the time that the input<br />
action is processed.<br />
P55 Enable schedule wakeup bitmask 16383 0 to 16383 bit 0 = not used<br />
bit 1 set = wake from sleep if schedule X is due<br />
bit 2 set = wake from sleep if schedule A is due<br />
bit 3 set = wake from sleep if schedule B is due<br />
…<br />
bit 12 set = wake from sleep if schedule K is due<br />
bit 13 set = wake from sleep if schedule S is due<br />
By default <strong>DT80</strong> will wake if any schedule is due.<br />
P56 Diagnostic output bitmask 0 0 to 163832 Enable diagnostic output<br />
bit 0 set (e.g. P56=1) – SERIAL channel<br />
bit 1 set (e.g. P56=2) – SDI12<br />
bit 2 set (e.g. P56=4) – Modbus<br />
bit 3 set (e.g. P56=8) – FTP<br />
P62<br />
Retain multiplexer settings after<br />
measurement<br />
Table 4: <strong>DT80</strong> Parameters<br />
bit 4 set (e.g. P56=16) – Modem<br />
mode 0 0 to 1 0 = all terminals are disconnected from the <strong>DT80</strong><br />
measurement and excitation circuits at the end of each<br />
scan<br />
1 = connections are left set according to the last<br />
measurement in the schedule. This can be useful for<br />
verifying the <strong>DT80</strong>'s excitation output, or for rapid<br />
measurements of a single channel.<br />
UM-0085-B2 <strong>DT80</strong> <strong>Series</strong> User’s <strong>Manual</strong> Page 200
Switches<br />
<strong>DT80</strong> switches provide a further set of boolean parameters. Each switch is identified by a letter, and can either be on<br />
(uppercase) or off (lowercase).<br />
Reading Switches<br />
To read the current settings of all switches, use the STATUS9 command (P211), e.g.:<br />
STATUS9<br />
/C/d/E/f/h/i/K/l/M/N/R/S/t/U/w/x/Z<br />
Switches that are ON are displayed in uppercase.<br />
Setting Switches<br />
Switches can be set at any time, and new settings generally take effect immediately. For example, send:<br />
/T /e/m<br />
to set switch T on, and set switches E and M off.<br />
Note Switches are not channels. The statement /T is a command, and is carried out immediately, even if it appears within<br />
a schedule definition. You can use the DO command to set switches when a schedule executes – see Executing Commands<br />
in Schedules (P52) for more information.<br />
Switch Lifetime<br />
Switches work in the same way as parameters. All switch settings are cleared back to their default values when a soft or hard<br />
reset (RESET or SINGLEPUSH) is performed, or if both external and battery power is lost.<br />
As with parameters, to make a switch setting "permanent", it should be set using the matching profile setting (see Profile<br />
Settings (P202)), e.g.<br />
PROFILE SWITCHES T=ON<br />
The <strong>DT80</strong> recognises the following switches:<br />
Switch Function Default Comment<br />
/C Include Channel name /C Returns channel name before each data value (/h mode only)<br />
/D Include Date /d Returns current date before each scan's data. (/h mode only, see also /N)<br />
/E Enable command Echo /E Enables echo of commands to host computer (if not unloading data and not in<br />
fixed-format mode).<br />
/F Lock (Fix) schedules /f Prevents a <strong>DT80</strong>’s scan schedules (trigger or channel list) being modified. Note<br />
that a reset still erases the schedules.<br />
/H Fixed-format (Host) mode /h Returns data in fixed-format mode (P23).<br />
/I Include Schedule ID /i Returns schedule ID before returning the schedule's data (/h mode only, see<br />
also /N)<br />
/K Enable automatic<br />
re-calibration<br />
/K Before each scan the <strong>DT80</strong> checks for drift due to changes in ambient<br />
temperature and re-calibrates if required.<br />
/L Include serial number /l Returns logger serial number before each scan's data (/h mode only, see also<br />
/N)<br />
/M Enable Messages /M Enables error and warning messages to be returned to host<br />
/N Include verbose ID /N Returns "datataker 80 " before serial number (/h/L mode only)<br />
Returns "Schedule " before schedule ID (/h/I mode only)<br />
Returns "Date " before scan date (/h/D mode only)<br />
Returns "Time " before schedule ID (/h/T mode only)<br />
/R Enable data Return /R Returns real-time data to the host computer.<br />
/S Synchronize to midnight /S Synchronizes all schedules’ time intervals to midnight — for example, RA1H<br />
scans on the hour. See Time Triggers — Synchronizing to Midnight (P51).<br />
/T Include Time /t Returns current time before each scan's data. (/h mode only, see also /N)<br />
/U Include Units /U Appends measurement units to returned data (/h mode only)<br />
Separates data items by CRLF rather than P22 character (/h mode only)<br />
Makes error messages verbose<br />
/W Return Working channels /w Allows working channels (see W channel option (P41)) to be returned (for<br />
diagnostic purposes) but not logged.<br />
/X Progressive maxima and<br />
minima<br />
/x Displays the progressive maximum and minimum values for statistical channels<br />
on the built-in display only.<br />
/Z Enable alarm messages /Z Enables alarms to issue action text to host computer or printer.<br />
// Default switches – Sets all switches to their default state<br />
Table 5: <strong>DT80</strong> Switches<br />
UM-0085-B2 <strong>DT80</strong> <strong>Series</strong> User’s <strong>Manual</strong> Page 201
Profile Settings<br />
The <strong>DT80</strong> profile is a group of named settings which control aspects of the logger's operation. Unlike parameters and<br />
switches, profile settings are "permanent", in that they are not cleared by a soft or hard reset (RESET and SINGLEPUSH<br />
commands respectively, see Resetting the <strong>DT80</strong> (P208))<br />
Structure<br />
The <strong>DT80</strong>'s profile settings are divided into a number of sections, each of which deals with a particular area, e.g. host port,<br />
modem, Modbus server, etc. Each section is identified by name, e.g. "HOST_PORT".<br />
Each section then contains a number of keys (settings). Each key has a name (e.g. "BPS") and a value (e.g. "57600").<br />
Depending on the key, the value may be a numeric, boolean (yes/no) or string value.<br />
The value of any of the defined keys can be viewed of changed using the PROFILE command.<br />
The PROFILE Command<br />
The PROFILE command syntax is as follows:<br />
Command<br />
PROFILE<br />
PROFILE section<br />
PROFILE section key<br />
PROFILE section key=<br />
PROFILE section=<br />
PROFILE section key=keystring<br />
Displaying Profile Settings<br />
Description<br />
return current settings for all profile keys<br />
return current settings for all profile keys in section<br />
return current value of specified profile key<br />
set specified profile key to default value<br />
set all keys in section to default value<br />
set specified profile key to keystring. Enclose in quotes, i.e. "keystring" if<br />
the string contains spaces or control characters<br />
The following command will display all profile values in the HOST_PORT section:<br />
PROFILE HOST_PORT<br />
[HOST_PORT]<br />
BPS = 57600<br />
DATA_BITS = 8<br />
STOP_BITS = 1<br />
PARITY = NONE<br />
*FLOW = HARDWARE<br />
FUNCTION = COMMAND<br />
When profile values are returned, an asterisk (*) before a key name indicates that the key has been changed from its factory<br />
default value. In the above example, to return the FLOW key to its default setting you would use:<br />
PROFILE HOST_PORT FLOW=<br />
Setting Profile Keys<br />
The following command will change the default host baud rate to 115200 bps:<br />
PROFILE HOST_PORT BPS=115200<br />
Profile setting changes generally take effect immediately. So in this case, if the active command port was the host RS232<br />
port then all subsequent commands would need to be sent at 115200 bps.<br />
The <strong>DT80</strong> supports the following profile keys:<br />
UM-0085-B2 <strong>DT80</strong> <strong>Series</strong> User’s <strong>Manual</strong> Page 202
Section Name Key Name Legal Values Factory Default Comment<br />
PARAMETERS Pn integer<br />
limits vary with<br />
parameter<br />
varies with<br />
parameter<br />
Sets the specified parameter to the<br />
specified value, and makes it the<br />
"default" value, i.e. the value to which it<br />
will be set on soft or hard reset.<br />
See Table 4: <strong>DT80</strong> Parameters (P200).<br />
SWITCHES A, B, C,…Z OFF, ON varies with switch Similarly for switches<br />
See Table 5: <strong>DT80</strong> Switches (P201)<br />
HOST_PORT BPS 300, 600, 1200, 57600<br />
2400, 4800,<br />
9600, 19200,<br />
38400, 57600,<br />
115200<br />
DATA_BITS 7, 8 8<br />
STOP_BITS 1, 2 1<br />
PARITY<br />
NONE, EVEN, ODD NONE<br />
FLOW<br />
HARDWARE,<br />
SOFTWARE, NONE<br />
SOFTWARE<br />
FUNCTION<br />
COMMAND, PPP, COMMAND<br />
SERIAL, MODBUS,<br />
MODBUS_MASTER,<br />
DISABLE<br />
SERSEN_PORT BPS 300, 600, 1200, 1200<br />
2400, 4800,<br />
9600, 19200,<br />
38400, 57600<br />
DATA_BITS 7, 8 8<br />
STOP_BITS 1, 2 1<br />
PARITY<br />
NONE, EVEN, ODD NONE<br />
FLOW<br />
HARDWARE, NONE<br />
SOFTWARE, NONE<br />
MODE<br />
RS232, RS422, RS232<br />
RS485<br />
FUNCTION<br />
COMMAND, PPP, SERIAL<br />
SERIAL, MODBUS,<br />
MODBUS_MASTER,<br />
DISABLE<br />
USB_PORT FUNCTION COMMAND, PPP, COMMAND<br />
SERIAL, MODBUS,<br />
MODBUS_MASTER,<br />
DISABLE<br />
HOST_MODEM<br />
ETHERNET<br />
PPP<br />
Serial parameters for Host RS-232 port<br />
See Configuring the Host RS-232 Port<br />
(P168)<br />
Host port function: command/PPP<br />
interface, PPP interface, serial channel<br />
or Modbus<br />
Serial parameters for Serial Sensor port<br />
See Configuring the Serial Sensor Port<br />
(P171)<br />
Serial sensor port function:<br />
command/PPP interface, PPP interface,<br />
serial channel or Modbus<br />
USB port function: command/PPP<br />
interface, PPP interface, serial channel<br />
or Modbus<br />
See Configuring the USB Port (P160)<br />
DIAL string ATD Issued as prefix to number specified in<br />
the SETDIALOUTNUMBER command<br />
INIT string AT String to send to initialise host port<br />
modem<br />
EXT_POWER_SWITCH<br />
MAX_CD_IDLE<br />
NONE, 1RELAY,<br />
nDSO, 1SSPWR<br />
integer<br />
(seconds)<br />
NONE<br />
43200<br />
(12 hours)<br />
Output channel used to control modem<br />
power<br />
The number of seconds to wait while the<br />
DCD signal is inactive before<br />
re-initialising the modem (0=disable).<br />
SEND_BANNER_ON_CONNECT YES, NO NO Send banner string such as dataTaker<br />
80 Version 5.08 whenever the DCD<br />
signal changes goes active.<br />
COMMAND_PROCESSING_TIME integer<br />
1 Delay between sending modem<br />
(seconds)<br />
commands<br />
ENABLE YES, NO YES Enable Ethernet port<br />
IP_ADDRESS n.n.n.n or AUTO AUTO IP address to assign to the <strong>DT80</strong>'s<br />
Ethernet port<br />
AUTO = use DHCP to automatically set<br />
IP address, subnet mask, gateway and<br />
DNS servers.<br />
SUBNET_MASK n.n.n.n 255.255.255.0 Subnet mask for the network segment<br />
connected to the <strong>DT80</strong>'s Ethernet port.<br />
GATEWAY n.n.n.n 0.0.0.0 IP address of the computer that acts as<br />
a gateway to other networks.<br />
Set to 0.0.0.0 if there is no gateway<br />
SERSEN_IP_ADDRESS n.n.n.n 1.0.0.1 <strong>DT80</strong> IP address when using PPP<br />
connection to serial sensor port.<br />
HOST_IP_ADDRESS n.n.n.n 1.0.0.2 <strong>DT80</strong> IP address when using PPP<br />
connection to host port.<br />
USB_IP_ADDRESS n.n.n.n 1.0.0.3 <strong>DT80</strong> IP address when using PPP<br />
connection to USB port.<br />
UM-0085-B2 <strong>DT80</strong> <strong>Series</strong> User’s <strong>Manual</strong> Page 203
Section Name Key Name Legal Values Factory Default Comment<br />
SERSEN_REMOTE_IP_ADDRESS n.n.n.n 1.0.1.1 IP address to assign to the host<br />
computer when using PPP connection to<br />
serial sensor port.<br />
HOST_REMOTE_IP_ADDRESS n.n.n.n 1.0.1.2 IP address to assign to the host<br />
computer when using PPP connection to<br />
host port.<br />
USB_REMOTE_IP_ADDRESS n.n.n.n 1.0.1.3 IP address to assign to the host<br />
computer when using PPP connection to<br />
USB port.<br />
USER string ANONYMOUS<br />
PASSWORD string PASSWORD<br />
User name and password that a remote<br />
PPP client must supply in order to<br />
connect to the <strong>DT80</strong> via PPP (not<br />
required for USB port)<br />
FTP_SERVER SUPPORTED YES, NO YES Enable <strong>DT80</strong> FTP server<br />
USER string DATATAKER Username and password that an FTP<br />
PASSWORD string DATATAKER client must supply in order to be granted<br />
read/write access.<br />
ALLOW_ANONYMOUS YES, NO YES If YES, read-only FTP access is<br />
permitted for anonymous users<br />
If NO, all FTP users must login using the<br />
configured username and password.<br />
NETWORK<br />
DNS_SERVER_1 n.n.n.n 0.0.0.0 IP address of primary DNS server. Must<br />
be set if host names (as opposed to IP<br />
addresses) are used for FTP transfers<br />
DNS_SERVER_2 n.n.n.n 0.0.0.0 IP address of secondary DNS server, to<br />
be used if primary server is unavailable.<br />
COMMAND_SERVER PORT 0-65535 7700 TCP port number used by command<br />
interface (0=disable)<br />
HTTP_SERVER DOC_ROOT string B:\WWW\ Base directory for web pages<br />
PORT 0-65535 80 TCP port number used by web server<br />
(0=disable)<br />
MODBUS_SERVER TCPIP_PORT 0-65535 502 TCP port number used by Modbus<br />
server (0=disable)<br />
SERSEN_ADDRESS 0-247 0 The <strong>DT80</strong>'s slave address when using<br />
Modbus on the serial sensor port<br />
(0=disable)<br />
HOST_ADDRESS 0-247 0 The <strong>DT80</strong>'s slave address when using<br />
Modbus on the host port. (0=disable)<br />
USB_ADDRESS 0-247 0 The <strong>DT80</strong>'s slave address when using<br />
Modbus on the USB port. (0=disable)<br />
NTP<br />
BACKGROUND_ENABLE YES, NO NO Periodically synchronise <strong>DT80</strong> system<br />
time to an NTP server<br />
SERVER string 0.datataker.<br />
pool.ntp.org<br />
NTP server address (numeric IP<br />
address or host name)<br />
BACKGROUND_PERIOD time 30M-7D 3599S Interval between NTP updates<br />
MAX_SLEW_CORRECTION time 0-60S 1800T Max allowable time adjustment using<br />
"gradual" adjustment method<br />
MAX_JUMP_CORRECTION time 0-24H 24H Max allowable time adjustment using<br />
"time jump" method<br />
MIN_CORRECTION time 0-24H 0 Minimum time adjustment to apply<br />
SLEW_RATE 1-50 10 Percentage change to clock rate during<br />
gradual adjustment<br />
TIMEOUT time 0-10S 200T NTP request timeout<br />
BACKGROUND_WAKEUP_DELAY time 0-10M 3S Delay following wakeup before first NTP<br />
request<br />
LOCALE TIME_ZONE time -24H-24H 0 Local time zone offset<br />
STARTUP<br />
RUN<br />
CURRENT_JOB,<br />
NONE, jobname<br />
CURRENT_JOB Job to be automatically loaded following<br />
hard reset<br />
MAINTAIN_OUTPUTS YES, NO NO Restore state of digital outputs 1..8DSO<br />
and 1RELAY following hard reset<br />
DISPLAY<br />
AUTOSCROLL_INTERVAL time 0-24H 0 Auto scroll through channel screens on<br />
LCD at this rate (0=disable)<br />
AUTOSCROLL_DELAY time 0-24H 30S Suspend autoscroll for this time if key<br />
pressed<br />
AUTOACK_DELAY time 0-24H 0 Auto-acknowledge pop-up messages on<br />
LCD after this time (0=disable)<br />
FUNCTION Fn_LABEL string (empty) Label for LCD function key #n (n=1-10)<br />
Fn_COMMAND string (empty) Command string for LCD function key #n<br />
(n=1-10)<br />
Table 6: <strong>DT80</strong> PROFILE Details<br />
Values marked time in the table are specified in a similar way to schedule time intervals – that is, an integer followed by a unit<br />
letter (D, H, M, S or T for days, hours, minutes, seconds and milliseconds respectively).<br />
UM-0085-B2 <strong>DT80</strong> <strong>Series</strong> User’s <strong>Manual</strong> Page 204
Examples<br />
To set the <strong>DT80</strong>'s IP address for the Ethernet port:<br />
PROFILE ETHERNET IP_ADDRESS=192.168.1.225<br />
To set the default date format to North American style:<br />
PROFILE PARAMETERS P31=2<br />
Note Special characters may be inserted into profile values using ^x or \nnn notation, as described in ASCII-Decimal<br />
Tables (P314). This means that if the profile value requires an actual \ character then it must be entered twice, e.g.<br />
PROFILE HTTP_SERVER DOC_ROOT=B:\\WWW\\FLASH\\<br />
Remember also that if DeTransfer is used to send the above line then the backslashes must be doubled again, i.e.<br />
PROFILE HTTP_SERVER DOC_ROOT=B:\\\\WWW\\\\FLASH\\\\<br />
Setting the System Time<br />
The <strong>DT80</strong>’s real-time clock/calendar is based on a 24-hour clock that has a resolution of approximately 0.1ms. This is used<br />
to timestamp all logged data.<br />
Time and date are maintained when the logger is switched off or reset. If the logger is switched off and the internal<br />
Memory-Backup battery (see Internal Memory-Backup Battery(P223)) is removed or discharged, then the date and time will<br />
be reset to 1989/01/01 00:00:00<br />
D and T Channel Types<br />
The <strong>DT80</strong>'s time and date can be set using the T and D internal channel types (Time (P31)), e.g.:<br />
T=13:05<br />
Time 13:05:00.000<br />
D=1/4/2006<br />
Date 01/04/2006<br />
The time and date must be specified in the current P39 and P31 formats.<br />
The time can also be set to a CV value, where the CV value is the number of seconds since midnight. Similarly for the date,<br />
except the value is now the number of seconds since the base date (1/1/1989).<br />
For example, to set the system time forward one hour you could use:<br />
T(=1CV) 1CV(W)=1CV+3600 T=1CV<br />
Time 15:59:23.460<br />
Time 16:59:23.461<br />
Note that only a single CV can be placed after the "=". Expressions are not supported.<br />
DT Command<br />
Alternatively, the DT command can be used to set both date and time. In this case the date/time is specified either in<br />
dataTaker ISO format or ISO8601 format and enclosed in square brackets, e.g.:<br />
DT=[2006/04/01,13:05:00] or<br />
DT=[2006-04-01T13:05:00]<br />
Time Zone<br />
Depending on the application, you may choose to set the <strong>DT80</strong>'s time to either:<br />
local time. In this case you may need to alter the time periodically to adjust for daylight saving time, if applicable.<br />
local standard time. The logger is still set to the local time zone, but no correction is made for daylight saving time.<br />
UTC (GMT) time. This may be appropriate if there are a number of <strong>DT80</strong>s (connected to the host computer via a wide<br />
area TCP/IP network, for example) which are in different time zones.<br />
The <strong>DT80</strong> and the dataTaker host software currently do not provide any specific support for data collected in disparate time<br />
zones – it is therefore up to the user to manage this.<br />
Note If the <strong>DT80</strong> system time is synchronised to an NTP server (see below), and the <strong>DT80</strong> time is set to local or local<br />
standard time, then the TIME_ZONE profile setting must be set correctly. If NTP is not used then this profile setting is not<br />
used.<br />
Automatic Time Adjustment (NTP)<br />
Network Time Protocol (NTP) allows devices on a TCP/IP network to synchronise their clock to an NTP server, which will in<br />
turn be linked to a very accurate time reference.<br />
If your <strong>DT80</strong> has Internet access, or if you have access to an NTP server on your local network, then you can enable the<br />
<strong>DT80</strong>'s automatic time adjustment feature. The <strong>DT80</strong> will then periodically (by default, hourly) contact the NTP server and if<br />
necessary adjust its clock/calendar to match.<br />
For small time adjustments (by default, up to 1.8 seconds) the <strong>DT80</strong> will gradually adjust its time by speeding up or slowing<br />
UM-0085-B2 <strong>DT80</strong> <strong>Series</strong> User’s <strong>Manual</strong> Page 205
down its clock for a period of time. This avoids any sudden changes in time, and the time will never go backwards (which<br />
could have caused complications when you came to interpret the logged data). This process is also referred to as "slewing"<br />
the time.<br />
For example, if the NTP server indicates that the <strong>DT80</strong> time is 1.2 seconds fast then the <strong>DT80</strong> clock will be slowed down by<br />
10% (by default). After 13.2 seconds (12.0s as measured by the <strong>DT80</strong> clock) the required time adjustment of -1.2s will have<br />
been made and the clock rate will be set back to normal.<br />
If a larger time adjustment is required, the "gradual" method is impractical and the <strong>DT80</strong> will do a "jump" adjustment, where<br />
the time will change instantaneously (forward or backward). A message is logged to the event log (see Event Logs (P211))<br />
each time a time jump occurs (including manual time changes).<br />
Using NTP<br />
In order to use NTP, you first need to ensure that you have an accessible NTP server.<br />
If the <strong>DT80</strong> has access to the Internet then you can use the public NTP server at 0.datataker.pool.ntp.org.<br />
Alternatively, a local NTP server may be available on the local area network to which the <strong>DT80</strong> is connected. If this is the<br />
case then you will need to find out the IP address or host name of the NTP server. Note that using a local server will normally<br />
result in better time accuracy, because it avoids the variable delays that may occur when making a request over the Internet.<br />
Once you have determined the address of the NTP server that you wish to use, you can enable NTP updates by setting the<br />
following profiles:<br />
PROFILE LOCALE TIME_ZONE=offset<br />
PROFILE NTP SERVER=host address<br />
PROFILE NTP BACKGROUND_ENABLE=YES<br />
The timezone setting (offset) is the time difference between UTC (GMT) time and the logger's local time. For example, for<br />
Pacific Standard Time (UTC-8:00), use<br />
PROFILE LOCALE TIME_ZONE=-8H<br />
while for Australian Central Standard Time (UTC+9:30), use<br />
PROFILE LOCALE TIME_ZONE=570M<br />
(9.5 hours = 570 minutes)<br />
The NTP server address (host address) may be specified as a numeric IP address (e.g. 10.2.30.212) or as a host name<br />
(e.g. ntp3.petacorp.com). Using a host name requires that the <strong>DT80</strong> have access to a working DNS (domain name<br />
system) server.<br />
NTP Options<br />
The above three profile settings are the minimum that need to be set in order to enable NTP updates. There are, however, a<br />
number of settings that may be adjusted to suit particular applications.<br />
Time Request Interval<br />
By default, the <strong>DT80</strong> will perform a time request every 3599 seconds. Selecting a value of "not quite one hour" helps ensure<br />
that the <strong>DT80</strong>'s requests do not ever end up always occurring "on the hour". NTP servers tend to be busiest at this time and<br />
this can cause reduced time accuracy for requests made at these times.<br />
The request interval can be changed to any value from 30 minutes to 7 days, using the following profile:<br />
PROFILE NTP BACKGROUND_PERIOD=time<br />
where time is a time value such as 50M (50 minutes) or 97H (97 hours)<br />
Correction Limits<br />
When the <strong>DT80</strong> obtains a time value from the NTP server, it will do one of the following, based on the magnitude of the<br />
required time adjustment:<br />
do nothing (the <strong>DT80</strong> time is already "close enough")<br />
begin a gradual time adjustment (speed up or slow down the <strong>DT80</strong> clock rate until it reaches the correct time)<br />
immediately set the <strong>DT80</strong> time to the NTP server value<br />
do nothing (the time difference is very great – possibly the NTP server is faulty)<br />
The following profiles set the thresholds between these behaviours:<br />
PROFILE NTP MIN_CORRECTION=time specifies the smallest time adjustment that will be applied. By default this<br />
is 0, so all NTP updates will be applied, even if the time error is only very small.<br />
PROFILE NTP MAX_SLEW_CORRECTION=time specifies the largest adjustment that will be performed using the<br />
"gradual" adjustment method. By default this is 1.8 seconds (1800T). Setting this larger will reduce the chance of<br />
time jumps in logged data, at the expense of possibly allowing larger time deviations from the true time.<br />
PROFILE NTP MAX_JUMP_CORRECTION=time specifies the largest adjustment that will be performed using the<br />
"jump" adjustment method. If the time difference is greater than this then the <strong>DT80</strong> will reject it and do nothing. By<br />
default this setting is 24 hours (24H). This value allows a logger that has changed time zone to receive its initial time<br />
update from NTP rather than having to be set manually. However you may wish to reduce this value in order to prevent<br />
the <strong>DT80</strong> clock being changed when the server time difference is unexpectedly large – possibly due to a faulty server.<br />
Set to 0 to disable "jump" corrections altogether.<br />
If all power to the <strong>DT80</strong> is lost, including the internal lithium battery, then the <strong>DT80</strong>'s clock will be reset to 1-Jan-1989. As a<br />
UM-0085-B2 <strong>DT80</strong> <strong>Series</strong> User’s <strong>Manual</strong> Page 206
special case, therefore, if the <strong>DT80</strong> finds that its date is set to a value earlier than 2000 then it will apply any NTP update,<br />
even though the "max jump correction" limit is exceeded.<br />
Gradual Adjustment Rate<br />
By default, during a gradual time adjustment the <strong>DT80</strong> clock will run 10% faster or slower. This rate can be adjusted between<br />
1% and 50% using the following profile:<br />
PROFILE NTP SLEW_RATE=percent<br />
Lower rates will give a more gradual time adjustment, which may be preferable if your data is being logged at a fast rate, at<br />
the expense of the adjustment process taking longer.<br />
Communications Timing<br />
When the <strong>DT80</strong> sends a time request, it expects a timely reply. A late reply (e.g. due to network congestion) may be worse<br />
than no reply at all, given that the purpose of the message is to accurately set the <strong>DT80</strong> time. Consequently the default<br />
communications timeout for NTP is set to be quite short (200ms, or 200T). If, however, you have a slow or unreliable<br />
network connection then you may need to increase this, using the following profile:<br />
PROFILE NTP TIMEOUT=time<br />
Sleep Wakeup Timing<br />
Each time the <strong>DT80</strong> wakes from sleep, it will attempt to perform an NTP time update. However, it can take a little time for the<br />
network to become operational following wake – for example a DHCP query may need to be done. By default therefore, the<br />
<strong>DT80</strong> will, after waking up, wait 3 seconds before attempting an NTP request. This may be adjusted up or down using the<br />
following profile:<br />
PROFILE NTP BACKGROUND_WAKEUP_DELAY=time<br />
<strong>Manual</strong>ly Triggered NTP Requests<br />
When background NTP requests are enabled in the profile, a request will be performed:<br />
at the configured time intervals<br />
following hard reset<br />
following wake from sleep<br />
following any change to any of the NTP profile settings<br />
An NTP request can also be triggered manually, regardless of whether or not background NTP updates are enabled. This is<br />
done using the NTP command. This command may then be included in a schedule, inside an ALARM or DO statement, which<br />
allows more control over the timing of NTP requests.<br />
The NTP command will perform an immediate NTP request, using the settings defined in the profile (the<br />
BACKGROUND_ENABLE, BACKGROUND_PERIOD and BACKGROUND_WAKEUP_DELAY settings will be ignored)<br />
Checking NTP Status<br />
System variable 26SV reports the status of the last NTP request, as follows<br />
26SV Meaning<br />
0 No NTP requests have been performed<br />
1 Gradual time adjustment in progress<br />
2 Time adjustment completed successfully<br />
-1 Could not resolve NTP server name<br />
-2 NTP request failed: could not connect to server, or no response within timeout time<br />
-3 Required time adjustment was not performed because it exceeded the<br />
MAX_SLEW_CORRECTION and MAX_JUMP_CORRECTION settings.<br />
-4 NTP request failed due to an internal <strong>DT80</strong> error<br />
-5 Daily limit of 50 requests to 0.datataker.pool.ntp.org was exceeded<br />
System variable 27SV returns the discrepancy between the <strong>DT80</strong>'s time and the NTP server, as at the last successful NTP<br />
request. If the NTP request resulted in the <strong>DT80</strong> clock being adjusted, 27SV holds the discrepancy before the correction was<br />
applied. For example, a value of -150 indicates that the logger time was 150ms ahead of the NTP server time. 27SV=0 if no<br />
NTP requests have been made.<br />
Any request that results in a "time jump" adjustment will also be logged to the event log.<br />
UM-0085-B2 <strong>DT80</strong> <strong>Series</strong> User’s <strong>Manual</strong> Page 207
Resetting the <strong>DT80</strong><br />
The <strong>DT80</strong> can be reset in the following ways:<br />
<br />
<br />
<br />
soft reset – clears current job and resets parameters and switches<br />
hard reset – restarts <strong>DT80</strong> firmware<br />
safe mode reset (a.k.a. triple push reset) – restarts <strong>DT80</strong> firmware and runs using factory default settings.<br />
Soft Reset<br />
The RESET command performs a soft reset, which has the following effects:<br />
<br />
<br />
The message Initializing... is returned.<br />
The current job is cleared, i.e. all schedule and channel definitions are cleared.<br />
All span/polynomial definitions are cleared.<br />
All CVs are reset to 0.0.<br />
All parameters and switches are reset to their power-on default values, as specified in the associated profile settings.<br />
All digital outputs are reset to their default state.<br />
All counter channels are reset to 0.<br />
All Modbus definitions set using the SETMODBUS command are cleared.<br />
All serial port settings set using PH= and PS= revert to the settings specified in the profile.<br />
The modem dialout number set by SETDIALOUTNUMBER is cleared.<br />
A self-calibration is performed.<br />
A soft reset is analogous to closing and restarting an application on a PC.<br />
Hard Reset<br />
A hard reset causes all <strong>DT80</strong> hardware to be physically reset, and the <strong>DT80</strong> firmware will be restarted. A hard reset may be<br />
caused by:<br />
the SINGLEPUSH command<br />
pressing the manual reset button (by inserting a straightened paper clip into the small hole between the Ethernet and<br />
USB connectors)<br />
applying power following a complete loss of power (e.g. external power disconnected and the battery link is not in<br />
place, or the main battery is completely flat)<br />
applying power after the <strong>DT80</strong> entered forced sleep mode due to battery voltage dropping below power fail threshold.<br />
the <strong>DT80</strong> detecting a critical error such as a serious hardware fault, or an internal inconsistency in the firmware. In<br />
these situations a hard reset is forced in order to try to return the <strong>DT80</strong> to a stable operational state.<br />
A hard reset is analogous to rebooting a PC.<br />
A hard reset has the following effects:<br />
All TCP/IP (Ethernet or PPP) connections are terminated.<br />
USB connection is terminated if power was lost.<br />
All communications and other settings are read from the profile and applied.<br />
All LEDs flash rapidly four times.<br />
If the reset was due to a power failure, manual reset button or critical error, then a message is displayed on the LCD<br />
(e.g. <strong>DT80</strong> restarted / Power loss) and the Attn LED starts flashing.<br />
A sign-on message e.g. dataTaker 80 Version 8.00 is returned. (This can be disabled if required by switching off<br />
the messages flag in the startup profile, i.e. PROFILE SWITCHES M=OFF)<br />
A soft reset is performed, as described in the previous section.<br />
If the STARTUP / MAINTAIN_OUTPUTS profile is set to YES then all digital outputs are restored to the state they<br />
had prior to the reset.<br />
The job that was running prior to the reset is re-loaded, and becomes the current job. Alternatively, a particular job or<br />
no job at all may be loaded by setting the STARTUP / RUN profile.<br />
Note A hard reset may take a few seconds to perform. You should refrain from sending further commands to the <strong>DT80</strong><br />
UM-0085-B2 <strong>DT80</strong> <strong>Series</strong> User’s <strong>Manual</strong> Page 208
during this time.<br />
Safe Mode<br />
If there is an error in the <strong>DT80</strong>'s profile settings or the job that is automatically loaded following hard reset then you may find<br />
that you are unable to communicate with the logger. For example – the startup profile specifies the wrong RS232 parameters<br />
(and you're not sure what they are), or the job specifies an immediate 1SERIAL channel with a very long timeout (and the<br />
serial channel is not connected to anything).<br />
Safe Mode provides a mechanism to regain control and fix the problem. To select safe mode you need to perform a<br />
"triple-push" reset:<br />
1. Press the manual reset button<br />
2. Wait approximately 3 seconds, then press the reset button again.<br />
3. Wait approximately 3 seconds, then press the reset button a third time.<br />
4. Verify that <strong>DT80</strong> restarted / Safe mode is displayed on the LCD.<br />
This will have the same effect as a hard reset, except that:<br />
all profile settings are ignored – factory default settings are used (for example, the host port parameters will be set to<br />
57600,8,N,1,SWFC)<br />
no job is loaded<br />
Note that the profile settings are not cleared – they are simply ignored for this session only. If you now do a normal hard reset<br />
they will once again be loaded.<br />
Factory Settings<br />
To restore the <strong>DT80</strong> to factory default settings, send the FACTORYDEFAULTS command, which will reset all profile settings<br />
to their factory defaults, then perform a hard reset.<br />
Note that this command does not delete any files from the internal file system. The DELALLJOBS command may be used to<br />
remove all jobs and all logged data.<br />
UM-0085-B2 <strong>DT80</strong> <strong>Series</strong> User’s <strong>Manual</strong> Page 209
Diagnostic Commands<br />
TEST Command<br />
The TEST command causes the <strong>DT80</strong> to perform a self-calibration, then run a series of self tests. Test results that are out of<br />
range are flagged with a FAIL message.<br />
This command can also be issued via the <strong>DT80</strong> web interface (<strong>Series</strong> 2 only).<br />
A typical test report is shown below.<br />
TEST<br />
TEST report generated at 2008/02/13,16:05:09<br />
0 dataTaker 80 Version 7.02.0002 Flash 2007/12/21 17:09:56<br />
29 Product: <strong>DT80</strong>-2<br />
1 Serial Number: 080043<br />
2 VEXT 11.0 V<br />
3 VBAT (6V) 6.74 V PASS<br />
4 IBAT +13 mA PASS<br />
5 VSYS 6.71 V PASS<br />
6 VLITH (3.6V) 3.68 V PASS<br />
7 VDD (3.3V) 3.25 V PASS<br />
8 VANA (3.8V) 3.65 V PASS<br />
9 VRELAY (4.5V) 4.20 V PASS<br />
10 VREF (2.5V) 2509.72 mV PASS<br />
11 Ics I 0.21341 mA PASS<br />
12 Ics II 2.5755 mA PASS<br />
13 Vos diff -0.2 uV PASS<br />
14 Vos 3W I 345.7 uV PASS<br />
24 Vos 3W II -58.7 uV PASS<br />
15 Vos shunt -1.2 uV PASS<br />
16 Vos + 2.4 uV PASS<br />
17 Vos - 2.9 uV PASS<br />
18 Vos * -24.3 uV PASS<br />
19 Vos # 57.6 uV PASS<br />
25 Vos diff atten -0.3 uV PASS<br />
26 Vos + atten 64.4 uV PASS<br />
27 Vos - atten 67.7 uV PASS<br />
28 Vos * atten 37.2 uV PASS<br />
20 Term. factor 1.00470 PASS<br />
21 Shunt (100R) 99.681 Ohm PASS<br />
22 CMRR 137.3 dB PASS<br />
23 Overall health PASS<br />
You can also request just one line of the report using TESTn, where n is the line number (0-29, as indicated above). For<br />
example, the following will return the firmware version number:<br />
TEST0<br />
dataTaker 80 Version 7.02.0002 Flash 2007/12/21 17:09:56<br />
Some other useful test report parameters are described below:<br />
Product – this indicates the product type and series, for example <strong>DT80</strong>-2 indicates a <strong>DT80</strong> <strong>Series</strong> 2.<br />
Serial number – this should match the number on the label affixed to the outside of the unit.<br />
VEXT – the voltage at the external power input.<br />
VBAT – internal battery terminal voltage.<br />
IBAT – internal battery current: positive when battery is charging, negative when discharging.<br />
VLITH – internal memory backup battery terminal voltage.<br />
The other parameters listed in the test report are generally only useful to Datataker service personnel. A description of these<br />
entries is beyond the scope of this manual.<br />
Note that if the main or Lithium battery are absent then there will be FAIL lines in the output from the normal TEST command<br />
UM-0085-B2 <strong>DT80</strong> <strong>Series</strong> User’s <strong>Manual</strong> Page 210
ut this will not affect the overall pass/fail result.<br />
Power on Self Test<br />
The TEST command is also run automatically, following a hard reset. If this test fails then<br />
Self test failed<br />
is displayed on the LCD in conjunction with two flashing LEDs, and a message is output to comms port and event log. Press<br />
any key to clear the LCD message. You should then send a TEST command to see which particular test is failing.<br />
If the power-on test passes there will be no indication (no report is generated).<br />
Event Logs<br />
To aid in troubleshooting, the <strong>DT80</strong> automatically logs significant events into an event log, which is a text file<br />
B:\EVENTS\EVENT.LOG. These events include:<br />
any of the errors listed under Error Messages (P322)<br />
USB memory device inserted<br />
external power connected or disconnected<br />
system time changed<br />
low power forced sleep<br />
FTP errors<br />
logger reset<br />
safe mode (triple push) reset<br />
self test failure<br />
logger not characterised warning<br />
user defined messages, using the LOG "string" command<br />
The event log may help pinpoint the cause of any unexpected readings or failures, and will be used by Datataker engineers<br />
if the <strong>DT80</strong> is returned for service.<br />
In the event of an abnormal reset due to a firmware error, the <strong>DT80</strong> may store additional information in a companion file, the<br />
error log (B:\EVENTS\ERROR.LOG).<br />
The contents of the event and error logs can be viewed using the UEVTLOG and UERRLOG commands.<br />
They may also be viewed via the web interface.<br />
The event and error logs can be cleared using the CEVTLOG and CERRLOG commands.<br />
STATUS Command<br />
The STATUS command returns a report showing the status of the <strong>DT80</strong>'s schedules, channels, alarms, memory and logging<br />
to the host computer. A typical report is shown below:<br />
STATUS<br />
dataTaker 80 Version 6.16.0002 Flash 2007/03/21 17:09:56<br />
A B C,F Scan Schedules Active,Halted<br />
4,0 Alarms/IFs Active,Halted<br />
0 Polynomials/Spans Defined<br />
A B C F,none Scan Schedules LOGON,LOGOFF<br />
61650,1026 Internal kB free,used<br />
0,0 External kB free,used<br />
/C/d/E/f/h/I/K/l/M/N/r/S/t/U/w/x/Z<br />
If the /u switch is set (don't display units) then the descriptive text on the end of each line is not returned.<br />
As with the TEST command, lines in the status report can be returned individually, using STATUSn.<br />
Command<br />
STATUS1<br />
STATUS2<br />
STATUS3<br />
STATUS4<br />
STATUS5<br />
STATUS6<br />
STATUS7<br />
STATUS9<br />
STATUS10<br />
Description<br />
returns model name and firmware version (same as TEST0)<br />
lists active schedules, and halted schedules<br />
returns the number of alarms in active schedules, and the number in halted schedules<br />
returns the number of polynomial/spans defined, and displays the definition of each<br />
lists schedules with logging enabled, and schedules with logging disabled<br />
returns total free space (kbytes) on internal file system, and total used space<br />
returns total free space (kbytes) on inserted USB memory device, and total used space<br />
returns current settings for all switches<br />
returns internal details about the current job<br />
UM-0085-B2 <strong>DT80</strong> <strong>Series</strong> User’s <strong>Manual</strong> Page 211
STATUS14<br />
an extended version of STATUS10<br />
The STATUS14 command is somewhat special in that it can also be applied to a non-current job, i.e.:<br />
STATUS14 "jobname"<br />
CHARAC Command<br />
During manufacture, each <strong>DT80</strong> is characterised – that is, various operational parameters are measured and then<br />
programmed into the unit's flash memory. This process is designed to cancel out any variations between units due to<br />
component tolerances and such like.<br />
The CHARAC command lists the various characterisation parameters. These will vary slightly from unit to unit.<br />
If any of these parameters have not been set correctly then a warning message such as<br />
<strong>DT80</strong> not characterised<br />
will be displayed on the LCD. Contact Datataker support if you see this message.<br />
SERVICEDATA Command<br />
The SERVICEDATA command automatically issues a number of diagnostic commands which together provide a<br />
comprehensive "snapshot" of the current state of the <strong>DT80</strong>. If you contact Datataker support to resolve a problem with the<br />
logger you may be asked to run this command and then send the results to Datataker for analysis.<br />
By default, this command will output its results to the current comms connection. Alternatively, it may be directed to a text file<br />
using: SERVICEDATA "filename". This file may then be retrieved from the logger using FTP or by using the COPY<br />
command to copy it to a USB memory device.<br />
This command can also be issued via the <strong>DT80</strong> web interface (<strong>Series</strong> 2 only).<br />
A SERVICEDATA report includes:<br />
TEST command output<br />
CHARAC command output<br />
STATUS command output<br />
<br />
<br />
<br />
<br />
<br />
<br />
<br />
<br />
<br />
<br />
<br />
<br />
current parameter settings<br />
current profile settings<br />
event log<br />
error log<br />
current job program listing<br />
DIRJOB* command output (storefile status for all jobs)<br />
DIRTREE command output<br />
internal file system integrity check<br />
comms settings and statistics<br />
firmware thread status<br />
memory status<br />
TCP/IP communications status<br />
UM-0085-B2 <strong>DT80</strong> <strong>Series</strong> User’s <strong>Manual</strong> Page 212
Part M – Hardware & Power<br />
Inputs and Outputs<br />
<strong>DT80</strong> Wiring Panel<br />
The front face of the <strong>DT80</strong> is the sensor interface. Removable screw terminal blocks make it easy to connect and disconnect<br />
sensor wiring.<br />
The terminals are labelled as shown below. Note that the label is removable, so it can be replaced with application specific<br />
labelling if required.<br />
DIGITAL<br />
1D<br />
2D 3D 4D D<br />
GND<br />
1C 2C 3C 4C D<br />
1PE<br />
2PE GND<br />
WK 12V<br />
RELAY<br />
A B<br />
5D<br />
Tx Z<br />
6D 7D 8D D<br />
GND<br />
Rx RTS CTS D<br />
A Y B GND<br />
1<br />
*+-#<br />
2<br />
*+-#<br />
3<br />
*+-#<br />
4<br />
*+-#<br />
5<br />
*+-#<br />
EXT<br />
*<br />
EXT<br />
#<br />
EXT<br />
*<br />
EXT<br />
#<br />
ANALOG<br />
<strong>DT80</strong>/80G <strong>Series</strong> 2<br />
DIGITAL<br />
1D<br />
2D 3D 4D D<br />
GND<br />
1C 2C 3C 4C D<br />
1PE GND<br />
WK 12V<br />
RELAY<br />
A B<br />
1<br />
*+-#<br />
EXT<br />
*<br />
EXT<br />
#<br />
EXT<br />
*<br />
EXT<br />
#<br />
ANALOG<br />
Note: for <strong>DT80</strong>/81 <strong>Series</strong> 1 units, AGND replaces EXT#<br />
and DGND replaces 12V<br />
DT81 <strong>Series</strong> 2<br />
1<br />
DIGITAL<br />
3<br />
2 4<br />
1D 2D 3D 4D D<br />
GND<br />
1C 2C 3C 4C<br />
1PE<br />
2PE<br />
D<br />
GND<br />
WK5 12V D 5D 6D 7D 8D 7D<br />
9 1 11 3 5<br />
13<br />
15 7 EXT 9<br />
GND<br />
GND<br />
*+-# *+-# *+-# *+-# * EXT<br />
#<br />
RELAY 6 Tx Rx RTS CTS D<br />
2 4 6<br />
8 10<br />
A B PWR OUT Z A Y B<br />
8 10 12<br />
14<br />
16<br />
GND<br />
* EXT<br />
#<br />
*+-#<br />
*+-#<br />
DT82E<br />
DT85/85G<br />
*+-#<br />
*+-# EXT<br />
ANALOG<br />
11<br />
12<br />
Figure 79 Standard terminal labels for <strong>DT80</strong>, DT81, DT82E and DT85<br />
The sensor interface comprises:<br />
1D – 8D: Digital Input/Output Channels (P259)<br />
WK: Wake Terminal (P229)<br />
12V: 12V power output (<strong>DT80</strong>/81 <strong>Series</strong> 2, DT82E, DT85) (P222)<br />
DGND: Digital Ground (P295)<br />
1C – 4C: High Speed Counter Inputs (P266), shared with Phase Encoder Inputs (1PE – 2PE) (P268)<br />
RELAY: Relay Output (P261)<br />
PWR OUT: Unswitched external power output (DT85) (P222)<br />
Tx/Z Rx/A RTS/Y CTS/B: Serial Sensor Port (P169)<br />
1 – 16 (* + – #): Analog Input Channels (P231)<br />
EXT*: External Excitation Input (P19)<br />
AGND: Analog Ground (<strong>DT80</strong>/81 <strong>Series</strong> 1) (P295)<br />
EXT#: Switched Analog Ground (<strong>DT80</strong>/81 <strong>Series</strong> 2, DT82E, DT85) (P295)<br />
UM-0085-B2 <strong>DT80</strong> <strong>Series</strong> User’s <strong>Manual</strong> Page 213
<strong>DT80</strong> Front Panel<br />
The top face of the <strong>DT80</strong> is the user interface – keypad, display, indicators and USB memory device slot. See <strong>DT80</strong> Front<br />
Panel (P106)<br />
<strong>DT80</strong> Side Panel<br />
Figure 80 <strong>DT80</strong> Side Panel<br />
The <strong>DT80</strong>'s side panel provides communications and power interfaces:<br />
<br />
<br />
<br />
<br />
<br />
<br />
Ethernet Port (P177)<br />
USB Port (not present on DT82E) (P160)<br />
RS232 Port (P166)<br />
Hardware Reset Hole (P208)<br />
External Power Connector (P219)<br />
Plug Pack Power Connector (2-pin connector on DT82E) (P219)<br />
A threaded hole is also provided as an earthing point. This is internally connected to DGND.<br />
For <strong>DT80</strong>G/85G GeoLoggers, there is also a headphone jack on the rear panel, normally covered by a rubber grommet. This<br />
is used for checking the response of vibrating wire strain gauges.(P254)<br />
UM-0085-B2 <strong>DT80</strong> <strong>Series</strong> User’s <strong>Manual</strong> Page 214
Inside the <strong>DT80</strong><br />
Accessing the main battery (not <strong>DT80</strong>G/DT82E)<br />
1. Remove the power connector<br />
2. Remove the screws from the<br />
other end of the logger<br />
3. Remove this end of the logger<br />
4. Pull the purple 'battery tail'<br />
5. Disconnect the battery terminals<br />
Figure 81: How to remove the main battery<br />
UM-0085-B2 <strong>DT80</strong> <strong>Series</strong> User’s <strong>Manual</strong> Page 215
Accessing the lithium memory backup battery<br />
1. Remove the power connector<br />
2. Remove all the terminal blocks<br />
3. Terminal blocks removed<br />
4. Remove the screws from the right<br />
hand end of the logger<br />
5. Remove this end of the logger<br />
6. Pull the purple 'battery tail'<br />
UM-0085-B2 <strong>DT80</strong> <strong>Series</strong> User’s <strong>Manual</strong> Page 216
7. Disconnect the battery terminals<br />
8. Remove screws (2 for <strong>DT80</strong>/81, 3<br />
for DT85) on bottom of logger,<br />
and then remove the battery<br />
cage.<br />
9. Slowly remove the circuit board<br />
bundle. Be careful of the flexible<br />
cable running between the top<br />
circuit board and the keypad. It is<br />
not necessary to completely<br />
remove the circuit boards from<br />
the case.<br />
10. Open the boards slightly so the<br />
lithium battery can be removed.<br />
Figure 82: How to remove the lithium battery<br />
UM-0085-B2 <strong>DT80</strong> <strong>Series</strong> User’s <strong>Manual</strong> Page 217
Mounting the <strong>DT80</strong> and CEM20<br />
Dimensions<br />
180mm (<strong>DT80</strong>/81) / 300mm (DT85)<br />
24mm<br />
75mm<br />
(M5)<br />
38mm<br />
Figure 83: Mounting hole positions and overall dimensions<br />
170mm (<strong>DT80</strong>/81) / 290mm (DT85)<br />
<br />
<br />
<br />
<br />
<br />
<br />
<strong>DT80</strong>/81 overall dimensions (L x W x H): 180mm x 137mm x 65mm<br />
DT85 overall dimensions: 300mm x 137mm x 65mm<br />
CEM20 overall dimensions: 180mm x 100mm x 50mm. Note that CEM20 mounting hole centres are the same as for<br />
the <strong>DT80</strong>/81.<br />
Mounting screw size: M5<br />
Some clearance for communications/power cabling will be required on the left hand side of the unit, and at the front for<br />
sensor wiring.<br />
Logger should be oriented either in table top configuration (keypad/display facing up), or wall mounted (terminals<br />
facing down). Do not wall mount with terminals facing upwards.<br />
Operating Environment<br />
The <strong>DT80</strong> is an electronic instrument. Electronics and water in any form do not mix. Condensation can be a serious problem<br />
in the tropics, and in cooler areas where wide temperature variations are possible. Use a sealed case and include sachets of<br />
silica gel to avoid problems.<br />
If the <strong>DT80</strong> gets wet, immediately disconnect and remove all power sources (including the main internal battery), and dry the<br />
<strong>DT80</strong> in a warm place. If the unit comes into contact with salt water, rinse it thoroughly in fresh water, then in distilled water,<br />
then dry it — salt must NOT be allowed to remain on the circuit boards.<br />
The <strong>DT80</strong> operates over a wide temperature range (–45°C to +70°C), but its accuracy can be reduced at extremes. Try to<br />
minimize the <strong>DT80</strong>’s exposure to temperature extremes.<br />
The capacity and service life of the lead acid battery in the logger will be significantly reduced if it is operated outside the<br />
range -15°C to +50°C. Furthermore, if the battery is subject to regular charge/discharge cycles then the recommended<br />
temperature range is +5°C to +35°C. When operating outside these ranges consideration must be given to an alternative<br />
power source for the logger.<br />
The LCD display is typically only usable over a temperature range of 0°C to +50°C.<br />
UM-0085-B2 <strong>DT80</strong> <strong>Series</strong> User’s <strong>Manual</strong> Page 218
Powering the <strong>DT80</strong><br />
Power Subsystem<br />
The following block diagrams give an overview of the <strong>DT80</strong>'s internal power subsystem.<br />
link<br />
External<br />
Power Input<br />
10 – 30 V<br />
B C – +<br />
IBAT<br />
+ -<br />
VBAT<br />
charger<br />
circuit<br />
Internal battery<br />
6V not <strong>DT80</strong>G<br />
VSYS (5 – 7 V)<br />
DGND<br />
300mA limit<br />
PWR<br />
OUT<br />
DT85 only<br />
12V 150mA reg.<br />
12V<br />
<strong>DT80</strong>/81 <strong>Series</strong> 2<br />
and DT85 only<br />
Figure 84: <strong>DT80</strong>/81/85 internal power subsystem<br />
External<br />
Power Input<br />
10 – 30 V<br />
– +<br />
VSYS (5 – 7 V)<br />
DGND<br />
12V 150mA reg.<br />
12V<br />
Figure 85: DT82E internal power subsystem<br />
External Power<br />
The <strong>DT80</strong> is normally powered by an external 10-30V DC supply. This might, for example, be:<br />
a mains supply (e.g. using the supplied plug pack)<br />
a 12V or 24V solar charged external battery<br />
a 12V or 24V vehicle supply.<br />
This external power supply may be connected in one of two ways:<br />
the round plug pack power socket (inner pin is positive)<br />
the rightmost two terminals (- and +) of the adjacent 4-way removable screw terminal power connector. This provides<br />
a more robust connection.<br />
UM-0085-B2 <strong>DT80</strong> <strong>Series</strong> User’s <strong>Manual</strong> Page 219
Internally these two connectors are wired in parallel, so you can for example power the unit via the plugpack and then draw<br />
power from the screw terminals for powering external relays or sensors.<br />
Note Switch mode power supplies can introduce noise into analog readings and are therefore not normally recommended<br />
for powering the <strong>DT80</strong>.<br />
Internal Power (not DT82E)<br />
If the external power supply is interrupted, the <strong>DT80</strong> can run for a limited time on battery power.<br />
Main battery<br />
The <strong>DT80</strong> and DT81 are fitted with an internal 6V 1.2Ah sealed lead-acid gel-cell battery, while the DT85 uses a higher<br />
capacity 6V 4Ah battery. It’s known as the <strong>DT80</strong>’s "main" battery to distinguish it from the <strong>DT80</strong>’s other internal battery, the<br />
"memory-backup" battery.<br />
Note The <strong>DT80</strong>G does not include an internal battery. It does, however, include the battery charger circuit so an external<br />
lead acid battery can easily be connected; see Connecting a Larger Battery (P220).<br />
The main battery is completely maintenance-free and rechargeable, being automatically charged by the logger’s inbuilt<br />
battery charger whenever an external power supply is connected to the <strong>DT80</strong>. If properly cared for (which essentially means<br />
keeping it charged), the battery should give several years' service.<br />
Note The battery's life will be reduced if operated at temperatures exceeding 50°C.<br />
If the main battery ever needs to be replaced, Inside the <strong>DT80</strong> (P215) explains how to do so.<br />
Connect the Battery Link<br />
The <strong>DT80</strong> is shipped with the main battery disconnected.<br />
To connect the battery, all you need to do is plug the supplied 4-way terminal block into the power connector on the side of<br />
the <strong>DT80</strong>. The supplied terminal block includes a link which connects the B and C terminals on the power connector. This will<br />
connect up the internal battery to the <strong>DT80</strong> circuitry.<br />
It is recommended that the battery link be left permanently attached to the <strong>DT80</strong> during operation. This guarantees<br />
uninterrupted data acquisition and logging because the internal main battery is always available to continue powering the<br />
data logger if the primary/external supply is accidentally disconnected or fails.<br />
Main Battery Life<br />
The length of time that the <strong>DT80</strong> can operate using its internal battery depends on many things, such as:<br />
scan interval<br />
number and types of channels being scanned<br />
volume of RS232/USB/Ethernet communications<br />
power management settings (e.g. sleep mode timeouts)<br />
sensor excitation requirements<br />
condition of internal battery and ambient temperature<br />
For the <strong>DT80</strong>/81 (1.2Ah internal battery), a new, fully charged battery will typically run the logger for between 3 and 3000<br />
hours (4 months), depending on the above factors. The DT85's power consumption is similar to the <strong>DT80</strong>/81, so its 4Ah<br />
battery can be expected to last 3-4 times longer.<br />
The scan interval is the main determinant of battery life. For a continuous schedule with some analog channels, the battery<br />
life would typically be about 3 hours; for a 5 second schedule it would be about 24 hours; while for sample intervals of 1 hour<br />
or greater the battery would typically last for up to 4 months.<br />
In order to properly estimate the expected battery life, it is necessary to calculate the <strong>DT80</strong>'s average power consumption for<br />
the particular application. This is discussed further in Power Consumption (P224).<br />
Connecting a Larger Battery<br />
To extend the time that the <strong>DT80</strong> can run whilst on battery power, a larger capacity battery can be connected externally.<br />
(This is also applicable for the <strong>DT80</strong>G, which does not include an internal battery.) There are two main options, which are<br />
discussed below.<br />
1. External Battery Charged by Logger<br />
An external 6V lead acid battery (max capacity 4Ah) may be connected between the C and – terminals. This will connect<br />
the battery to the output of the <strong>DT80</strong>'s charging circuit. An external power supply should then be connected to the + and –<br />
terminals (or DC power socket).<br />
Note To prevent excessive current flows between the batteries, the internal battery should always be disconnected from the<br />
charging circuit when an external 6V battery is used. This can be achieved either by:<br />
not connecting the battery link between the B and C terminals (Figure 86), or<br />
UM-0085-B2 <strong>DT80</strong> <strong>Series</strong> User’s <strong>Manual</strong> Page 220
connecting the link between the B and C terminals but disconnecting the internal battery connector (Figure 87). If<br />
desired the internal battery can then be removed altogether. This is the preferred option because then the VBAT<br />
channel type can be used to monitor the state of the external battery; see Monitoring <strong>DT80</strong> Power (P223).<br />
External<br />
6V battery<br />
+<br />
–<br />
B C – +<br />
VBAT<br />
charger<br />
circuit<br />
– +<br />
External<br />
Power Input<br />
10 – 30 V<br />
Internal battery<br />
(not used)<br />
Figure 86: Connecting an external 6V battery – battery link removed<br />
External<br />
6V battery<br />
+<br />
–<br />
B C – +<br />
VBAT<br />
charger<br />
circuit<br />
– +<br />
External<br />
Power Input<br />
10 – 30 V<br />
Internal battery<br />
(disconnected)<br />
Figure 87: Connecting an external 6V battery – internal battery disconnected or removed<br />
Note that larger capacity batteries will take longer to charge.<br />
Note also that this configuration is not useful for a DT85 because it already includes a 4Ah internal battery.<br />
Note The <strong>DT80</strong>'s charging circuit includes temperature compensation. For this to be effective, the external battery and the<br />
<strong>DT80</strong> must be at a similar ambient temperature.<br />
2. External Battery with External Charger<br />
In this case an external 6V battery (any type and capacity) is again connected to the C and – terminals. However this time an<br />
external power supply is not connected. The battery is therefore the primary power source for the logger.<br />
As with Option 1, the internal battery must be disconnected, either by not connecting the battery link or by unplugging the<br />
internal battery connector (the latter scenario is shown in the diagram below).<br />
External<br />
6V battery<br />
+<br />
–<br />
B C – +<br />
VBAT<br />
charger<br />
circuit<br />
+ –<br />
External<br />
charger<br />
Internal battery<br />
(disconnected)<br />
Figure 88: Connecting an externally charged 6V battery – internal battery disconnected or removed<br />
In most cases, an external 12/24V battery system connected to the logger's external power input is preferable to an<br />
externally charged 6V battery. This is because it allows the internal battery to act as an Uninterruptible Power Supply (UPS)<br />
and keep the logger running if the external supply is temporarily interrupted. Also, the PWR OUT (<strong>DT80</strong> <strong>Series</strong> 2 and DT85<br />
only) power output will not be available when running from 6V.<br />
UM-0085-B2 <strong>DT80</strong> <strong>Series</strong> User’s <strong>Manual</strong> Page 221
The 6V option is, however, the most power-efficient way to run the logger. See Power Consumption (P224) for more details.<br />
It can therefore be useful in emergency situations where normal power is not available. In these cases the logger could be<br />
powered for a limited time by connecting 4 x 1.5V alkaline cells, for example.<br />
Storage<br />
If the <strong>DT80</strong> is not to be used for a period of time, consideration needs to be given to the health of its internal battery.<br />
Important Avoid storing the internal battery in a discharged state. If a gel-cell battery remains flat for any length of time, its<br />
capacity and service life will be significantly reduced.<br />
Before placing a <strong>DT80</strong> into storage, you should therefore ensure that the main battery is fully charged (at least eight hours<br />
charge time). The battery link should then be disconnected.<br />
Other Considerations<br />
The main battery is a "sealed" type; however it does contain a regulator valve on its top face near the terminals. This has the<br />
following implications:<br />
Ventilation must be provided to allow any battery gases to escape. If the <strong>DT80</strong> is mounted in a sealed enclosure then<br />
a valve should be provided to prevent gas build-up.<br />
When operating at high temperatures, acid may seep from the regulator valve if it is facing downward. The internal<br />
battery's terminals face the rear panel of the <strong>DT80</strong>. The logger should therefore be oriented either in table top<br />
configuration (keypad/display facing up), or wall mounted (input terminals facing down). It should not be wall mounted<br />
upside down (input terminals facing upwards) because then the battery terminals and regulator valve would face<br />
downward.<br />
Power Outputs (<strong>DT80</strong>/82E <strong>Series</strong> 2 and DT85)<br />
As shown in Figure 84, the <strong>DT80</strong>/82E <strong>Series</strong> 2 and DT85 provide general purpose power outputs:<br />
The PWR OUT terminal (DT85 only) provides a current limited power output derived from the external power input.<br />
The output voltage will be 1-2V below that of the external power input. If you attempt to draw more than the rated<br />
maximum current then the voltage output will drop.<br />
The 12V terminal provides a switched regulated 12V output (max 150mA). Unlike PWR OUT, this power is available<br />
even if the logger is running on battery power.<br />
In both cases the power return terminal is DGND.<br />
These power outputs may be used to power such devices as:<br />
CEM20 channel expansion modules (see The CEM20 (P300))<br />
relays (see DO1 – Driving a Relay (P263))<br />
SDI-12 sensor networks (see SDI-12 Channel (P270))<br />
modems (see also Powering the <strong>DT80</strong>’s Modem (P175))<br />
application-specific digital interfaces<br />
analog sensors. Note that there will generally be some AC ripple on the power outputs, so they are not recommended<br />
for powering sensitive circuits such as bridges.<br />
Note The plug pack supplied with the <strong>DT80</strong> is rated at 15V 800mA (12W). However this may be insufficient for a DT85 with<br />
fully loaded power outputs and a flat internal battery, in which case a higher capacity power supply may be required. See<br />
Power Consumption (P224) for more details.<br />
UM-0085-B2 <strong>DT80</strong> <strong>Series</strong> User’s <strong>Manual</strong> Page 222
Controlling 12V Power Output<br />
The switched 12V output may be controlled in three different ways:<br />
<br />
<br />
<br />
It may be switched on or off manually using the 1SSPWR channel type. Use 1SSPWR=1 to switch on the 12V output,<br />
or 1SSPWR=0 to switch it off.<br />
It may be switched on automatically prior to execution of a schedule containing CEM20 channels. (As noted in<br />
Powering the CEM20 (P302), any connected CEM20 units are normally powered using the 12V output.)<br />
It may be switched on or off automatically if the <strong>DT80</strong> is configured to power a modem using this power output, as<br />
described in Powering the <strong>DT80</strong>’s Modem (P175).<br />
Parameter P28 is used to control the behaviour of the 12V output.<br />
P28 Description Scenarios<br />
P28=0 Auto CEM20 power control: <strong>DT80</strong> ensures that 12V is • 12V output is used to power CEM20s<br />
default switched on prior to execution of a schedule that contains<br />
CEM20 channels. 12V will be switched off at the end of the<br />
schedule (unless there is another schedule due which<br />
requires it)<br />
P28=1 12V output is switched on all of the time • 12V output is used to power other equipment<br />
• 12V output is used to power CEM20s and you<br />
wish to avoid the 50ms warm up delay which<br />
occurs each time the 12V output is switched on<br />
P28=2 12V output is switched on all of the time, even when asleep • 12V output is used to power other equipment<br />
which needs to remain powered even if <strong>DT80</strong> is<br />
asleep (e.g. a dial-in modem)<br />
P28=3 12V output is not changed • 12V output to be controlled explicitly, using<br />
1SSPWR=<br />
• CEM20s are assumed to be independently<br />
powered<br />
The current state of the 12V output can be queried at any time sending 1SSPWR.<br />
Internal Memory-Backup Battery<br />
In addition to the internal main battery, the <strong>DT80</strong> contains a small lithium "memory-backup" battery.<br />
The memory-backup battery maintains the <strong>DT80</strong>'s clock/calendar and certain memory settings. (Note that the <strong>DT80</strong>'s<br />
internal file system, which stores programs and logged data, uses non-volatile flash memory. This does not depend on the<br />
memory-backup battery.)<br />
Replacing the Battery<br />
Under normal operation the memory-backup battery should last approximately five years, or approximately one year if there<br />
is no other power to the <strong>DT80</strong> (i.e. both external power and the main battery are disconnected).<br />
See Inside the <strong>DT80</strong> (P215) for details on how to remove and replace the internal memory-backup battery. The<br />
memory-backup battery is a ½AA size 3.6V lithium type (for example, SAFT LS 14250). It’s important that 3.6V and not 3.0V<br />
types be used (both types are the same physical size).<br />
Storage<br />
If the <strong>DT80</strong> is to be placed in long term storage, it is recommended that the memory-backup battery be removed, to keep it<br />
from discharging. When disconnected, the battery has a 10-year shelf life.<br />
Monitoring <strong>DT80</strong> Power<br />
The <strong>DT80</strong> provides a number of internal channel types for monitoring the various power systems. These can be queried at<br />
any time or used in alarms, like any other channel type.<br />
The following channel types are available:<br />
Channel Type Units Description<br />
VEXT V External power supply voltage<br />
VBAT V Main battery terminal voltage (5.6V or lower indicates that internal battery is flat)<br />
IBAT mA Instantaneous main battery current – positive if charging, negative if discharging<br />
VLITH V Memory-backup battery voltage<br />
Note that VEXT will read about 1V under the actual input voltage, due to a series diode.<br />
UM-0085-B2 <strong>DT80</strong> <strong>Series</strong> User’s <strong>Manual</strong> Page 223
Power Consumption<br />
The <strong>DT80</strong> incorporates a number of power management features which aim to minimise the overall power consumption.<br />
This section discusses how to estimate the average power consumption of the <strong>DT80</strong> in a given application, and gives some<br />
guidelines on how to configure the <strong>DT80</strong> for minimum power usage.<br />
Power Consumption<br />
Power States<br />
At any point in time the <strong>DT80</strong> is in one of three power states:<br />
<br />
<br />
<br />
Active – the <strong>DT80</strong>'s microprocessor is running at full speed, actively performing a computation. Power usage is<br />
highest when in this state.<br />
Idle – processor is idle; running at reduced speed and waiting for something to happen. The <strong>DT80</strong> automatically and<br />
instantly switches between idle and active mode as required. Power usage is reduced by about 70% in this state.<br />
Sleep – processor and most other hardware is powered down. The <strong>DT80</strong> will automatically "wake up" when certain<br />
events occur (see Sleep Mode (P229)), a process which typically takes about 800 ms. Power usage is lowest in this<br />
state – as low as 2mW when running from the internal battery.<br />
Power Source<br />
The <strong>DT80</strong> uses the least amount of power when it is running from the internal battery.<br />
When external power is connected, there will be some losses in the <strong>DT80</strong>'s internal power supply and battery charger, so the<br />
overall power consumption will be higher. These losses will increase as the external voltage increases.<br />
The following table gives an indication of how the typical instantaneous power consumption varies according to the power<br />
source (internal/external) and supply voltage:<br />
<strong>DT80</strong><br />
Battery power (6V)<br />
<strong>DT80</strong><br />
External power (12V)<br />
DT82E<br />
External Power (12V)<br />
<strong>DT80</strong><br />
External power (24V)<br />
Power state<br />
Active 1200 mW 1800 mW 1500 mW 2200 mW<br />
Idle 300 mW 500 mW 400 mW 700 mW<br />
Sleep 2 mW 60 mW 10 mW 250 mW<br />
Table 7: <strong>DT80</strong> and DT82E core hardware instantaneous power consumption<br />
Notice that the DT82E power consumption is significantly less. This is partly due to the fact that it does not have an internal<br />
battery charger, which on the <strong>DT80</strong> consumes some power even if no battery is connected.<br />
Note that the power consumption values listed above are for the core hardware only, and do not include power used by other<br />
hardware modules (within the <strong>DT80</strong>) which may or may not be enabled, depending on the application. These modules are<br />
described in the following section.<br />
Hardware Modules<br />
The following hardware modules will consume additional power whilst they are enabled:<br />
analog measurement subsystem<br />
Ethernet Interface<br />
LCD backlight<br />
battery charger<br />
12V regulated power output (<strong>DT80</strong> <strong>Series</strong> 2 and DT85 only)<br />
The actual power consumption of each of these will be discussed further below.<br />
Calculating Average Power Consumption<br />
The <strong>DT80</strong>'s average power consumption will depend on:<br />
the amount of time that is spent in each power state (active, idle and sleep), which mainly depends on the schedule<br />
sample rate and the number and type of channels being measured<br />
the number of analog channels being measured (sampling an analog channel will cause the analog measurement<br />
subsystem to be enabled for the duration of the measurement)<br />
which other hardware modules are enabled<br />
whether logging is enabled<br />
Note The figures quoted below apply to the standard <strong>DT80</strong> series models: <strong>DT80</strong>/81/85/85G. The DT82E has considerably<br />
lower power consumption. For example, in Table 9 the <strong>DT80</strong> average power consumption, when powered by an external<br />
12V supply, approaches 60mW for slow scan rates. For the DT82E, this figure is closer to 10mW.<br />
UM-0085-B2 <strong>DT80</strong> <strong>Series</strong> User’s <strong>Manual</strong> Page 224
Step 1 – Core Hardware<br />
The first step is to determine the average power consumption of the <strong>DT80</strong> core hardware – that is, excluding "non-core"<br />
hardware modules such as Ethernet or the battery charger.<br />
Each of the following tables lists the typical power consumption of the <strong>DT80</strong> core hardware for various sample rates (a single<br />
time based schedule is assumed) and various numbers of analog channels (0, 5 and 30). It is assumed that logging is<br />
enabled (LOGON), real-time data returns are disabled (/r), and sleep is enabled (see Sleep Mode (P229)).<br />
The first table indicates the average power consumption when running from the internal 6V battery, the second is for when<br />
an external 12V supply is used and the third is for an external 24V supply.<br />
Scan rate 0 analog channels 5 analog channels 30 analog channels 300 analog channels<br />
continuous 1200 mW 1550 mW 1520 mW 1520 mW<br />
1 sec 320 mW 610 mW 1520 mW 1520 mW<br />
5 sec 170 mW 250 mW 510 mW 1520 mW<br />
10 sec 90 mW 120 mW 260 mW 1520 mW<br />
1 min 16 mW 20 mW 45 mW 280 mW<br />
10 min 4 mW 4 mW 6 mW 30 mW<br />
1 hour 3 mW 3 mW 3 mW 7 mW<br />
10 hour and above 2 mW 2 mW 2 mW 2 mW<br />
Table 8: <strong>DT80</strong> core hardware average power consumption (internal battery power)<br />
Scan rate 0 analog channels 5 analog channels 30 analog channels 300 analog channels<br />
continuous 1800 mW 2300 mW 2260 mW 2260 mW<br />
1 sec 520 mW 950 mW 2260 mW 2260 mW<br />
5 sec 310 mW 420 mW 800 mW 2260 mW<br />
10 sec 190 mW 240 mW 430 mW 2260 mW<br />
1 min 85 mW 90 mW 120 mW 470 mW<br />
10 min 62 mW 63 mW 65 mW 100 mW<br />
1 hour 61 mW 61 mW 61 mW 67 mW<br />
10 hour and above 60 mW 60 mW 60 mW 60 mW<br />
Table 9: <strong>DT80</strong> core hardware average power consumption (external 12V power)<br />
Scan rate 0 analog channels 5 analog channels 30 analog channels 300 analog channels<br />
continuous 2200 mW 2800 mW 2760 mW 2760 mW<br />
1 sec 730 mW 1250 mW 2760 mW 2760 mW<br />
5 sec 530 mW 650 mW 1080 mW 2760 mW<br />
10 sec 390 mW 450 mW 670 mW 2760 mW<br />
1 min 275 mW 290 mW 320 mW 720 mW<br />
10 min 253 mW 253 mW 255 mW 300 mW<br />
1 hour 250 mW 250 mW 250 mW 255 mW<br />
10 hour and above 250 mW 250 mW 250 mW 250 mW<br />
Table 10: <strong>DT80</strong> core hardware average power consumption (external 24V power)<br />
Note that:<br />
At slow scan rates the logger spends nearly all of its time asleep, so the average power consumption is determined<br />
solely by the core hardware's sleep mode power consumption, which is fixed.<br />
If sleep is disabled, then for slow scan rates the core hardware power consumption will approach the "idle" power state<br />
value (300/500/700 mW for 6/12/24 V supply)<br />
For a continuous schedule, the "30 analog channels" case actually uses slightly less power than the "5 analog<br />
channels" case. This is because a greater proportion of the time is spent with the processor idle, waiting for the analog<br />
sampling to complete.<br />
These tables assume that the schedule contains only analog channels. Digital channels can usually be disregarded,<br />
but if there are a significant number of calculations being done then the average power consumption will increase. If<br />
any very time consuming operations are performed (e.g. reading SDI-12 sensors) then these tables are no longer<br />
applicable. Refer to Example 3 (P227) for more information.<br />
A measurement made using a CEM20 channel takes approximately twice as long as a <strong>DT80</strong> channel. Thus if 15<br />
CEM20 channels are sampled, you should use the values in the "30 analog channels" column above. See Example 4<br />
(P227).<br />
For example, if 10 analog channels are being sampled once per minute then from Table 9 the core hardware will draw an<br />
average of approximately 100 mW from a 12V external supply (although from Table 7 the peak demand may be up to 1800<br />
mW).<br />
Step 2 – Other Hardware<br />
The following table specifies the typical additional power required by each of the <strong>DT80</strong>'s "non-core" hardware modules:<br />
UM-0085-B2 <strong>DT80</strong> <strong>Series</strong> User’s <strong>Manual</strong> Page 225
Module Powered during sleep Battery power (6V) External power (12V) External power (24V)<br />
Ethernet no 300 mW 450 mW 550 mW<br />
LCD Backlight no 450 mW 650 mW 750 mW<br />
Analog Subsystem (see no 650 mW 950 mW 1050 mW<br />
note below)<br />
12V Power Output no (yes if P28=2) 400 mW 550 mW 700 mW<br />
CEM20 active no (yes if P28=2) 350 mW 350 mW 350 mW<br />
12V Load<br />
no (yes if P28=2) up to 1800 mW up to 1800 mW up to 1800 mW<br />
(max 150 mA)<br />
PWR OUT Load<br />
yes - up to 3600 mW up to 7200 mW<br />
(max 300 mA)<br />
Battery charge current<br />
(max 600 mA)<br />
yes - up to 3600 mW up to 3600 mW<br />
Table 11: Power consumption for <strong>DT80</strong> hardware modules<br />
Note that:<br />
<br />
<br />
<br />
<br />
<br />
<br />
The Ethernet interface is enabled by default, but may be disabled using a profile setting.<br />
The LCD module itself consumes negligible power, but the backlight's power usage is significant. By default, the<br />
backlight will switch off 30 seconds after the last key press.<br />
The Analog Subsystem figures represent the power used while performing an analog measurement. This power does<br />
not need to be added when calculating average power consumption, as it has already been incorporated into the Core<br />
Hardware calculation. It is included here to assist in calculating the peak power demand.<br />
The figure quoted for the 12V Power Output is the "no load" consumption which will be present whenever the power<br />
output is enabled (1SSPWR=1, or during a CEM20 measurement). The additional power drawn by an external device<br />
connected to the 12V output is shown separately.<br />
The quoted CEM20 power consumption is for when it is actively in use i.e. its relays are enabled. Only one CEM20 will<br />
be active at any one time. CEM20s which are powered but idle draw minimal power (10mW).<br />
The battery charge current will be close to zero once the battery is fully charged; for a flat battery it will be up to 600 mA<br />
(3600 mW).<br />
For hardware modules which are powered during sleep mode (e.g. PWR OUT output), their power consumption can be<br />
simply added to the core hardware average power consumption calculated above.<br />
For modules which are not powered during sleep mode (e.g. 12V output) it is necessary to scale their power usage according<br />
to the percentage of time that the logger spends awake, which can be estimated from the following table:<br />
Scan rate 0 analog channels 5 analog channels 30 analog channels 300 analog channels<br />
2 sec and below 100% 100% 100% 100%<br />
3 sec 24% 34% 100% 100%<br />
5 sec 15% 20% 38% 100%<br />
10 sec 7% 10% 19% 100%<br />
1 min 1.2% 1.7% 3.2% 19%<br />
10 min 0.1% 0.2% 0.3% 1.9%<br />
1 hour 0.02% 0.03% 0.05% 0.3%<br />
10 hour and above 0% 0% 0% 0.03%<br />
Table 12: Approx. percentage of time spent awake<br />
Example 1<br />
A DT85 is powered by an external 12V supply, is running a 10 second schedule with 5 analog channels, and the 12V power<br />
output is enabled with a 200mW load connected. The Ethernet port is disabled.<br />
Using Table 9, the average power consumption for the core hardware is 420mW. We now need to add the power used by the<br />
12V power output (550+200 = 750mW, from Table 11). But from Table 12, the logger spends only 10% of its time awake, so<br />
this hardware module will, on average, contribute 750 x 10% = 75mW. The overall average power consumption is therefore<br />
420 + 75 = 495mW.<br />
Example 2<br />
A remote monitoring station consists of a <strong>DT80</strong> measuring and logging 10 analog channels and 5 digital channels every 5<br />
minutes. It is powered by a 12V solar-charged battery. The Ethernet port is disabled.<br />
Using Table 9, we need to interpolate between the 5 and 30 analog channel columns, and between the 1 and 10 minute<br />
schedule rate rows. So we estimate 80 mW average power usage for a 5 minute schedule. Note that we can disregard the<br />
digital channel measurements as the power usage will be negligible compared to the analog channels. We also assume that<br />
Ethernet and the LCD backlight will be disabled, so there is no extra power usage there.<br />
The solar panel and external battery can now be sized based on these calculated power requirements (80 mW average).<br />
The power system (i.e. the external battery) will also need to be able to handle the peak power demand, which can be<br />
calculated by adding up the worst case instantaneous consumption figures: 1800mW (core hardware, active power state) +<br />
analog subsystem (950 mW) + internal battery charge current (3600 mW when flat). This works out to around 7W, or 600 mA<br />
@ 12V. If the <strong>DT80</strong> internal battery is not used, the peak power requirement will be around 3W.<br />
UM-0085-B2 <strong>DT80</strong> <strong>Series</strong> User’s <strong>Manual</strong> Page 226
Example 3<br />
A DT85 is powered by an external 12V supply and is set up to poll a network of SDI-12 sensors every 5 minutes. It takes a<br />
total of 30 seconds to power up and read all of the sensors. The SDI-12 network is powered by the DT85's switched 12V<br />
output, and draws a total of 800 mW. The Ethernet port is disabled.<br />
In this case we cannot just look up the average power consumption for a 5 minute schedule with zero analog channels,<br />
because the long SDI-12 measurement will keep the logger awake for much longer.<br />
Instead, we need to estimate how long the logger is spending in each of its power states. In this case:<br />
allow 2 seconds for the logger to wake up and do the actual SDI-12 communications, logging, etc. (active power state)<br />
allow 30 seconds of doing nothing waiting for the sensors to return values (idle power state)<br />
and sleep for the remaining 4 minutes and 28 seconds (268 seconds) (sleep power state).<br />
The power consumption for each power state is listed in Table 7 – 1800, 500 and 60 mW for the active, idle and sleep states<br />
respectively.<br />
We also need to allow for the power drawn from the 12V output terminal by the SDI-12 network, which will be 550 mW for the<br />
power supply plus 800 mW for the load (1350 mW total). This power output will be active for 32 seconds.<br />
So if we average the power consumption over the 5 minute (300 second) schedule interval:<br />
Ave Power = (1800+1350)mW x 2/300 + (500+1350)mW x 30/300 + 60mW x 268/300 = 260 mW<br />
Example 4<br />
80 thermocouples are connected to two CEM20 modules controlled by a <strong>DT80</strong>, and are measured once a minute. The<br />
CEM20s are powered by the <strong>DT80</strong>'s 12V output. The Ethernet port is disabled.<br />
CEM20 measurements take about twice as long as regular measurements, so this system is roughly equivalent to sampling<br />
160 analog channels. Using Table 9, we estimate the average core hardware power drawn from an external 12V supply to be<br />
300mW.<br />
We now need to add the power used by the 12V output and the CEM20s, which will be 550+350 = 900mW, from Table 11).<br />
From Table 12, we estimate that the logger spends about 10% of its time awake, so the CEM20s will, on average, contribute<br />
900 x 10% = 90mW. The overall average power consumption is therefore approximately 300 + 90 = 390mW.<br />
Battery Life<br />
Once the average power consumption for the application has been calculated, we can estimate how long the <strong>DT80</strong>'s internal<br />
battery will be able to keep the logger operating.<br />
For a lead acid battery, the battery voltage is relatively constant during discharge, then drops rapidly once the battery is<br />
nearly flat. The <strong>DT80</strong> will automatically enter an indefinite forced sleep mode once the terminal voltage drops below about<br />
5.5V. The "battery life" is therefore defined as the elapsed time between disconnecting external power and the <strong>DT80</strong> being<br />
forced into sleep mode.<br />
The quoted capacity of a lead acid battery (e.g. 1.2Ah) is the energy that can be extracted from the battery at a 20 hour<br />
discharge rate. In other words if you draw 1.2/20 amps (60 mA, or 360 mW) then the battery will last for 20 hours. It does not<br />
follow, however, that if you draw 600 mA (10 times more) then the battery will last for 2 hours (10 times less). In fact it will last<br />
for closer to 1 hour.<br />
The maximum instantaneous discharge current for a lead acid battery is typically three times the capacity, i.e. 3.6A (21W) for<br />
a 1.2Ah battery. (At this rate the battery life would be only about 3 minutes.)<br />
At the other end of the scale (very low discharge currents), the self-discharge rate of the battery can become significant. A<br />
lead acid battery will typically lose 3% of its capacity per month at 20°C (1.5% per month at 0°C, 10% per month at 40°C).<br />
The following table takes all these effects into account, and can be used to estimate the life of a new, fully charged 1.2Ah<br />
(<strong>DT80</strong>/81) or 4.0Ah (DT85) battery, given a calculated average power consumption:<br />
Average power<br />
consumption from<br />
battery<br />
Approx 1.2Ah<br />
battery life<br />
Approx 4.0Ah<br />
battery life<br />
5000 mW 0.5 hours 3 hours<br />
2000 mW 2 hours 10 hours<br />
1000 mW 5 hours 24 hours<br />
500 mW 12 hours 48 hours<br />
200 mW 36 hours 5 days<br />
100 mW 3 days 10 days<br />
50 mW 6 days 20 days<br />
20 mW 15 days 45 days<br />
10 mW 30 days 3 months<br />
5 mW 1.5 months 5 months<br />
2 mW 4 months 11 months<br />
Table 13: Approximate lead acid battery life<br />
The above assumes a battery ambient temperature of 20°C.<br />
At 40°C, the battery life will be slightly improved at high discharge currents, but will be significantly shorter at low discharge<br />
UM-0085-B2 <strong>DT80</strong> <strong>Series</strong> User’s <strong>Manual</strong> Page 227
currents, due to the accelerated self-discharge rate.<br />
At 0°C, the overall battery capacity will be reduced by about 20% (compared to 20°C), so the battery life for high and mid<br />
discharge rates will be shortened. However, the self-discharge rate will also be reduced, so for very low discharge rates the<br />
battery life will be comparable to that for 20°C.<br />
Example 5<br />
A DT85 is set up to measure 10 analog channels every 5 seconds. How long can it run using the internal 4.0Ah battery<br />
The first step is to calculate the average power consumption. Using Table 8, we estimate the core hardware power<br />
consumption at 300mW for a 5 second schedule with 10 analog channels. No other hardware modules (e.g. Ethernet) are<br />
used, so we take this value as the overall power consumption.<br />
Using Table 13, we see that at 300 mW the battery life should be around 3-4 days.<br />
Example 6<br />
A <strong>DT80</strong> is powered by the supplied 15V plug pack and every 10 seconds it reads 2 analog channels and polls a serial sensor<br />
(which we assume has its own battery backed power supply). Communications with the host computer use the Ethernet<br />
interface. For how long will the logger be able to run in the event of a mains power failure<br />
The Ethernet interface is enabled, so the <strong>DT80</strong> will normally not sleep, as going to sleep will cause any network connections<br />
to be disconnected. We therefore cannot use Table 8 to estimate average power consumption, because this table assumes<br />
that the logger will sleep between scans.<br />
Instead, we will assume that the <strong>DT80</strong> spends:<br />
1 second doing the communications and measurements, logging the result etc. (active power state, analog subsystem<br />
enabled, Ethernet enabled)<br />
9 seconds waiting for the next scan to come around (idle power state, analog subsystem disabled, Ethernet enabled)<br />
Using Table 7, the average core hardware power consumption when battery powered will be 1200mW while active and<br />
300mW while idle. Using Table 11, the analog subsystem will add 650mW while enabled, and Ethernet adds 300mW.<br />
Putting this all together:<br />
Ave Power = (1200+650+300)mW x 1/10 + (300+300)mW x 9/10 = 755 mW<br />
Finally, from Table 13 we see that the <strong>DT80</strong>'s 1.2Ah battery should keep the logger running for about 8 hours.<br />
Minimising Power Consumption<br />
In order to minimise power consumption, the general aims are to:<br />
disable hardware modules which are not required, and<br />
maximise the time spent in the "sleep" power state (see Sleep Mode (P229))<br />
Disable Unnecessary Hardware<br />
Analog Measurement System<br />
Setting P21=0 (which is the default) will minimise power consumption. When an analog measurement is due, the analog<br />
subsystem will be switched on, then the <strong>DT80</strong> will wait 50 ms for it to stabilise and then take the measurement. The analog<br />
power will remain on until there are no more schedules to execute; hence any subsequent analog measurements in the<br />
schedule or any other schedule due to be executed at the same time will not include this 50ms delay.<br />
For high speed sampling, where power consumption is less of a concern, it is preferable to set P21=1. In this case the<br />
analog subsystem remains powered all the time (except in sleep mode), which removes the need for the 50ms delays. For<br />
situations where the logger stays awake all the time, this setting will also minimise differences between readings due to the<br />
analog section's warm-up characteristic, which can take a few minutes to fully stabilise (see Analog Warm Up Time (P297)).<br />
CEM20<br />
Setting P28=0 (which is the default) will cause the CEM20 power (i.e. the <strong>DT80</strong> 12V output) to be managed in a similar way<br />
to the analog subsystem power when P21=0. That is, the power output will be switched on only during schedules which<br />
include a CEM20 analog measurement.<br />
Ethernet Port<br />
The Ethernet interface is enabled by default, and will consume power even if no Ethernet cable is connected. If Ethernet<br />
connectivity is not required then the port should be disabled, as follows:<br />
PROFILE ETHERNET ENABLE=NO<br />
Serial Ports<br />
The serial ports also use a small amount of power while idle, so if they are not required then they can be disabled, too:<br />
PROFILE SERSEN_PORT FUNCTION=DISABLE<br />
PROFILE HOST_PORT FUNCTION=DISABLE<br />
PROFILE USB_PORT FUNCTION=DISABLE<br />
UM-0085-B2 <strong>DT80</strong> <strong>Series</strong> User’s <strong>Manual</strong> Page 228
LCD Backlight<br />
Parameter P20 controls the operation of the LCD backlight. By default (P20=2), it will switch on when there is user activity<br />
(e.g. key pressed, or USB cable inserted), then switch off a short time (P17 seconds) later. This should be adequate for most<br />
applications. For minimum power usage it can be forced to be always off by setting P20=0.<br />
Maximise Sleep Time<br />
The following guidelines will help maximise the time that the logger spends asleep, thereby minimising power consumption:<br />
<br />
<br />
<br />
<br />
Scan as slowly as possible – don't scan every minute if you only need to scan every 5 minutes<br />
Align schedule intervals to minimise the number of wakeups, even if this means that some schedules sample more<br />
frequently. For example:<br />
RA40S 1V RB20S 2V<br />
is generally better than<br />
RA40S 1V RB30S 2V<br />
because the two schedules are more likely to be processed together.<br />
Reduce the P17 setting (delay before entering sleep mode, seconds), say P17=5, so that if a wakeup event does<br />
occur, the logger will go back to sleep quickly.<br />
Consider reducing the P4 setting (wake-up latency, ms), say P4=100. This will result in the <strong>DT80</strong> allowing less time<br />
for the wake process than it actually takes, so it will therefore be able to sleep a little longer. Following wake, the <strong>DT80</strong><br />
will now not have to wait for the schedule's appointed time to come around – it will have already passed. The schedule<br />
will then be executed immediately, albeit slightly late.<br />
It is normally not recommended to change the P3 (minimum sleep time) setting. Sleeping for periods shorter than 1.5<br />
seconds is generally counter-productive: the additional processing time associated with waking up outweighs the<br />
lower sleep mode power usage, leading to a net increase in the average power consumption.<br />
Sleep Mode<br />
The <strong>DT80</strong> has a low power sleep mode that significantly reduces the power consumption – to as low as 2 mW when running<br />
from the internal battery. While asleep no measurements or processing can be done, but the state of the current job is<br />
preserved. The <strong>DT80</strong> will automatically wake from sleep when a measurement is due, or some other event occurs.<br />
About Sleep Mode<br />
While the <strong>DT80</strong> is asleep:<br />
The LCD and all front panel LEDs are switched off.<br />
All communications ports (Ethernet, USB, serial) are disabled. Any USB or TCP/IP connections will be disconnected<br />
when the logger goes to sleep and will need to be re-established by host software after the logger wakes.<br />
Digital output states and the state of the latching relay are maintained.<br />
Digital inputs are not scanned – transitions will not wake the logger, trigger schedules or be counted by low speed<br />
counter channels (1..4C channel types).<br />
Pulses on the high speed counter inputs (1C-4C terminals, 1..4HSC channel types) will be counted, without waking<br />
the logger. As discussed in Counting While Asleep (P267), it is necessary to wake the logger periodically using a timed<br />
schedule to ensure that the 16-bit hardware counters do not overflow.<br />
The 12V power output (<strong>DT80</strong> <strong>Series</strong> 2 and DT85 only) is switched off.<br />
The PWR OUT power output (<strong>DT80</strong> <strong>Series</strong> 2 and DT85 only) will still be available, assuming that the logger is<br />
externally powered.<br />
All parameter settings, CV values, comms port settings and other job-related state information is preserved.<br />
Wake Events<br />
Once asleep, the <strong>DT80</strong> will stay that way until one of the following events occur:<br />
a timed schedule becomes due<br />
a keypad button is pressed<br />
the WK (wake) input terminal is pulled to logic low<br />
a character is received on the serial sensor port, or there is a transition on the CTS line<br />
external power is connected<br />
a USB communications cable is connected<br />
a character is received on the host RS232 port<br />
UM-0085-B2 <strong>DT80</strong> <strong>Series</strong> User’s <strong>Manual</strong> Page 229
Any of these will cause the <strong>DT80</strong> to wake. If the reason for waking was a timed schedule, the <strong>DT80</strong> will execute the schedule,<br />
then immediately go back to sleep (if there are no other schedules due within the next few seconds). During this time the<br />
LCD and backlight will remain off.<br />
For all other wake sources, the <strong>DT80</strong> will stay awake for at least the period specified by parameter P17 (default 30s). This<br />
timer will be reset if any further wake events occur, or if data is received on any comms port. Once the timer expires the <strong>DT80</strong><br />
will go back to sleep.<br />
Note also that:<br />
Event triggered schedules (i.e. schedules triggered by digital input transitions, counters, serial data or CV values) will<br />
not cause the logger to wake. Only timed schedules will cause a wake up.<br />
If the <strong>DT80</strong> is woken by receipt of RS232 data on the host or serial sensor port, the first character (and possibly some<br />
of the following ones) will be lost. You should therefore always send a dummy character (e.g. LF) to wake the <strong>DT80</strong>,<br />
then wait about one second before sending the first actual command.<br />
Controlling Sleep<br />
By default, the <strong>DT80</strong> will not go into sleep mode if any of the following are true:<br />
a schedule or command is being executed, or is due to execute soon<br />
the Ethernet port is enabled and a cable is connected<br />
a USB cable is connected<br />
a PPP session is currently active<br />
a job has been partially entered<br />
there has been "activity" (e.g. key press, command, Modbus/web/FTP request) within the last P17 seconds<br />
Note that any Ethernet and USB connections are terminated whenever the <strong>DT80</strong> goes to sleep – which is why the <strong>DT80</strong> will<br />
by default disallow sleep while either of these ports are connected.<br />
Some of the above conditions can be overridden using the P15 parameter, as follows.<br />
Conditions<br />
Result<br />
P15 Power Source USB port Ethernet port<br />
P15=0 battery not connected not connected or disabled Allow sleep<br />
(default)<br />
P15=1 x not connected not connected or disabled Allow sleep<br />
P15=2 x x x Do not allow sleep<br />
P15=3 x x x Allow sleep<br />
P15=4 battery x x Allow sleep<br />
x = "don't care"<br />
For example, if you set P15=3 then the <strong>DT80</strong> will be allowed to go to sleep, even if the logger is externally powered or<br />
Ethernet/USB is connected.<br />
Forced Sleep Mode<br />
The <strong>DT80</strong> provides some protection against gradual power failure (e.g. the internal battery becoming discharged). If it<br />
detects that the supply voltage is becoming critically low (terminal voltage less than about 5.5V), the <strong>DT80</strong> will automatically<br />
close all store files and force the unit into sleep mode. The <strong>DT80</strong> will remain asleep until the power supply recovers to an<br />
adequate level. During this time schedules will not execute.<br />
Once power is restored, a hard reset will occur.<br />
An entry will be added to the event log (P211) any time that the <strong>DT80</strong> enters forced sleep mode.<br />
UM-0085-B2 <strong>DT80</strong> <strong>Series</strong> User’s <strong>Manual</strong> Page 230
Part N – Sensors & Channels<br />
Overview<br />
This section describes how to use the <strong>DT80</strong>'s analog, digital and serial inputs to measure many different physical quantities.<br />
The focus here is on the measurement process – connecting up a sensor and successfully reading it.<br />
The following topics are covered for each sensor type:<br />
<br />
<br />
<br />
an overview of how a measurement is made<br />
wiring configurations – how to physically connect to the <strong>DT80</strong>'s input terminals. For reference, each wiring<br />
configuration presented here is given a number, e.g. "V1" for voltage wiring #1.<br />
the applicable <strong>DT80</strong> channel types and channel options – that is, how to program the <strong>DT80</strong> to read the particular<br />
sensor or measure the particular quantity.<br />
This section also includes some general information about how the <strong>DT80</strong>'s analog measurement system works, and how to<br />
get the best out of it.<br />
What Can Be Measured<br />
Analog channel types:<br />
voltage<br />
current and current loops<br />
resistance<br />
ratiometric resistance (bridges)<br />
temperature – thermocouples, thermistors, RTDs and IC sensors<br />
frequency<br />
strain gauges – bridges, vibrating wire, Carlson sensors<br />
logic state<br />
Digital channel types:<br />
digital inputs<br />
digital outputs<br />
pulse counters – standard and high speed<br />
phase encoder (quadrature) inputs<br />
Serial channel types:<br />
SDI-12<br />
generic serial sensors<br />
Analog Channels<br />
ELAY<br />
1<br />
*+-#<br />
2<br />
*+-#<br />
3<br />
*+-#<br />
4<br />
*+-#<br />
5<br />
*+-#<br />
EXT<br />
*<br />
EXT<br />
#<br />
EXT<br />
*<br />
EXT<br />
#<br />
ANALOG<br />
For detailed specifications, see Analog Inputs (P304).<br />
About the Analog Input Terminals<br />
Each of the <strong>DT80</strong>’s analog inputs has four terminals: * (Excite), + (Plus), – (Minus) and # (Return).<br />
Any analog measurement involves at least two terminals: a signal terminal and a return terminal. At the core of most<br />
measurements is a voltage measurement between these two terminals.<br />
To specify which terminals to use, the channel type (V, TK, BGI etc.) is prefixed by an input number (1, 2, 3 etc.) and a<br />
terminal specifier.<br />
The terminal specifier can be either:<br />
nothing : measure between + and – terminals,<br />
* : measure between * and # terminals,<br />
UM-0085-B2 <strong>DT80</strong> <strong>Series</strong> User’s <strong>Manual</strong> Page 231
+ : measure between + and # terminals,<br />
- : measure between – and # terminals, or<br />
# : measure between # and AGND/EXT# terminals<br />
For example, the command 3+V causes the <strong>DT80</strong> to measure the voltage between the + and # terminals on analog input 3,<br />
while 1R means measure the voltage between + and – on analog input 1 (which will then be used to calculate the unknown<br />
resistance, provided it is connected as shown in the wiring diagrams).<br />
A particular channel type will not necessarily support all of the above terminal specifiers. For example, the # specifier is only<br />
available for current-based channel types.<br />
Voltage<br />
Voltage (difference in electrical potential) is the fundamental quantity that is measured during any analog measurement.<br />
The <strong>DT80</strong> measures a voltage by:<br />
1. connecting the required input terminals to the instrumentation amplifier by closing the appropriate input relays and<br />
selecting input attenuators if required;<br />
2. converting the amplified signal to a frequency using a precision Voltage Controlled Oscillator (VCO);<br />
3. digitally measuring the frequency and calculating the resultant voltage reading;<br />
4. possibly repeating steps 2 and 3 using a different amplifier gain setting if required.<br />
Note Because all analog measurements (including current, resistance, thermocouple, etc.) are fundamentally voltage<br />
measurements, much of the information in this section is applicable to them, too.<br />
Channel Types<br />
The following channel types will directly return a voltage value:<br />
Channel Type Description Units<br />
V voltage, attenuators disabled by default (max input 3V) mV<br />
HV voltage, attenuators enabled by default (max input 30V) V<br />
For example, to measure the voltage between the * and # terminals on analog input 2 you would include the channel<br />
definition 2*V in your <strong>DT80</strong> program (or, to make a single "immediate" measurement, simply send 2*V to the <strong>DT80</strong>'s<br />
command interface, e.g. by typing it into the DeTransfer send window).<br />
Channel Options<br />
The following channel options are commonly used when measuring voltages:<br />
<br />
<br />
<br />
<br />
GL30MV, GL300MV, GL3V and GL30V (gain lock) allow the <strong>DT80</strong>'s input gain to be locked on a particular range.<br />
See Gain Ranges and Attenuators below.<br />
A (attenuator) and NA (no attenuator; default) allow the <strong>DT80</strong>'s 10:1 input attenuators to be switched in or out. See<br />
Gain Ranges and Attenuators below.<br />
ESn (extra samples) specifies that n additional measurements should be taken and the result averaged. This can help<br />
with very noisy signals.<br />
a channel factor (a floating point number) can be specified as a simple scaling factor. The measured voltage will be<br />
multiplied by this factor before being returned. For more advanced scaling options, see Manipulating Data (P58).<br />
Gain Ranges and Attenuators<br />
The <strong>DT80</strong>'s instrumentation amplifier has three switchable gain settings. These give three basic voltage measurement<br />
ranges (30mV, 300mV and 3V full scale).<br />
The analog inputs also include switchable 10:1 attenuators, which effectively provide a fourth range (30V).<br />
By default the appropriate gain range is selected automatically. The first time a channel is measured, the <strong>DT80</strong> will select the<br />
highest input range (3V if attenuators are not enabled, 30V if they are). If the reading is close to zero then up to two additional<br />
measurements will be made on progressively lower input ranges.<br />
For subsequent measurements of the same channel, the <strong>DT80</strong> will initially use the same input range as was used previously.<br />
If the reading is overrange or close to zero then the input range will be adjusted up or down respectively and the<br />
measurement repeated.<br />
The auto-ranging process may therefore cause the time taken to sample a channel to be increased on occasion. To avoid<br />
this, the gain can be locked on a particular setting, using the GLx channel options.<br />
Note that auto-ranging does not affect the attenuator setting. Each channel definition command specifies (either implicitly or<br />
explicitly) whether the attenuators should be on or off.<br />
UM-0085-B2 <strong>DT80</strong> <strong>Series</strong> User’s <strong>Manual</strong> Page 232
The following table summarises all possible gain/attenuator options<br />
Channel definition Attenuators Input range Units<br />
1V off auto 30mV, 300mV, 3V mV<br />
1V(GL30MV) off 30mV mV<br />
1V(GL300MV) off 300mV mV<br />
1V(GL3V) off 3V mV<br />
1V(GL30V)<br />
error<br />
1V(A) on auto 300mV, 3V, 30V mV<br />
1V(A,GL30MV)<br />
error<br />
1V(A,GL300MV) on 300mV mV<br />
1V(A,GL3V) on 3V mV<br />
1V(A,GL30V) on 30V mV<br />
1HV on auto 300mV, 3V, 30V V<br />
1HV(GL30MV)<br />
error<br />
1HV(GL300MV) on 300mV V<br />
1HV(GL3V) on 3V V<br />
1HV(GL30V) on 30V V<br />
1HV(NA) off auto 30mV, 300mV, 3V V<br />
1HV(NA,GL30MV) off 30mV V<br />
1HV(NA,GL300MV) off 300mV V<br />
1HV(NA,GL3V) off 3V V<br />
1HV(NA,GL30V)<br />
error<br />
Warning Maximum input voltage on any analog input is ±35V dc, relative to the AGND/EXT# terminal. If this is exceeded<br />
then permanent damage may occur.<br />
Input Configurations<br />
By definition, a voltage is a measurement between two points. Multiple separate voltage measurements can share a<br />
common reference point, or each measurement can have an independent reference point.<br />
The reference point, be it shared or unshared, need not be at ground potential. All voltage measurements made by the <strong>DT80</strong><br />
are therefore differential measurements – they measure only the difference in voltage between the two terminals.<br />
Another way of looking at it is that the <strong>DT80</strong> will reject (ignore) the terminals' common mode voltage – that is, the voltage<br />
that is common to both terminals. So if a channel's + terminal is at 7V (relative to the <strong>DT80</strong>'s analog ground) and the –<br />
terminal is at 5V then the 1V channel will return a value of 2V. The common mode voltage (5V) has been rejected.<br />
Important The <strong>DT80</strong> can effectively remove the unwanted common mode component from the input signals provided that<br />
the common mode limits for each terminal is not exceeded (max. 3.5V/35V for attenuators off/on, relative to the <strong>DT80</strong>'s<br />
analog ground). Note that because the <strong>DT80</strong>'s analog ground is isolated, it can normally "float" up to match whatever<br />
common mode voltage is present on the sensor being measured, thereby keeping the common mode voltage seen by the<br />
<strong>DT80</strong>'s amplifier within limits.<br />
Shared-Terminal Inputs<br />
In a shared-terminal configuration, a sensor’s "return" or "negative" wire is usually connected to the channel's # terminal, as<br />
shown in V1 – Shared-Terminal Voltage Inputs (P234). The remaining sensor wire (the "positive" or "signal") is connected to<br />
any of the channel’s other three terminals.<br />
Each of the <strong>DT80</strong>'s analog inputs can therefore support up to three shared terminal voltage inputs.<br />
For shared-terminal inputs, the channel number is given a suffix indicating the terminal to which the positive wire is<br />
connected. For example, the channel definition 1+V specifies a shared-terminal voltage input applied to channel 1 between<br />
the + and # terminals (and likewise 1*V and 1-V).<br />
Independent Analog Inputs<br />
An independent, or "unshared" input is one that connects to its own terminals and does not share any of those terminals with<br />
any other inputs. As shown in V2 – Independent Voltage Inputs (P234), each analog input can support up to two independent<br />
voltage inputs – one between the + and – terminals (1V) and one between * and # (1*V).<br />
For the <strong>DT80</strong> <strong>Series</strong> 2 and DT85, these two independent inputs (i.e. 1V and 1*V) operate identically. For the <strong>DT80</strong>/81<br />
however, they have slightly different characteristics. In particular, referencing a measurement to the # terminal (i.e. the 1*V<br />
configuration) provides a better ground reference, so in most cases it is preferred. See Input Termination (P296) for more<br />
details.<br />
Analog Input Isolation<br />
The <strong>DT80</strong> uses relay multiplexers to switch input channels through to the instrumentation amplifier one at a time. All four<br />
terminals of each analog input channel remain disconnected from the <strong>DT80</strong>'s electronics, except when that channel is being<br />
measured. This means that each analog input channel is totally isolated from any other input channel.<br />
What about the case where two independent inputs are connected to a single analog input channel<br />
UM-0085-B2 <strong>DT80</strong> <strong>Series</strong> User’s <strong>Manual</strong> Page 233
For the <strong>DT80</strong>/81 <strong>Series</strong> 1 , these two "independent" inputs are in fact not completely isolated from each other. This is<br />
because for these logger models, all four terminals for a given channel are switched together. So if you are measuring 1V<br />
(voltage between + and – input terminals), bear in mind that the * and # terminals will also be connected to the <strong>DT80</strong> circuitry.<br />
This may cause problems if the two sensors have significantly different common mode voltages. If this is the case then they<br />
should be connected to separate input channels.<br />
For the <strong>DT80</strong> <strong>Series</strong> 2 and DT85, the two pairs of input terminals (+ - and * #) can be switched independently. This means<br />
that when doing a 1V measurement, the * and # terminals remain isolated. Similarly, when doing a 1*V measurement, the +<br />
and – terminals remain isolated. The upshot of this is that sensor V1 (Figure 90) could have 10V common mode voltage and<br />
sensor V2 could have -2V common mode and both would still be measured correctly. On a <strong>DT80</strong>/81, these two sensors<br />
would need to be connected to separate channels (e.g. 1V and 2V).<br />
V1 – Shared-Terminal Voltage Inputs<br />
In this configuration up to three separate voltage inputs can be connected to one analog input channel. The # terminal acts<br />
as a shared common. See Shared-Terminal Analog Inputs (P18)<br />
Shielded cable may be helpful when the signal has a high output impedance or when noise pickup from other cables is a<br />
problem. Ensure that the shield is only connected to ground at one end of the cable, either to a DGND terminal or the earth<br />
point on the side of the <strong>DT80</strong> case.<br />
V 1<br />
V 2<br />
V 3<br />
* +-#<br />
Figure 89: Wiring for shared-terminal voltage input<br />
To measure<br />
V1 1*V<br />
V2 1+V<br />
V3 1-V<br />
Use the command<br />
V2 – Independent Voltage Inputs<br />
In this configuration each voltage measurement is independent of any other (no wires are shared). The trade-off is that at<br />
most two voltages can be measured per analog input channel.<br />
For the <strong>DT80</strong> <strong>Series</strong> 2 and DT85, the two measurements are completely isolated – while measuring V1, V2 is disconnected,<br />
and vice versa.<br />
This is not the case, however, for the <strong>DT80</strong>/81, where both voltage sources will be connected to the logger electronics (and<br />
therefore referenced to the logger's analog ground) when either is being measured. This can cause measurement errors if<br />
the two inputs have significantly different common mode voltages. See Input Switching (P295).<br />
As with shared terminal inputs, a cable shield may be helpful when the signal has a high output impedance or when noise<br />
pickup for other cables is a problem. Ensure that the shield is only connected to ground at one end of the cable, either to a<br />
DGND terminal or the earth point on the side of the <strong>DT80</strong> case.<br />
V 2<br />
V 1<br />
* +-#<br />
Figure 90: Wiring for independent voltage input.<br />
To measure<br />
V1<br />
1V<br />
V2 1*V<br />
Use the command<br />
UM-0085-B2 <strong>DT80</strong> <strong>Series</strong> User’s <strong>Manual</strong> Page 234
Current<br />
Current (rate of electrical charge movement) is measured by inserting a known shunt resistance into the circuit, and<br />
measuring the voltage across it. Using Ohm's Law, Current = Voltage / Resistance.<br />
The I channel type returns the current value in milliamps (mA).<br />
The <strong>DT80</strong> incorporates an internal 100Ω shunt resistor between the # terminal and analog ground. Alternatively, an external<br />
shunt may be used. The value of the external shunt must be known and must be specified when the channel is defined.<br />
For example, the channel definition 3#I will measure the current which enters at channel 3's # terminal, flows through the<br />
internal shunt, and returns via the AGND/EXT# terminal.<br />
On the other hand, 2+I(51.2) will return the current flowing through a 51.2Ω shunt wired between the + and # terminals<br />
of channel 2.<br />
Channel Options<br />
The following channel options are commonly used when measuring currents:<br />
<br />
<br />
<br />
<br />
A (attenuator) specifies that the <strong>DT80</strong>'s input attenuator should be enabled, which allows voltages of up to 30V to be<br />
measured across the shunt resistors. Note that this option is not available if the internal shunt is used.<br />
the excitation options specify how the current source is powered: N (assume external power supply; default), V<br />
(enable internal 4.5V voltage source on * terminal) or E (assume external supply connected to EXT* terminal).<br />
E (external excitation) specifies that the power supply for the current sources is connected to the <strong>DT80</strong>'s EXT*<br />
terminal. This will then be automatically connected to each current source for the duration of a measurement, then<br />
disconnected.<br />
MDn (measurement delay) specifies that the <strong>DT80</strong> should wait n ms (default 10ms) after selecting a channel before<br />
starting the actual measurement. This can be useful in conjunction with the E option, as it allows the sensor some time<br />
to stabilise after power is applied to it.<br />
the channel factor specifies the shunt resistance in ohms (default 100.0 Ω)<br />
<br />
GLx, ESn, as for voltage measurements<br />
The following sections describe some common wiring configurations for measuring current.<br />
C1 – Shared-Terminal Current Inputs with External Shunts<br />
In this configuration up to three separate current sources can be measured. This is done by measuring the voltages across<br />
the shunts in the shared terminal configuration; see V1 – Shared-Terminal Voltage Inputs (P234).<br />
To avoid cross-channel coupling, connect the bottom of the shunts with the minimum of shared resistance to the sense point.<br />
The resistance of each shunt should be specified as the channel factor.<br />
+<br />
I 1<br />
I 2<br />
I 3<br />
* +-#<br />
24V<br />
DC<br />
-<br />
Figure 91: Wiring for shared-terminal current input using external shunt<br />
To measure<br />
I1<br />
I2<br />
I3<br />
Use the command<br />
1*I(R1)<br />
1+I(R2)<br />
1-I(R3)<br />
UM-0085-B2 <strong>DT80</strong> <strong>Series</strong> User’s <strong>Manual</strong> Page 235
C2 – Independent Current Inputs with External Shunts<br />
In this configuration up to two separate current sources can be measured. This is done by measuring the voltages across the<br />
shunts in the independent terminal configuration; see V2 – Independent Voltage Inputs (P234)<br />
The resistance of each shunt should be specified as the channel factor.<br />
+<br />
24V<br />
DC<br />
I 1<br />
I 2<br />
* +-#<br />
R 2<br />
R 1<br />
-<br />
Figure 92: Wiring for independent-terminal current input using external shunts<br />
To measure<br />
I1<br />
I2<br />
Use the command<br />
1I(R1)<br />
1*I(R2)<br />
C3 – Independent Current Input using the internal shunt<br />
In this configuration the <strong>DT80</strong>'s internal 100 Ω shunt resistor is used. The internal shunt resistor is connected between the<br />
channels # terminal and AGND (EXT# on <strong>DT80</strong> <strong>Series</strong> 2/DT85).<br />
Note that input attenuation is not available for # terminal measurements. This means that the maximum current that can be<br />
measured using the internal shunt is approximately 30mA. For higher currents, or situations where the common mode<br />
voltage relative to analog ground exceeds 3V, it will be necessary to use an external shunt.<br />
+<br />
24V<br />
DC<br />
-<br />
<br />
I<br />
* +-#<br />
EXT *<br />
A GND/EXT#<br />
Figure 93: Wiring for Independent current input using internal shunt<br />
To measure<br />
I 1#I<br />
Use the command<br />
C4 – Independent Current using internal shunt and switched excitation<br />
In this configuration the <strong>DT80</strong> switches a single excitation supply through to each channel as it is measured (this means that<br />
between measurements the current source will be unpowered).<br />
<br />
I<br />
* +-#<br />
24V<br />
DC<br />
+<br />
-<br />
EXT *<br />
A GND/EXT#<br />
Figure 94: Wiring for independent current using internal shunt and external excitation<br />
To measure<br />
I<br />
Use the command<br />
1#I(E)<br />
UM-0085-B2 <strong>DT80</strong> <strong>Series</strong> User’s <strong>Manual</strong> Page 236
4–20mA Current Loops<br />
Many different sensor types provide a 4-20mA current output, where the current is proportional to the quantity being<br />
measured.<br />
The channel type for a 4-20mA current loop measurement is L; channel options are as for Current measurements; see<br />
Current (P235).<br />
To read a current loop sensor, the <strong>DT80</strong> first measures the current. Any of the Current wiring configurations may be used.<br />
The measured current is then scaled so that the channel returns 0% for 4mA and 100% for 20mA.<br />
For example, if a current loop sensor is connected as per C3 – Independent Current Input using the internal shunt(P236) then<br />
it would be read using 1#L.<br />
A span is often applied to this value so that the final reported value is in the proper engineering units for the quantity being<br />
measured.<br />
For example, if a pressure sensor with 4-20mA output operates over a range of 100-500kPa then<br />
BEGIN S1=100,500"kPa" RA2S 4#L(S1) END<br />
will return a pressure reading in kPa every 2s. The loop would in this case be connected across the 4# and AGND/EXT#<br />
terminals, making use of the internal shunt resistor.<br />
One advantage of a current loop system is that a cable fault can be readily detected. An open circuit loop will give a negative<br />
reading, normally -25% (0mA), which can then be detected in an ALARM statement.<br />
Multiple Devices in One Loop<br />
Multiple measurement devices can be connected in series in the one current loop. For example, a current loop might include<br />
both a <strong>DT80</strong> and a 4-20mA digital panel display module, in series. (There can only be one 4-20mA sensor in a given loop.)<br />
In these situations care needs to be taken to ensure that the <strong>DT80</strong>'s common mode voltage limits are not exceeded,<br />
especially if the <strong>DT80</strong> is placed "above" the other devices in the loop. The <strong>DT80</strong>'s input attenuators may be enabled using<br />
the A channel option, which will increase the common mode limit to ±35V, relative to AGND/EXT#<br />
Note If there are multiple devices in the loop then the loop should be continuously powered. This implies the use of an<br />
external shunt (C1 – Shared-Terminal Current Inputs with External Shunts (P235)), as the <strong>DT80</strong> normally disconnects the<br />
EXT# terminal between measurements.<br />
Resistance<br />
Resistance (degree of impediment to current flow) is measured by passing a known excitation current through the<br />
resistance and measuring the voltage across it. From Ohm's law, Resistance = Voltage / Current.<br />
The R channel type returns the resistance value in ohms (Ω).<br />
The <strong>DT80</strong> incorporates two precision current sources. When measuring a resistance, one or other of these sources is<br />
switched through to the * (Excite) terminal, which is then connected to the unknown resistance.<br />
By default, an accurately known current of approximately 200μA is generated by the <strong>DT80</strong>. This allows measurement of<br />
resistances up to about 10kΩ. For low resistances (up to 700Ω), the II channel option can be used to select a higher<br />
excitation current (2.5mA), which will allow a more accurate reading.<br />
One problem which occurs when measuring low resistance values is the fact that the wires used to connect the unknown<br />
resistance to the logger also have resistance. As shown in the wiring diagrams below, there are various ways to overcome<br />
this. These involve the use of separate wires to carry the excitation current and to sense the voltage.<br />
For example, the channel 1R(4W) will perform a four-wire measurement. Excitation current flows out the * terminal,<br />
through the unknown R, and returns to the # terminal. Two separate sense wires connect the + and – terminals to the<br />
unknown R. Because the <strong>DT80</strong> has a very high input impedance (>10MΩ), negligible current will flow in these sense wires,<br />
resulting in a negligible voltage drop. The measured voltage will therefore be the voltage across the unknown R only, and will<br />
not include any voltage drop in the current-carrying excitation cables.<br />
The downside of a four-wire measurement is that you need, well, four wires. The three and two wire configurations provide<br />
for reduced cable cost, at the expense of accuracy.<br />
Channel Options<br />
The following channel options are commonly used when measuring resistances:<br />
3W (3 wire; default) or 4W (4 wire) specifies the type of resistance measurement (number of wires)<br />
I (200μA excitation; default) or II (2.5mA excitation) specifies the amount of current to be passed through the<br />
resistance.<br />
the channel factor specifies an offset adjustment (ohms) which is subtracted from the measured value. This can be<br />
used to compensate for lead resistance in 2-wire configurations.<br />
GLx, ESn, as for voltage measurements<br />
UM-0085-B2 <strong>DT80</strong> <strong>Series</strong> User’s <strong>Manual</strong> Page 237
R1 – 4-Wire Resistance Inputs<br />
In this configuration the * and # terminals send an excitation current through the unknown resistance while the remaining<br />
terminals sense the voltage across it.<br />
4-wire resistance methods are the most accurate, especially for low resistances.<br />
* +-#<br />
Figure 95: Wiring for 4-wire resistance input<br />
To measure<br />
R<br />
Use the command<br />
1R(4W)<br />
R2 – 3-Wire Resistance Inputs<br />
In this configuration the <strong>DT80</strong> effectively measures the voltage drop in the return lead and uses it to compensate for the<br />
voltage drop in both leads. This assumes that the excite and return lead resistances are equal.<br />
See 3-Wire Compensation (P297) for more details.<br />
* +-#<br />
Figure 96: Wiring for 3-wire resistance input<br />
To measure<br />
R<br />
Use the command<br />
1R<br />
R3 – 2-Wire Resistance Inputs<br />
2-wire configurations are only recommended if the lead resistance is negligible compared to the resistance being measured.<br />
You can, however, compensate for the lead resistance by inserting a resistor equal to the total lead resistance (excite lead<br />
resistance + return lead resistance) between the – and # terminals, in place of the link shown. This uses the <strong>DT80</strong>'s 3-wire<br />
compensation circuit to effectively subtract the measured voltage drop across the resistor from the reading.<br />
Alternatively, the total lead resistance could be specified as the channel factor, e.g. if the total lead resistance is known to be<br />
2.8 Ω then you would specify the channel as 1R(2.8). (This assumes that the lead resistance remains fixed, which may<br />
not be the case if the temperature varies.)<br />
* +-#<br />
Figure 97: Wiring for 2-wire resistance input<br />
To measure<br />
R<br />
Use the command<br />
1R<br />
R4 – 2-Wire Independent Resistance Inputs<br />
Note This configuration is only available on DT85 and <strong>Series</strong> 2 loggers.<br />
A 2-wire measurement can also be made by connecting the resistance to * and # only. This frees up the + and – terminals for<br />
a separate independent measurement. For example, vibrating wire strain gauges are often incorporate a thermistor<br />
UM-0085-B2 <strong>DT80</strong> <strong>Series</strong> User’s <strong>Manual</strong> Page 238
temperature sensor. This wiring configuration would allow the gauge to be connected to + and – and the thermistor to * and<br />
#.<br />
Note that no lead resistance compensation is possible with this configuration (other than by using the channel factor).<br />
* +-#<br />
Figure 98: Wiring for 2-wire independent resistance input<br />
To measure<br />
R 1*R<br />
Use the command<br />
R5 – High Resistance Input with Parallel Resistor<br />
Resistance measurements are limited to a maximum of about 10kΩ. This can be extended by wiring a known resistor in<br />
parallel with the resistance being measured. This will, however, reduce the resolution of low resistance measurements.<br />
R<br />
Rp<br />
* +-#<br />
Figure 99: Wiring for 4-wire resistance input, using a parallel resistor<br />
To measure<br />
R<br />
Use the command<br />
1R(4W,=1CV,W)<br />
2CV("R~ohm")=(Rp*1CV)/(Rp-1CV)<br />
As shown above, we first read the combined resistance and store it in a channel variable (1CV), then calculate the value of<br />
R. Rp represents the value of the parallel resistor in ohms.<br />
As well as the 4-wire configuration shown here, a parallel resistor can also be used with a 3-wire or 2-wire resistance<br />
measurement.<br />
In all cases, the parallel resistor (Rp) should be located near the sensor (R), as shown above, so that the lead resistances<br />
can be correctly compensated for.<br />
If it is not practical to locate the resistor near the sensor then it can be located at the logger end of the cable. In this<br />
configuration the best accuracy will be obtained by connecting the sense inputs (+ and -) across Rp (if its resistance is<br />
significantly less than R). If Rp is greater than R then the sense inputs should instead be connected across R, although in this<br />
case the effect of cable resistance is likely to be negligible, given that both R and Rp are high resistances.<br />
Calculating Parallel Resistor Value<br />
The required value of the parallel resistor Rp is given by:<br />
10000 Rmax<br />
R p<br />
R 10000<br />
max<br />
where R max is the maximum resistance required to be measured.<br />
For example, to measure up to 100 kΩ a parallel resistor of about 10kΩ would be suitable.<br />
UM-0085-B2 <strong>DT80</strong> <strong>Series</strong> User’s <strong>Manual</strong> Page 239
Bridges<br />
Because of its sensitivity, the Wheatstone bridge circuit is commonly used for the measurement of small changes in<br />
electrical resistance. Applications include load cells, pressure sensors and strain gauges.<br />
Bridge R 1 R 2<br />
V ex<br />
R 4 R 3<br />
excitation<br />
voltage<br />
Bridge<br />
output<br />
voltage<br />
V out<br />
Figure 100: Wheatstone bridge<br />
Bridges are designed such that under quiescent conditions the ratios R1/R4 and R2/R3 are equal, resulting in a zero output<br />
voltage, V out . A small change to one or the resistances will then cause a corresponding change to V out , which can then be<br />
measured accurately using the <strong>DT80</strong>’s sensitive 30mV range.<br />
When one of the four resistors in a bridge is active (that is, sensitive to the quantity being measured) the circuit is called a<br />
quarter bridge, and the remaining three resistors are called bridge completion resistors. Similarly, half and full bridges<br />
imply two and four active gauges. All completion resistors should be close-tolerance precision resistors.<br />
The <strong>DT80</strong> returns all bridge measurements in a ratiometric form with units of parts per million (ppm):<br />
V<br />
out 6<br />
B<br />
out<br />
10 ppm<br />
Vex<br />
where:<br />
V out is the measured bridge output voltage<br />
V ex is the excitation voltage<br />
For a bridge measurement to be accurate, both of these voltages must be known accurately, and any lead or connector<br />
resistances must be compensated for.<br />
Channel Types<br />
The <strong>DT80</strong> supports two bridge channel types, which differ by the way in which the excitation voltage V ex is determined.<br />
For a BGV channel, V ex is measured at the bridge; for BGI, the bridge is excited using a known current and then V ex is<br />
calculated from the known current and arm resistance values.<br />
The BGI channel type supports two different wiring variants: a true bridge configuration and a 3-wire "simulated bridge"<br />
which has many of the properties of a bridge.<br />
Channel Types<br />
Description<br />
BGV<br />
Voltage-excited Wheatstone bridge<br />
BGI(4W)<br />
Current-excited Wheatstone bridge<br />
BGI(3W)<br />
Current-excited simulated bridge<br />
For a voltage-excited bridge, two separate measurements are therefore required – one to measure V ex and one to measure<br />
V out . To provide the maximum flexibility in wiring, this is done using two separate channels (one V, one BGV), which are<br />
linked using the special BR channel option, as described below.<br />
For a current-excited bridge, the nominal arm resistance is specified, and the <strong>DT80</strong> uses this, along with the known<br />
excitation current, to calculate V ex .<br />
Channel Options – BGV<br />
The following channel options are applicable when using BGV channels<br />
the excitation options specify how the bridge is powered: V (use internal 4.5V voltage source; default), E (external<br />
supply connected to EXT* terminal) or N (external supply).<br />
GLx, ESn, as for voltage measurements<br />
the channel factor specifies an offset in ppm, which will be subtracted from the reading. This can be used to “zero”<br />
the output.<br />
the BR (bridge reference) option must be specified for the voltage (V) channel used to measure V ex . This tells the<br />
<strong>DT80</strong> to use the measured voltage as V ex for a subsequent BGV channel in the same schedule.<br />
Channel Options – BGI<br />
The following channel options are applicable when using BGI channels<br />
the excitation options specify how the bridge is excited: II (use 2.5mA precision current source; default) or I (use<br />
200μA source).<br />
UM-0085-B2 <strong>DT80</strong> <strong>Series</strong> User’s <strong>Manual</strong> Page 240
the wiring options specify the type of bridge: 3W (simulated bridge; default) or 4W (true bridge)<br />
the channel factor specifies the arm resistance, in ohms (default is 350. All arms are assumed to have equal nominal<br />
resistance.<br />
The following sections describe the various bridge wiring configurations.<br />
B1 – 6-Wire BGV Inputs<br />
In this configuration the bridge excitation is supplied by an external supply. This power supply can be either:<br />
<br />
<br />
<br />
a standard supply, max 3V. This allows the <strong>DT80</strong> to measure the actual excitation voltage using the * and # terminals<br />
(1*V), as shown in the wiring diagram.<br />
a standard supply in the range 3-6V. This is too large to directly measure using the * and # terminals, so instead we<br />
use the bridge as a 2:1 voltage divider. That is, we measure the voltage between the + and # terminals (1+V), then<br />
scale the result by 2 to give the actual excitation voltage.<br />
a precision 5.00V supply. In this case the <strong>DT80</strong> does not measure V ex – it assumes that it is exactly 5.00V. The power<br />
supply should be located close to the bridge to avoid voltage drop due to cable resistance.<br />
Note Using the HV channel type to measure the bridge excitation voltage is not recommended. This channel type is normally<br />
not sufficiently accurate for bridge applications.<br />
Assuming a non-precision power supply, two channel definitions will be required.<br />
The first (1*V) measures the voltage between the * and # terminals, and includes the BR (bridge reference) option<br />
which indicates that its value is to be used as the excitation voltage for subsequent bridge channels in the same<br />
schedule. It is also usually made a working channel (W) because it is merely an intermediate measurement.<br />
<br />
If a 3-6V supply is used then the appropriate channel definition would instead be 1+V(2,BR,W): measure between<br />
+ and #, scale by 2 then use as bridge reference.<br />
If a 5.00V precision supply is used then this channel is not required.<br />
The second (1BGV) measures the bridge output voltage between the + and – terminals. The N (no excitation) channel<br />
option is specified because in this configuration the excitation is provided externally.<br />
+<br />
* +-#<br />
3V<br />
DC<br />
-<br />
Figure 101: Wiring for 6-wire bridge using external voltage excitation<br />
To measure<br />
Use the command<br />
bridge output (3V supply) 1*V(BR,W) 1BGV(N)<br />
bridge output (6V supply) 1+V(2,BR,W) 1BGV(N)<br />
bridge output (5.00V supply)<br />
1BGV(N)<br />
UM-0085-B2 <strong>DT80</strong> <strong>Series</strong> User’s <strong>Manual</strong> Page 241
B2 – 4-Wire BGV Inputs<br />
This configuration is similar to the 6-wire configuration except that the bridge excitation is supplied by the <strong>DT80</strong>'s internal<br />
voltage source (approx 4.5V). This supply is in the range 3-6V, so it requires that the excitation be measured using the +<br />
rather than the * terminal then scaled by 2.<br />
Note also that the V channel option must be specified to tell the <strong>DT80</strong> to switch on voltage excitation while the voltage<br />
measurement is being taken. This option is the default for the BGV channel, so it need not be specified.<br />
This configuration is not recommended if the lead lengths are long, because the return wire is carrying the excitation current<br />
and we cannot compensate for the voltage drop over the length of the return wire. This will lead to an inaccurate excitation<br />
voltage measurement, and hence an inaccurate bridge measurement.<br />
* +-#<br />
Figure 102: Wiring for 4 wire bridge input using internal excitation<br />
To measure<br />
bridge output<br />
Use the command<br />
1+V(BR,2,V,W) 1BGV<br />
Note Using the HV channel type to measure the bridge excitation voltage is not recommended. This channel type is normally<br />
not sufficiently accurate for bridge applications.<br />
B3 – Multiple BGV Half Bridge Inputs<br />
In this configuration, three (or more) separate half bridges are wired in parallel so they share the same power supply and<br />
completion resistors (Rc). This allows three separate bridge measurements to be made per input channel (plus one channel<br />
to measure the excitation.)<br />
The excitation voltage is measured in the same way as for the 6-wire configuration. That is, it is either<br />
measured directly, using * and # terminals, or<br />
measured using the completion resistors as a 2:1 voltage divider, or<br />
assumed to be 5.00V<br />
Then the half bridge output voltages (relative to the junction between the completion resistors) are measured using separate<br />
analog inputs.<br />
Note that the excitation voltage need only be measured once; it will then be used for all subsequent BGV channels in the<br />
same schedule.<br />
3V<br />
DC<br />
+<br />
-<br />
Rc<br />
Rc<br />
* +-#<br />
* +-#<br />
1<br />
2<br />
Figure 103: Wiring for multiple half bridges using shared external excitation<br />
To measure<br />
Use the command<br />
3 x bridge outputs (3V supply) 1*V(BR,W) 2*BGV(N) 2+BGV(N) 2-BGV(N)<br />
3 x bridge outputs (6V supply) 1*V(2,BR,W) 2*BGV(N) 2+BGV(N) 2-BGV(N)<br />
Connect 1* to Rc junction<br />
3 x bridge outputs (5.00V supply) 2*BGV(N) 2+BGV(N) 2-BGV(N)<br />
B4 – 4-Wire BGI Inputs<br />
A current excited bridge is the recommended configuration for 4 wire bridge measurement, especially for bridges that are<br />
distant from the <strong>DT80</strong>.<br />
UM-0085-B2 <strong>DT80</strong> <strong>Series</strong> User’s <strong>Manual</strong> Page 242
In this configuration the <strong>DT80</strong>'s precision current source provides the excitation. To calculate the excitation voltage, the<br />
<strong>DT80</strong> needs to know the arm resistance, R a , which is specified as the channel factor. The default is 350 Ω.<br />
* +-#<br />
Figure 104: B2 Wiring for 4 wire bridge input using internal excitation<br />
To measure<br />
Use the command<br />
bridge output 1BGI(4W, R a )<br />
B5 – 3-Wire BGI Input<br />
In this configuration Rc may be either an active gauge (if the strain on it is in the opposite direction to that on Ra and of the<br />
same magnitude) or a completion resistor. For temperature compensation, Rc can also be a gauge which has the same<br />
temperature characteristics as Ra but is not under any strain.<br />
The resistances of Rc and Ra should be equal, and must be specified as the channel factor (max. 5kΩ, default is 350Ω).<br />
This configuration simulates a bridge by using the <strong>DT80</strong>'s 3-wire compensation circuit to "compensate" for the voltage drop<br />
across Rc. The end result is that, like a bridge, the <strong>DT80</strong> measures the difference between the voltages across the two arms.<br />
Ra<br />
* +-#<br />
Rc<br />
Figure 105: B3 Wiring for 3 wire bridge input using internal current excitation<br />
To measure<br />
Use the command<br />
bridge output 1BGI(R a )<br />
UM-0085-B2 <strong>DT80</strong> <strong>Series</strong> User’s <strong>Manual</strong> Page 243
Temperature – Thermocouples<br />
Thermocouple Theory<br />
Measurement Junction<br />
Reference Junction<br />
(isothermal block)<br />
Metal 1<br />
Metal 2<br />
Copper<br />
Copper<br />
To<br />
microvolt<br />
meter<br />
Prime temperature<br />
gradient<br />
Reference<br />
Junction<br />
Temperature<br />
Temperature sensor<br />
Figure 106: Thermocouple principle of operation<br />
A thermocouple consists of two wires of dissimilar metals that are<br />
electrically connected at one end (the measurement junction) and<br />
thermally connected at the other end (the reference, or "cold" junction).<br />
A small voltage is produced when the two junctions are at different temperatures. (The voltage is produced by the<br />
temperature gradient along the wires, not by the junctions.)<br />
Making The Measurement Junction<br />
The measurement junction can be made by welding, brazing, soldering or crimping the two wires together. Take care to<br />
ensure that the wire material is not contaminated where the temperature gradient is to occur.<br />
The junction can be insulated, or left bare for a more rapid response. If left bare, ensure that the junction does not make<br />
intermittent contact with metal objects. This can introduce electrical noise.<br />
Sometimes thermocouple measurement junctions are electrically connected (by welding, brazing, soldering or by contact) to<br />
the object being measured. This is only possible if the object is grounded to the <strong>DT80</strong>’s analog ground terminal AGND/EXT#,<br />
or if the voltage on the object relative to the <strong>DT80</strong>'s analog ground is within the <strong>DT80</strong>'s common mode limits.<br />
Reference Junction Compensation<br />
Conventionally, the reference junction is held at 0°C, and thermocouple responses are determined with a 0°C reference.<br />
This is inconvenient in most situations and so, in practice, the reference junction is allowed to follow to ambient temperature.<br />
Then this non-zero reference junction temperature must be compensated for by measuring the reference temperature with<br />
another temperature sensor. The <strong>DT80</strong> does this compensation automatically when a thermocouple channel type is<br />
selected.<br />
Isothermal Block<br />
Generally the reference junctions and the associated temperature sensor are held at the same temperature by a physical<br />
arrangement that ensures good thermal conductivity between the junctions. This structure is called an "isothermal block". It<br />
is advisable to insulate the isothermal block from rapid ambient temperature changes.<br />
Channel Types<br />
The <strong>DT80</strong> supports all commonly-recognized thermocouple types:<br />
Type Positive Negative Range<br />
B Pt, 30%Rh Pt, 6%Rh +50 – +1820 °C<br />
C W, 5%Re W, 26% Re 0 – +2320 °C<br />
D W, 3%Re W, 25%Re 0 – +2320 °C<br />
E Ni, 10%Cr Cu, 45%Ni -270 – +1000 °C<br />
G W W, 26% Re 0 – +2320 °C<br />
J Fe Cu, 45% Ni -210 – +1200 °C<br />
UM-0085-B2 <strong>DT80</strong> <strong>Series</strong> User’s <strong>Manual</strong> Page 244
K Ni, 10%Cr Ni,2%Mn, 2%Al -270 – +1372 °C<br />
N Ni, 14%Cr, 1%Si Ni, 4%Si, 0.1%Mg -270 – +1300 °C<br />
R Pt, 13%Rh Pt -50 – +1768 °C<br />
S Pt, 10%Rh Pt -50 – +1768 °C<br />
T Cu Cu, 45%Ni -270 – +400 °C<br />
Each type has characteristics (sensitivity, stability, temperature range, robustness and cost) that make it appropriate for<br />
particular applications.<br />
The <strong>DT80</strong>'s thermocouple linearisation data are based on the ITS90 International Temperature Scale.<br />
Channel Options<br />
The applicable channel options for thermocouples are as follows<br />
<br />
<br />
<br />
GLx, ESn, as for voltage measurements<br />
the channel factor specifies a scaling factor, as for voltage channels<br />
If an external isothermal block is used then the TR (temperature reference) and/or TZ (electrical zero reference)<br />
options should be specified for the channels used to measure reference junction temperature and reference junction<br />
electrical zero. See Isothermal Block Support (P245) below.<br />
Using Thermocouples with the <strong>DT80</strong><br />
Thermocouples are wired to the <strong>DT80</strong> as for any other voltage input, see Voltage (P232). Be sure to connect the<br />
thermocouple the right way around – for K type thermocouples the red wire is normally negative and would therefore be<br />
wired to the # or – terminal.<br />
The channel type is a Tt where t is the thermocouple type. So to measure a K-type thermocouple you would use the TK<br />
channel type, e.g. 4TK for a thermocouple wired to channel 4's + and – terminals, or 4-TK if the thermocouple is wired<br />
between – and #.<br />
Using the thermocouple channel type reads the channel as a voltage and automatically applies reference junction<br />
compensation and linearization.<br />
By default, the <strong>DT80</strong> uses an internal temperature sensor to measure the reference junction temperature. You can check the<br />
reading of this sensor using the REFT channel type.<br />
Each CEM20 channel expansion module includes its own temperature sensor, which is used for any thermocouple<br />
measurements made using that CEM20. This sensor can be read using the nREFT channel type, where n is the CEM<br />
number (1-15).<br />
Isothermal Block Support<br />
For higher accuracy measurements, the <strong>DT80</strong> also supports the use of an external isothermal block. In this case the<br />
isothermal block's temperature sensor is measured by a separate <strong>DT80</strong> channel. This channel uses the TR channel option<br />
to identify it as the temperature reference – its reading will then be used as the reference for all subsequent thermocouple<br />
measurements in that schedule.<br />
For example:<br />
RA10S 5AD590(TR) 1..4TT<br />
In this example four T-type thermocouples are measured. Their reference junctions are enclosed in an isothermal block,<br />
along with an AD590 temperature sensor, which is connected to analog channel 5.<br />
If the isothermal block is already compensated (i.e. it is held at 0°C) then it is not necessary to measure its temperature.<br />
Instead, use 11SV(TR) as reference channel (system variable 11SV always returns 0.0).<br />
To further enhance accuracy, you can use another <strong>DT80</strong> channel to measure the electrical "zero" at the isothermal block in<br />
order to compensate for any voltage offsets between the logger and the reference junctions. This is done by running a<br />
separate pair of wires (similar to those used for the thermocouple channels) from the <strong>DT80</strong> to the isothermal block, at which<br />
point they are shorted together. A voltage channel is then used to measure the offset voltage and the TZ channel option is<br />
specified. This will cause all subsequent thermocouple channels in the same schedule to use this value as their zero, rather<br />
then the <strong>DT80</strong>'s internal zero. For example:<br />
RA10S 5AD590(TR) 6V(TZ) 1..4TT<br />
Note If a TR/TZ channel is used, it must precede the thermocouple channel(s) to which it applies, and be in the same<br />
sampling schedule. If a statistical option (e.g. AV, MX) is applied to a thermocouple channel then the sampling schedule is<br />
the statistical schedule, so the reference channel must be sampled in the statistical schedule too. This can be achieved by<br />
applying a statistical option to the reference channel, e.g.<br />
RS1S<br />
RA1M 5PT385(TR,AV,W) 1..2TE(AV) 3TK<br />
In this example, the PT385 will be read once a second, and will be used as the cold junction reference for the two subsequent<br />
TE thermocouple measurements. The average theremocouple readings will then be reported once a minute. The third<br />
thermocouple (3TK) is not sampled in the statistical schedule, and will use the default internal temperature reference.<br />
UM-0085-B2 <strong>DT80</strong> <strong>Series</strong> User’s <strong>Manual</strong> Page 245
Accuracy — Thermocouple Techniques<br />
The accuracy of temperature measurement with thermocouples depends on<br />
<br />
<br />
<br />
<br />
<br />
<br />
<br />
the reference junction isothermal characteristics<br />
the reference temperature sensor accuracy<br />
induced electrical noise<br />
the quality of the thermocouple wire<br />
drift in the wire characteristics, especially at high temperatures<br />
the basic measurement accuracy of the <strong>DT80</strong><br />
the linearization accuracy of the <strong>DT80</strong>.<br />
Reference Junction Error<br />
The most significant source of error is the reference junction. The <strong>DT80</strong> must not be exposed to non-uniform heating<br />
because a single reference temperature sensor is used to measure the temperature of the terminals of all channels. If a<br />
temperature gradient occurs along the terminals, errors of the magnitude of the temperature difference occur.<br />
For the <strong>DT80</strong>/81, the reference temperature sensor is positioned behind analog channels 2 and 4, and behind channel 10 on<br />
the DT85. Therefore, when precise temperature measurements are required, attach thermocouples here for the least<br />
temperature differential from the <strong>DT80</strong>’s reference temperature.<br />
Linearization Error<br />
The <strong>DT80</strong>'s linearization errors are much lower (< 0.1°C over the full range) than other error sources.<br />
Temperature – Thermistors<br />
Thermistors are devices that change their electrical resistance with temperature. They measure temperatures from –80°C<br />
up to 250°C, and are sensitive but highly nonlinear.<br />
Thermistors may be connected using any of the resistance wiring configurations, i.e. in 2-wire, 3-wire or 4-wire configuration.<br />
See Resistance (P237)<br />
Channel Types<br />
The <strong>DT80</strong> has channel types for many 2-wire YSI (Yellow Springs Instruments) thermistors and, for other thermistor types,<br />
the <strong>DT80</strong> supports thermistor scaling — see Thermistor Scaling (P59).<br />
Channel<br />
Type<br />
R (ohms) at<br />
25°C YSI Thermistor<br />
Max. Temp<br />
°C<br />
Min. Temp °C<br />
(without Rp)<br />
YS01 100 44001A, 44101A 100 –75<br />
YS02 300 44002A, 44102A 100 –50<br />
YS03 1000 44003A, 44103A 100<br />
–25<br />
44035 100<br />
YS04 2252 44004, 44104 150<br />
–5<br />
44033 75<br />
45004, 46004 200<br />
46033, 46043<br />
44901 90<br />
44902 70<br />
YS05 3000 44005, 44105 150<br />
0<br />
44030 75<br />
45005, 46005 200<br />
46030, 46040<br />
44903 90<br />
44904 70<br />
YS07 5000 44007, 44107 150<br />
10<br />
44034 75<br />
45007, 46007 250<br />
46034, 46044<br />
44905 90<br />
44906 70<br />
YS17 6000 44017, 44117 150<br />
15<br />
45017 250<br />
46017<br />
200<br />
46037, 46047<br />
10k 44016, 44116 150 25<br />
UM-0085-B2 <strong>DT80</strong> <strong>Series</strong> User’s <strong>Manual</strong> Page 246
YS16<br />
YS06<br />
10k<br />
10k<br />
44016, 44116 150<br />
44036 75<br />
46036 200<br />
44006, 44106 150<br />
44031 75<br />
45006 250<br />
46006<br />
200<br />
46031, 46041<br />
44907 90<br />
44908 70<br />
25<br />
25<br />
Channel Options<br />
The following channel options are useful with thermistors (YSnn channel type):<br />
<br />
<br />
<br />
3W, 4W can be used to select the wiring configuration, as with any resistance measurement<br />
I, II can be used to set the excitation. For thermistors the I (200µA) option should normally be used, to minimise any<br />
self-heating effects which may occur with higher excitation currents.<br />
the channel factor is the value of an optional parallel resistor, Rp, which can be used to extend the temperature<br />
range, as described below.<br />
Reading Low Temperatures with Thermistors<br />
Most thermistors increase in resistance as the measured temperature decreases (i.e. they have a negative temperature<br />
coefficient). They tend to be quite non linear and increase in resistance rapidly as the temperature falls into the lower part of<br />
the sensing range.<br />
The <strong>DT80</strong> has an upper limit of 10kΩ for resistance measurement which can limit the usable sensing range of thermistors.<br />
To overcome this you can use a parallel resistor to scale the output of the thermistor back into the measurement range of the<br />
logger, as described in R5 – High Resistance Input with Parallel Resistor (P239).<br />
For YSnn thermistors, the value of the parallel resistor can be specified as the channel factor and the <strong>DT80</strong> will automatically<br />
scale the measured value appropriately. For example, a YS06 thermistor has a resistance of approximately 80kΩ at –20°C,<br />
so to measure down to this temperature a parallel resistor of about 10kΩ would be suitable. You would then read the channel<br />
using<br />
1YS06(10000)<br />
i.e. the channel factor indicates that a 10000Ω parallel resistor is being used.<br />
If a custom thermistor scaling function is being used then the correction will need to be done using channel variables, as<br />
described in R5 – High Resistance Input with Parallel Resistor (P239).<br />
Temperature – RTDs<br />
Resistance Temperature Detectors are sensors generally made from a pure (or lightly doped) metal whose electrical<br />
resistance increases with temperature. Provided that the element is not mechanically stressed and is not contaminated by<br />
impurities, the devices are stable, reliable and accurate.<br />
Channel Types<br />
The <strong>DT80</strong> supports four RTD types:<br />
Channel Type Metal Default 0°C ohms Alpha Standard<br />
PT385 Platinum 100 0.003850 DIN43760 (European)<br />
PT392 Platinum 100 0.003916 JIS C1604 (American)<br />
NI Nickel 1000 0.005001<br />
CU Copper 100 0.00390<br />
The alpha is defined by:<br />
<br />
R R<br />
100 0<br />
Ω/Ω/°C<br />
100R0<br />
where R o is the resistance at 0°C and R 100 is the resistance at 100°C.<br />
The 0°C resistance is assumed to be 100 for platinum (PT100), and 1000 for nickel types. Other values can be specified<br />
as a channel option.<br />
Channel Options<br />
The following channel options are useful with RTD channel types:<br />
3W, 4W can be used to select the wiring configuration, as with any resistance measurement<br />
<br />
I, II can be used to set the excitation. For the Platinum and Copper RTDs, the II (2.5mA) option (which is the<br />
default) should normally be used, to provide good measurement resolution for the relatively low resistance value being<br />
UM-0085-B2 <strong>DT80</strong> <strong>Series</strong> User’s <strong>Manual</strong> Page 247
measured. If self-heating is a concern, the I (200µA) excitation option can also be used. For the higher resistance<br />
Nickel type, I (200µA) is the default.<br />
the channel factor is the 0°C value of the RTD, e.g. 100 for a PT100 sensor. The default value for each type is shown<br />
in the table above.<br />
For example,<br />
PT385(4W,50)<br />
reads a 4-wire 50 (at 0°C) device.<br />
Temperature – AD590 <strong>Series</strong> IC Sensors<br />
AD590 series sensors are 2-terminal semiconductor devices which produce a current that is proportional to absolute<br />
temperature. This makes them useful with long lead lengths. Supply voltage is typically 4-30V.<br />
Channel Types<br />
The following channel types are supported. All operate identically.<br />
Channel Type Description Range<br />
AD590 1µA / K -55 – +105 °C<br />
AD592 1µA / K -25 – +105 °C<br />
TMP17 1µA / K -40 – +105 °C<br />
Channel Options<br />
The following channel options are sometimes used when measuring AD590 series devices:<br />
the excitation options specify how the sensor is powered: V (use internal 4.5V voltage source; default), E (external<br />
supply connected to EXT* terminal) or N (external supply).<br />
<br />
<br />
<br />
MDn (measurement delay) specifies that the <strong>DT80</strong> should wait n ms (default 10ms) after selecting a channel before<br />
starting the actual measurement. This can be useful in conjunction with the E or V option, as it allows the sensor some<br />
time to stabilise after power is applied to it.<br />
the channel factor specifies the shunt resistance in ohms (default 100.0 Ω), as for current measurements<br />
GLx, ESn, as for voltage measurements<br />
Calibration<br />
The channel factor (shunt resistor value) can also be used as a calibration factor. For example, if the sensor reads 290.7K<br />
when the actual temperature is 289.5K (an error of +1.2K) then the required scaling factor would be 1 – (1.2 / 289.5) =<br />
0.9959, which would then be multiplied by the nominal shunt resistance (100). So the correction would be applied as:<br />
1AD590(99.59)<br />
Note that if the <strong>DT80</strong>'s internal shunt is used (e.g. 1#AD590), then you need to specify the shunt resistor's nominal<br />
resistance as the channel factor when doing the calibration measurement, i.e. 1#AD590(100). If this is not done then the<br />
<strong>DT80</strong> will use the actual shunt resistance (which it determines during its self calibration process), which will upset the above<br />
calculation because you won't know what to multiply the scaling factor by.<br />
IC1 – 2-Wire AD590-<strong>Series</strong> Inputs<br />
The wiring configuration shown below uses the <strong>DT80</strong>'s internal voltage excitation to power the sensor, and the internal shunt<br />
resistor to measure the output current.<br />
+<br />
<br />
-<br />
AD590<br />
* +-#<br />
Figure 107: Wiring for AD590 series input using internal shunt<br />
To measure<br />
temperature<br />
Use the command<br />
1#AD590<br />
Other Wiring Options<br />
External shunts and/or external power supplies (as per the wiring configurations for current) can also be used to allow more<br />
UM-0085-B2 <strong>DT80</strong> <strong>Series</strong> User’s <strong>Manual</strong> Page 248
sensors to be measured per channel.<br />
For example, the configuration shown in C1 – Shared-Terminal Current Inputs with External Shunts (P235) could be used to<br />
allow three AD590s to be measured on the one channel. Note that in this case the N channel option would be required, in<br />
order to disable the default voltage excitation output on the * terminal, i.e.<br />
To measure temperature Use the command<br />
I1<br />
1*AD590(N,R1)<br />
I2<br />
1+AD590(N,R2)<br />
I3<br />
1-AD590(N,R3)<br />
Alternatively, separately connected shunts could be used, as shown in C2 – Independent Current Inputs with External<br />
Shunts (P236). That is:<br />
To measure temperature Use the command<br />
I1<br />
1AD590(N,R1)<br />
I2<br />
1*AD590(N,R2)<br />
Temperature – LM35 <strong>Series</strong> IC Sensors<br />
LM35 series sensors are 3-terminal semiconductor devices which produce a voltage output that is proportional to<br />
temperature. Supply voltage is typically 4-30V.<br />
Channel Types<br />
The following channel types are supported:<br />
Channel Types Description Range<br />
LM34 10mV/°F -50 – +300 °F<br />
LM35 10mV/°C -55 – +150 °C<br />
LM45 10mV/°C -20 – +100 °C<br />
LM50 10mV/°C + 500mV -40 – +125 °C<br />
LM60 6.25mV/°C + 424mV -40 – +125 °C<br />
TMP35 10mV/°C -40 – +125 °C<br />
TMP36 10mV/°C + 500mV -40 – +125 °C<br />
TMP37 20mV/°C -40 – +125 °C<br />
The devices with a voltage offset (LM50, LM60 and TMP36) allow negative temperatures to be read without additional<br />
components.<br />
Channel Options<br />
The following channel options are sometimes used when measuring LM35 series devices:<br />
the excitation options specify how the sensor is powered: V (use internal 4.5V voltage source; default), E (external<br />
supply connected to EXT* terminal) or N (external supply).<br />
MDn (measurement delay) specifies that the <strong>DT80</strong> should wait n ms (default 10ms) after selecting a channel before<br />
starting the actual measurement. This can be useful in conjunction with the E or V option, as it allows the sensor some<br />
time to stabilise after power is applied to it.<br />
the channel factor specifies an offset adjustment, in °C<br />
GLx, ESn, as for voltage measurements<br />
Calibration<br />
For LM35 series sensors, the channel factor is an offset correction, in °C. So if the sensor reads 25.4°C when the actual<br />
temperature is 25.0°C (an error of +0.4°C) then the channel factor would simply be specified as:<br />
4+LM35(0.4)<br />
IC2 – LM35-<strong>Series</strong> Inputs<br />
In this wiring configuration the sensor is powered by the <strong>DT80</strong>’s 4.5V voltage excitation. This single-ended supply means<br />
that the sensor’s output voltage will not be able to go below about 100mV. For devices with no offset voltage (e.g. LM35) this<br />
restricts the minimum usable temperature to 10°C (for LM35).<br />
Accuracy can be improved by replacing the link wire between the # and – terminals with a wire from the – terminal of the<br />
logger to the – terminal of the sensor. This will compensate for voltage drops due to cable resistance, similar to a 4-wire<br />
resistance measurement.<br />
UM-0085-B2 <strong>DT80</strong> <strong>Series</strong> User’s <strong>Manual</strong> Page 249
LM<br />
35<br />
+<br />
out<br />
* +-#<br />
-<br />
Figure 108: L2 Wiring for LM35 series input – restricted temperature range<br />
To measure<br />
temperature<br />
Use the command<br />
1LM35<br />
IC3 – LM35-<strong>Series</strong> Inputs – full temperature range<br />
This wiring configuration biases the negative terminal of the device to allow negative temperatures to be read. Refer to the<br />
manufacturer's data sheet for more details.<br />
LM<br />
35<br />
+<br />
-<br />
2 x 1N914<br />
out<br />
10K<br />
2K2<br />
* +-#<br />
Figure 109: Wiring for LM35 series input – full temperature range<br />
To measure<br />
temperature<br />
Use the command<br />
1LM35<br />
Other Wiring Options<br />
Shared input configurations and/or external power supplies (as per the wiring configurations for Voltage) can also be used to<br />
allow more sensors to be measured per channel.<br />
For example, the configuration shown in V1 – Shared-Terminal Voltage Inputs (P234) could be used to allow three externally<br />
powered LM35s to be measured on the one channel. That is, an external 4-30V dc supply powers the three sensors’ + and<br />
– terminals, with the – terminals also connected to the <strong>DT80</strong>’s # terminal. The three out terminals would then connect to the<br />
<strong>DT80</strong>’s *, + and – terminals. These sensors could then be read using 1*LM35(N), 1+LM35(N) and 1-LM35(N)<br />
respectively. Note that in this case the N channel option is required in order to disable the default voltage excitation output on<br />
the * terminal.<br />
Temperature – LM135 <strong>Series</strong> IC Sensors<br />
LM135 series sensors are 2-terminal zener diode based sensors which produce a voltage output that is proportional to<br />
absolute temperature. Operating current is typically 0.5 – 5mA.<br />
Channel Types<br />
The following channel types are supported:<br />
Channel Types Description Range<br />
LM135 10mV / K -55 – +150 °C<br />
LM235 10mV / K -40 – +125 °C<br />
LM335 10mV / K -40 – +100 °C<br />
Channel Options<br />
The following channel options are sometimes used when measuring LM35 series devices:<br />
the excitation options specify how the sensor is powered: V (use internal 4.5V voltage source; default), E (external<br />
supply connected to EXT* terminal) or N (external supply).<br />
UM-0085-B2 <strong>DT80</strong> <strong>Series</strong> User’s <strong>Manual</strong> Page 250
MDn (measurement delay) specifies that the <strong>DT80</strong> should wait n ms (default 10ms) after selecting a channel before<br />
starting the actual measurement. This can be useful in conjunction with the E or V option, as it allows the sensor some<br />
time to stabilise after power is applied to it.<br />
GLx, ESn, as for voltage measurements<br />
the channel factor specifies a scaling factor.<br />
Note A 2:1 voltage divider is normally used to ensure that the output of the sensor stays within the <strong>DT80</strong>'s 3V input range.<br />
The default channel factor is therefore 2.0 for these channel types. If a different voltage divider ratio is used then an<br />
appropriate channel factor must be specified, e.g. if there is no divider then specify 1LM335(1).<br />
Calibration<br />
For LM135 series sensors, the channel factor is a scaling factor, which can be used to correct a slope error based on a single<br />
point calibration. For example, suppose an LM135 is connected using a 2:1 voltage divider as shown in the wiring diagram.<br />
If the channel then reads 301.0K when the actual temperature is 302.4K (an error of -1.4K) then the required scaling factor<br />
would be 2 – (–1.4 / 302.4) = 2.0046, which would be applied as:<br />
2LM135(2.0046)<br />
Most LM135 series devices also provide an ADJ pin which allows the connection of an optional external trimpot.<br />
IC4 – 4-Wire LM135-<strong>Series</strong> Inputs<br />
In this wiring configuration the <strong>DT80</strong>’s 4.5V voltage excitation is used to power the sensor (via an internal current limiting<br />
resistor). The output voltage then feeds a 2:1 voltage divider and is measured using the <strong>DT80</strong>’s + and – inputs.<br />
*<br />
LM335 +<br />
10K +-#<br />
-<br />
ADJ<br />
50K<br />
10K<br />
Figure 110: Wiring for LM135 series input<br />
To measure<br />
temperature<br />
Use the command<br />
1LM335<br />
Humidity Sensors<br />
Relative humidity is commonly measured by the "wet bulb depression" method. Two temperature sensors are required, one<br />
to measure air temperature and the other the cooling effect of a wetted surface. Usually a temperature sensor is encased in<br />
a wick extending into a reservoir of distilled water. The temperature difference between the two sensors is the wet bulb<br />
depression.<br />
The choice of temperature sensors is critical if reasonable accuracy is required at high relative humidity where the wet bulb<br />
depression is small. If platinum RTDs are used they should have good accuracy or matching (0.2°C).<br />
Good accuracy can also be achieved by use of a temperature difference sensor such as a thermocouple or thermopile.<br />
Measure the dry bulb with a standard grade temperature sensor and subtract the difference sensor reading to obtain the wet<br />
bulb temperature.<br />
The sensors are normally placed within a radiation screen to prevent radiant heat affecting the readings. This is particularly<br />
important for outdoor applications.<br />
Example — Humidity Measurement<br />
The following program reads two RTDs and calculates the relative humidity with an accuracy of a few percent for<br />
temperature above 5°C and over most of the relative humidity range (the algorithm assumes that the sensors are ventilated<br />
but not aspirated).<br />
BEGIN"STICKY"<br />
Y1=6.1,0.44,0.014,2.71E-4,2.73E-6,2.75E-8 'SVP polynomial<br />
RA5S<br />
1PT385("Dry bulb",4W,=1CV)<br />
2PT385("Wet bulb",4W,=2CV)<br />
3CV(Y1,W)=1CV<br />
4CV(Y1,W)=2CV<br />
5CV("RH%",FF1)=(4CV-0.8*(1CV-2CV))/3CV<br />
END<br />
UM-0085-B2 <strong>DT80</strong> <strong>Series</strong> User’s <strong>Manual</strong> Page 251
Frequency<br />
The frequency of an analog input signal can be measured using the F channel type, which returns a value in Hz.<br />
Any of the Voltage wiring configurations may be used (P232).<br />
Note that the default threshold point is 0V, so the input signal must have zero crossings in order to be measured. If this is not<br />
the case (e.g. for a logic signal), the 2V channel option can be used to change the threshold point to +2.5V.<br />
Channel Options<br />
Useful channel options for F channels are:<br />
<br />
<br />
<br />
the channel factor – this is the sample period (gate time) in ms (default is 30ms)<br />
2V – this option will offset input signal by -2.5V. This effectively changes the threshold point from 0V to approx. +2.5V,<br />
which is useful for TTL level inputs<br />
GLx, ESn, as for voltage measurements<br />
Note For <strong>DT80</strong>/81 <strong>Series</strong> 1 loggers, the 2V channel option is not supported for differential measurements (measurements<br />
between the + and – terminals, e.g. 1F)<br />
Note For frequency measurements, the maximum gain range (30mV full scale) is not available. The GL30MV option is<br />
therefore not valid for this channel type.<br />
The range of frequencies that can be measured depends on the configured sample period (channel factor). For the default<br />
setting of 30ms, this range is approximately 33Hz – 20kHz. If the input frequency is too low to be measured, UnderRange<br />
will be returned.<br />
To measure lower frequencies, the sample period should be increased. For example<br />
3F(1000)<br />
will measure down to 1Hz (upper limit is still 20kHz), while<br />
3F(10000)<br />
will allow frequencies down to 0.1Hz to be resolved.<br />
The drawback to selecting a long sample period is that the measurement will take a long time to complete. This may delay<br />
the execution of other schedules.<br />
Period Measurement<br />
The period of a signal can be measured by taking the reciprocal of a frequency measurement, e.g.:<br />
RA5S 3+F(2V,1000,F1,"Period~s",FF4)<br />
will return the period, in seconds, of an TTL-level logic signal connected between 3+ and 3#. Given the 1000ms sample<br />
period, the maximum period that can be returned will be approximately 1.0s. The F1 option applies intrinsic function #1 (1/x).<br />
Strain Gauges – Bridge<br />
Bridge Wiring Configurations<br />
Strain gauges change resistance when stretched or compressed. They are commonly wired in a bridge configuration,<br />
because bridges are well suited to measuring small changes in resistance; see Bridges (P240).<br />
Each of the arms of the bridge can be either:<br />
<br />
<br />
an active element: a strain gauge which is subjected to the forces acting on the structure<br />
a temperature compensation element: a strain gauge which is not stressed but which has similar temperature<br />
coefficient to the active gauge. This is used to cancel out any changes to the active gauge's resistance due to<br />
temperature effects.<br />
a completion resistor: a precision resistor whose resistance is equal to the nominal (at rest) strain gauge resistance.<br />
A full bridge has four active gauges, typically two on one side of a structure (in tension) and two on the other (in<br />
compression). A half bridge has two active gauges; the other two arms are temperature compensation gauges or<br />
completion resistors. Finally a quarter bridge has only one active gauge.<br />
Calculating Strain<br />
The strain-to-resistance relationship is<br />
L<br />
1 R<br />
strain <br />
L G R<br />
where:<br />
<br />
L is the original length<br />
UM-0085-B2 <strong>DT80</strong> <strong>Series</strong> User’s <strong>Manual</strong> Page 252
ΔL is the length change<br />
R is the original gauge resistance<br />
ΔR is the gauge resistance change<br />
G is the gauge factor, a measure of the sensitivity of the gauge (typical foil gauges have a gauge factor of 2.0, which<br />
means that if they are stretched by 1% their resistance changes by 2%)<br />
Strain is a dimensionless quantity, as it is a ratio of length to length. Strain is often expressed in ppm form (i.e. the length ratio<br />
is multiplied by 1,000,000), in which case it has the units of µStrain (microstrain).<br />
To convert the <strong>DT80</strong>’s ppm bridge readings to strain, use the formula:<br />
4<br />
strain <br />
G N<br />
where<br />
<br />
<br />
<br />
B out<br />
µStrain<br />
B out is the <strong>DT80</strong>'s bridge channel (BGV or BGI) result (ppm)<br />
G is the gauge factor<br />
N is the number of active gauges in the bridge<br />
The conversion can be done in the <strong>DT80</strong> by applying a polynomial as a channel option (see Polynomials (P59)):<br />
Y1=0,k"uStrain" ' Polynomial definition<br />
3BGV(Y1)<br />
' Bridge channel<br />
where k = 4 / GN<br />
For the 3-wire BGI "simulated bridge" configuration (see B5 – 3-Wire BGI Input (P243)) the formula to convert ppm reading to<br />
strain is slightly different:<br />
2<br />
strain <br />
G N<br />
B out<br />
µStrain<br />
Strain Gauges – Vibrating Wire<br />
<strong>DT80</strong>G/85G GeoLogger only<br />
Vibrating wire strain gauges (VWSGs) are widely used for measuring strain in geotechnical applications. A gauge consists of<br />
a tensioned steel wire whose resonant frequency changes as deflections causes the wire’s tension to change.<br />
The <strong>DT80</strong>G/85G GeoLoggers include special hardware to support VW gauges. This works by generating a short electrical<br />
pulse to "pluck" the gauge, then measuring the resulting frequency as it resonates. The strain experienced by the gauge is<br />
proportional to the square of the resonant frequency minus the square of the "at rest" resonant frequency.<br />
The FW channel type is used to measure the frequency of a VWSG. This operates in a similar way to the regular frequency<br />
channel type (F), except that the defaults for some options are different.<br />
Channel Options<br />
The following channel options are relevant for the FW channel type:<br />
the channel factor – this is the sample period (gate time) in ms (default is 200ms)<br />
MD (measurement delay) is important, as described below (default is 350ms)<br />
Note that channel options relating to the <strong>DT80</strong>'s instrumentation amplifier, e.g. GLx (gain lock) and A (attenuators), are not<br />
relevant for FW channels because much of the normal input circuitry is bypassed when performing a VWSG measurement.<br />
VS1 – Vibrating Wire Strain Gauge and Thermistor<br />
VW gauges can be connected to the <strong>DT80</strong> as for any other voltage input. For example, up to three gauges could be<br />
connected to one channel using the configuration shown in V1 – Shared-Terminal Voltage Inputs (P234)<br />
Often the gauge will include an integral thermistor, to allow temperature corrections to be made. In this case it is often<br />
convenient to read both the thermistor and the gauge using a single <strong>DT80</strong> analog channel, as shown below.<br />
* +-#<br />
Figure 111: Wiring for vibrating wire strain gauge with thermistor<br />
To measure<br />
strain<br />
Use the command<br />
1FW<br />
UM-0085-B2 <strong>DT80</strong> <strong>Series</strong> User’s <strong>Manual</strong> Page 253
temperature<br />
1*YS01 (for example)<br />
Measurement Timing<br />
When an FW channel is evaluated, the measurement process is as follows:<br />
1. The pluck circuit begins charging. The MD timer starts here also.<br />
2. After about 100ms, the pluck circuit releases its energy in the form of a narrow high voltage pulse. Inside the sensor<br />
this causes the wire to start vibrating. The resonant frequency will typically be in the range 500-5000Hz.<br />
3. Once the pluck is complete (about 0.2ms), the <strong>DT80</strong> disconnects the pluck circuit and begins listening to the sensor.<br />
Inside the sensor the wire's vibrations are sensed and a corresponding electrical signal is generated.<br />
4. Over the next 100-200ms the <strong>DT80</strong>'s phase locked loop (PLL) locks on to the fundamental frequency and filters out<br />
noise and harmonics. During this time the amplitude of the signal gradually decays as wire’s vibrations decay.<br />
5. Once the MD timer expires the <strong>DT80</strong> will begin measuring the frequency of the filtered signal.<br />
6. Once the required sample period (gate time) has elapsed, the <strong>DT80</strong> reports the measured frequency value.<br />
It is important that the measurement delay is set such that the incoming signal is stable and of adequate amplitude for the<br />
duration of the measurement period. The default value is suitable for most gauges, but in some cases it may need<br />
adjustment, as discussed in Measurement Delay and Sample Period (P254).<br />
Troubleshooting<br />
Listening to the Gauge<br />
The <strong>DT80</strong>G/85G GeoLoggers provide a headphone output socket which can be useful in diagnosing problems, given that<br />
the sensor’s vibration falls within the audible frequency range (500-5000Hz).<br />
To check a gauge, connect headphones or speakers, then enter the following:<br />
P21=1 this keeps the <strong>DT80</strong>'s analog section powered after the end of the measurement<br />
P62=1 this maintains the multiplexer settings after the end of the measurement<br />
1FW<br />
this samples the VWSG connected to, in this case, channel 1 + and – terminals.<br />
Each time you send the FW command you should hear a clear "ping" sound which decays over a period of a few seconds. If<br />
not:<br />
<br />
<br />
<br />
<br />
If there is no sound or only random noise, double check that you entered the correct channel number. Check all<br />
connections. Check the resistance of the gauge by connecting it to the * and # terminals then entering 1*R several<br />
times. These 2-wire resistance measurements should return stable values. If not then a cable or gauge fault is<br />
indicated.<br />
If a ping can be heard but it is faint or buried in random noise, then the cable is too long or is "leaky", or the gauge<br />
sensitivity is too low.<br />
If the ping is not clean and pure, then the gauge is possibly faulty. The gauge may have been mechanically damaged<br />
during installation.<br />
If you can hear a low frequency hum, then noise pick is a problem. If the gauge is placed near a transformer, electric<br />
motor, high current power cables, etc, then relocate or reorient the gauge for minimum pickup. Ensure that the cable is<br />
shielded to prevent capacitive pickup. (Connect the shield to DGND or the <strong>DT80</strong> chassis earth point.)<br />
Be sure to reset the P21 and P62 settings when finished.<br />
Measurement Delay and Sample Period<br />
If a strong and clear signal is heard, but the frequency measurements are unstable (variations of 10-20Hz or more) then<br />
there may be strong harmonics present in the gauge's vibration. Because harmonics usually decay faster than the<br />
fundamental, it will often help to increase the MD setting. This will mean that the actual frequency measurement phase starts<br />
later, at which point the amplitude of the harmonics should be less. If the measurement delay is increased too much,<br />
however, the overall signal amplitude may decay below the noise level.<br />
If the signal is clear but decays rapidly then the default MD setting may in fact be too long – by the time the measurement<br />
completes the signal has decayed to nothing.<br />
Some trial and error may be required to find optimal settings. The recommended procedure is as follows. For each step<br />
perform several measurements in order to gauge the stability of the readings.<br />
1. Start with minimum values for measurement delay and sample period, e.g. 1FW(MD150,30)<br />
2. Increase the MD setting in, say, 20ms steps until stable readings are obtained, then go one step further.<br />
3. Further improvement can usually be obtained by progressively increasing the sample period so that the frequency is<br />
measured over a longer time interval. If this is increased too far however then the signal amplitude will descend into<br />
the nose and readings will get rapidly worse.<br />
Converting Frequency to Strain<br />
As mentioned above, the strain experienced by a VWSG is proportional to the change in the square of the resonant<br />
frequency. That is:<br />
UM-0085-B2 <strong>DT80</strong> <strong>Series</strong> User’s <strong>Manual</strong> Page 254
strain G<br />
where:<br />
<br />
<br />
<br />
<br />
f<br />
2<br />
<br />
f<br />
2<br />
0<br />
<br />
G is the gauge factor (supplied by the manufacturer)<br />
f is the measured frequency<br />
f 0 is the zero or "at rest" frequency<br />
It is therefore necessary to take a zero reading, after installation of the gauge. This value should be recorded; it can then be<br />
used in a <strong>DT80</strong> program in order to return strain, e.g.<br />
BEGIN<br />
RA1M<br />
1FW(F6,=1CV,W) read the frequency, square it and save in 1CV<br />
2CV=G*(1CV-f 0^2) calculate the strain, given gauge factor G and zero frequency f 0<br />
END<br />
Temperature Correction<br />
As the temperature of the VWSG changes, the steel wire will expand or contract. Its change in length is proportional to the<br />
change in temperature. A temperature change will therefore cause an addition or reduction to the measured strain. That is:<br />
strain G<br />
2 2<br />
f<br />
f <br />
CT<br />
T <br />
0<br />
0<br />
where:<br />
C is the temperature correction factor (supplied by the manufacturer; this is basically the coefficient of thermal<br />
expansion for the grade of steel used for the wire)<br />
T is the current temperature<br />
T 0 is the temperature at which the zero frequency measurement was taken<br />
So if the gauge incorporates a YS04 thermistor and is wired as per VS1 – Vibrating Wire Strain Gauge and Thermistor<br />
(P253) then a typical program might be:<br />
BEGIN<br />
RA1M<br />
1FW(F6,=1CV,W)<br />
read the frequency, square it and save in 1CV<br />
1*YS04(=2CV)<br />
read the temperature and save it in 2CV<br />
3CV=G*(1CV-f 0^2)+C*(2CV-T 0 ) calculate the strain and apply temperature correction<br />
END<br />
Strain Gauges – Carlson Meter<br />
A Carlson meter consists of two tensioned steel wires (connected in series) whose resistance changes as they are strained.<br />
The wires are arranged so that a given strain causes the resistance of one wire to increase and the other to decrease. The<br />
strain is then proportional to the ratio of the two resistances.<br />
The resistance labelled R1 in the wiring diagrams is the expansion wire (its resistance increases as the gauge is stretched),<br />
while R2 is the compression wire (its resistance increases as the gauge is compressed). Thus when the gauge is stretched,<br />
the ratio R1/R2 will increase, resulting in a positive strain reading. Conversely, compression will cause a decrease in ratio<br />
R1/R2 and a negative strain reading.<br />
The wire resistances are also temperature dependent. The temperature is proportional to the total resistance, i.e. the sum of<br />
the two resistances.<br />
A Carlson stress meter uses the same principle as a strain meter but is designed to indicate stress (force per unit area, unit<br />
MPa) rather than strain (displacement). Stress and strain proportional to each other according to the modulus of elasticity of<br />
the material.<br />
Carlson meters are supplied in 3, 4, 5 or 6 wire configurations. The extra wires allow the logger to properly compensate for<br />
the cable resistance, which is often an important issue given that meters typically have a total resistance in the range<br />
50-100Ω. Standard wire colours are normally (although not universally) used, as shown in the wiring diagrams.<br />
Due to their low resistance, Carlson meters should normally be measured using the high (2.5mA) excitation setting (II<br />
channel option).<br />
UM-0085-B2 <strong>DT80</strong> <strong>Series</strong> User’s <strong>Manual</strong> Page 255
CS1 – 5 Wire Carlson Meter<br />
The 5-wire configuration allows the <strong>DT80</strong> to perform a 4-wire measurement on each resistance. It can therefore fully<br />
compensate for cable resistance, including unequal cable resistances. It does, however, require two analog input channels<br />
per sensor.<br />
Sometimes a sixth wire is included – an additional sense wire connected to the junction between the resistors. This can<br />
either be ignored or it can be connected to the + input of channel 2 in place of the link shown.<br />
WHT<br />
R1<br />
RED<br />
GRN<br />
* +-#<br />
1<br />
R2<br />
BLU<br />
* +-#<br />
2<br />
BLK<br />
Figure 112: Wiring for 5-wire Carlson Sensor<br />
To measure<br />
R1<br />
R2<br />
Use the command<br />
1R(4W,II)<br />
2R(4W,II)<br />
CS2 – 4 Wire Carlson Sensor<br />
With a 4-wire configuration, the <strong>DT80</strong> is able to compensate for cable resistance, provided that the resistance is equal for all<br />
four wires. This is achieved by taking three separate resistance measurements (M1, M2 and M3) which include R1, R2 and<br />
the cable resistance (Rc) in various combinations.<br />
WHT<br />
R1<br />
R2<br />
RED<br />
GRN<br />
BLK<br />
* +-#<br />
Figure 113: Wiring for 4-wire Carlson Sensor<br />
To measure<br />
Use the command<br />
M1 (R1 + R2 + 2Rc)<br />
1*R(II)<br />
M2 (R1)<br />
1R(4W,II)<br />
M3 (R1 + R2 + Rc)<br />
1+R(II)<br />
Using these three measurements and a little algebra we can eliminate Rc and calculate the actual resistance values:<br />
R1 M 2<br />
R2 2M<br />
3<br />
M<br />
1<br />
M<br />
2<br />
For example, the following <strong>DT80</strong> program will calculate the required resistances:<br />
BEGIN<br />
RA1M<br />
1*R(II,=1CV,W)<br />
1R(4W,II,=2CV,W)<br />
1+R(=3CV,II,W)<br />
11CV("R1~Ohm")=2CV<br />
12CV("R2~Ohm")=2*3CV-1CV-2CV<br />
END<br />
UM-0085-B2 <strong>DT80</strong> <strong>Series</strong> User’s <strong>Manual</strong> Page 256
CS4 – 3 Wire Carlson Sensor<br />
With this configuration the <strong>DT80</strong> is not able to take three independent measurements, so automatic lead resistance<br />
compensation is not possible.<br />
This configuration will therefore require manual correction for cable resistance (Rc). This can be applied as the channel<br />
factor (which, for resistance, is an offset adjustment in ohms). The Rc value may be supplied by the manufacturer, or it can<br />
be measured manually (at a typical working temperature).<br />
R1<br />
R2<br />
WHT<br />
GRN<br />
BLK<br />
* +-#<br />
Figure 114: Wiring for 3-wire Carlson Sensor<br />
To measure<br />
R1<br />
R2<br />
Use the command<br />
1R(4W,II,Rc)<br />
1-R(II,Rc)<br />
Calculating Temperature and Strain<br />
Temperature<br />
The temperature is given by:<br />
<br />
T R1<br />
R2<br />
where:<br />
<br />
<br />
<br />
<br />
<br />
ba<br />
T is the temperature (°C)<br />
R 1 and R 2 are the measured resistance values (Ω)<br />
b is the temperature offset: total resistance at 0°C (Ω) (supplied by manufacturer)<br />
a is the temperature factor: change in temperature per unit change in total resistance (°C/ Ω) (supplied by<br />
manufacturer). In some cases different factors may be supplied for different temperature ranges, e.g. one for above<br />
0°C and one for below.<br />
This temperature can then be used to correct the stress or strain calculation.<br />
Strain and Stress<br />
In general terms, strain (or stress) is proportional to the change in the ratio R1/R2 relative to some base value, less a<br />
correction for expansion due to temperature.<br />
The precise form of the equation for calculating stress/strain will depend on the application and the actual data supplied by<br />
the Carlson meter manufacturer. The formula will normally be similar to:<br />
R<br />
strain G<br />
<br />
R<br />
where:<br />
<br />
<br />
<br />
<br />
<br />
1<br />
2<br />
<br />
Z<br />
CT<br />
<br />
G is the calibration factor: change in indicated strain per unit change in resistance ratio (supplied by manufacturer).<br />
This constant is typically specified as µε/0.01%, i.e. microstrain per 0.01% ratio change. For a stress meter the<br />
calibration factor units will be different, e.g. kPa/0.01%.<br />
R 1 and R 2 are the measured resistance values<br />
Z is the "zero" resistance ratio. A value of "R1/R2 at 0°C" may be supplied by manufacturer, or an initial measurement<br />
of R1/R2 can be made soon after installation, which will form the zero point for subsequent strain values.<br />
C is the temperature correction factor: change in indicated strain per unit change in temperature (may be supplied by<br />
manufacturer) This constant is typically specified as µε/°C, i.e. microstrain per °C.<br />
T is the temperature, as calculated above.<br />
UM-0085-B2 <strong>DT80</strong> <strong>Series</strong> User’s <strong>Manual</strong> Page 257
Example<br />
The following example shows how the <strong>DT80</strong> might be used to calculate a strain value. It will most likely need to be adapted<br />
to suit the type of sensor and the application. In this case a 5-wire sensor is used, with the manufacturer supplied parameters<br />
as shown.<br />
BEGIN<br />
' Manufacturer data<br />
' b = 68.22 ohm<br />
' a = 4.86 degC/ohm<br />
' G = 5.8962 ue/0.01%<br />
' Z = 1.0137<br />
' C = 10.56 ue/degC<br />
RA12H<br />
1R(=1CV,ES5,4W)<br />
measure R1, take 5 extra samples to reduce noise<br />
2R(=2CV,ES5,4W)<br />
measure R2, take 5 extra samples to reduce noise<br />
3CV("Temp~degC")=((1CV+2CV)-68.22)*4.86 calculate temperature if required<br />
4CV("Strain~ue")= 58962*(1CV/2CV-1.0137)-10.56*3CV calculate strain<br />
END<br />
So in this case if the measured resistances were R1=36.44 and R2=35.56 then the calculated temperature would be 18.4°C<br />
and the strain +457 µε.<br />
Analog Logic State Inputs<br />
For reading logic states, the <strong>DT80</strong>'s digital inputs (see Digital Channels (P259)) are the best option. If there are insufficient<br />
digital inputs then the analog inputs can also function as digital inputs, using the AS channel type.<br />
The AS channel type detects an input voltage relative to a threshold:<br />
When the input is above the threshold, 1 is returned.<br />
When the input is below the threshold, 0 is returned.<br />
Any of the Voltage wiring configurations may be used.<br />
The default threshold is 2500mV, but the channel factor can be used to set any value in mV.<br />
Input attenuators are enabled by default for the AS channel type, allowing input voltages up to 30V.<br />
For example:<br />
1AS(1750)<br />
configures analog channel 1 as an analog state input with a threshold of 1.75V.<br />
UM-0085-B2 <strong>DT80</strong> <strong>Series</strong> User’s <strong>Manual</strong> Page 258
Digital Channels<br />
DIGITAL<br />
1D 2D 3D 4D D<br />
GND WK 12V<br />
1C 2C 3C 4C D<br />
1PE<br />
2PE GND<br />
RELAY<br />
A B<br />
5D<br />
Tx Z<br />
6D 7D 8D D<br />
GND<br />
Rx RTS CTS A Y B<br />
D<br />
GND<br />
1 3<br />
2 4<br />
5<br />
ANALOG<br />
The <strong>DT80</strong> provides:<br />
<br />
<br />
<br />
<br />
<br />
4 bidirectional digital I/O channels (1D-4D) with open drain output driver and pull-up resistor (3 channels 1D-3D for<br />
DT81);<br />
4 bidirectional digital I/O channels (5D-8D) with tri-stateable output driver and weak pull-down resistor (SDI-12<br />
compatible) (1 channel 4D for DT81);<br />
1 voltage free latching relay contact output (RELAY)<br />
1 LED output (Attn)<br />
4 hardware counter inputs (1C-4C) which can be used as independent counter channels or as two quadrature (phase<br />
encoder) inputs (one only phase encoder input on DT81). Channels 1C and 2C are low threshold capable.<br />
For detailed specifications, see Digital Inputs and Outputs (P305).<br />
About the Digital I/O Channels<br />
3V<br />
47K<br />
1..4D<br />
33V<br />
47K<br />
In<br />
Out<br />
CPU<br />
5..8D<br />
510<br />
200K<br />
3.3nF<br />
510<br />
7.5V<br />
In<br />
Out<br />
Enable<br />
Figure 115 Digital Circuit (<strong>DT80</strong> channel numbers shown)<br />
Figure 115 shows a simplified circuit diagram for the <strong>DT80</strong>’s eight digital I/O channels. As can be seen, the channels can be<br />
divided into two groups, 1D-4D and 5D-8D (1D-3D and 4D for DT81). While these two groups have different hardware<br />
characteristics (discussed below), all eight channels are accessed and used in much the same way.<br />
Each of the digital channels is bidirectional; it can be used as either:<br />
a digital input (for monitoring the state of a relay or logic signal), or<br />
a digital output (for driving a relay or other control device)<br />
Warning Beware of conflicts when using the <strong>DT80</strong>’s bi-directional digital channels (1D to 8D). For example, if a device such<br />
as a PLC is actively driving one of these channels and you program the <strong>DT80</strong> to also drive the same channel as an output<br />
(for example, 1DSO=0), then a conflict exists. This has the potential to damage the digital channel or the driving source. We<br />
recommend placing a series resistor between the digital channel and the signal source to limit the current that can be driven<br />
into the channel. When choosing the resistor’s value and power rating, be sure to consider the source’s output voltage, drive<br />
UM-0085-B2 <strong>DT80</strong> <strong>Series</strong> User’s <strong>Manual</strong> Page 259
current and operating frequency.<br />
Digital Inputs<br />
The <strong>DT80</strong>’s 8 digital I/O terminals (4 for DT81) can be read individually, or can be read as 4 or 8 bit words.<br />
The following channel types are used to read the states of digital inputs:<br />
Channel Type Valid Channel Numbers Description<br />
DS 1-8 (<strong>DT80</strong>/85) Digital State: returns the state of digital input; 0=low, 1=high<br />
1-4 (DT81)<br />
DN<br />
1-5 (<strong>DT80</strong>/85)<br />
1 (DT81)<br />
Digital Nybble: returns the state of four consecutive digital inputs starting at the<br />
specified input as a 4-bit number (0-15). The specified input will form the least<br />
significant bit of the result.<br />
DB 1 Digital Byte: returns the state of all eight digital inputs as an 8-bit number (0-255).<br />
Input 1D is the least significant bit.<br />
For example, if channel 3DN returns the value 13 (binary 1101) then this indicates that input 3D (lsb) is high, 4D is low, 5D is<br />
high and 6D (msb) is high<br />
Channel Options<br />
The following channel options are applicable to digital input channel types:<br />
<br />
channel factor: for the multi-bit channel types (DN, DB), the channel factor is a bitmask which specifies which digital<br />
inputs to read. The default values for DN and DB are 15 and 255 respectively (i.e. read all bits)<br />
For example, 2DN(7) (bitmask = 0111 binary) will return the state of inputs 2D, 3D and 4D in bits 0 (lsb), 1 and 2<br />
respectively. For input 5D the mask bit is zero so it is not read and bit 3 (msb) of the returned value will always be zero. 5D<br />
can then be used as an output if desired, e.g.<br />
2DN(7) simultaneously read inputs 2D,3D,4D<br />
5DSO=1 drive 5D as an output<br />
Connecting to Digital Inputs<br />
The two groups of digital input channels have different electrical characteristics. In particular:<br />
Inputs 1D-4D (1D-3D for DT81) include a 47k pull-up resistor. The default state (if nothing is connected) is therefore<br />
high. This in turn means that channels 1..4DS will return 1 if the inputs are not connected.<br />
Inputs 5D-8D (4D for DT81) include a 200k pull-down resistor. Their default state is therefore low (0). So if all 8 inputs<br />
are disconnected then 1DB will return 15 (00001111).<br />
Warning The <strong>DT80</strong>’s digital inputs are not reverse-polarity-protected. Therefore ensure signal polarity is correct — positive<br />
to numbered terminals, negative to DGND terminals — before connecting signals to the <strong>DT80</strong>’s digital inputs.<br />
Warning Do not apply more than 30Vdc to inputs 1D-4D (1D-3D for DT81), and do not apply more than 20Vdc to inputs<br />
5D-8D (4D for DT81).<br />
DI1 – Relay Inputs<br />
Voltage-free relay contact closures can easily be detected on channels 1D-4D (1D-3D for DT81) by wiring the relay contacts<br />
between the input pin and DGND, as shown below.<br />
Channels 5D-8D (4D for DT81) are less suitable for relay contact inputs, but they can still be used, for example if the contacts<br />
are wired between the input pin and an external 3-20V dc supply (or one of the DT85/<strong>DT80</strong> <strong>Series</strong> 2's power outputs, 12V or<br />
PWR OUT).<br />
1D<br />
D<br />
GND<br />
Figure 116: Wiring for reading contact closures on digital inputs<br />
To measure<br />
state<br />
Use the command<br />
1DS (0 = contacts closed, 1 = contacts open)<br />
UM-0085-B2 <strong>DT80</strong> <strong>Series</strong> User’s <strong>Manual</strong> Page 260
DI2 – Logic Inputs<br />
Actively driven logic signals can be directly connected to all input channels, provided that the input levels are within the<br />
specified limits; see Input Characteristics (P305)<br />
TTL<br />
Output<br />
(e.g. PLC)<br />
1D<br />
D<br />
GND<br />
Figure 117: Wiring for reading TTL level signals on digital inputs<br />
To measure<br />
state<br />
Use the command<br />
1DS (0 = low, 1 = high)<br />
Other Considerations<br />
Scan Rate<br />
The digital input channels are scanned at 17ms intervals (60Hz), while the <strong>DT80</strong> is awake. This means that the minimum<br />
input pulse width is 17ms – shorter pulses may not be recognised.<br />
Schedule Triggers<br />
Digital input transitions can be used to trigger a report schedule, or a schedule can be configured to only run if a digital input<br />
is in a particular state.<br />
See Trigger on External Event (P46) for more details.<br />
Sleep Mode<br />
Digital inputs are not scanned while the <strong>DT80</strong> is asleep.<br />
However, a high to low digital input transition can be used to wake the <strong>DT80</strong> by connecting the digital input in parallel with the<br />
WK (wake) terminal. The <strong>DT80</strong> can then be programmed so that each time an external pulse occurs the <strong>DT80</strong> will wake and<br />
run an event triggered schedule.<br />
For example, if digital input 4 is also wired to the WK terminal then a typical schedule definition might be:<br />
RA4-E 1..3TT<br />
Note that the digital input must stay low until the <strong>DT80</strong> is fully awake. A short pulse (less than about 1-2 seconds) will still<br />
wake the logger, but the <strong>DT80</strong> may not "see" the high-to-low transition, in which case the edge-triggered schedule will not<br />
run.<br />
Digital Outputs<br />
The <strong>DT80</strong>’s 8 digital I/O terminals (4 for DT81) can also be used as outputs, either individually, or as 4 or 8 bit words.<br />
The following channel types are used to control the states of digital outputs:<br />
Channel Type Valid Channel Numbers Description<br />
DSO 1-8 (<strong>DT80</strong>/85) Digital State Output: sets the state of digital output; 0=low, 1=high<br />
1-4 (DT81)<br />
DNO 1-5 (<strong>DT80</strong>/85)<br />
1 (DT81)<br />
Digital Nybble Output: sets the state of four consecutive digital outputs starting at<br />
the specified output.<br />
DBO 1 Digital Byte Output: sets the state of all eight digital outputs.<br />
RELAY 1 Relay Output: sets the state of the latching RELAY output: 0=open, 1=closed<br />
WARN 1 LED output: sets the state of the Attn LED: 0=off, 1=on<br />
For example:<br />
7DSO=1 sets output 7D high<br />
5DNO=5 (binary 0101) sets 8D low, 7D high, 6D low and 5D high<br />
1DB=255 (binary 11111111) sets all outputs high<br />
1RELAY=1 closes RELAY output contacts<br />
Channel Options<br />
The following channel options are applicable to digital output channel types:<br />
channel factor: for the multi-bit channel types (DN0, DB0), the channel factor is a bitmask which specifies which<br />
digital outputs to alter. The default values for DN0 and DB0 are 15 and 255 respectively (i.e. set all bits)<br />
UM-0085-B2 <strong>DT80</strong> <strong>Series</strong> User’s <strong>Manual</strong> Page 261
channel factor: for the single-bit types (DSO, RELAY, WARN) the channel factor is a delay value (ms). The <strong>DT80</strong><br />
waits for the specified number of milliseconds after setting the output state. Default is 0, i.e. no delay. If the R option is<br />
specified then the default and minimum delay setting is 10ms.<br />
R (reset) After setting the output bit(s) to the specified state(s) and waiting for the delay time, the output(s) will then be<br />
set to the opposite state. In other words a pulse will be generated.<br />
PT (precise timing) – see Delay Accuracy (P265)<br />
For example:<br />
2DNO=1CV<br />
will output the lower 4 bits of 1CV on outputs 5D, 4D, 3D and 2D (all other outputs wil be unchanged), while<br />
2DNO(7)=1CV<br />
(bitmask = 0111 binary) will output just the the lower 3 bits of 1CV on outputs 4D, 3D and 2D. For digital output 4D the mask<br />
bit is 0 so its state will not be affected.<br />
Digital Output Operation<br />
All digital output channels are initialised to their default states on initial power-up or soft reset (RESET). Entering a new job<br />
does not initialise the digital outputs.<br />
A hard reset (power loss or SINGLEPUSH) will also normally re-initialise the digital output states. This behaviour can,<br />
however, be overridden by setting:<br />
PROFILE STARTUP MAINTAIN_OUTPUTS=YES<br />
in which case digital outputs 1..8DSO and 1RELAY will be restored to their previous states following a hard reset.<br />
The default states are summarised below:<br />
Channel Default state Comments<br />
1..4DSO (<strong>DT80</strong>) 1 output pulled up (high), controlled load OFF<br />
1..3DSO (DT81)<br />
5..8DSO (<strong>DT80</strong>) 0 output driver disabled, pulled down (low)<br />
4DSO (DT81)<br />
1RELAY 0 contacts open<br />
1WARN 0 LED off<br />
Note that if one of the digital outputs or the latching relay is being used to control power to a modem (see Powering the<br />
<strong>DT80</strong>’s Modem (P175)) then that output will not be reset during a soft reset (RESET command).<br />
A digital output command, e.g. 1DSO(20,R)=1 is processed as follows:<br />
1. First, the output (or outputs for DNO/DBO) is set to the specified state; if no state is specified (i.e. no =1 or =0 on the<br />
end) then nothing is done.<br />
2. Then the <strong>DT80</strong> waits for the specified delay, if any. If a state was specified and the R option was also specified then<br />
the default delay is 10ms, otherwise 0ms.<br />
3. Then, if R is specified, the output(s) is/are inverted.<br />
4. Finally, the output value as at Step 2 is returned.<br />
The current state of any digital output is thus returned when a digital output command is evaluated. For example, typing<br />
2DSO will return the state to which the output was last set. This will not necessarily reflect the actual state of the 2D terminal<br />
(use 2DS to read the actual state). And if 2DSO(R) is entered then the state of 2D will be inverted and the original state will<br />
be returned.<br />
Connecting to Digital Outputs<br />
As noted above, the two groups of digital channels have different electrical characteristics. In particular:<br />
Outputs 1D-4D (1D-3D for DT81) use an open-drain FET output driver. This can sink up to 100mA @ 30Vdc so it can<br />
drive a low voltage actuator or relay or LED directly. A 47k pull-up resistor (to approx. +4V) is also included, allowing<br />
logic devices to be driven.<br />
Outputs 5D-8D (4D for DT81) are not suitable for directly driving loads such as relays or LEDs. Logic devices can<br />
however be driven. Note that each of these output drivers is tri-stateable.<br />
When the open-drain outputs are used to directly drive loads, the load will be on when the output is in the low state. Thus if<br />
a load was wired up to output 1D you would use 1DSO=0 to turn the load on and 1DSO=1 to turn it off.<br />
The default state of the output drivers on second group of channels is disabled (tri-stated). This allows these channels to be<br />
used as inputs.<br />
UM-0085-B2 <strong>DT80</strong> <strong>Series</strong> User’s <strong>Manual</strong> Page 262
DO1 – Driving a Relay<br />
Loads of up to 100mA @ 30V dc can be directly driven by the open-drain digital outputs 1D-4D (1D-3D for DT81). Note that<br />
inductive loads such as relays should include a reverse diode to limit transients, as shown below.<br />
The power supply for the load can be an external supply, or you can use the power outputs provided on the DT85/<strong>DT80</strong><br />
<strong>Series</strong> 2 (12V or PWR OUT).<br />
+<br />
12V<br />
DC<br />
1D<br />
D<br />
GND<br />
-<br />
Figure 118: Wiring for driving an external relay<br />
Action<br />
energise relay<br />
de-energise relay<br />
Use the command<br />
1DS0=0<br />
1DSO=1<br />
DO2 – Driving a LED<br />
A LED indicator can also be directly driven by the open-drain digital outputs 1D-4D (1D-3D for DT81).<br />
The value of the current limiting resistor should be chosen to suit the supply voltage and LED characteristics. A value of 1kΩ<br />
will set a LED current of about 10mA if a 12V supply is used.<br />
+<br />
12V<br />
DC<br />
1D<br />
D<br />
GND<br />
-<br />
Figure 119: Wiring for driving an external LED<br />
Action<br />
turn LED on<br />
turn LED off<br />
Use the command<br />
1DS0=0<br />
1DSO=1<br />
DO3 – Logic Outputs<br />
Any of the digital outputs (1D-8D) can be used to drive a TTL-compatible logic input, as shown below<br />
TTL<br />
Input<br />
(e.g. PLC)<br />
5D<br />
D<br />
GND<br />
Figure 120: Wiring for driving external logic<br />
Action<br />
set output high<br />
set output low<br />
Use the command<br />
5DS0=1<br />
5DSO=0<br />
UM-0085-B2 <strong>DT80</strong> <strong>Series</strong> User’s <strong>Manual</strong> Page 263
DO4 – Driving a Relay Using 5D-8D<br />
The active-drive digital outputs 5D-8D (4D for DT81) cannot directly drive loads such as relays.<br />
However, an external transistor can be used to increase the current sink capacity so that a relay (or LED) can be controlled<br />
by these outputs.<br />
12V Relay<br />
+<br />
12V<br />
DC<br />
-<br />
1N914<br />
BC337<br />
470<br />
5D<br />
D<br />
GND<br />
Figure 121: Wiring for driving an external relay using an external transistor<br />
Action<br />
energise relay<br />
de-energise relay<br />
Use the command<br />
1DS0=1<br />
1DSO=0<br />
Note that the sense is opposite to that shown in DO1 – Driving a Relay (P263) – the <strong>DT80</strong> output needs to be driven high in<br />
order to turn on the NPN transistor shown.<br />
DO5 – Latching Relay Output<br />
The <strong>DT80</strong>’s latching relay output can be used to directly switch loads of up to 1A @ 30V, as shown below.<br />
+<br />
12V<br />
DC<br />
-<br />
LOAD<br />
A<br />
B RELAY<br />
Figure 122: Wiring for controlling a load using relay output<br />
Action<br />
turn load on<br />
turn load off<br />
Use the command<br />
1RELAY=1<br />
1RELAY=0<br />
Other Considerations<br />
Reading Digital Outputs<br />
If you read the value of a digital output channel, e.g. by entering 1DSO, then the value returned is the state to which the<br />
output was last set. This will not necessarily be the same as the state returned by 1DS, which reflects the actual state on the<br />
1D terminal.<br />
If an open-drain output (1D-4D for <strong>DT80</strong>) is set high (e.g. 1DSO=1), the terminal is not driven by the <strong>DT80</strong> and is free to be<br />
pulled low by an external device. If this occurs then 1DSO will still return 1, but 1DS will return 0, the actual state of the input.<br />
For the <strong>DT80</strong>'s active-drive outputs (5D-8D for <strong>DT80</strong>), things are slightly more complicated due to the fact that the output has<br />
three states: driving high, driving low, or disabled (tri-stated). The rule is that the output driver is switched on when the digital<br />
output channel is set (e.g. 5DSO=0 or 5DSO=1) and it then stays on. If the digital input channel is subsequently read (e.g.<br />
5DS), then the driver will be switched off (and it will stay off) to allow the terminal to be read as an input.<br />
The active-drive outputs include a weak (200k) pull-down resistor. When the output driver is switched off, and in the absence<br />
of any external device driving the terminal, it will therefore normally read low (i.e. 5DS will return 0). Note, however, that the<br />
first time it is read after the output driver is switched off it may still read high (if the output had previously been set high), due<br />
to capacitive effects.<br />
For example,<br />
6DSO(R,100)=1 6DS(W) DELAY=500 6DS<br />
will output a 100ms positive going pulse on 6D, then tri-state the output, wait 500ms then read the state of 6D (which is<br />
presumably now being driven by an external logic device).<br />
Sleep Mode<br />
The states of all digital outputs are maintained while the <strong>DT80</strong> is asleep. Note also that the RELAY output uses a latching<br />
relay, so no extra current is required to hold it in the closed state.<br />
UM-0085-B2 <strong>DT80</strong> <strong>Series</strong> User’s <strong>Manual</strong> Page 264
Power Loss<br />
If the <strong>DT80</strong> loses all power then all outputs will revert to their default state, including the RELAY output. If the<br />
MAINTAIN_OUTPUTS profile setting is enabled then the outputs will be restored to their former state when power is<br />
restored.<br />
Alarm Digital Actions<br />
One or two digital outputs can be configured to follow the state of an alarm. That is, when the alarm is inactive the output(s)<br />
are in their default state (1 for 1..4DSO, 0 for 5..8DSO, 1RELAY and 1WARN) and when the alarm is active the output(s)<br />
will be in their non-default state. Alarm Digital Action Channels (P77) for more information.<br />
Delay Accuracy<br />
The actual pulse width generated by the Delay option for DSO will not necessarily be exactly as specified. For delays of 20ms<br />
or less it will be close (within 1ms). For longer delays the resolution is +/- 16ms however it is guaranteed that the duration will<br />
be at least the specified time.<br />
The PT (precise timing) channel option may be specified to force a precise delay time, even if the duration is greater than<br />
20ms. For example:<br />
1DSO(PT,500,R)=0<br />
will generate a 500ms +/- 1ms duration pulse. Note however that during this time all logger operations including<br />
communications, display updates and sampling will be suspended.<br />
Note Performing long delays using the Delay option is not recommended as it can prevent the timely evaluation of other<br />
schedules. This is true regardless of whether the PT option is specified.<br />
Counters – Low Speed<br />
The digital input channels 1D-8D can also double as low speed counter inputs (up to 25Hz).<br />
The C (counter) channel type returns the number of positive-going transitions seen on the specified digital input (1D-8D). For<br />
example the channel 3C will return the number of pulses seen on digital input 3D.<br />
The counter value is a signed 32-bit integer.<br />
Any of the digital input wiring configurations can be used. That is, either contact closures or logic pulses can be counted.<br />
Channel Options<br />
The following channel options are applicable to low speed counters:<br />
the channel factor specifies a counter "wrap value". The counter will reset to 0 (or "wrap around") when this value is<br />
reached. For example, if 8 pulses are received on input 4D then channel 4C(3) will count in the sequence 1, 2, 0, 1,<br />
2, 0, 1, 2 so after 8 pulses the value 2 will be returned.<br />
R (reset): Counter will be cleared to 0 after returning its current value.<br />
Using Low Speed Counters<br />
Scan Rate<br />
The digital input channels are scanned at approx. 20ms intervals (50Hz). This means that for low speed counter channels:<br />
the minimum input pulse width is 20ms – shorter pulses may not be recognised.<br />
the maximum input count frequency, assuming a 50% duty cycle, is 25Hz.<br />
Use the high-speed counter channels (P266) for higher count frequencies.<br />
Sleep Mode<br />
Digital inputs are not scanned while the <strong>DT80</strong> is asleep so any transitions which occur during sleep will not be counted. Use<br />
the high-speed counter channels (P266) if you need the logger to continue to count pulses even while asleep.<br />
Schedule Triggers<br />
Counter channels can be configured to trigger a schedule when the counter reaches its specified wrap value (at which point<br />
it resets to 0). See Trigger on External Event (P46) for more details. For example,<br />
RA2C(10) 1TK<br />
will measure a temperature on every 10 th pulse received on digital input 2D.<br />
Presetting Counters<br />
The count value for a digital input channel can be preset using an expression, e.g.<br />
RA1M 8C=1000 RB2S 8C<br />
will reset the counter to 1000 once per minute. So if a 1Hz signal is now applied to input 8D you would expect the values<br />
returned every 2s for channel 8C to follow a sequence similar to:<br />
1000, 1002, 1004 ... 1056, 1058, 1000, 1002 ...<br />
Setting Counter Wrap Value<br />
Note that a counter’s wrap value (channel factor) is applied when the channel is defined (i.e. when the job is entered), not<br />
UM-0085-B2 <strong>DT80</strong> <strong>Series</strong> User’s <strong>Manual</strong> Page 265
when it is evaluated. Also, setting the wrap value has the side effect of resetting the count value to zero. This implies that:<br />
<br />
<br />
a particular counter’s wrap value need only be specified once in the job. It does not need to be specified every time the<br />
counter is evaluated.<br />
If querying a counter using the immediate schedule (e.g. by periodically typing "1C"), do not specify a wrap value each<br />
time. Each time you evaluate an immediate channel you are also defining it, so the counter value will always be<br />
returned as zero if you specify a wrap value each time.<br />
Counters – High Speed<br />
The <strong>DT80</strong> provides four dedicated counter inputs, labeled 1C-4C. These provide for high speed pulse counting (up to 10kHz)<br />
and can also function as phase encoder inputs.<br />
The HSC (high speed counter) channel type is used to access these counters. For example, 2HSC will return the number of<br />
positive transitions seen on the 2C counter input.<br />
3V<br />
1HSC<br />
2HSC<br />
47<br />
47<br />
47K<br />
47K<br />
22nF<br />
3V<br />
47K<br />
47K<br />
22nF<br />
Threshold<br />
Comparator<br />
Threshold<br />
Comparator<br />
Counter 1 Clock<br />
Quad. 1 Clock Up<br />
Quad. 1 Clock Down<br />
Counter 2 Clock<br />
3V<br />
CPU<br />
3HSC<br />
47<br />
47K<br />
47K<br />
22nF<br />
3V<br />
Schmitt<br />
Input<br />
Counter 3 Clock<br />
Quad. 2 Clock Up<br />
Quad. 2 Clock Down<br />
4HSC<br />
47<br />
22nF<br />
47K<br />
47K<br />
Schmitt<br />
Input<br />
Counter 4 Clock<br />
Figure 123 High Speed Counter Channels<br />
Figure 123 shows a simplified circuit diagram for the <strong>DT80</strong>’s four hardware counter inputs. As can be seen, the channels can<br />
be divided into two pairs of inputs, 1C-2C (counter channels 1HSC and 2HSC) and 3C-4C (3HSC and 4HSC). Each pair can<br />
be used as either:<br />
two independent counter inputs, for pulse counting, or<br />
a single phase encoder (quadrature) input, for use with position sensors that provide phase encoded outputs ("A" and<br />
"B"). See Phase Encoders (P268)<br />
Note that on the DT81, only the 3C-4C inputs can be used with a phase encoder.<br />
Channel Options<br />
The following channel options are applicable to high speed counters:<br />
the channel factor specifies a counter "wrap value", as for the low speed counters. The counter will reset to 0 (or<br />
"wrap around") when this value is reached.<br />
R (reset): Counter will be cleared to 0 after returning its current value, as for the low speed counters.<br />
LT (low threshold): This option is only applicable to counter inputs 1C and 2C (i.e. counter channels 1HSC and<br />
2HSC). It selects low level input thresholds (“low” threshold 2mV and “high” threshold 7mV), as opposed to regular<br />
(TTL-level) thresholds.<br />
Connecting to Counter Inputs<br />
Counter input channels 1C-2C and 3C-4C have different electrical characteristics. In particular:<br />
Inputs 1C-2C include selectable TTL or low-level input thresholds. Low thresholds (selected by using the LT channel<br />
option) allow direct connection to sensors whose output is only a few mV, e.g. inductive-pickup flow sensors.<br />
Inputs 3C-4C use a standard TTL level Schmitt trigger input.<br />
UM-0085-B2 <strong>DT80</strong> <strong>Series</strong> User’s <strong>Manual</strong> Page 266
Relay Contact Inputs<br />
Voltage-free relay or switch contact closures can be counted on channels 1C-4C by wiring the relay contacts between the<br />
input terminal and DGND in the same way as for a digital input.<br />
All inputs include low-pass filtering to assist in "debouncing" mechanical switch or relay inputs. For voltage-free contact<br />
inputs this limits the maximum count rate to approximately 500Hz.<br />
Logic Inputs<br />
TTL level logic outputs from external equipment may also be directly connected to a counter input in the same way as for a<br />
digital input. For actively driven inputs such as these, the maximum count rate is approximately 10kHz.<br />
Low Level Inputs<br />
Inductive pickup sensors such as flow meters often have an output pulse amplitude of only a few millivolts. These can,<br />
however, be directly connected to inputs 1C or 2C. The LT channel option must be specified in order to set the <strong>DT80</strong>'s input<br />
threshold levels appropriately, e.g. 1HSC(LT).<br />
Refer to the Specifications for more details on the counter input characteristics.<br />
Special Count Modes<br />
Counter input 3C (i.e. channel 3HSC) supports some special count modes. These are controlled by the P27 setting, as<br />
follows:<br />
Setting<br />
Description<br />
P27=0 Normal (default setting) – 3HSC returns the number of pulses seen on the 3C input<br />
P27=1 Gated 32kHz – 3HSC increments at 32768Hz while input 3C is low. This can be used for<br />
measuring pulse widths.<br />
P27=2 Gated 3C – 3HSC returns the number of pulses seen on input 3C while input 4C is low.<br />
This can be used for measuring a short burst of pulses.<br />
P27=3 Fixed 1024Hz – 3HSC continuously increments at 1024Hz. This can be used for general<br />
high resolution timing.<br />
Counting While Asleep<br />
The high-speed counter inputs continue to function while the <strong>DT80</strong> is asleep.<br />
However, it is important to note that each hardware counter is 16 bits wide. (Count values are maintained and returned as<br />
32-bit values, but the physical hardware counters attached to inputs 1C-4C are 16-bit.) If more than 65536 pulses occur<br />
while the <strong>DT80</strong> is sleeping then the hardware counter will overflow, and this will cause an inaccurate count value to be<br />
returned when the <strong>DT80</strong> wakes.<br />
It is therefore necessary to ensure that the <strong>DT80</strong> is programmed to wake often enough to ensure that the hardware counters<br />
can be read before they overflow.<br />
For example, if the average counter input frequency is 100Hz then the <strong>DT80</strong> must be programmed to wake at least every<br />
65536/100 seconds (about every 10 minutes). This can be done by including a 10-minute schedule in the job, e.g.<br />
RA10M 1HSC(W)<br />
Most of the other comments made above regarding digital input counter channels apply equally to the high speed counter<br />
channels. For example, HSC channels can be preset to a particular starting value (e.g. 2HSC=1CV*10), HSC channels can<br />
trigger a schedule when they wrap, and so on.<br />
Other Considerations<br />
Signal Edges<br />
Counters increment on the rising edge of the count input signal.<br />
For gated modes (P27=1 and P27=2), the gate signal is sampled on the falling edge of the count input signal.<br />
Schedule Triggers<br />
High speed counter channels can be configured to trigger a schedule when the counter reaches its specified wrap value (at<br />
which point it resets to 0). See Trigger on External Event (P46) for more details. For example,<br />
RA2HSC(100) 1TK<br />
will measure a temperature on every 100 th pulse received on counter input 2C.<br />
Presetting Counters<br />
The count value for a high speed counter channel can be preset using an expression, e.g.<br />
RA1M 1HSC=1000 RB2S 1HSC<br />
will reset the counter to 1000 once per minute. So if a 1Hz signal is now applied to input 1C you would expect the values<br />
returned every 2s for channel 1C to follow a sequence similar to:<br />
1000, 1002, 1004 ... 1056, 1058, 1000, 1002 ...<br />
Setting Counter Wrap Value<br />
Note that, as with low speed counters, a counter’s wrap value (channel factor) is applied when the channel is defined (i.e.<br />
UM-0085-B2 <strong>DT80</strong> <strong>Series</strong> User’s <strong>Manual</strong> Page 267
when the job is entered), not when it is evaluated. Also, setting the wrap value has the side effect of resetting the count value<br />
to zero. As discussed earlier, this implies that the wrap value should therefore normally only be specified once for each<br />
counter channel.<br />
Phase Encoders<br />
Not available on DT82E<br />
A phase encoder is a device for measuring relative angular or linear position. As it rotates or moves, it outputs two streams<br />
of pulses ("A" and "B") whose phase relationship (A leading or B leading) indicates the direction of travel.<br />
The <strong>DT80</strong>’s PE channel type decodes these pulses and returns a signed position value in counts. The count may be positive<br />
or negative depending on the direction of travel.<br />
As mentioned in Counters – High Speed (P266), the <strong>DT80</strong>'s four high speed counter inputs are set up as two pairs: 1C/2C<br />
and 3C/4C. Each pair can be used as either two independent counters, or a single phase encoder input. (For DT81, only the<br />
3C/4C pair can be used as a phase encoder input.)<br />
Note that the "mode" of a counter channel pair (i.e. whether it operates as two counters or a single phase encoder channel)<br />
is set when the channel is defined (i.e. when the job is entered), not when it is evaluated. This implies that a particular<br />
counter input pair cannot be read as a phase encoder value at one point in a job, and as a pair of counters at another. In<br />
other words, if your job defines a channel 1PE then it should not also define channels 1HSC or 2HSC, and vice versa.<br />
The following table summarises the options for using phase encoder channels:<br />
Model Channel "A" input "B" input Notes<br />
<strong>DT80</strong>/85 1PE 1C 2C Do not use 1HSC and 2HSC channels<br />
2PE 3C 4C Do not use 3HSC and 4HSC channels<br />
DT81 1PE 3C 4C Do not use 3HSC and 4HSC channels<br />
Channel Options<br />
The following channel options are applicable to PE channel types:<br />
the channel factor is not used for phase encoder channels.<br />
R (reset): Position value will be cleared to 0 after returning its current value.<br />
Phase Encoder Operation<br />
The following diagram illustrates how the reported PE position values relate to the phase encoder pulses received on the<br />
counter inputs. In particular, note that a pulse is counted on each edge of the A and B inputs. This is sometimes referred to<br />
as "x4" mode, because if the encoder speed is such that it generates a 100Hz pulse train on its A and B outputs then the<br />
<strong>DT80</strong>'s position count will increment at 400Hz.<br />
moving right (A leads B) stopped moving left (B leads A)<br />
1C (A)<br />
2C (B)<br />
1PE 1 2 3 4 5 6 7 8 7 6 5 4 3<br />
Figure 124: Relationship between phase encoder signals and reported position (1PE) value<br />
UM-0085-B2 <strong>DT80</strong> <strong>Series</strong> User’s <strong>Manual</strong> Page 268
P1 – Phase Encoder Inputs<br />
The following diagram shows the connection of a phase encoder to the counter inputs on a <strong>DT80</strong> or DT85. (For DT81 you<br />
would use the 3C and 4C inputs.)<br />
Phase<br />
Encoder<br />
A<br />
B<br />
1C<br />
1PE<br />
2C<br />
Figure 125: Wiring for reading a phase encoder (quadrature) signal<br />
To measure<br />
position (in counts)<br />
Use the command<br />
1PE<br />
Other Considerations<br />
Sleep Mode<br />
The high-speed counter inputs continue to function while the <strong>DT80</strong> is asleep, so the phase encoder inputs will too.<br />
As discussed in the High Speed Counter section (P267), it is important to ensure that the 16-bit hardware counters do not<br />
overflow during sleep. The <strong>DT80</strong> calculates the encoder position in software, by subtracting the count values read from the<br />
"up" and "down" hardware counters. This means that incorrect readings will result if there are more than 65536 pulses in<br />
either direction while the <strong>DT80</strong> is asleep.<br />
Presetting Counters<br />
The count value for a phase encoder channel can be preset using an expression, e.g.<br />
RA3-E 1PE=0<br />
will reset the encoder position to 0 when a button wired to digital input 3 is pressed.<br />
Examples – Digital and Counters<br />
Pulse Train Output<br />
The schedule command<br />
RA2S 6DS0(500,R)=1<br />
produces a pulse train from channel 6D which is HIGH for 0.5s and LOW for 1.5s.<br />
Sensor Power Control<br />
In the schedule command<br />
RA20M D T 4DSO(1000)=0 1..4V 4DSO=1<br />
digital state output 4 controls a relay that switches the power supply to a group of sensors. Every 20 minutes the sensors are<br />
powered up, the system waits one second while the sensors settle, the sensors are scanned, and the sensor power supply is<br />
turned off again.<br />
<strong>Manual</strong> Control<br />
The polled schedule (see Trigger on Schedule-Specific Poll Command (P47)) can also be used to switch digital state output<br />
channels. For example, the command<br />
RBX 3DSO(5500,R)=0<br />
turns a load connected to channel 3D ON for 5.5 seconds when an XB poll command is received.<br />
Frequency Measurement<br />
The R channel option can be used to measure the frequency of an input signal, e.g.<br />
RA1S 1HSC(R,RS)<br />
will return the frequency in Hz of an input signal on channel 1C, while<br />
RA10S 1HSC(R,RS)<br />
will do the same thing but resolve down to 0.1Hz.<br />
The RS option divides the channel value (number of pulses) by the time since the last sample, yielding a frequency.<br />
This technique can also be used for the digital input channels (1D-8D), e.g.<br />
RA1S 7C(R,RS)<br />
will return the frequency in Hz of an input signal on channel 7D, in the range 1-30Hz.<br />
UM-0085-B2 <strong>DT80</strong> <strong>Series</strong> User’s <strong>Manual</strong> Page 269
SDI-12 Channel<br />
About SDI-12<br />
SDI-12 is a serial communications protocol for interfacing multiple microprocessor based sensors to a data logger. SDI-12<br />
uses a shared three-wire "bus" – 12V power, data (0-5V signaling levels) and ground – and operates at a data rate of 1200<br />
baud.<br />
Each sensor connected to an SDI-12 bus is configured with a unique address, which is usually just a single digit 0-9. The<br />
data logger specifies this address when it requests data from the sensor. This transmission will be received by all sensors,<br />
but only the one with the matching address will respond. If two sensors have the same address then they will both try to<br />
transmit at once, resulting in garbled communications.<br />
The SDI-12 standard has undergone a number of revisions; at the time of writing the current version is 1.3. (1.0 was released<br />
in 1988, 1.2 in 1996 and 1.3 in 2000.) Not all sensors support the latest version. The <strong>DT80</strong> can determine which version of<br />
the standard a given sensor supports, and act appropriately.<br />
Each SDI-12 message sent by the data logger is a short (up to 5 characters) plain ASCII string, terminated by a ! character.<br />
The response from the addressed sensor is also in ASCII format (up to 80 characters).<br />
For more details see http://www.sdi-12.org.<br />
SD1 – SDI-12 Sensor Inputs<br />
The <strong>DT80</strong>'s tri-stateable digital I/O channels (5D-8D on <strong>DT80</strong>, 4D on DT81) can be used to control up to four SDI-12 buses.<br />
Up to ten SDI-12 sensors can be connected to each bus.<br />
As shown below, an SDI-12 bus is connected to the <strong>DT80</strong> as follows:<br />
The SDI-12 DATA line connects to one of the digital I/O terminals 5D – 8D (4D for DT81)<br />
The SDI-12 GROUND line connects to the D GND terminal<br />
The SDI-12 POWER line may be connected to the <strong>DT80</strong>'s external power input terminal (+), or one of the power<br />
outputs on the DT85/<strong>DT80</strong> <strong>Series</strong> 2 (12V or PWR OUT), or a separate 9.6-16V DC supply.<br />
When connecting a sensor to the <strong>DT80</strong> for the first time, it's best to connect only that sensor, i.e. you should temporarily<br />
disconnect any other sensors on the same SDI-12 bus. This ensures there will be no address conflicts<br />
SDI12<br />
Sensor<br />
12V<br />
Data<br />
GND<br />
+<br />
12V<br />
DC<br />
-<br />
D<br />
GND<br />
5D<br />
6D<br />
7D<br />
8D<br />
D<br />
GND<br />
Figure 126: Wiring for an SDI-12 sensor. Up to 10 sensors can be connected in parallel to each digital channel.<br />
To measure<br />
register #1 on SDI-12 device #0<br />
Use the command<br />
7SDI12<br />
Testing and Configuring an SDI-12 Device<br />
SDI-12 Address<br />
The first task is to determine the address of the sensor. All SDI-12 sensors are able to be set to one of at least ten different<br />
addresses. Depending on the sensor, this may be done by:<br />
changing a hardware setting, e.g. DIP switches<br />
sending an SDI-12 "change address" command (aAb!, where a is the current address and b is the new address)<br />
connecting the sensor to a PC serial port and using configuration software supplied by the sensor manufacturer. You<br />
may also need to use this configuration software to configure other aspects of the device – for example the device's<br />
SDI-12 interface may be disabled by default, so you would need to enable it using the configuration software.<br />
Consult the sensor's documentation to determine how to set its address. Note that all SDI-12 sensors are factory set to<br />
UM-0085-B2 <strong>DT80</strong> <strong>Series</strong> User’s <strong>Manual</strong> Page 270
address 0. If you are only connecting one sensor to the SDI-12 bus then you can leave it set to this value.<br />
Using SDI12SEND<br />
The <strong>DT80</strong>'s SDI12SEND command allows you to manually send SDI-12 commands to the sensor for testing and<br />
configuration purposes. The format of this command is as follows:<br />
SDI12SEND channel "string"<br />
where:<br />
channel is the digital I/O channel (5 – 8) (4 for DT81)<br />
string is a valid SDI-12 command string to send to the device. All commands start with the sensor address (0 – 9) and<br />
end with a ! character.<br />
If there is a reply from the device then it will be displayed, assuming the /M (enable messages) and /h (free format) switches<br />
are set.<br />
For example, the aI! command (a = address) should result in the sensor returning an identification string, e.g.<br />
SDI12SEND 5 "0I!"<br />
5SDI12: 0I!012SENTEK XEPI 1165FA14F000800<br />
In this example a sensor with address 0 is connected to digital channel 5D. The output of the SDI12SEND command shows<br />
the complete transaction: the first few characters (up to the !) are the command string that was sent, the rest are the<br />
response from the sensor. In this case, the response indicates:<br />
0 – the sensor's address<br />
12 – the version of SDI-12 supported by the sensor (1.2)<br />
SENTEK – the sensor manufacturer<br />
XEPI – the model name<br />
116 – the sensor firmware version<br />
5FA14F000800 – other sensor details, e.g. serial number<br />
If a valid response is not received, an error message will be displayed, e.g.:<br />
SDI12SEND 5 "3I!"<br />
5SDI12: 3I! *no response<br />
In this case the command was sent to the address 3, which is the wrong address. This error may also indicate a wiring<br />
problem, or perhaps the SDI-12 interface on the device has not been enabled.<br />
Errors such as "*framing error", possibly in conjunction with a garbled looking message, generally indicate an address<br />
conflict (more than one device with the same address is connected) although it may also indicate an electrical noise issue.<br />
Reading Data from SDI-12 Devices<br />
Measurement Modes<br />
SDI-12 sensors can operate in one of two different modes:<br />
Measure on demand is the traditional SDI-12 method, which all sensors support. The sensor is idle (typically in a low<br />
power mode) until it is woken by the data logger sending it a measurement request. The sensor then takes the<br />
measurement and then, possibly several seconds later, returns the data.<br />
Continuous measurement is an alternative method, supported by some SDI-12 sensors. The sensor takes<br />
measurements at regular intervals, then when the data logger requests data it immediately replies with the last<br />
reading it took.<br />
In Measure On Demand mode the <strong>DT80</strong> must send a request then wait until the measurement is ready, which may be<br />
immediate or it may take several seconds – depending on the sensor. During this time no other schedules will run, and no<br />
commands will be executed (similar to a DELAY channel).<br />
Measure On Demand mode is most suitable in applications where the sensor is being polled infrequently. This mode<br />
minimises system power usage because the sensor only takes a measurement when it is requested to.<br />
Continuous measurement mode is suited to applications where the logger needs to poll the sensor relatively often, or it is<br />
running other schedules which should not be delayed. Note that the sensor may need to be sent some special commands<br />
(either via SDI-12 or via a separate RS232 configuration interface) to enable continuous mode, set the measurement rate<br />
and so on.<br />
Check the sensor's documentation to see whether continuous measurement mode is supported. If it is, your first decision is<br />
whether you want to use it.<br />
Registers<br />
Most SDI-12 devices can measure a number of different quantities. For example, a device might have 4 temperature sensors<br />
plus 8 moisture sensors, i.e. it can measure 12 distinct quantities.<br />
In <strong>DT80</strong> parlance, each individual data item (quantity that can be measured) is termed a register. An SDI-12 device may<br />
UM-0085-B2 <strong>DT80</strong> <strong>Series</strong> User’s <strong>Manual</strong> Page 271
then divide its particular set of registers into a number of groups, or register sets. For example the abovementioned device<br />
might define register set #2 as the 4 temperature sensors, and register set #3 as the 8 moisture sensors.<br />
The measurement process then proceeds as follows:<br />
1. The <strong>DT80</strong> sends a request message (aCr!) to the SDI-12 device, specifying the register set (r) of interest – only one<br />
register set can be requested at a time. (If r is 0 then it is omitted, i.e. aC! is sent.)<br />
2. The sensor will now measure and update all of the registers in the specified set.<br />
3. After the required time interval, the <strong>DT80</strong> sends a second message (aD0!) to request the actual data values.<br />
4. The sensor replies immediately, sending some or all of the register values.<br />
5. If not all register values were sent, the <strong>DT80</strong> may send further aDn! message(s) to request the remainder.<br />
In Continuous Measurement mode the process is considerably simpler:<br />
1. The <strong>DT80</strong> sends a message (aRr!) to request the most recent data values for register set r.<br />
2. The sensor replies immediately, sending all of the register values.<br />
The SDI12 Channel Type<br />
The <strong>DT80</strong>'s SDI12 channel type allows you to read a data value from an SDI-12 device in much the same way as you<br />
would read a voltage using the V channel type – without worrying about the technicalities of the SDI-12 protocol. There are<br />
four of these channels available, 5..8SDI12, corresponding to the four SDI-12 compatible digital I/O channels (5D – 8D).<br />
When an SDI12 channel is used, you need to specify additional information via channel options. The following channel<br />
options apply:<br />
Option<br />
ADa<br />
Rnnn<br />
CM<br />
Rnnn Settings<br />
Function<br />
Address: specifies the SDI-12 address of the sensor to read (0-9). If not specified, 0 is<br />
assumed<br />
Register: specifies the particular register to return. If the sensor defines more than one<br />
register set then the hundreds digit specifies the register set. If the hundreds digit is zero or<br />
not specified then the sensor's default register set (register set #0) is assumed.<br />
The tens and units digits specify the register number within the register set: 1 for the first<br />
data item in the set, 2 for the second, and so on.<br />
If this option is not specified, 001 is assumed (which would be suitable for a sensor that<br />
only returned one value)<br />
Note that R2 is equivalent to R002 (not R200).<br />
Continuous Measurement: If this option is present then the <strong>DT80</strong> will use Continuous<br />
Measurement Mode. The sensor is assumed to have been configured to take continuous<br />
measurements.<br />
Some sample settings for the Rnnn channel option are shown below:<br />
Option<br />
Data Value (Register) to Read<br />
(none) First data value in default register set (register set #0)<br />
R001 (or R1) First data value in default register set (register set #0)<br />
R019 (or R19) 19 th data value in default register set (register set #0)<br />
R100<br />
not valid<br />
R101 First data value in register set #1<br />
R344 44 th data value in register set #3<br />
For example, suppose a particular SDI-12 device measures 9 different quantities in one go (i.e. it has 9 registers in its default<br />
register set). These 9 values would then be returned to the data logger using an exchange of messages similar to the<br />
following (underlined text is sent by the data logger, the remainder is returned by the sensor):<br />
0D0!0+005.7541+068.0368+017.6721+054.3521+052.0475+016.2069+017.1182+016.8696<br />
0D1!0+019.1727<br />
These 9 register values can then be accessed using 5SDI12(R1) through 5SDI12(R9). So if you were interested in the<br />
third value in the list you would use:<br />
5SDI12(R3)<br />
5SDI12 17.7<br />
As can be seen, the third value returned by the sensor (+017.6721) is the return value of the channel.<br />
Example<br />
Measure on Demand<br />
In this example, the documentation for a hypothetical SDI-12 weather station states: "Send the aC1! (or aM1!) command to<br />
measure (1) internal temperature (degC), (2) external temperature, (3) humidity (%RH) and (4) pressure (hPa). Send the<br />
UM-0085-B2 <strong>DT80</strong> <strong>Series</strong> User’s <strong>Manual</strong> Page 272
aC2! (or aM2!) command to measure (1) wind speed (km/h), (2) max gust and (3) direction (degrees)." The device is<br />
connected to the <strong>DT80</strong> using digital I/O 7D, and has been configured with an SDI-12 address of 3.<br />
In this case the device has two register sets (#1 and #2), one with four registers (measured quantities), one with three. The<br />
following <strong>DT80</strong> job will read and log external temperature, pressure and wind speed every two minutes:<br />
BEGIN"CLOUDY"<br />
RA2M 7SDI12(AD3,R102,"Ext temp~degC")<br />
7SDI12(AD3,R104,"Pressure~hPa")<br />
7SDI12(AD3,R201,"Wind speed~km/h")<br />
LOGON<br />
END<br />
Note If your sensor supports both the aMn! and the newer aCn! SDI-12 commands (most modern sensors will) then be sure<br />
to refer to the section on the aCn! command in the sensor documentation when determining which register numbers to use.<br />
These two SDI-12 commands do much the same thing but the ordering of the returned data values may be different. The<br />
<strong>DT80</strong> always uses the aCn! command in preference to aMn!.<br />
Continuous Measurements<br />
The weather station documentation goes on to say "To enable continuous measurement mode (sampling every t seconds),<br />
use the aXC=t! command; to disable use aXCD!. [SDI-12 "X" commands are often used to implement device specific<br />
functions such as this.] Use aR1! and aR2! to return the most recent values of int temp/ext temp/RH/pressure and wind<br />
speed/gust/direction respectively."<br />
The following job does the same thing as the previous example, but this time continuous measurement mode is used:<br />
BEGIN"CLOUDY_CM"<br />
SDI12SEND 7 "3XC=10!" ' enable continuous mode<br />
RA2M 7SDI12(AD3,R102,CM,"Ext temp~degC")<br />
7SDI12(AD3,R104,CM,"Pressure~hPa")<br />
7SDI12(AD3,R201,CM,"Wind speed~km/h")<br />
LOGON<br />
END<br />
Other Considerations<br />
Execution Time<br />
In Measure on Demand mode, SDI12 channels may take a significant amount of time to execute – often 10 seconds or<br />
more, depending on the sensor. During this time no other schedules or commands are executed.<br />
Note however that the <strong>DT80</strong> will only request a measurement of a given register set once per schedule. So the following<br />
schedule:<br />
RA1M 5SDI12(R1) 5SDI12(R3) 5SDI12(R201) 5SDI12(R4)<br />
would execute as follows:<br />
1. <strong>DT80</strong> requests a measurement of register set #0 (0C!), then waits until it is ready.<br />
2. <strong>DT80</strong> reads values for registers 1, 3 and 4, which are all part of register set #0. It will probably be given values for other<br />
registers (e.g. register 2), which it will discard because they are not referenced in the job<br />
3. <strong>DT80</strong> can now evaluate (i.e. return/log values for) the first two channels.<br />
4. <strong>DT80</strong> requests a measurement of register set #2 (0C2!), then waits until it is ready.<br />
5. <strong>DT80</strong> reads value for register 1 (in register set #2) and discards any other values that it receives.<br />
6. <strong>DT80</strong> can now evaluate the last two channels.<br />
Notice that the <strong>DT80</strong> waits for the sensor on two occasions, once for each register set.<br />
Versions<br />
The <strong>DT80</strong> automatically determines the version of the SDI-12 specification that a given sensor supports, and tailors the<br />
types of messages it sends accordingly. For example:<br />
Error check codes (CRCs) are used on data messages, but only if the sensor supports SDI-12 Version 1.3 or later.<br />
Continuous Measurement mode is only available if the sensor supports SDI-12 Version 1.2 or later.<br />
Troubleshooting<br />
There are two main areas where difficulties may arise when setting up an SDI-12 system<br />
the <strong>DT80</strong> cannot communicate properly with the sensor<br />
the sensor does not support the request you are making of it<br />
These will be discussed in the sections below.<br />
UM-0085-B2 <strong>DT80</strong> <strong>Series</strong> User’s <strong>Manual</strong> Page 273
Diagnostic Messages<br />
When troubleshooting an SDI-12 connection, it can often be helpful to see the actual SDI-12 messages. The <strong>DT80</strong> provides<br />
a special parameter setting for this purpose:<br />
P56=2<br />
If this parameter setting were used with the weather station example described above (Measure on Demand mode), you<br />
might see something like:<br />
7SDI12: [8] 3C1!300704<br />
7SDI12: [25] 3D0!3+22.91+42.40+21.0+1013.9<br />
Ext temp 42.4 degC<br />
Pressure 1013.9 hPa<br />
7SDI12: [8] 3C2!300603<br />
7SDI12: [18] 3D0!3+4.29+31.43+012<br />
Wind speed 4.3 km/h<br />
which shows the measurement request message (3C1! or 3C2!) and response, followed by the data retrieval message<br />
(3D0!) and response, for each register set.<br />
Set P56=0 to turn off these messages.<br />
Communications Problems<br />
If the sensor does not reply at all to a request, the <strong>DT80</strong> will output an error message, e.g.:<br />
8SDI12(R3)<br />
dataTaker 80 E80 - Serial device not responding (8SDI12:AD0:R3)<br />
8SDI12 NotYetSet<br />
Note also that the value returned by the channel is the special "NotYetSet" error value (see Data Errors (P326))<br />
The main things to check here are:<br />
cabling (Is the sensor powered)<br />
correct SDI12 channel number (In the above example the SDI-12 data wire should be connected to digital input 8D.)<br />
correct SDI-12 address (In the above example the device should have been configured for address 0.)<br />
This error message may also indicate an address conflict – a response was received from the sensor but it was garbled<br />
because two or more sensors tried to both transmit at the same time, which will occur if they are both configured to use the<br />
same address.<br />
Try connecting only one sensor at a time and verifying the address of each sensor. For most sensors you can use the<br />
following command:<br />
SDI12SEND 8 "!"<br />
8SDI12: !1<br />
In this case the sensor has responded, stating that it has been set to address 1.<br />
Communications may also be affected by electrical noise or poor cable connections. If the sensor supports it, the <strong>DT80</strong> will<br />
request that it include an error checking code (CRC) with each data record, which the <strong>DT80</strong> will then check. Any corruption<br />
of these messages will then result in an error message such as:<br />
dataTaker 80 E81 - Serial device invalid response (8SDI12:AD0:R1)<br />
8SDI12 NotYetSet<br />
Unsupported Functions<br />
The other error message that you may see is:<br />
5SDI12(R207)<br />
dataTaker 80 E82 - Serial device data not available (5SDI12:AD0:R207)<br />
5SDI12 NotYetSet<br />
In this case the sensor has indicated that the requested register does not exist. The sensor either does not support register<br />
set #2 (i.e. the aC2! command), or that register set returns fewer than 7 values.<br />
This error may also occur if you have requested continuous mode operation (using the CM channel option) but the sensor<br />
does not support continuous mode, or continuous mode has not been enabled on the sensor.<br />
Double check the sensor documentation. It may help to turn on the diagnostic messages, e.g.:<br />
P56=2 5SDI12(R207)<br />
5SDI12: [8] 0C2!000000<br />
dataTaker 80 E82 - Serial device data not available (5SDI12:AD0:R207)<br />
5SDI12 NotYetSet<br />
In this case the sensor has returned 00000 in response to the <strong>DT80</strong>'s request, indicating that no data values are available in<br />
register set #2.<br />
UM-0085-B2 <strong>DT80</strong> <strong>Series</strong> User’s <strong>Manual</strong> Page 274
Generic Serial Channel<br />
The <strong>DT80</strong>’s Serial Channel can be used to connect to serial input and/or output devices such as a serial sensor, GPS<br />
terminal, printer, barcode reader, display panel, PLC, or even to another <strong>DT80</strong>.<br />
A serial channel<br />
<br />
<br />
<br />
<br />
can transmit programmable ‘prompt’ or ‘poll’ messages to serial devices and interpret their replies<br />
can respond to asynchronous incoming serial messages.<br />
can operate using the dedicated serial sensor port (terminal block connection on front panel; not present on DT81),<br />
or the host RS232 port (DE9 connector on side panel), or the USB port.<br />
may be included in schedules in the same way as any other <strong>DT80</strong> channel. The channel name 1SERIAL is used for<br />
the serial sensor port, 2SERIAL for the host port and 3SERIAL for the USB port.<br />
Connecting to and Configuring the Serial Port<br />
Serial Sensor Port<br />
The serial sensor port is the one most commonly used for defining generic serial channels. It supports RS232, RS422 and<br />
RS485 connections.<br />
The default function of this port is SERIAL so in that sense it is ready to use as a generic serial channel. You may, however,<br />
need to configure the baud rate or other serial parameters to suit the device to which you are connecting.<br />
For more details on setting up the port and the possible wiring configurations, see Serial Sensor Port (P169).<br />
Host RS232 Port<br />
The host RS232 port can also be used for controlling serial sensors.<br />
Before a generic serial channel can be defined on this port, the port function must be set to SERIAL, as follows:<br />
PROFILE HOST_PORT FUNCTION=SERIAL<br />
As with the serial sensor port, you may need to change the configured baud rate or other settings.<br />
For more details on setting up the port and the possible wiring configurations, see Host RS-232 Port (P168).<br />
USB Port<br />
The USB port may be used in generic serial mode if you need to communicate with a PC application using a custom serial<br />
protocol. As with the host port, this requires the port function to be set:<br />
PROFILE USB_PORT FUNCTION=SERIAL<br />
For more details, see USB Port (P160).<br />
Serial Channel Commands<br />
SERIAL Channel Type<br />
Data flow into and out of the a serial channel is controlled by the Serial Channel commands. These commands provide for<br />
formatting and management of output strings and prompts to be sent to the connected serial device.<br />
interpretation and parsing of input strings received from the connected device into channel variables<br />
general management of the Serial Channel<br />
The general form of a Serial Channel command is:<br />
nSERIAL("control_string",options)<br />
where:<br />
n is the serial port number (1 for the serial sensor port, 2 for the host port, 3 for the USB port).<br />
control_string is a string of commands that specify the required output and input actions of the Serial Channel. See<br />
The Control String (P276).<br />
options are any other channel options that may be required<br />
Note that SERIAL is actually a channel type, in the same way that V (voltage) is a channel type. It can appear in schedules<br />
and it has channel options, like any other channel type. The control_string is a special channel option which applies only to<br />
the SERIAL channel type.<br />
Note An error message will be returned if you attempt to define an nSERIAL channel and the selected port's function has<br />
not been set to SERIAL in the <strong>DT80</strong> profile.<br />
UM-0085-B2 <strong>DT80</strong> <strong>Series</strong> User’s <strong>Manual</strong> Page 275
Channel Options<br />
Most of the standard channel options (Table 3: <strong>DT80</strong> Channel Options (P41)) may be used with the serial channel, e.g. W<br />
(working channel), =nCV (assign to CV), and so on.<br />
For the SERIAL channel type, the channel factor is the maximum time to wait for serial data to be received. Default is 10s.<br />
This value is a floating point number, so a value of 0.1 will set the timeout to 100ms.<br />
If the standard "UserName~UserUnits" channel option is specified, it must come after the control string in the list of serial<br />
channel options.<br />
Channel Return Value<br />
Depending on the control string, the return value of a SERIAL channel may be either:<br />
<br />
<br />
a data value, interpreted from the data returned by the sensor, or<br />
a status code, indicating whether the commands in the control string were performed successfully.<br />
See Return Value (P281) for more details.<br />
Serial Channel Operation<br />
The Control String<br />
The "control_string" is always enclosed by quotation marks. It can be broken into two parts:<br />
<br />
<br />
Output actions — commands, prompts or text strings that are to be sent from the <strong>DT80</strong> to the device connected to<br />
the serial channel. The various output actions available are detailed in the section Control String – Output Actions<br />
(P278). All output actions are enclosed by {}.<br />
Input actions — commands to manage the <strong>DT80</strong>’s Serial Channel and to interpret the information coming back from<br />
the serial device into the Serial Channel. The various input actions available are detailed in the section Control String<br />
– Input Actions (P280). Input actions are not enclosed by {}.<br />
The general form of the "control_string" is<br />
<br />
<br />
any combination of output actions enclosed by {}, and/or<br />
any combination of input actions.<br />
There may be any number of blocks of output actions and input actions, as shown in the following example Serial Channel<br />
commands:<br />
1SERIAL("{output actions}",options)<br />
1SERIAL("input actions",options)<br />
1SERIAL("{output actions}input actions",options)<br />
1SERIAL("{output}input{output}input",options)<br />
The "control_string" is always executed in order left to right, giving you complete control over the sequence of actions.<br />
Where a bi-directional dialog occurs between the <strong>DT80</strong> and serial device, the output actions and input actions can be<br />
included in the same Serial Channel command as shown above, or in separate Serial Channel commands as follows:<br />
BEGIN<br />
RA1M<br />
1SERIAL("{output actions}",options)<br />
1SERIAL("input actions",options)<br />
END<br />
This latter approach simplifies the appearance of the program steps for supervising the Serial Channel, particularly if there<br />
are a number of data points to be prompted and interpreted or parsed in each access. Note however that each instance of<br />
SERIAL uses up one channel table entry (see channel table (P328))<br />
Serial Data Transmission and Reception<br />
If a job contains one or more SERIAL channel definitions then the selected serial ports (host and/or serial sensor) are<br />
activated. Data may then be received from a connected serial device at any time whilst the job is loaded. As data is received,<br />
it is stored in an area of memory called the serial channel receive buffer. A separate receive buffer is maintained for each<br />
serial port.<br />
When a SERIAL channel is evaluated (i.e. when the schedule of which it is part executes), the <strong>DT80</strong> processes the control<br />
string from left to right. Output actions involve data being sent from the <strong>DT80</strong>, so they are performed there and then, as they<br />
are encountered in the control string. If the data cannot be sent (e.g. due to flow control) within the timeout period (10<br />
seconds by default) then evaluation of the SERIAL channel will be terminated and its status code set to 21 (transmit<br />
timeout).<br />
When the <strong>DT80</strong> finds an input action in the control string it will read any previously received data from the receive buffer and<br />
attempt to match it against the format specified in the input action. If no data is present in the receive buffer at the time that<br />
the input action is processed then the <strong>DT80</strong> will wait up to 10 seconds (this timeout is configurable) for more data to arrive.<br />
Then:<br />
UM-0085-B2 <strong>DT80</strong> <strong>Series</strong> User’s <strong>Manual</strong> Page 276
If the incoming data matches that required by the input action then the <strong>DT80</strong> will move on to the next input action in the<br />
string. If the end of the control string is reached then the SERIAL channel will return and set its status code to 0<br />
(success).<br />
If the timeout expires while the <strong>DT80</strong> is waiting for more data then evaluation of the SERIAL channel will be<br />
terminated and its status code set to 20 (receive timeout).<br />
If the timeout expires while the <strong>DT80</strong> is waiting for a particular CTS state (i.e. \c0 or \c1 input action (P278)) then<br />
evaluation of the SERIAL channel will be terminated and its status code set to 5 (CTS timeout).<br />
If data is received which violates the input action specification then evaluation of the SERIAL channel will be<br />
terminated and its status code set to 29 (Scan Error).<br />
Once the SERIAL channel has completed and set either a success or failure status code, the <strong>DT80</strong> will then move on to<br />
evaluating the next channel (if any) in the schedule.<br />
Depending on how the input actions are specified, the return value of the channel may be either the status code or a scanned<br />
data value. See Return Value (P281).<br />
The following sections describe in detail the various output and input actions that can be specified in a control string.<br />
UM-0085-B2 <strong>DT80</strong> <strong>Series</strong> User’s <strong>Manual</strong> Page 277
Control String – Output Actions<br />
The table below lists the ways in which prompts and text strings can be sent from the <strong>DT80</strong> to the device connected to the<br />
Serial Channel. These commands must be enclosed by {} in the control string.<br />
What to output Output Action syntax Description<br />
Text<br />
text<br />
e.g. abc\009def\013,<br />
GETVAL^M^J<br />
A sequence of characters to be sent.<br />
Non-printable characters may be specified using \nnn (where<br />
nnn is the ASCII code, 1-255). ^char notation may also be used<br />
for control characters (ASCII 1-31), see ASCII-Decimal Tables<br />
(P314).<br />
Break character \b[n] or<br />
\b[nCV]<br />
Transmit a "break" (set the Tx line to logic-0 state) for n or nCV<br />
character periods<br />
Control signal \r1 Set RTS (to a value >+3.5V) – RS232 only<br />
\r0 Clear RTS (to a value
The precision value means different things depending on the conversion type:<br />
Type precision term specifies: Default<br />
d, x, X, o (integer) minimum number of digits to print (leading zeroes will be added if necessary) no minimum<br />
e, E, f (floating point) number of digits to the right of decimal point 6 digits<br />
g, G (mixed) number of significant digits shown 6 digits<br />
c (single character) not applicable<br />
s (string) maximum number of characters from the string to print no maximum<br />
Variable Width & Precision<br />
The width and precision values are normally specified as numeric constants (e.g. %9.2f), but they can also be specified as<br />
an asterisk (*), in which case the value of a CV is used instead.<br />
Output Action syntax and example<br />
%{flag}*.{precision}type[wCV,nCV]<br />
e.g. %*d[1CV,4CV] or %-*.2f[1CV,3CV]<br />
%{flag}*.*[wCV,pCV,nCV]<br />
e.g. %*.*g[1CV,4CV,5CV]<br />
Flag Character<br />
Finally, the flag character allows some further options:<br />
Description<br />
output the value of nCV in the specified numeric format, with<br />
the width parameter set to the value of wCV<br />
as above, but also set the precision parameter to the value of<br />
pCV<br />
Flag Applicable conversion types Description<br />
- d, x, X, o, e, E, f, g, G, s left justify (if spaces need to be added to make up the minimum<br />
field width, add them after the number rather than before)<br />
+ d, x, X, o, e, E, f, g, G prefix value with + character, if it is positive<br />
(space) d, x, X, o, e, E, f, g, G prefix value with space character, if it is positive<br />
0 (zero) d, x, X, o, e, E, f, g, G pad the field with leading zero characters (rather than spaces) if<br />
required to make up the minimum field width<br />
# x, X, o prefix value with 0x, 0X or 0, respectively<br />
# e, E, f always include a decimal point<br />
# g, G do not truncate any trailing zeroes after the decimal point<br />
Examples<br />
Examples assume 1CV = 12345.67, 1$ = "pumpkin"<br />
1SERIAL("{%f[1CV]}") "12345.67"<br />
1SERIAL("{%10f[1CV]}") " 12345.67"<br />
1SERIAL("{%10.1f[1CV]}") " 12345.7"<br />
1SERIAL("{%-10.1f[1CV]}") "12345.7 "<br />
1SERIAL("{%010.1f[1CV]}") "00012345.7"<br />
1SERIAL("{%10.10d[1CV]}") "0000012345"<br />
1SERIAL("{%10.4g[1CV]}") " 1.235e04"<br />
1SERIAL("{%#10.0f[1CV]}") " 12346."<br />
1SERIAL("{%s[1$]}") "pumpkin"<br />
1SERIAL("{%10s[1$]}") " pumpkin"<br />
1SERIAL("{%10.4s[1$]}") " pump"<br />
UM-0085-B2 <strong>DT80</strong> <strong>Series</strong> User’s <strong>Manual</strong> Page 279
Control String – Input Actions<br />
The table below lists the commands available to interpret the information coming back into the Serial Channel from the serial<br />
device. Input actions are not enclosed by {} in the control string.<br />
Expected data Input Action syntax Description<br />
Characters text For each character in the input action string, the <strong>DT80</strong> will read and<br />
discard all incoming characters from the serial device until that<br />
particular character is seen. It then discards the matching character<br />
and starts looking for the next character in the input action text.<br />
For example, if the input action string is abc and the input data from<br />
the serial device is 3c3aabaAAc123 then all characters up to and<br />
including the second "c" will match, i.e. they will be read and<br />
discarded.<br />
Non-printable characters may be specified using \nnn (where nnn<br />
is the ASCII code, 1-255). ^char notation may also be used for<br />
control characters (ASCII 1-31), see ASCII-Decimal Tables (P314).<br />
To include a literal %, { or } character, use \% or \{ or \}<br />
respectively.<br />
Control signal<br />
state<br />
\c1[n] or<br />
\c1[nCV]<br />
\c0[n] or<br />
\c0[nCV]<br />
wait up to n or nCV milliseconds for CTS input to be set (high) –<br />
RS232 only<br />
wait up to n or nCV milliseconds for CTS input to be cleared (low) –<br />
RS232 only<br />
(Wait) \w[n] or<br />
\w[nCV]<br />
Delay for n or nCV milliseconds. Actual delay time will be<br />
approximately 2ms or 2 character times, whichever is longer.<br />
(Erase receive \e Clear all previously received characters from the receive buffer<br />
buffer)<br />
Fixed text string \m[text] or<br />
\m[n$]<br />
Read and discard incoming characters until the exact string text (or<br />
the text in n$) is seen, then discard the matching string<br />
Numeric data %{width}type{[nCV]}<br />
Interpret the received data according to the specified numeric<br />
format and store the result into nCV. If the [nCV] is not specified,<br />
e.g. %d[2CV], %9f<br />
the result will be returned as the return value of the channel. Note<br />
that { } signifies "optional"<br />
String data %{width}type[n$]<br />
Interpret the received data according to the specified string format<br />
and store the result into n$<br />
Data to skip<br />
One of a set of<br />
strings<br />
e.g. %6s[5$]<br />
%*{width}type<br />
e.g. %*6s, %*f<br />
%{width}type['str1','str2',...,nCV{=m}]<br />
e.g. %9s['goose','moose',23CV=2]<br />
Interpret the received data according to the specified numeric/string<br />
format but do not store the result. In other words, skip over this data<br />
value.<br />
If the incoming string matches str1 then set<br />
nCV=0<br />
If the incoming string matches str2 then set<br />
nCV=1<br />
If the incoming string matches str3 then set<br />
nCV=2 (etc.)<br />
If a default value (=m) is specified and the<br />
incoming string matches none of the strings<br />
then set nCV=m<br />
Numeric and String Formats<br />
These tables describe the possible values for type – that is, the different ways in which the incoming string of characters can<br />
be interpreted.<br />
Type Description Example, assumes input data string is 123.456<br />
f floating point 1SERIAL("%f[1CV]") 1CV = 123.456 (nothing left in receive buffer)<br />
d decimal integer 1SERIAL("%d[1CV]") 1CV = 123 (.456 left in receive buffer)<br />
x hexadecimal integer 1SERIAL("%x[1CV]") 1CV = 291 (.456 left in receive buffer)<br />
o octal integer 1SERIAL("%o[1CV]") 1CV = 73 (.456 left in receive buffer)<br />
i decimal/hex/octal integer 1SERIAL("%i[1CV]") 1CV = 123 (.456 left in receive buffer)<br />
c character 1SERIAL("%c[1CV]") 1CV = 49 (23.456 left in receive buffer)<br />
b binary (no conversion) 1SERIAL("%b[1CV]") 1CV = 49 (23.456 left in receive buffer)<br />
UM-0085-B2 <strong>DT80</strong> <strong>Series</strong> User’s <strong>Manual</strong> Page 280
Type Description Example, assumes input data string is aaba cxyab<br />
s string ( 1SERIAL("%s[1$]") 1$ = "aaba cxyab" (nothing left in receive buffer)<br />
terminated)<br />
S<br />
string (whitespace 1SERIAL("%S[1$]") 1$ = "aaba" (cxyab left in receive buffer)<br />
terminated)<br />
[chars] string containing 1SERIAL("%[abc ][1$]") 1$ = "aaba c" (xyab left in receive buffer)<br />
only specified<br />
chars<br />
[~chars] string not<br />
containing<br />
specified chars<br />
1SERIAL("%[~bc][1$]") 1$ = "aa" (ba cxyab left in receive buffer)<br />
<br />
<br />
<br />
<br />
Conversions which may be terminated by whitespace(P336) (%f, %d, %x, %o, %i and %S) will skip over any leading<br />
whitespace, e.g. %d will match input strings of "123", " 123" and " \013\013\010 123".<br />
The %i conversion assumes that the value is hexadecimal if it starts with 0x or 0X, octal if it starts with 0 (zero),<br />
otherwise decimal.<br />
The %f conversion will accept numbers in standard (e.g. –12.39904) or exponential (e.g. –1.239904e01) format.<br />
The %c and %b conversions treat the characters as 8-bit binary values. So the character "1" (ASCII 49) will result in<br />
the value 49 being stored in the CV.<br />
Return Value<br />
The return value of a SERIAL channel may be either a status code or a data value:<br />
If all numeric input conversions in the control string include a [nCV] specification then the SERIAL channel will<br />
return the status code – 0 (success), 20 (receive timeout), 21 (transmit timeout), 5 (CTS timeout) or 29 (scan error);<br />
see Serial Data Transmission and Reception (P276)<br />
If one or more numeric input conversions in the control string do not include a [nCV] specification then the SERIAL<br />
channel will return the result of the rightmost conversion. If any part of the channel's evaluation fail (i.e. the channel's<br />
status code is non zero) then the returned value will be the special "Not Yet Set" error value.<br />
The following example will attempt to read a floating point value from the serial sensor and return the value read<br />
RA2+E 1SERIAL("%f")<br />
1SERIAL 27.9<br />
1SERIAL 31.2<br />
dataTaker 80 E89 – Serial sensor receive time out<br />
1SERIAL NotYetSet<br />
Compare this with the following example, which instead assigns the value to a CV:<br />
RA2+E 1SERIAL("%f[1CV]") 1CV<br />
1SERIAL 0 State<br />
1CV 27.9<br />
1SERIAL 0 State<br />
1CV 31.2<br />
dataTaker 80 E89 – Serial sensor receive time out<br />
1SERIAL 20 State<br />
1CV 31.2<br />
For many applications the form where the SERIAL channel returns the actual value scanned provides a simpler solution.<br />
Width<br />
The optional width value specifies the maximum number of characters to read for conversion. For example, with the above<br />
example's input data: 1SERIAL("%2d[1CV]") will result in 1CV = 12 (3.456 left in receive buffer). The default for most<br />
of the conversions (except %c and %b) is to keep reading characters until an invalid character is read. (That's why the integer<br />
conversions in the above example stop when the "." character is seen.)<br />
The default width value for %c and %b is 1; with this setting the two conversions behave identically. However, if width is<br />
specified then:<br />
for %c, only the last character is read; preceding characters are skipped<br />
<br />
for %b, the specified number of characters are treated as a multi-byte binary word, in "big-endian" (most significant<br />
byte first) format. Note that due to the limited precision of CVs, the maximum practical width value is 3 (24 bits).<br />
UM-0085-B2 <strong>DT80</strong> <strong>Series</strong> User’s <strong>Manual</strong> Page 281
For example:<br />
Example assumes input data is 123.456<br />
1SERIAL("%1c[1CV]") 1CV = 49 (23.456 left in receive buffer)<br />
1SERIAL("%2c[1CV]") 1CV = 50 (3.456 left in receive buffer)<br />
1SERIAL("%3c[1CV]") 1CV = 51 (.456 left in receive buffer)<br />
1SERIAL("%1b[1CV]") 1CV = 49 (23.456 left in receive buffer)<br />
1SERIAL("%2b[1CV]") 1CV = 12594 (49*256 + 50) (3.456 left in receive buffer)<br />
1SERIAL("%3b[1CV]") 1CV = 3223859 (49*65536 + 50*256 + 51) (.456 left in receive buffer)<br />
Important If width is not specified then the incoming data must be terminated by a non-matching character, otherwise the<br />
serial channel will continue to wait for more characters to be read, eventually returning a timeout.<br />
For example, if the control string is 1SERIAL("%d"):<br />
Input data Result<br />
"abc" Scan Error (return NotYetSet; abc left in receive buffer)<br />
"123" Receive Timeout (return NotYetSet, nothing left in receive buffer)<br />
"123 " return 123 (" " left in receive buffer)<br />
"123abc" return 123 (abc left in receive buffer)<br />
Control String – Example<br />
The control string in the Serial Channel command<br />
1SERIAL("\e{WN\013}%d[1CV],%f[2CV]{C\013}\w[2000]")<br />
specifies the following output and input actions for supervising electronic weighing scales connected to the serial sensor port<br />
of a <strong>DT80</strong>:<br />
Input/Output action<br />
Description<br />
\e An input action.<br />
\e erases any extraneous characters that may have been sent by the scales at<br />
some earlier time.<br />
{WN\013}<br />
An output action.<br />
Sends the "Weigh Now" command (WN) to the scales. The WN command is<br />
terminated by a carriage return (\013). (See your serial device’s manual for<br />
details of its command set.)<br />
%d[1CV],%f[2CV]<br />
Three input actions.<br />
These scales return two comma-separated values: a batch number as an integer,<br />
and the weight as a floating-point value, followed by a carriage return.<br />
%d[1CV] will interpret the first returned value as an integer batch number,<br />
and assign this to 1CV.<br />
Skip the comma in the returned data string (,).<br />
%f[2CV] will interpret the second returned value as a floating-point weight<br />
in kilograms, and assign this to 2CV.<br />
{C\013}<br />
An output action.<br />
These scales also have a Clear command (C), which instructs the scales to clear<br />
ready for the next weighing operation.. This output action sends the Clear<br />
command to the scales. The Clear command is terminated by a carriage return<br />
(\013).<br />
\w[2000]<br />
An input action.<br />
These scales do not respond to commands for 2s after a Clear operation. The<br />
\w[2000] action ensures that at least this time elapses following a Clear.<br />
Important The DeTransfer program, which is often used to supervise the <strong>DT80</strong>, has a number of special commands that<br />
begin with a \ (backslash) character. These are interpreted by DeTransfer and not sent to the <strong>DT80</strong>. In order to send a \<br />
character from DeTransfer, you need to enter a double backslash (\\). For example, the above example would be entered<br />
into DeTransfer as follows:<br />
1SERIAL("\\e{WN\\013}%d[1CV],%f[2CV]{C\\013}\\w[2000]")<br />
This rule applies to DeTransfer only; it does not apply to the "Text" window in DeLogger, for example.<br />
UM-0085-B2 <strong>DT80</strong> <strong>Series</strong> User’s <strong>Manual</strong> Page 282
Schedules<br />
Executing Serial Channel Commands in Schedules<br />
Like any other channel type, Serial Channel commands can be placed into scan schedules. For example<br />
BEGIN<br />
PS=RS485,9600<br />
RA1M 1SERIAL("\e{01READ^M}%6f")<br />
RB2-E 1SERIAL("\e{02READ^M}%12s[1$]",W) 1$<br />
LOGON<br />
END<br />
This example will, once a minute, request then read a floating point value from device #1 on the multi-drop RS485 link<br />
connected to the serial channel. Also, every time digital input 2D goes low, the serial channel will request then read a string<br />
value from device #2.<br />
Notice that in the first schedule the scanned floating point value is the return value of the SERIAL channel, which will then<br />
be logged and returned. In the second schedule, the scanned string is assigned to string variable 1$. The SERIAL channel<br />
will then return a status code – which in this example we are not concerned about so the W channel option is used to make<br />
the channel a working channel (not logged or returned).<br />
Serial commands can also be used in the "immediate" schedule, i.e. executed immediately after they are entered. For<br />
example, sending<br />
2SERIAL("{hello^M^J}")<br />
will immediately transmit the indicated string on the host port (assuming it has been configured for serial channel operation).<br />
Triggering Schedules<br />
Sometimes the serial device connected to the Serial Channel returns data unsolicited, and so the program must be capable<br />
of responding to the device at any time. As discussed in Trigger on External Event (P46), any schedule (Ra) can be defined<br />
to trigger on the receipt of the specified string on the Serial Channel as follows:<br />
RanSERIAL"text"<br />
where a is the schedule identifier (A-K, X) and n is the serial channel port number (1 or 2)<br />
The text string may also be blank:<br />
RanSERIAL""<br />
in which case any character received into the Serial Channel produces a trigger.<br />
Whenever the Serial Channel produces a trigger by either of these methods, the receive buffer will contain the string that<br />
caused the trigger, ready to be processed by an nSERIAL command.<br />
In the following example a serial device transmits whitespace separated temperature readings at irregular intervals. The<br />
following job will read and log readings when they are received:<br />
BEGIN<br />
RA1SERIAL"" 1SERIAL("%f","SS Temp~degC")<br />
LOGON<br />
END<br />
Note that the 1SERIAL"text" schedule trigger does not consume (i.e. remove from the receive buffer) any received<br />
characters that did not match text. This means that there may be other characters in the receive buffer preceding the text<br />
string. An input action should therefore normally be included to discard any characters that do not match text. For example:<br />
RA1SERIAL"abc:" 1SERIAL("\m[abc:]%f")<br />
which will read and discard characters until the exact string abc: is seen.<br />
Re-triggering<br />
The <strong>DT80</strong> checks any serial schedule triggers:<br />
on receipt of data on the serial sensor port, and<br />
following execution of any schedule containing an nSERIAL channel.<br />
This means that if multiple messages are received in quick succession then all will be processed in turn. For example,<br />
suppose the following schedule is entered:<br />
RA1SERIAL"x:" 1SERIAL("\m[x:]%d")<br />
and then the following serial data string is received:<br />
x:1298 x:1265 x:0772<br />
Receipt of this data will trigger the A schedule, and the 1SERIAL channel will then parse the first value, leaving " x:1265<br />
x:0772 " in the receive buffer. This string still matches the schedule trigger (i.e. it contains "x:"), so the A schedule will be<br />
immediately re-triggered.<br />
UM-0085-B2 <strong>DT80</strong> <strong>Series</strong> User’s <strong>Manual</strong> Page 283
Serial Sensor Direct Mode<br />
It is sometimes necessary to interactively set up or test a serial sensor device. This can be done without disconnecting the<br />
device from the serial port using the <strong>DT80</strong>'s serial sensor direct mode.<br />
The following command:<br />
SSDIRECT n<br />
causes the communications port on which the command was sent (host port, USB, TCP/IP) to enter SSDIRECT mode.<br />
Whilst in this mode:<br />
all subsequent commands that you enter on that port will not be processed by the <strong>DT80</strong> and will instead be transmitted<br />
out the specified serial channel port – the serial sensor port if n = 1 (which is the default), or the host port if n = 2, or the<br />
USB port if n = 3. The one exception is ENDSSDIRECT, which is used to cancel SSDIRECT mode.<br />
<br />
<br />
all data received from the specified serial channel port will be returned to the host PC via the comms port that is in<br />
SSDIRECT mode.<br />
all transmit data (i.e. output actions) generated by the evaluation of nSERIAL channels will be discarded.<br />
all normal output data from the logger (e.g. real time data, status and error messages, etc) will not be returned to the<br />
SSDIRECT-mode comms port. It will still be returned to any connected TCP/IP ports (see Broadcasting Data (P159)),<br />
or to another comms port if you make it the active comms port by sending a command to it.<br />
Serial sensor direct mode remains in effect until the ENDSSDIRECT command is received. The ENDSSDIRECT command<br />
may be issued on the SSDIRECT-mode comms port, or on any other comms port.<br />
Only one communications port can be in SSDIRECT mode at any one time. So if you send SSDIRECT via the USB port<br />
(thereby setting that port to SSDIRECT mode), then send another SSDIRECT command via a TCP/IP (Ethernet)<br />
connection, then an error message will be returned and the second SSDIRECT command will be ignored. In order to<br />
establish SSDIRECT mode on the TCP/IP connection it would be necessary to first send the ENDSSDIRECT command.<br />
Line Termination<br />
By default, each line of text entered in SSDIRECT mode will be terminated by a single CR character when sent to the<br />
specified serial channel port. This behaviour can be changed by specifying a second parameter in the SSDIRECT<br />
command, which indicates the terminating string to add to the end of each line. For example:<br />
SSDIRECT 1 "^M" – terminate each line with a CR character (default)<br />
SSDIRECT 1 "^M^J" – terminate each line with CR LF<br />
SSDIRECT 1 "" – do not add any termination<br />
Example<br />
For example, if a dataTaker CANgate (CAN bus to ASCII gateway) was connected to the serial sensor port then the following<br />
dialog would be possible:<br />
1V 9.22 mV<br />
1V 10.09 mV<br />
SSDIRECT<br />
SSDIRECT mode active. Issue ENDSSDIRECT to quit<br />
VERSION<br />
dataTaker CANgate Version 1.24<br />
SNOOPJ 2<br />
EXT 0CF00400 FE7D7D000000FFFF PGN:61444 PRI:3 SA:0 DA:0<br />
EXT 18FEF000 FFFFFF0000F0CCFF PGN:65264 PRI:6 SA:0 DA:0<br />
EXT 18F0000F C07DFFFF0FFFFFFF PGN:61440 PRI:6 SA:15 DA:0<br />
END SNOOP<br />
ENDSSDIRECT<br />
SSDIRECT mode deactivated.<br />
1V 7.12 mV<br />
In this example, the regular real time data returns for channel 1V are suspended when SSDIRECT is entered. The next two<br />
commands that were entered (VERSION and SNOOPJ) are CANgate commands, not <strong>DT80</strong> commands. The <strong>DT80</strong> passes<br />
them directly through to the CANgate. In each case, the CANgate returns some information, which the <strong>DT80</strong> then passes on<br />
to the host computer without modification.<br />
When ENDSSDIRECT is entered the <strong>DT80</strong> returns to normal operation and the real time data returns resume.<br />
Serial Interface Power Control<br />
If the current job contains no 1SERIAL commands then the serial channel interface is automatically switched off, which<br />
saves a small amount of power. If the current job does contain 1SERIAL commands then serial channel will be continuously<br />
powered.<br />
UM-0085-B2 <strong>DT80</strong> <strong>Series</strong> User’s <strong>Manual</strong> Page 284
The 1SSPORT channel type allows you to turn power to the interface on and off under program control e.g.<br />
RA1H 1SSPORT=1 1SERIAL("\w[1000]{X}%d") 1SSPORT=0<br />
will, once an hour, switch on the serial channel, poll and read an integer from a serial device, then switch off the serial<br />
channel.<br />
Serial Channel Debugging Tools<br />
P56 Debugging<br />
Setting P56=1 will cause the <strong>DT80</strong> to output a number of diagnostic messages, which are useful when setting up and<br />
testing a serial channel application – or trying to figure out why it doesn't appear to be working as expected.<br />
The following information will be returned:<br />
each string of output actions, and each individual input action, as they are processed<br />
(indented 1 space) actual transmitted data and other transmit operations e.g. breaks, delays as they are performed<br />
(indented 2 spaces) the state of the receive buffer each time something is added (i.e. received), each time something<br />
is removed (i.e. an input action matches) and the initial state – these are denoted RxBuf+, RxBuf- and RxBuf=<br />
respectively – also any schedules that are triggered by received characters. The number after the +, - or = character<br />
indicates the number of characters in the buffer.<br />
Using the weighing machine example discussed earlier:<br />
P56=1<br />
RA1-E 1SERIAL("\e{WN\013}%d[1CV],%f[2CV]{C\013}\w[2000]")<br />
1SERIAL: RxBuf=0[]<br />
1SERIAL: InputAction: "\e"<br />
1SERIAL: OutputActions: "WN\013"<br />
1SERIAL: Tx [WN\013]<br />
1SERIAL: InputAction: "%d[1CV]"<br />
1SERIAL: RxBuf+12[0242,1.988\013\010]<br />
1SERIAL: RxBuf-8[,1.988\013\010]<br />
1SERIAL: InputAction: ","<br />
1SERIAL: RxBuf-7[1.988\013\010]<br />
1SERIAL: InputAction: "%f[2CV]"<br />
1SERIAL: RxBuf-2[\013\010]<br />
1SERIAL: OutputActions: "C\013"<br />
1SERIAL: Tx [C\013]<br />
1SERIAL: InputAction: "\w[2000]"<br />
1SERIAL: Wait (2000ms)<br />
1SERIAL 0 State<br />
1SERIAL: RxBuf=2[\013\010]<br />
1SERIAL: InputAction: "\e"<br />
1SERIAL: RxBuf-0[]<br />
1SERIAL: OutputActions: "WN\013"<br />
1SERIAL: Tx [WN\013]<br />
(etc.)<br />
In this case you can see that the weighing machine returned the batch number, weight and terminating CR/LF in one<br />
12-character burst (RxBuf+12[0242,1.988\013\010]). The various input actions then dissected this string, removing<br />
first the batch number, then the comma, then the weight. At the end of the process the CR/LF was still in the buffer, and it<br />
was still there when the next measurement cycle began (RxBuf=2[\013\010]). It was then cleared by the \e input action.<br />
Serial Loopback<br />
A useful technique for testing your parsing commands is to implement a serial loopback in the RS-232 mode. Simply connect<br />
the Tx/Z and Rx/A terminals together, and then send strings out of the Serial Channel by output actions. Because of the<br />
loopback, these strings appear in the receive buffer, which can then be parsed by your input actions. The strings you should<br />
send should contain data formatted in the same way that the real sensor would. In this way you are simulating the sensor for<br />
the purposes of verifying that your program can correctly interpret what it needs.<br />
For example, if a loopback connection is used, the commands<br />
1SERIAL("\e{ABCD,1234\013}%4s[1$],%4d[1CV]") 1$ 1CV<br />
should store ABCD into 1$ and 1234 into 1CV.<br />
Serial Channel Examples<br />
Reading Variable Width ASCII<br />
In this example a sensor with an RS232 interface will, in response to a M followed by a CR, transmit an integer status code<br />
(which we ignore), followed by four whitespace-separated floating point pressure values. This job reads and logs these<br />
values every 5 minutes:<br />
UM-0085-B2 <strong>DT80</strong> <strong>Series</strong> User’s <strong>Manual</strong> Page 285
BEGIN"LUCY"<br />
PS=RS232,9600<br />
RA5M<br />
1SERIAL("{\eM^M}%*d%f[1CV]%f[2CV]%f[3CV]%f[4CV]",W)<br />
1..4CV("~kPa")<br />
LOGON<br />
END<br />
Reading Fixed Width ASCII<br />
In this case a simple serial sensor continuously transmits a stream of records which consist of an A character followed by<br />
four 4-digit fixed point (2 decimal place) temperature values (2209 represents 22.09, for example).<br />
This job samples the stream every 30 seconds and logs the values it reads.<br />
BEGIN"SPOT"<br />
PS=RS232,1200,7,E,1<br />
RA30S<br />
1SERIAL("\eA%4d[1CV]%4d[2CV]%4d[3CV]%4d[4CV]",W)<br />
1..4CV(.01,"~degC",FF2)<br />
LOGON<br />
END<br />
Notice that the receive buffer is cleared at the start of the control string. The 1SERIAL channel will therefore wait until the<br />
next update from the sensor. An alternative strategy would be clear the buffer at the end, in which case the 1SERIAL<br />
channel would immediately get what it needs from the buffer. However the data it reads will be the first record in the buffer<br />
and would therefore be up to 30s old.<br />
Reading Binary Data<br />
In this example an even more simple sensor outputs 6 bytes of data in response to a digital signal going low. These are to be<br />
interpreted as two binary values. The first is a 16-bit integer sequence number, in big endian format (most significant byte<br />
first). The second value is a 32-bit voltage measurement, scaled such that 0x00000000 represents -17.0V and 0xFFFFFFFF<br />
represents +17.0V. For historical reasons, this value happens to be returned in little-endian (least significant byte first)<br />
format.<br />
This job triggers a reading (by pulsing the 1D output low) every 5 seconds and reads and logs the received values.<br />
BEGIN"RAMBUTAN"<br />
PS=RS232,115200<br />
S1=-17,17,0,4294967296"V"<br />
RA5S<br />
1DSO(100,R)=0<br />
1CV(W)=-1<br />
1SERIAL("%2b[1CV]%b[5CV]%b[6CV]%b[7CV]%b[8CV]",W)<br />
1CV("Seq")<br />
2CV(S1)=8CV*16777216+7CV*65536+6CV*256+5CV<br />
LOGON<br />
END<br />
Note the following points about this job:<br />
In this case the sequence number can be read as a single binary number, using %2b, but the measured value must be<br />
read byte by byte and reassembled into a single value.<br />
A span (S1) is used to scale the reading into the correct range.<br />
1CV is set to an error value (-1) before each attempt to read the serial channel. If the attempt fails (e.g. no data is<br />
forthcoming from the device) then 1CV will be unchanged, so the value -1 will be logged for the sequence number.<br />
This makes it easy to identify the reading as invalid.<br />
Note CVs can only precisely store integers with absolute value less than 16,777,216 (24 bits) – above that they will be<br />
rounded. In the above example this is not a problem because the value is scaled and rounded anyway.<br />
If, however, you need to recover all 32 bits exactly (for example if they represented 32 separate logic states) then you should<br />
read them using two 16 bit conversions and log each half separately, e.g.:<br />
BEGIN"WHISTLE"<br />
RA1+E<br />
1..2CV(W)=-1<br />
1SERIAL("%2b[1CV]%2b[2CV]",W)<br />
1CV("MS 16 bits") 2CV("LS 16 bits")<br />
LOGON<br />
END<br />
(This example assumes the data word is in big endian format.)<br />
Output to Serial Printer/Display<br />
The serial channel can also be used to output selected channels to a serial printer or display. This job will measure two<br />
UM-0085-B2 <strong>DT80</strong> <strong>Series</strong> User’s <strong>Manual</strong> Page 286
voltages once a minute and print the values to a serial printer:<br />
BEGIN"SOUP"<br />
RA1M<br />
1V(W,=1CV) 2V(W,=2CV)<br />
1SERIAL("{%9.3f[1CV] mV %9.3f[2CV] mV^M^J}",W)<br />
END<br />
Output to Another <strong>DT80</strong><br />
You can also connect a the serial channel to the RS232 host port on a second <strong>DT80</strong> (or other dataTaker model).<br />
The following job will send commands to a second logger to read two immediate channels, then interpret its fixed format<br />
response, which will be similar to:<br />
D,000043,"",2006/02/13,18:16:54,0.191528,0;*,0,22.2172,-12.2002;0063;F2F3<br />
BEGIN"LAMBDA"<br />
PS=RS232,57600<br />
RA30S<br />
1..2CV(W)=-999<br />
1SERIAL("\e{/H/R 1*TK 1+TK^M}\m[,0;*,0,]%f[1CV],%f[2CV]",W)<br />
1..2CV("~degC")<br />
LOGON<br />
END<br />
In this case we first send /H/R to ensure that the other logger is in fixed format mode and has data returns enabled, then the<br />
three immediate channel definitions. When parsing the response, we look for the exact string ",0;*,0," followed<br />
immediately by two comma separated floating point values.<br />
Schedule Triggering (1)<br />
In this example a barcode reader transmits a packet consisting of an STX character (ASCII 01) followed by a 7 digit ASCII<br />
integer. Once a valid barcode packet is received, the job will measure three voltages and log these, along with the barcode.<br />
BEGIN"ZAMBESI"<br />
PS=RS232,9600<br />
RA1SERIAL"\001"<br />
1SERIAL("\001%7d") 'read and log barcode<br />
1..3V<br />
'log voltages<br />
LOGON<br />
END<br />
Schedule Triggering (2)<br />
In this example a GPS unit produces an NMEA 183 data stream, e.g.:<br />
$GPGLL,4250.5589,S,14718.5084,E,092204.999,A*2D<br />
This job will read and log the latitude degrees (positive for north), latitude minutes, longitude degrees (positive for east) and<br />
longitude minutes. Each read is triggered by the $GPGLL header at the start of each transmission.<br />
BEGIN<br />
PS=RS232,38400<br />
RA1SERIAL"$GPGLL"<br />
1SERIAL(",%2d[1CV]%f[2CV],%c[3CV],%3d[4CV]%f[5CV],%c[6CV]",2,W)<br />
IF(3CV>
Modbus Channel<br />
Not available on DT81/82E<br />
About Modbus<br />
Modbus is a simple communications protocol which is widely used in SCADA (supervisory control and data acquisition)<br />
systems. Modbus provides an efficient and standardised way to transport digital states and data values between a remote<br />
terminal unit (RTU) or programmable logic controller (PLC) and a supervisory computer.<br />
Servers and Clients<br />
In a Modbus-based SCADA system, each RTU/PLC acts as a Modbus server, or slave. These servers/slaves listen for and<br />
reply to requests from a Modbus client, or master system.<br />
As described in Modbus Interface (P149), the <strong>DT80</strong> is capable of operating as a Modbus server; that is, it can act like an RTU<br />
or PLC device, and make data available when polled by a client system.<br />
The <strong>DT80</strong> can also operate as a Modbus client, where it can read data from Modbus sensors in the same way that it reads<br />
data from SDI-12 or serial sensors.<br />
The remainder of this section describes the operation of the <strong>DT80</strong> as a Modbus client.<br />
The MODBUS Channel Type<br />
To read data from a Modbus device (or write control information to it), the MODBUS channel type is used. Each time a<br />
MODBUS channel is evaluated, the <strong>DT80</strong> will send a Modbus request to the device, retrieve the response, extract the<br />
required data and return it so that it can be displayed or logged in the usual way.<br />
Modbus can operate using a broad range of communications media. These fall into two main categories:<br />
a serial connection, typically RS232, RS422 or RS485<br />
a TCP/IP network, which can use a variety of physical link types e.g. Ethernet, wireless, fibre-optic, serial (PPP)<br />
As with the SERIAL and SDI12 channel types, for Modbus channels the channel number refers to the physical <strong>DT80</strong> port<br />
to which the sensor is wired. That is:<br />
1MODBUS is used to read sensors connected to the serial sensor port<br />
2MODBUS is used to read sensors connected to the host RS232 port<br />
3MODBUS is used to read sensors connected to the USB port<br />
4MODBUS is used to read sensors connected to a TCP/IP network.<br />
Connecting Serial Modbus Sensors<br />
A serial Modbus network has one client (master) system – in this case, the <strong>DT80</strong> – connected to one or more server (slave)<br />
devices. Serial networks using the RS485 or RS422 standards support multi-drop, i.e. multiple slaves connected to one<br />
master. RS232 or USB can also be used for point-to-point connections (single master and single slave).<br />
Slave devices on a serial Modbus network are identified by an 8-bit slave address (1-247). Every slave device on a<br />
particular serial network must have a unique address. (Slave addresses are not required on a TCP/IP Modbus network,<br />
because the slaves are identified by their IP address.)<br />
The <strong>DT80</strong> can be connected to a serial Modbus network using either the serial sensor port, the host RS232 port, or the USB<br />
port.<br />
Note that if a particular serial port is set up to read Modbus sensors then that port must be dedicated to that function. It<br />
cannot also be used for controlling generic serial devices or sending commands to the logger's command interface.<br />
Serial Sensor Port<br />
The serial sensor port is the one most commonly used for connecting serial Modbus sensors. It supports RS232, RS422 and<br />
RS485 connections. Note however that the serial sensor port is not available on the DT81/82E.<br />
To configure the serial sensor port for Modbus master operation, set the following profile:<br />
PROFILE SERSEN_PORT FUNCTION=MODBUS_MASTER<br />
If you try to define a 1MODBUS channel without setting this profile then an error message will be returned.<br />
For more details on setting up the port and the possible wiring configurations, see Serial Sensor Port (P169).<br />
Host RS232 Port<br />
The host RS232 port can also be used for controlling a Modbus sensor. This is configured in a similar way:<br />
PROFILE HOST_PORT FUNCTION=MODBUS_MASTER<br />
UM-0085-B2 <strong>DT80</strong> <strong>Series</strong> User’s <strong>Manual</strong> Page 288
Note that because RS232 is a point-to-point connection, only one Modbus device can be connected to this port.<br />
As with the serial sensor port, you may need to change the configured baud rate or other settings. For more details on setting<br />
up the port and the possible wiring configurations, see Host RS-232 Port (P168).<br />
USB Port<br />
The USB port may also be used for polling a Modbus sensor. Such a "sensor" would generally be a PC-based system, as a<br />
stand-alone sensor would most likely have the wrong type of USB interface and would not be able to connect to the <strong>DT80</strong>'s<br />
USB port.<br />
To configure the <strong>DT80</strong> USB port for Modbus master operation use:<br />
PROFILE USB_PORT FUNCTION=MODBUS_MASTER<br />
For more details, see USB Port (P160).<br />
Connecting Network Modbus Sensors<br />
A network Modbus sensor communicates with a client system such as the <strong>DT80</strong> using a TCP/IP network. This network may<br />
use a variety of different physical link types, including Ethernet, serial links, wireless and optical fibre. Normally, the <strong>DT80</strong>'s<br />
Ethernet port is used to connect to a TCP/IP network, and in most cases the sensor will also connect using an Ethernet port.<br />
In order to communicate over a TCP/IP network, all devices connected to that network are required to have a unique IP<br />
address. So in order for the <strong>DT80</strong> to be able to poll network Modbus sensors, the <strong>DT80</strong> must have an IP address and so<br />
must each sensor.<br />
See Ethernet Communications (P177) for more details about IP addresses and how to assign one to the <strong>DT80</strong>.<br />
There are many different ways in which network Modbus sensors can be connected to the <strong>DT80</strong>. The simplest possible<br />
network is a single cross-over cable between the sensor and the <strong>DT80</strong>'s Ethernet port.<br />
Sensor<br />
server / slave<br />
client / master<br />
<strong>DT80</strong><br />
Ethernet<br />
Port<br />
Ethernet<br />
Port<br />
10BaseT cross-over cable<br />
Figure 127: Direct Ethernet connection between <strong>DT80</strong> and a network Modbus sensor<br />
More typically, the <strong>DT80</strong>'s Ethernet port would be connected to an existing Ethernet network, which may have several<br />
Modbus devices attached. There may even be devices connected via the Internet.<br />
Sensor<br />
server /<br />
slave<br />
Sensor<br />
server /<br />
slave<br />
<strong>DT80</strong> #2<br />
server /<br />
slave<br />
Ethernet network<br />
<strong>DT80</strong> #1 client /<br />
master<br />
HMI client /<br />
master<br />
Internet<br />
gateway<br />
Internet<br />
Sensor server /<br />
slave<br />
Figure 128: One possible Modbus network configuration<br />
For example, Figure 128 shows one possible network configuration. In this example, three network Modbus sensor devices<br />
are used. Two are connected to the local Ethernet network, and one is remote, accessed via the Internet. <strong>DT80</strong> #2 is also set<br />
up as a network Modbus sensor, as described in Modbus Interface (P149). All of these devices operate as Modbus server, or<br />
slave, devices.<br />
<strong>DT80</strong> #1 is set up as a Modbus client, or master, device. It has no physical sensors of its own connected (although it could<br />
have); its job here is to retrieve measurements from the four slave devices and log them. There also happens to be a Modbus<br />
HMI (Human-Machine Interface) device connected. This is also a client/master device, which, like <strong>DT80</strong> #1, regularly scans<br />
the sensors. It then presents this data as a mimic display. Unlike a serial Modbus network, there is no problem having<br />
multiple master devices on a TCP/IP Modbus network.<br />
UM-0085-B2 <strong>DT80</strong> <strong>Series</strong> User’s <strong>Manual</strong> Page 289
There is no particular configuration required to enable the <strong>DT80</strong> to operate as a Modbus client. Unlike a serial Modbus<br />
network, with TCP/IP many different protocols can be used on the network at the same time so there is no need to set the<br />
"function" of the Ethernet port. However, some configuration of the <strong>DT80</strong> may be required in order for the <strong>DT80</strong> to be able to<br />
"see" the various Modbus server devices. Depending on how the network is set up, you may need to set:<br />
<br />
<br />
<br />
<br />
<strong>DT80</strong> IP address (PROFILE ETHERNET IP_ADDRESS=...)<br />
subnet mask (PROFILE ETHERNET SUBNET_MASK=...)<br />
gateway address (PROFILE ETHERNET GATEWAY=...)<br />
DNS server address (PROFILE NETWORK DNS_SERVER_1=...)<br />
You may also need to configure the Modbus sensor devices themselves.<br />
Reading Data from Modbus Devices<br />
Modbus Registers<br />
As described in The Modbus Data Model (P150), a Modbus slave device makes available the following resources:<br />
an array of single bit coils (digital outputs), numbered from 0:00001 to 0:65536.<br />
an array of single bit discrete inputs (digital inputs), numbered 1:00001 to 1:65536<br />
an array of 16-bit input registers, numbered 3:00001 to 3:65536<br />
an array of 16-bit output registers (a.k.a holding registers), numbered 4:00001 to 4:65536<br />
As can be seen, the first digit of the register number indicates the type of register – 0, 1, 3 or 4 for coil, discrete input, input<br />
register or output register respectively. This usage is, however, just a convention. This digit is not part of the actual address<br />
transmitted in the Modbus message.<br />
The documentation for the slave device will describe the function of each register. Bear in mind, however, that there are a<br />
few different ways of specifying Modbus register numbers:<br />
6-digit notation, as used in this manual. The first digit specifies the type of register, then there are five decimal digits to<br />
specify the register number (00001-65536). In this manual, a colon (:) is used to separate the register type and<br />
number. In reading Modbus device documentation you may also see an 'x' character used, or no separator at all.<br />
5-digit notation. This is similar except that only four digits are used for the register number (0001-9999)<br />
protocol address. This is a decimal number 0-65535 or hexadecimal 0000-FFFF. The type of register would need to<br />
be indicated in the text accompanying the register listing.<br />
For example, "3:00043", "3x00043", "30043" and "input register address 42 (002Ah)" are all different ways of referring to the<br />
same input register.<br />
Interpreting Register Values<br />
The Modbus protocol is just a way of transporting 16-bit (or 1-bit) values from A to B. It is up to the master and slave devices<br />
to agree on how these values are to be interpreted.<br />
By default, each register is normally taken to hold an independent signed integer value in the range -32768 to 32767. For<br />
many applications this range is quite adequate, especially if a fixed scaling factor is also applied (for example a device may<br />
return a temperature in tenths of a degree).<br />
However, various schemes have been developed in order to allow higher precision values to be returned via Modbus. These<br />
involve joining adjacent registers together to allow 32-bit values to be returned. These 32-bit quantities may then be<br />
interpreted as long integers or floating point values.<br />
The <strong>DT80</strong> provides options to support many of these methods. It should be stressed however that sending 32-bit quantities<br />
over Modbus is not standardised, so you will need to carefully match the <strong>DT80</strong>'s settings with the specific device that you<br />
wish to read.<br />
Using the MODBUS Channel<br />
To poll a Modbus slave device, you use the nMODBUS channel type. As mentioned above, the n specifies the physical <strong>DT80</strong><br />
port: 1, 2 or 3 for a serial Modbus connection via the serial sensor port, host RS232 port or USB port respectively, or 4 for<br />
network Modbus over TCP/IP (generally using the Ethernet port).<br />
To read a single value, you simply define a MODBUS channel and specify appropriate channel options, as described below.<br />
This definition is placed in a schedule, as you would for any other <strong>DT80</strong> channel type.<br />
When the channel is executed, the <strong>DT80</strong> will send a "read" request to the specified device, wait for its response, do any<br />
requested scaling or statistics on the returned value, then log or return the final reading.<br />
To write a value, an expression is specified, as you would when setting a channel variable. For example,<br />
1MODBUS(...)=1CV*2<br />
will set the required register on the required Modbus slave device (as specified in the channel options) to the value of 1CV<br />
multiplied by 2.<br />
UM-0085-B2 <strong>DT80</strong> <strong>Series</strong> User’s <strong>Manual</strong> Page 290
Note If the value being written is outside the range of the target Modbus register then it will be set to the registers minimum<br />
or maximum value, e.g.<br />
4MODBUS(AD"10.23.0.4",R4:7)=239999<br />
4MODBUS 65535<br />
MODBUS Channel Options<br />
Channel options are used to specify<br />
which Modbus sensor to access, i.e. its network address<br />
which register(s) to access<br />
how to interpret the register value (signed or unsigned 16 or 32 bit)<br />
how to scale the result into the correct engineering units<br />
communications options such as timeouts<br />
Of these, the first two (sensor address and register number) will normally always need to be specified. The remainder are<br />
optional and the default values will be appropriate for many applications.<br />
Address (AD)<br />
For serial Modbus (1/2/3MODBUS), the slave device address is specified using the ADn option, where n is the numeric slave<br />
address (1-247). Address 0 can also be used, which will broadcast a write command to all connected slave devices. Slave<br />
devices never reply to a broadcast request.<br />
For network Modbus (4MODBUS), use AD"ip-addr", where ip-addr is either a numeric address (eg. 192.168.11.160) or<br />
a symbolic address (e.g. myplc.llamas.org). The address can optionally be suffixed by a port number e.g.<br />
AD"192.168.1.2:5555" if the default port (502) is not suitable.<br />
Note that symbolic addresses are resolved when the channel is defined (i.e. when the program is started), not when the<br />
channel is evaluated. Using slave devices with dynamically allocated IP addresses are therefore not recommended, as an<br />
error will result if the IP address changes during operation.<br />
Register (R)<br />
To specify the register number to read/write, use the Rtype:num channel option. That is, the register number is specified<br />
using the "6-digit" notation with a colon (:) separator between the register type (0/1/3/4) and the register number (1-65536).<br />
For example, R3:27 specifies the device's 27 th input register. (At the protocol level, the <strong>DT80</strong> would send a "read register"<br />
command and specify address 26, or 001A.)<br />
A complete channel definition would therefore be something like:<br />
1MODBUS(AD2,R3:27)<br />
which will read register 1:00027 (input register #27) on the device with address 2 connected to the <strong>DT80</strong> serial sensor port.<br />
For 1-bit Modbus registers, i.e. coils (type 0) and discrete inputs (type 1), it is also possible to read/write up to 16 bits at once.<br />
This is done by adding an extra field onto the end of the R channel option to specify the number of consecutive 1-bit registers<br />
to pack into one value. The full syntax for this option is therefore Rtype:num:bits, where bits is a number between 1 and 16<br />
(default 1). The :bits part is only valid if a 1-bit register type is specified, i.e. type is 0 or 1.<br />
For example, R1:64 will read discrete input #64 and return its value (0 or 1). On the other hand, R1:64:8 will read<br />
discrete inputs #64 through #71 and return them as an 8-bit bitmask (0 to 255). Input #64 will be the least significant bit (bit<br />
0), input #71 will be the most significant bit (bit 7).<br />
Data Format (MBx, MEx)<br />
Modbus registers contain 16 bit integer values. By using the following channel options, however, pairs of consecutive<br />
registers can be interpreted as containing a 32 bit integer or floating point value.<br />
The following options specify how the <strong>DT80</strong> should interpret the contents of a Modbus register, or pair of registers:<br />
MBI - 16 bit signed integer (default)<br />
MBU - 16 bit unsigned integer<br />
MBL - 32 bit signed integer transferred using two consecutive 16 bit registers<br />
MBF - 32 bit IEEE-754 floating point value transferred using two consecutive 16 bit registers<br />
MBLE - 32 bit signed integer transferred using "Enron Modbus" protocol variant<br />
MBFE - 32 bit floating point value transferred using "Enron Modbus" protocol variant<br />
If MBL or MBF are selected, the following two options can be used to specify the order in which the two halves of the 32 bit<br />
value are stored:<br />
MES - "straight endian" (default): the first register of the pair contains the upper 16 bits<br />
MER - "reverse endian": the first register of the pair contains the lower 16 bits.<br />
UM-0085-B2 <strong>DT80</strong> <strong>Series</strong> User’s <strong>Manual</strong> Page 291
Communications (TO, RT)<br />
Two options control how communications errors or timeouts are handled.<br />
The TOn option specifies the timeout (n) in seconds for Modbus master requests (minimum=1, default=3)<br />
The RTn option specifies the number of retries to perform following a Modbus master error or timeout (default=0)<br />
Unit ID (MUID)<br />
The MUIDn option sets the Modbus "unit ID" field to n (0-255), and is only applicable for network connections (4MODBUS). It<br />
is typically used where the connected Modbus device is acting as a gateway to a serial Modbus network. In this case the unit<br />
ID represents the address of the device on the serial network that you wish to access.<br />
Scaling<br />
The standard <strong>DT80</strong> scaling facilities such as spans, polynomials and the channel factor can be used to scale the slave<br />
device's measurement units into the desired units for logging.<br />
For example, if a device register contains a temperature in tenths of a degree Celsius you could specify a scaling factor of 0.1<br />
using the channel factor, e.g.<br />
1MODBUS(AD1,R3:22,0.1,"Temp~degC")<br />
If the device instead measured in tenths of a degree Fahrenheit, a span could be used to apply a scaling factor and an offset:<br />
S1=0,100,320,2120"degC"<br />
1MODBUS(AD1,R3:22,S1)<br />
In this example the span (see Spans (Sn) (P58)) is specifying that we want to indicate a value of 0 (degrees C) when we read<br />
a value of 320 (tenths of a degree F) from the device, and a value of 100 when we read a value of 2120.<br />
The SRn channel option can be used to apply a span in reverse. So if the above device also contained a setpoint register<br />
(also in tenths of a degree F), you could use the following to set the setpoint to 22.5 °C:<br />
1MODBUS(AD1,R4:20,SR1)=22.5<br />
Block Transfers<br />
It is also possible to read a block of consecutive Modbus registers into a block of CVs. In this case the return value of the<br />
channel is the number of values transferred (which you would generally ignore by using the W option to make the channel a<br />
working channel). The actual data values are written to the specified CVs.<br />
To do a block read, specify a starting register number and a CV range. The extent of the CV range specifies the number of<br />
registers to read. For example<br />
1MODBUS(AD1,R3:21,=1..5CV)<br />
will read input registers #21-25 into 1CV-5CV.<br />
To write a block of CVs to a block of registers, a CV range can be specified where the expression would normally be, e.g.<br />
1MODBUS(AD1,R4:1)=51..60CV<br />
will set holding registers #1-10 to the values of 51CV-60CV.<br />
In the following slightly convoluted example, the current values of 1CV-50CV can be copied to 101CV-150CV in one<br />
operation by telling the <strong>DT80</strong> to "poll itself"<br />
4MODBUS(AD"127.0.0.1",R3:1,=101..150CV)<br />
In this case the <strong>DT80</strong> will send a Modbus request to read input registers #1-50 to the Modbus slave at address 127.0.0.1.<br />
This address is a special "loopback" IP address, which will actually be received by the <strong>DT80</strong> itself. The <strong>DT80</strong> Modbus server<br />
will then process the request in the normal way. As indicated in the table in Accessing <strong>DT80</strong> Channels via Modbus (P151),<br />
input registers #1-1000 are mapped onto 1CV-1000CV, so the <strong>DT80</strong> will reply to the request with the values of 1CV-50CV.<br />
The MODBUS channel will then process the reply and store the values into 101CV-150CV.<br />
Note that in this example the CV values will be transferred using standard 16-bit Modbus registers, so an appropriate scaling<br />
factor should be applied using the SETMODBUS command if the CVs contain non-integer values.<br />
Examples<br />
Some further examples are given below.<br />
1MODBUS(AD19,R3:100) – read input register #100 from device with address 19 connected to serial sensor port<br />
4MODBUS(AD"10.0.0.123",R3:100) – as above, but read from a device with IP address 10.0.0.123<br />
1MODBUS(AD1,R3:100,=10..19CV) – read input registers #100-119 and save to 10..19CV<br />
1MODBUS(AD1,R3:70,MBF) – read input registers #70 and #71 and interpret as the high and low words<br />
respectively of a 32 bit IEEE-754 floating point value.<br />
1MODBUS(AD1,R3:70,MBF,MER) – as above, except that register #70 contains the low word and #71contains<br />
the high word (i.e. "little endian" format).<br />
1MODBUS(AD1,R4:100)=235 – write 235 to holding (output) register #100<br />
UM-0085-B2 <strong>DT80</strong> <strong>Series</strong> User’s <strong>Manual</strong> Page 292
1MODBUS(AD1,R3:1,0.1) – read input register #1 and multiply by 0.1 (often used when the register contains a<br />
fixed point value, e.g. it measures in tenths of a degree)<br />
1MODBUS(AD1,R3:21,S2) – read input register #21 and apply scale and offset as specified in span S2.<br />
<br />
<br />
1MODBUS(AD1,R4:100,SR2)=1..3CV – write 1..3CV values to holding registers #100-102, after applying<br />
span S2 in reverse to each value<br />
1MODBUS(AD1,R1:100:8) – read discrete inputs #100-107 and pack into a single 8-bit value with input #100 as<br />
the least significant bit.<br />
1MODBUS(AD1,R0:100:16)=0xFFFF – set coils #100-115 to 1<br />
<br />
<br />
<br />
1MODBUS(AD1,R0:100)=4CV – set coil #100 to 1 if 4CV is non-zero, 0 if 4CV is zero<br />
1MODBUS(AD1,R1:100:16,=1..2CV) – read discrete inputs #100-115 into 1CV, #116-131 into 2CV<br />
1MODBUS(AD1,R3:100,MBF,=1..2CV) – read input regs #100-101 as a floating point value and save to 1CV,<br />
read input regs #102-103 as a second floating point value and save to 2CV.<br />
Troubleshooting<br />
Setting P56=4 will enable the output of diagnostic messages which allow you to see received and transmitted Modbus<br />
messages as they occur. This is described further in the Modbus slave section, Troubleshooting (P154).<br />
The TCP/IP loopback facility, where you specify the address 127.0.0.1 in order to cause the <strong>DT80</strong> to send Modbus<br />
messages to itself, can be a handy way to test your <strong>DT80</strong> program without requiring the connection of a real Modbus sensor.<br />
For example, you can simulate a sensor's input registers by setting a range of CVs, then reading them using the MODBUS<br />
channel – as described in Block Transfers (P292) above.<br />
If the <strong>DT80</strong> is unable to communicate with a Modbus sensor, an error message will be reported, such as<br />
1MODBUS(AD5,R3:1)<br />
dataTaker 85 E124 - Modbus transaction failed<br />
1MODBUS NotYetSet<br />
Check the following:<br />
Ensure the address specified in the AD channel option matches the Modbus device's configured serial or IP address<br />
Ensure that all Modbus devices on the network have unique addresses.<br />
If the <strong>DT80</strong> has a manually configured IP address and the sensor is not on the same local network segment then<br />
ensure that the <strong>DT80</strong>'s Ethernet gateway is set correctly, using PROFILE ETHERNET GATEWAY=ip-addr<br />
Ensure that the device actually supports the register number that you are trying to read. Make sure that you<br />
understand the convention that is used in the device's documentation for specifying register numbers.<br />
For serial Modbus, ensure that the serial port is set up correctly, using the appropriate profile settings. This includes<br />
port mode (RS485/422/232; serial sensor port only), port function (must be set to MODBUS_MASTER), baud rate and<br />
possibly other settings.<br />
For serial Modbus over RS422, ensure that the port is wired correctly with the <strong>DT80</strong> as the master.<br />
Ensure that there are no other Modbus master devices on the same serial network as the <strong>DT80</strong>. (For a TCP/IP<br />
network multiple Modbus master devices can be present.)<br />
If transactions are failing intermittently, electrical noise may be disrupting the network. If this cannot be rectified then it<br />
may help to use the RTn channel option to tell the <strong>DT80</strong> to retry failed transactions a few times.<br />
If the MODBUS channel is reliably returning values, but the values seem to be wrong, then check the following:<br />
Make sure you have specified the correct register number. Be careful of "off by one" problems, as some device<br />
documentation specifies 0-based protocol addresses, rather than the 1-based register numbers used by the R<br />
channel option.<br />
Has any required scaling factor or span been applied correctly Double check the device documentation.<br />
For 32-bit integer or floating point quantities be sure to specify the correct data format option, e.g. MBF if the device<br />
returns an IEEE-754 floating point value, or MBL for a long integer.<br />
For 32-bit quantities, it is also quite possible that your device may require the MBR option as both "straight" and<br />
"reversed" word ordering are widely used.<br />
UM-0085-B2 <strong>DT80</strong> <strong>Series</strong> User’s <strong>Manual</strong> Page 293
Technical Details & Troubleshooting<br />
<strong>DT80</strong> Analog Sub-System<br />
This section provides some technical details on the internal operation on the <strong>DT80</strong>'s analog measurement sub-system. This<br />
will allow the interested user to better understand its characteristics.<br />
A simplified block diagram of the <strong>DT80</strong>/81's analog sub-system is shown below. In this diagram the circle-X symbols indicate<br />
relay contacts which can connect or disconnect the indicated points.<br />
Ext *<br />
213μ A<br />
+V<br />
5V<br />
2.5mA 1K<br />
Channel<br />
1<br />
*<br />
+-<br />
#<br />
MUX<br />
2.5V Ref<br />
.<br />
.<br />
Isolation Barrier<br />
100V<br />
Channel<br />
5<br />
*<br />
+-<br />
#<br />
AGND<br />
100<br />
Atten.<br />
1<br />
or<br />
10<br />
1M<br />
1M<br />
MUX<br />
+<br />
PGA<br />
- x1,<br />
x10,<br />
x100<br />
ADC<br />
CPU<br />
+<br />
-<br />
3 Wire<br />
Compensation<br />
Figure 129: <strong>DT80</strong>/81 <strong>Series</strong> 1 Analog Sub-System<br />
The <strong>DT80</strong> <strong>Series</strong> 2 and DT85's analog sub-system is slightly different:<br />
Ext<br />
*<br />
Ext<br />
#<br />
*<br />
Channel +-<br />
1<br />
#<br />
213μ A<br />
+V 5V<br />
2.5mA 1K<br />
MUX<br />
2.5V Ref<br />
.<br />
.<br />
Isolation Barrier<br />
100V<br />
Channel<br />
16<br />
*<br />
+-<br />
#<br />
+<br />
-<br />
Atten.<br />
1<br />
or<br />
10<br />
3 Wire<br />
Compensation<br />
MUX<br />
+<br />
PGA<br />
- x1,<br />
x10,<br />
x100<br />
ADC<br />
CPU<br />
100<br />
Figure 130: <strong>DT80</strong> <strong>Series</strong> 2 and DT85 Analog Sub-System<br />
UM-0085-B2 <strong>DT80</strong> <strong>Series</strong> User’s <strong>Manual</strong> Page 294
The following sections discuss the various points to note about these diagrams.<br />
Ground Terminals<br />
The <strong>DT80</strong>'s analog section is electrically isolated from the rest of the unit. There are therefore two separate ground<br />
references – digital ground and analog ground.<br />
The <strong>DT80</strong>'s front panel label further reinforces the separation of the analog and digital sections:<br />
DIGITAL<br />
1D<br />
2D 3D 4D D<br />
GND<br />
1C 2C 3C 4C D<br />
1PE<br />
2PE GND<br />
WK 12V<br />
RELAY<br />
A B<br />
5D<br />
Tx Z<br />
6D 7D 8D D<br />
GND<br />
Rx RTS CTS D<br />
A Y B GND<br />
1<br />
*+-#<br />
2<br />
*+-#<br />
3<br />
*+-#<br />
4<br />
*+-#<br />
5<br />
*+-#<br />
EXT<br />
*<br />
EXT<br />
#<br />
EXT<br />
*<br />
EXT<br />
#<br />
ANALOG<br />
Digital section<br />
Ground reference = DGND<br />
Analog section<br />
Ground reference = AGND / EXT#<br />
Figure 131: The <strong>DT80</strong> has two ground systems<br />
Isolating the analog and digital sections means that sensor-to-equipment ground loops (see Ground Loops (P298)) are<br />
unlikely to arise. To preserve the <strong>DT80</strong>'s isolation these grounds should not normally be connected together.<br />
An isolated analog ground also means that the <strong>DT80</strong> can reject a large common mode voltage on the input being measured<br />
because its analog ground can "float" up to match the common mode voltage. This means that the common mode voltage<br />
seen by the <strong>DT80</strong>'s amplifier will be small.<br />
Digital Ground<br />
The <strong>DT80</strong>'s digital ground is connected to the DGND terminals, as well as to the chassis earth point and the various<br />
"common" or "ground" terminals on the communications and power interfaces. Digital ground is the ground reference for:<br />
DC power input<br />
all communications links (including serial sensor port), if required<br />
digital and counter inputs and outputs<br />
DC power outputs 12V and PWR OUT (<strong>DT80</strong> <strong>Series</strong> 2 and DT85 only)<br />
cable shields<br />
Analog Ground<br />
The <strong>DT80</strong>'s analog ground is shown by a black triangle symbol in the block diagram.<br />
Most analog measurements will not require any ground reference connection, as the measurement is taken relative to the<br />
channel's – or # terminal. The only case were a ground connection is required is when making current measurements using<br />
the <strong>DT80</strong>'s internal shunt resistor. In this configuration the current to be measured flows in the # terminal, through the shunt<br />
resistor and returns via the analog ground terminal to the external current source. Refer to the wiring diagrams, e.g. C3 –<br />
Independent Current Input using the internal shunt (P236) for more details.<br />
For the <strong>DT80</strong>/81, analog ground is permanently connected to the AGND terminals.<br />
For the <strong>DT80</strong> <strong>Series</strong> 2 and DT85, analog ground is connected to the EXT# terminals – but only when needed. That is, it is<br />
only connected during a measurement that uses the internal shunt resistor (e.g. 1#I), or that uses externally generated<br />
excitation (E channel option). Switching the analog ground connection in this way means that a channel which does not<br />
require an analog ground connection (e.g. a thermocouple) can be completely isolated from a channel which does (e.g. a<br />
current loop which uses the internal shunt). With the <strong>DT80</strong>/81, the thermocouple channel would not be completely isolated<br />
from the current loop channel because the thermocouple channel's # terminal would be connected (via the shunt resistor) to<br />
the AGND terminal and therefore to the ground of the current loop.<br />
Input Switching<br />
As shown in the block diagrams, each input terminal is switched via relay contacts. While an analog channel is being<br />
measured, its terminals are switched through to the analog input multiplexer. All other channels have all four of their input<br />
terminals disconnected, so they are completely isolated from the channel being measured.<br />
For the <strong>DT80</strong>/81, the dotted lines between each channel's four relay contacts indicate that the four relay contacts are always<br />
switched together, so all four are either all open or all closed.<br />
For the <strong>DT80</strong> <strong>Series</strong> 2 and DT85, it can be seen that the contacts are split into two independently controlled pairs – one for<br />
the + and – terminals and one for the * and # terminals. This means that if two independent differential inputs are connected<br />
to the one channel then the two measurements will be fully isolated. That is, when you measure between + and – (e.g. 1TK)<br />
the * and # terminals will be disconnected, and conversely when you measure between * and # (e.g. 1*TK) the + and –<br />
terminals will be disconnected. This isolation improves measurement accuracy in situations where the two inputs have<br />
different common mode voltages.<br />
UM-0085-B2 <strong>DT80</strong> <strong>Series</strong> User’s <strong>Manual</strong> Page 295
Input Termination<br />
The <strong>DT80</strong>'s instrumentation amplifier has a very high input impedance. With such devices, it is necessary to provide a path<br />
to allow the device's inherent "bias current" to flow to ground. If this is not done then the inputs will "float", possibly causing<br />
significant inaccuracies.<br />
For the <strong>DT80</strong>/81, when a measurement is made relative to the # terminal (e.g. 1+V), the 100Ω shunt resistor between the #<br />
terminal and AGND provides a ground path, thereby preventing any problems due to floating inputs. However, when a<br />
measurement is made between the + and – terminals (e.g. 1V), the shunt resistor will not be connected to the amplifier input.<br />
For such measurements, it is necessary to terminate the inputs. This input termination is provided by a pair of 1MΩ<br />
resistors, as shown in the block diagram. These are automatically switched in whenever a voltage measurement is made<br />
using the + and – terminals (e.g. 1V, 1TK etc.), or they can be switched in manually using the T (terminate) channel option.<br />
The use of these termination resistors will decrease the input impedance of the <strong>DT80</strong> to around 1MΩ. That is, it will increase<br />
the load on the voltage source being measured. This will generally only be a problem if the source has a very high output<br />
impedance.<br />
Also note that the ground reference provided by the 1MΩ termination resistors is not as effective as that provided by the<br />
100Ω shunt resistor. For this reason, when performing an independent voltage measurement it is usually preferable to make<br />
the measurement relative to the # terminal rather than the – terminal; that is 1*V rather than 1V.<br />
For the <strong>DT80</strong> <strong>Series</strong> 2 and DT85, these termination resistors are not required, and the T option will have no effect. This is<br />
because the 100Ω shunt resistor can be connected to either the – or the # terminal, as shown in the diagram. This resistor<br />
will therefore provide a ground path for all input configurations.<br />
Attenuator<br />
To extend the input voltage range, the <strong>DT80</strong> provides a switchable input attenuator. This is a resistive voltage divider which<br />
attenuates the input by approximately 10:1. The attenuator is enabled by default for the HV (high voltage) channel type, or it<br />
can be enabled manually using the A channel option.<br />
As indicated in the diagrams, there is no attenuator on the # input. This means that input attenuation is not available for #<br />
terminal measurements (which would typically be current measurements using the internal shunt resistor, e.g. 1#I or 1#L).<br />
Furthermore, the excitation switching arrangement on the <strong>DT80</strong>/81 means that attenuation cannot be used if the logger is<br />
supplying excitation from one of its internal sources. This restriction does not apply to the <strong>DT80</strong> <strong>Series</strong> 2 and DT85.<br />
Note that when the attenuator is used the <strong>DT80</strong>'s input impedance will decrease to approximately 100kΩ.<br />
Excitation<br />
Some measurements require that the sensor be excited in order for a measurable output voltage to be produced. For<br />
example, to measure a resistance an excitation current is passed through the resistance and the resulting voltage drop is<br />
measured.<br />
As shown in the block diagrams, there are some differences between the <strong>DT80</strong>/81 and the <strong>DT80</strong> <strong>Series</strong> 2/DT85 in the way<br />
excitation is switched. These do not, however, affect the way that excitation is used from the user's point of view, other than<br />
the caveat mentioned above regarding attenuation.<br />
Internal Sources<br />
If excitation is required, the <strong>DT80</strong> provides three internal excitation sources:<br />
precision current source, approx. 213μA. This is the default for the R (resistance), NI (RTD) and YSnn (thermistor)<br />
channel types, or can be selected manually using the I channel option.<br />
precision current source, approx. 2.5mA. This is the default for the BGI (bridge), PTnnn (RTD) and CU (RTD) channel<br />
types, or can be selected manually using the II channel option. This setting provides for more accurate<br />
measurements of low resistances, at the expense of a reduced measurement range.<br />
voltage source, approx 4.5V. This is the default for the BGV (bridge) and IC temperature sensor (e.g. AD590, LM135<br />
etc) channel types, or can be selected manually using the V channel option. This output has a 1kΩ output impedance,<br />
so the output voltage will drop if any significant current is drawn.<br />
If one of these sources is selected, it will be switched through to the * terminal of the channel being measured. The excitation<br />
current returns via the channel's # terminal, then through the shunt resistor to analog ground. Note that the excitation is only<br />
connected to the channel's terminals for the duration of the measurement.<br />
External Sources<br />
Alternatively, an external excitation source may be provided. There are two options here:<br />
The source can be connected directly to the sensor. The <strong>DT80</strong> then measures the required voltage. As far as the<br />
<strong>DT80</strong> is concerned, it is just measuring a voltage; it is not concerned with providing excitation. The N (no excitation)<br />
channel option may therefore be used to indicate this configuration. For example, refer to the bridge wiring diagram:<br />
B1 – 6-Wire BGV Inputs (P241).<br />
A single source can be used to excite multiple channels. In this configuration the external supply is connected to the<br />
EXT* terminal, and the return to AGND (<strong>DT80</strong>/81) or EXT# (<strong>DT80</strong> <strong>Series</strong> 2/DT85). The <strong>DT80</strong> will then switch this<br />
source through to the * terminal of the channel being measured. The excitation current then returns via the channel's<br />
# terminal, through the internal shunt to analog ground, then back to the excitation supply via the AGND/EXT#<br />
UM-0085-B2 <strong>DT80</strong> <strong>Series</strong> User’s <strong>Manual</strong> Page 296
terminal. If desired, the 12V power output on the DT85 and <strong>DT80</strong> <strong>Series</strong> 2 can be connected to EXT* as an excitation<br />
source, see also Controlling 12V Power Output (P223).<br />
Note that in the first case the sensor is continuously excited, while in the second it is only excited during an actual<br />
measurement (similar to internal excitation). Exciting a sensor only when needed is beneficial from a power consumption<br />
standpoint, and it will help minimise self-heating issue in sensors such as thermistors. In some cases, however, a sensor<br />
may require a certain warm up time. In this case the MD (measurement delay) channel option may be used to extend the<br />
measurement time)<br />
Note also that external excitation cannot be used for channels such as R (resistance) or BGI (current excited bridge) where<br />
the <strong>DT80</strong> needs to accurately know the excitation current in order to calculate the quantity being measured. For these<br />
channel types one of the precision internal current sources must be used.<br />
3-Wire Compensation<br />
The 3-Wire Compensation circuit is used for 2 and 3 wire resistance measurements. It will therefore be used by default for<br />
any resistance measurement, unless the 4W option is used to specify a 4-wire measurement.<br />
In a 3-wire measurement, excitation current flows out of the * terminal, through the excite wire, through the resistance being<br />
measured, then back via the return wire to the # terminal. The measurement is then made between the + terminal (which is<br />
shorted to *) and, using a third "sense" wire, the negative end of the resistance being measured. This measurement will<br />
include the voltage drop across the excite wire, as well as that across the unknown resistance. See R2 – 3-Wire Resistance<br />
Inputs (P238).<br />
The 3-wire compensation circuit works by measuring the voltage drop across the return wire (i.e. between the sense point<br />
and the # terminal), multiplying it by 2 (to account for the voltage drop in the excite wire, which is assumed to be equal to that<br />
in the return wire), then using this voltage to offset the negative input of the instrumentation amplifier. This will effectively<br />
subtract the cable's voltage drop, thereby compensating for the effect of the cable resistance.<br />
For a 2-wire measurement there is no sense wire. The return wire connects to the – terminal, so the measurement now<br />
includes both the excite and the return resistance. This can then be manually compensated for by inserting a resistor equal<br />
to the total cable resistance between the – and # terminals. The excitation current will flow through this resistor, generating a<br />
voltage drop which will then offset the amplifier input in a similar way to a 3-wire measurement.<br />
Calibration and Characterisation<br />
There are two main sources of error in an electronic instrument such as the <strong>DT80</strong>:<br />
variations in component values or characteristics due to manufacturing tolerances<br />
variations in component values or characteristics due to ambient temperature<br />
During production, the actual values for certain circuit parameters are measured (using test equipment traceable to ISO<br />
standards) and then stored permanently into the <strong>DT80</strong> memory. This process is known as characterisation. Once the <strong>DT80</strong><br />
has been characterised, the firmware can correct for these variations. These stored values can be listed using the CHARAC<br />
command (see CHARAC Command (P212)).<br />
Some circuit characteristics are, however, inherently temperature dependent. If the <strong>DT80</strong> is to return accurate readings over<br />
the full temperature range then these characteristics must be corrected for as well. This cannot be done in the factory; it must<br />
be done during operation, as the temperature goes up and down. This process is known as calibration (not to be confused<br />
with characterisation).<br />
On power-up and at regular intervals during operation, the <strong>DT80</strong> measures the amplifier's internal "offset voltage". If it is<br />
found to have drifted by a specified amount (3µV by default, can be adjusted using parameter P0) then a calibration cycle<br />
is performed. This process takes approximately one second and involves the <strong>DT80</strong> measuring several different internal<br />
parameters, such as offset voltages (amplifier output with no input applied) for various input configurations, and the actual<br />
values of the <strong>DT80</strong>'s internal current sources. These readings are then used for all subsequent analog measurements, until<br />
the next calibration cycle occurs.<br />
The TEST command will force a calibration cycle, and return the values of most of the measured calibration parameters.<br />
To summarise: the <strong>DT80</strong> has certain temperature-stable characteristics, whose absolute values are measured and recorded<br />
during manufacture. This process corrects for any differences between individual units. Using these characterised values,<br />
further measurements are taken during operation to correct for differences between the current temperature and the<br />
temperature at which the factory characterisation was performed.<br />
Analog Warm Up Time<br />
By default (P21=0), the <strong>DT80</strong>'s analog section will be powered up 50ms prior to execution of a schedule containing analog<br />
channels, and then powered down once the schedule is complete. This minimises overall power consumption.<br />
The 50ms delay allows some time for the analog power supply to stabilise. However, the analog circuits also exhibit a "warm<br />
up" characteristic. This means that readings may vary slightly during the first few minutes after the analog section is powered<br />
up, until the components' temperatures stabilise. This is not normally a concern because:<br />
the automatic calibration process ensures that temperature related drift is compensated for<br />
in most systems all analog measurements in a schedule are completed within a second or so of each other so the<br />
differences in readings due to the analog warm up characteristic are negligible.<br />
If power consumption is not a concern then the analog section can be kept powered all the time by setting P21=1. This will<br />
generally reduce the number of calibration cycles which occur due to analog warm up. Calibration cycles will, of course, still<br />
occur if the ambient temperature changes.<br />
UM-0085-B2 <strong>DT80</strong> <strong>Series</strong> User’s <strong>Manual</strong> Page 297
Grounds, Ground Loops and Isolation<br />
Experience has shown that ground loops (sometimes called "earth loops") are the most common cause of measurement<br />
difficulties. Excessive electrical noise, unexpected offset voltages and erratic behaviour can all be caused by one or more<br />
ground loops in a measurement system.<br />
Grounds are Not Always Ground<br />
Electrical grounds in a measuring system can be an elusive cause of errors.<br />
In the real world, points in a system that one could reasonably consider at ground potential are often at different and<br />
fluctuating AC or DC potentials. This is mainly due to earthed neutral returns in power systems, cathodic corrosion protection<br />
systems, thermocouple effects in metal structures, lightning strikes and solar storms. Whatever the cause, the result can be<br />
loss of measurement integrity.<br />
Ground Loops<br />
If grounds of different potential are connected by cabling used in the measuring system, ground currents flows — this is the<br />
infamous ground loop. The magnitude of the currents can be from milliAmperes to tens of Amperes, and in the case of a<br />
lightning strike, can be thousands of Amperes. Frequently, voltage drops along cables (caused by these current flows) are<br />
superimposed on the desired signal voltage.<br />
A ground loop can arise when a measurement system has more than one path to ground. As Figure 132 shows, this can be<br />
caused by<br />
connecting a sensor to a ground point that has a different potential to the ground of another sensor — a<br />
sensor-to-sensor ground loop is likely to flow through the return wires of the two sensors<br />
connecting the <strong>DT80</strong> to a ground point that has a different potential to the ground of one or more of the sensors or<br />
instruments connected to the <strong>DT80</strong> inputs — a sensor-to-equipment ground loop<br />
connecting the <strong>DT80</strong> to a ground point that has a different potential to the ground of the host computer — an<br />
equipment-to-computer ground loop.<br />
In these situations, conduction paths can occur from one ground point to another through the sensor and/or equipment<br />
and/or computer, making measurement errors inevitable (particularly if sensor wires are part of the conduction path).<br />
Sensor 1<br />
Sensor 2<br />
Data acquisition/logging<br />
equipment<br />
Host computer<br />
Sensor-to-sensor<br />
ground loop<br />
Sensor-to-equipment<br />
ground loop<br />
Comms cable<br />
Equipment-to-computer<br />
ground loop<br />
Sensor 1<br />
ground<br />
Sensor 2<br />
ground<br />
Equipment<br />
ground<br />
Computer<br />
ground<br />
V 1<br />
V 2<br />
V 1<br />
› V 2 V 2<br />
› V 3<br />
V 3<br />
V 3<br />
› V 4<br />
V 4<br />
The <strong>DT80</strong>’s analog isolation<br />
means that this loop cannot occur.<br />
Figure 132: Some of the possible ground-loops in a measurement system<br />
Avoiding Ground Loops<br />
For each type of ground loop, the basic strategy is to break the ground loop.<br />
Isolation<br />
The design of the <strong>DT80</strong> helps eliminate ground loops between the sensors and the <strong>DT80</strong>/computer, because the <strong>DT80</strong><br />
provides over 100V of isolation between the analog section (which connects to analog sensors) and the digital section<br />
(which connects to digital devices and computers).<br />
The ground point for the analog section is the internal analog ground, which is electrically isolated from the "system" ground<br />
(DGND terminal).<br />
Furthermore, each analog channel is electrically isolated (to 100V) from other channels.<br />
See Ground Terminals (P295) for more details.<br />
Connecting Sensors<br />
The following points should be considered:<br />
There should normally not be any external connection made between AGND/EXT# and DGND.<br />
The sensor's "return" wire should be grounded at one end only (the <strong>DT80</strong> end) of the sensor cable. Normally the return<br />
wire would be connected to the -, # or AGND/EXT# terminal on the <strong>DT80</strong>.<br />
There should be no connection to ground at the sensor itself, unless that connection is isolated from the sensor return<br />
wire. For example, if the sensor has its own power supply then the power supply should be isolated from ground (e.g.<br />
by using a transformer-isolated mains supply)<br />
Use an independent input configuration in preference to a shared configuration.<br />
UM-0085-B2 <strong>DT80</strong> <strong>Series</strong> User’s <strong>Manual</strong> Page 298
Noise Pickup<br />
There are two main ways in which noise can be introduced into signal wiring: by capacitive coupling and by magnetic<br />
induction. There are different counter-measures for each.<br />
Shield signal wiring to minimize capacitive noise pick-up. Signal wiring that is close to line voltage cable should always be<br />
shielded.<br />
Shields should be connected to system ground (DGND) at the <strong>DT80</strong> end only.<br />
Magnetic induction of noise from current-carrying cables or from electrical machines (especially motors and transformers) is<br />
a greater problem. Shielded cable is not an effective counter-measure. The only practical measures are to<br />
avoid magnetic fields<br />
use close-twisted conductors for the signal wiring.<br />
Shielding in steel pipe can be effective, but is generally not economic or convenient.<br />
Noise Rejection<br />
The <strong>DT80</strong> is designed to reject mains noise. For best noise rejection, set the <strong>DT80</strong>’s parameter 11 to your local mains<br />
frequency, 50Hz or 60Hz — see P11 (P199).<br />
To force the <strong>DT80</strong> to load this parameter setting every time it restarts use the following command<br />
PROFILE PARAMETERS P11=60 'for 60Hz line frequency<br />
Self-Heating of Sensors<br />
Sensors that need excitation power to be read are heated by power dissipation. This issue can be particularly acute with<br />
temperature sensors and some sensitive bridges. If self-heating is a problem, consider:<br />
selecting 200µA excitation (I channel option) in preference to 2.5mA excitation (the trade-off is a reduction in the<br />
range of resistances that can be measured).<br />
reducing measurement time, e.g. setting P11=200 will reduce the time spent exciting the sensor from the default<br />
20ms to 5ms (the trade-off is a reduction in mains noise rejection).<br />
Getting Optimal Speed from Your <strong>DT80</strong><br />
In applications where it is important to sample as rapidly as possible, the following guidelines may assist:<br />
Switch off data return and logging for channels you are not interested in.<br />
Set P21=1 so that the analog power supply is always on. This prevents the 50ms warm-up delay which can occur if<br />
there is any gap between schedule execution.<br />
Similarly, if any CEM20 units are in use then set P28=1 so that 12V output for powering the CEM is always on,<br />
Set P11 to a higher value, which will reduce the time over which an analog acquisition is integrated. For example, if<br />
P11 is changed from 50 to 500 then the sample time will be reduced from 20ms to 2ms. Be aware that this will cause<br />
a degradation in the <strong>DT80</strong>'s ability to reject noise.<br />
Reduce the channel's settling time, using the MDn channel option. The default is 10ms. It is not recommended to<br />
reduce this below 5ms because the <strong>DT80</strong>'s relays need about this long to switch before a measurement can<br />
commence.<br />
Disable automatic calibrations using /k. Be aware that readings will now be subject to drift with temperature.<br />
<br />
Set P62=1, which will leave the <strong>DT80</strong>'s relays set when the schedule completes (normally they are set back to a<br />
quiescent state at the end of a schedule). If you are measuring a single voltage input then you will now be able to do<br />
repeated samples without changing the relay settings at all, which would then allow you to reduce the settling time to<br />
zero (i.e. MD0)<br />
UM-0085-B2 <strong>DT80</strong> <strong>Series</strong> User’s <strong>Manual</strong> Page 299
Part O – The CEM20<br />
Figure 133: A CEM20 module (left), shown connected to a <strong>DT80</strong><br />
What is the CEM20<br />
The dataTaker CEM20 (Channel Expansion Module) is an analog multiplexer specially designed to work with <strong>DT80</strong> series<br />
data loggers (<strong>Series</strong> 2 only). Each CEM20 provides 20 additional analog channels. Up to five CEM20s can be connected to<br />
a <strong>DT80</strong> and fifteen to a DT85, giving a total of 100 and 300 analog input channels respectively.<br />
The CEM20 contains relay multiplexers which connect the selected channel through to one of the <strong>DT80</strong>'s analog inputs. In<br />
order to measure a sensor connected to a CEM20 input:<br />
1. The <strong>DT80</strong> will first send a command to the appropriate CEM20, which will cause it to connect the required input<br />
through to its analog output terminals.<br />
2. The CEM20's analog output terminals are wired to one of the <strong>DT80</strong>'s analog input channels, so the <strong>DT80</strong> will then<br />
simply perform a normal analog measurement on the appropriate channel.<br />
Measuring a sensor connected to a CEM20 channel is therefore just like measuring one that is directly connected to the<br />
<strong>DT80</strong>. The main difference is that the measurement will take longer (typically about twice as long) due to the extra step<br />
involved.<br />
Connecting CEM20s<br />
As shown in the photograph above, there are two main connections to each CEM20, namely:<br />
a 4-wire power/control connection (the upper cable in the photograph). This cable connects to the <strong>DT80</strong>'s switched<br />
12V power output in order to supply power to the CEM. The cable also contains two control signals, which are driven<br />
by two of the <strong>DT80</strong>'s digital outputs: 5D and 6D.<br />
an 4-wire analog connection. This connects the analog output of the CEM20 to one of the <strong>DT80</strong>'s analog inputs. Each<br />
CEM20 connects to a separate analog input on the logger. (Thus for every CEM20 that you connect, you gain 20<br />
analog inputs but lose one analog input on the logger.)<br />
The photograph shows a single CEM20. To connect a second CEM20:<br />
Each CEM20 includes a power/control output terminal block, located directly above the power/control input. This can<br />
be used to "daisy chain" the power and control signals to the next CEM20.<br />
The analog output of the second CEM20 then connects to the second analog input on the <strong>DT80</strong>, in the same way as<br />
the first CEM20, which connects to the first analog input.<br />
UM-0085-B2 <strong>DT80</strong> <strong>Series</strong> User’s <strong>Manual</strong> Page 300
The following diagram shows the required wiring in detail. In this case a <strong>DT80</strong> is shown connected to two CEM20s. Several<br />
K-type thermocouples are also shown, connected to analog inputs on the CEM20s and on the logger itself. Using this "dual<br />
isolated" method of connecting thermocouples (as per V2 – Independent Voltage Inputs (P234)), up to 86 fully isolated<br />
thermocouples could be connected – 40 on each CEM20 (two per analog input) plus another 6 on the remaining 3 analog<br />
inputs (inputs 3, 4 and 5) on the <strong>DT80</strong>.<br />
<strong>DT80</strong><br />
WK 12V<br />
5D 6D 7D 8D<br />
D<br />
GND<br />
1<br />
* + – #<br />
2<br />
* + – #<br />
3<br />
* + – #<br />
shield<br />
3TK<br />
...<br />
3*TK<br />
12V<br />
D<br />
Gnd<br />
5D 6D<br />
* + – #<br />
To Logger<br />
CEM20 #1<br />
Switch<br />
Setting<br />
12V<br />
D 5D 6D<br />
Gnd Out Out<br />
1<br />
* + – #<br />
2<br />
* + – #<br />
shield 101TK 102TK<br />
...<br />
101*TK<br />
102*TK<br />
12V<br />
D<br />
Gnd<br />
5D 6D<br />
* + – #<br />
To Logger<br />
CEM20 #2<br />
Switch<br />
Setting<br />
12V<br />
D 5D 6D<br />
Gnd Out Out<br />
1<br />
* + – #<br />
2<br />
* + – #<br />
201TK<br />
202TK<br />
...<br />
201*TK<br />
202*TK<br />
Figure 134: A <strong>DT80</strong> connected to two CEM20s and set up to measure an array of thermocouples<br />
Note the following points about the wiring diagram:<br />
<br />
<br />
Each CEM20 is supplied with two pre-wired connecting cables: a power/control cable and an analog cable. These are<br />
suitable for connecting the first CEM20 the logger. To connect the second and subsequent CEM20s, it will be<br />
necessary to replace the "5+2" terminal connector on one end of the power/control cable with a single 4-way terminal<br />
block to suit the output on the CEM20. It may also be necessary to extend the length of the analog cable.<br />
Shielded cable is recommended. The cable shield should be connected to DGND at one end only, as shown in the<br />
diagram. It is not necessary for everything to use the one DGND terminal – shields may be connected to any of the<br />
DGND terminals on the logger, or to the earth point on the metal end plate.<br />
UM-0085-B2 <strong>DT80</strong> <strong>Series</strong> User’s <strong>Manual</strong> Page 301
The maximum total cable length, from the <strong>DT80</strong> to the last CEM20 in the chain, is 100 metres.<br />
In the diagram, the two CEM20s have been assigned addresses 1 and 2. However any addresses could have been<br />
chosen. The only rule is that a CEM20 with address n must have its analog output connected to analog input n on the<br />
<strong>DT80</strong>.<br />
CEM20 Addresses<br />
CEM20s are identified by their address, which is set using the 4-way DIP switch on the end plate of the CEM20.<br />
Each CEM20 must be set to a unique address before installation.<br />
A CEM20's address determines where its analog output should be connected and how its channels should be referenced.<br />
For example, a single CEM20 could be attached to a <strong>DT80</strong> and set to address 5. This CEM20 would then connect to analog<br />
input 5 on the <strong>DT80</strong>, and its channels would be referred to as 501, 502 etc.<br />
The following table shows the required switch settings for each CEM20<br />
CEM20<br />
Address Switch 1 Switch 2 Switch 3 Switch 4<br />
1 - - - ON<br />
2 - - ON -<br />
3 - - ON ON<br />
4 - ON - -<br />
5 - ON - ON<br />
6 - ON ON -<br />
7 - ON ON ON<br />
8 ON - - -<br />
9 ON - - ON<br />
10 ON - ON -<br />
11 ON - ON ON<br />
12 ON ON - -<br />
13 ON ON - ON<br />
14 ON ON ON -<br />
15 ON ON ON ON<br />
Powering the CEM20<br />
The recommended method of powering the CEM20 is to use the switched 12V power output on the <strong>DT80</strong>, as shown in<br />
Figure 134. This output is capable of powering up to 15 CEM20 units.<br />
By default, the <strong>DT80</strong>'s 12V output will only be switched on during execution of a schedule containing CEM20 channels.<br />
Other modes of operation are possible, however, and are selected using parameter P28, as described in Controlling 12V<br />
Power Output (P223). In particular:<br />
<br />
<br />
<br />
set P28=0 (default) to switch CEM20 power on and off as required. This minimises power usage.<br />
set P28=1 and P21=1 to keep the CEM20s and the <strong>DT80</strong>'s analog measurement system powered up continuously.<br />
This will obviously use more power but will avoid the 50ms "warm up" delay that the <strong>DT80</strong> inserts when switching on<br />
either or both of these power supplies.<br />
set P28=3 if the CEM20s are independently powered using an external power supply. The <strong>DT80</strong>'s 12V output may<br />
then be used to power other equipment if required and manually controlled using 1SSPWR=.<br />
Note that if the CEM20s are externally powered then a regulated 12V ±5% supply is required.<br />
Accessing CEM20 Channels<br />
CEM20 channels are numbered in the same way as regular channels, but with the CEM number as the hundreds digit. Thus<br />
the first CEM20's channels are numbered from 101 to 120, the second from 201 to 220 and the fifteenth from 1501 to 1520.<br />
So to measure a thermocouple connected to the + and – terminals on first analog input channel on CEM20 #1 you would<br />
enter 101TK – as shown on the wiring diagram.<br />
Channel sequences (see Channel Number Sequence (P28) can cross CEM boundaries. For example,<br />
RA1M 119..203V<br />
is equivalent to<br />
RA1M 119V 120V 201V 202V 203V.<br />
Likewise, an array of 86 isolated thermocouples connected as per Figure 134 could be read using:<br />
RA1M 3..220TK 3*..220*TK<br />
UM-0085-B2 <strong>DT80</strong> <strong>Series</strong> User’s <strong>Manual</strong> Page 302
CEM20 Temperature Reference<br />
Each CEM20 includes a precision RTD temperature sensor. This is used to measure the reference junction temperature<br />
when thermocouple measurements are performed using the CEM20's analog inputs (see Temperature – Thermocouples<br />
(P244). This process is automatic and is part of the normal thermocouple measurement process.<br />
A CEM20's internal temperature sensor can be read at any time (for testing purposes) using the nREFT channel, where n is<br />
the CEM number (1-15). So to read the current reference junction temperature for the first CEM20 you would enter 1REFT.<br />
(To read the <strong>DT80</strong>'s internal temperature sensor use the REFT channel – no channel number.)<br />
Troubleshooting<br />
In the event that invalid readings are obtained when reading CEM20 channels, the following troubleshooting procedure may<br />
be helpful.<br />
The key diagnostic aid is the red Sample LED on the CEM20, which will flash when it is commanded to take a measurement.<br />
For example, if you measure input 7 on CEM20 #12 (e.g. by typing 1207V), you should see the red Sample LED on CEM20<br />
#12 flash, along with the blue Sample LED on the <strong>DT80</strong>. No other CEM20s should flash their LED.<br />
CEM20 Sample LED does not flash<br />
If the appropriate CEM20's Sample LED does not flash when one of its inputs is measured then the most common<br />
explanations are:<br />
the CEM20 address switch is not set correctly. The CEM20 connected to analog input 1 on the <strong>DT80</strong> must be set to<br />
address 1 (switch setting: off, off, off, ON), the CEM20 connected to analog input 2 must be set to address 2 (switch<br />
setting: off, off, ON, off) and so on.<br />
the power/control cable to the CEM20 is not connected properly. Double check the wiring against the wiring diagram.<br />
Do not confuse the CEM20's power/control input (lower terminal block) and its power/control output (upper terminal<br />
block). Also, when connecting to a DT85, be sure that the 2-way terminal block on the cable is correctly plugged in to<br />
the 3-way terminal block on the DT85 (i.e. the wire should connect to the 12V terminal).<br />
the CEM20 is not powered. If the CEM20 is powered from the <strong>DT80</strong>'s 12V output then check that the P28 setting is<br />
correct; it should be set to 0, 1 or 2. If the CEM20 is powered externally then check that 12V ± 5% is present.<br />
there is a hardware or cabling problem with one of the "upstream" CEM20s. Try temporarily bypassing them by<br />
disconnecting the cable from CEM20 #1's power/control input and connecting it instead to the CEM20 in question.<br />
Then issue the same measurement command (it is not necessary to change the address of the CEM20). If this reading<br />
is satisfactory then it should be possible by a process of elimination to determine which CEM20 or power/control cable<br />
is faulty.<br />
you are using a <strong>Series</strong> 1 <strong>DT80</strong>. The CEM20 requires a <strong>Series</strong> 2 unit.<br />
CEM20 Sample LED flashes, but reading is invalid<br />
Possible explanations are:<br />
faulty sensor. Check by plugging it into one of the <strong>DT80</strong>'s analog inputs.<br />
the analog cable of the CEM20 is not connected properly. Double check against the wiring diagram; in particular check<br />
that it is plugged into the correct <strong>DT80</strong> channel (a CEM20 set to address n must connect to <strong>DT80</strong> analog input n)<br />
multiple CEM20s are being selected. Ensure that the Sample LED flashes on one and only one CEM20.<br />
electrical noise – ensure that the cable shield is connected to a DGND terminal (as shown in the wiring diagram) or to<br />
the <strong>DT80</strong> chassis earth point.<br />
faulty analog input on CEM20 or <strong>DT80</strong>. Disconnect the CEM20 and connect a sensor directly to the <strong>DT80</strong> analog input<br />
previously used by the CEM20. This should identify whether the CEM20 or <strong>DT80</strong> is at fault.<br />
It may also be helpful to try reading the internal temperature sensor on the CEM20 (e.g. type 12REFT to read the current<br />
temperature of CEM20 #12). This will eliminate any external sensor issues.<br />
UM-0085-B2 <strong>DT80</strong> <strong>Series</strong> User’s <strong>Manual</strong> Page 303
Part P – Reference<br />
<strong>DT80</strong> <strong>Series</strong> Specifications<br />
Analog Inputs<br />
Max Number of Inputs<br />
<strong>DT80</strong> + DT85 +<br />
Input Type DT81 DT82E <strong>DT80</strong> DT85 5 x CEM20 15 x CEM20<br />
3-wire & 4-wire independent inputs 1 2 5 16 100 300<br />
2-wire independent inputs 2 4 10 32 200 600<br />
2-wire shared terminal inputs 3 6 15 48 300 900<br />
Supported Measurement Types<br />
<br />
<br />
<br />
<br />
<br />
<br />
<br />
<br />
<br />
<br />
<br />
<br />
voltage<br />
current and 4-20mA current loop (internal or external shunt)<br />
resistance (2, 3, 4 wire; max 10kΩ)<br />
ratiometric resistance e.g. strain gauges (1/4, 1/2 or full bridges; current or voltage excited)<br />
thermocouples: types B, C, D, E, G, J, K, N, R, S, T (internal or external reference junction sensor)<br />
RTDs (Pt, Ni, Cu)<br />
thermistors (YS400xx series; generic thermistor scaling)<br />
IC temperature sensors (AD590 series, LM35 series, LM135 series)<br />
frequency<br />
vibrating wire strain gauges (<strong>DT80</strong>G/85G GeoLogger only)<br />
Carlson meters<br />
logic state<br />
Input Ranges<br />
Input Type Range Resolution<br />
DC Voltage<br />
±30 mV 0.00025 mV<br />
±300 mV 0.0025 mV<br />
±3000 mV 0.025 mV<br />
±30 V 0.00025 V<br />
DC Current<br />
±0.3 mA 0.0000025 mA<br />
Internal Shunts(100Ω)<br />
±3 mA 0.000025 mA<br />
±30 mA 0.00025 mA<br />
External Shunts depends on shunt depends on shunt<br />
Resistance<br />
10 Ω 0.00015 Ω<br />
100 Ω 0.0015 Ω<br />
1000 Ω 0.015 Ω<br />
10,000 Ω 0.15 Ω<br />
Frequency 0.1 to 10,000 Hz 0.0002%<br />
4-20mA Current Loop 0 to 100% 0.01%<br />
Temperature depends on sensor depends on sensor<br />
Strain Gauges and<br />
±10 4 ppm 1 ppm<br />
Bridges<br />
±10 5 ppm 10 ppm<br />
±10 6 ppm 100 ppm<br />
Analog State 0 or 1 1<br />
UM-0085-B2 <strong>DT80</strong> <strong>Series</strong> User’s <strong>Manual</strong> Page 304
Accuracy<br />
Maximum measurement error is given by:<br />
error = (reading * Basic Accuracy) + (FullScale Reading * 0.01%)<br />
where Basic Accuracy is as specified in the following table:<br />
5ºC to 40ºC -45ºC to 70ºC<br />
DC voltage measurement ±0.1% ±0.35%<br />
DC current measurement ±0.15% ±0.45%<br />
DC resistance measurement ±0.1% ±0.35%<br />
Frequency measurement ±0.1% ±0.25%<br />
Input Characteristics<br />
Limit min typ max unit<br />
Input terminal voltage<br />
-35 - 35 V<br />
Warning Voltages outside this range can cause permanent damage.<br />
Common mode voltage -3.5 - 3.5 V<br />
Common mode voltage, attenuators enabled -35 - 35 V<br />
Input impedance 100M - - Ω<br />
Input impedance, attenuators enabled 100k - - Ω<br />
Inter-channel isolation (relay) 100 - - V<br />
Analog/digital isolation (opto) 100 - - V<br />
Internal shunt resistance - 100 - Ω<br />
Sample rate - - 25 Hz<br />
Common mode rejection 90 - - dB<br />
Line series mode rejection 35 - - dB<br />
Effective resolution - - 18 bits<br />
Excitation<br />
voltage source, 4.5V<br />
precision current sources: 213μA or 2.5mA<br />
switched external excitation input<br />
general purpose switchable 12V regulated power output for powering sensors & accessories. (max 150mA) *<br />
* DT85 and <strong>DT80</strong>/81 <strong>Series</strong> 2 only<br />
Digital Inputs and Outputs<br />
Max Number of I/O<br />
Input Type DT81 DT82E <strong>DT80</strong> DT85<br />
Open drain digital input/outputs, pull-up 3 3 4 4<br />
Logic input/outputs. tri-stateable, pull-down 1 1 4 4<br />
Relay contact outputs 1 1 1 1<br />
User LED outputs (Attn) 1 1 1 1<br />
Low speed counter inputs (shared with digital I/O) 4 4 8 8<br />
High speed counter inputs with TTL-level inputs 2 2 2 2<br />
High speed counter inputs with programmable TTL or low threshold inputs 2 2 2 2<br />
Phase encoder (quadrature) inputs (shared with high speed counter inputs) 1 - 2 2<br />
Input Characteristics<br />
Terminal Limit min typ max unit<br />
1D-4D Input terminal voltage<br />
-0.6 - 30 V<br />
(1D-3D Warning Voltages outside this range can cause permanent damage.<br />
for Input high voltage 3.0 - - V<br />
DT81/82) Input low voltage - - 0.75 V<br />
5D-8D Input terminal voltage<br />
-0.6 - 20 V<br />
(4D for Warning Voltages outside this range can cause permanent damage.<br />
DT81/82) Input high voltage 3.0 - - V<br />
Input low voltage - - 0.75 V<br />
Low speed counter input frequency - 25 Hz<br />
Low speed counter input pulse width 20 - ms<br />
UM-0085-B2 <strong>DT80</strong> <strong>Series</strong> User’s <strong>Manual</strong> Page 305
Output Characteristics<br />
Terminal Limit min typ max unit<br />
1D-4D Output sink current (output low) - - 100 mA<br />
(1D-3D Output high voltage (no load) - 4.1 - V<br />
for DT81) Pull up resistance - 47k - Ω<br />
5D-8D Output high voltage - 4.1 - V<br />
(4D for Pull down resistance - 200k - Ω<br />
DT81)<br />
1RELAY Contact rating @ 30Vdc - - 1.0 A<br />
High Speed Counter Inputs<br />
Input Characteristics<br />
Terminal Limit min typ max unit<br />
1C-2C Input terminal voltage<br />
-10 - 10 V<br />
Warning Voltages outside this range can cause permanent damage.<br />
3C-4C<br />
Input high voltage – counter mode, e.g. 1HSC 2.1 - - V<br />
Input low voltage – counter mode - - 0.75 V<br />
Input high voltage – phase encoder mode, e.g. 1PE 3.0 - - V<br />
Input low voltage – phase encoder mode - - 0.8 V<br />
Input high voltage – low threshold option, e.g. 1HSC(LT) 7 - - mV<br />
Input low voltage – low threshold option - - 2 mV<br />
Input low pulse width – relay/switch input 40 - - μs<br />
Input high pulse width – relay/switch input 1400 - - μs<br />
Input frequency – relay/switch input - - 500 Hz<br />
Input low pulse width – 5V TTL input 40 - - μs<br />
Input high pulse width – 5V TTL input 20 - - μs<br />
Input frequency – 5V TTL input - - 10k Hz<br />
Input terminal voltage<br />
-30 - 30 V<br />
Warning Voltages outside this range can cause permanent damage.<br />
Input high voltage – counter mode, e.g. 3HSC 3.0 - - V<br />
Input low voltage – counter mode - - 0.6 V<br />
Input high voltage – phase encoder mode, e.g. 2PE (<strong>DT80</strong>), 1PE 3.0 - - V<br />
(DT81)<br />
Input low voltage – phase encoder mode - - 0.8 V<br />
Input low pulse width – relay/switch input 10 - - μs<br />
Input high pulse width – relay/switch input 1400 - - μs<br />
Input frequency – relay/switch input - - 500 Hz<br />
Input low pulse width – 5V TTL input 10 - - μs<br />
Input high pulse width – 5V TTL input 5 - - μs<br />
Input frequency – 5V TTL input - - 10k Hz<br />
Serial Channels<br />
Number of Ports<br />
Item DT81 DT82E <strong>DT80</strong> DT85<br />
SDI-12 network connections (shared with digital I/O) 1 1 4 4<br />
Total possible SDI-12 sensors 10 10 40 40<br />
RS232/422/485 serial sensor port (shared with host communications) - - 1 1<br />
RS232 serial sensor port (shared with host communications) 1 1 1 1<br />
USB port (shared with host communications) 1 - 1 1<br />
SDI-12<br />
<br />
<br />
<br />
Supports SDI-12 protocol versions 1.0 through 1.3 (auto-sensing)<br />
Measure on Demand and Continuous Measurement modes<br />
Includes facility for directly interrogating sensors for diagnostic purposes<br />
Generic Serial Sensor Channel<br />
<br />
<br />
Allows data to be logged from a wide range of smart sensors and data streams.<br />
Flexible poll string generation and response parsing<br />
UM-0085-B2 <strong>DT80</strong> <strong>Series</strong> User’s <strong>Manual</strong> Page 306
Supports polled or unsolicited data<br />
Includes facility for directly interrogating sensors for diagnostic purposes<br />
Data Manipulation and Logging<br />
Calculated Channels<br />
Combine values from analog, digital and serial sensors using expressions involving variables and functions.<br />
Functions: An extensive range of arithmetic, trigonometric, relational, logical and statistical functions are available.<br />
Alarms<br />
Condition: high, low, within range and outside range, optional time specifier<br />
Actions: set digital outputs, transmit message, execute any <strong>DT80</strong> command.<br />
Schedules<br />
Number of schedules: 11<br />
Schedule types: immediate, continuous, timed, polled, digital/counter/serial event, variable change<br />
Conditional schedule execution: digital state or variable<br />
Timed schedule rates: 10ms to days; synchronised to time of day<br />
Data Storage<br />
Internal memory capacity: 128MB (upgradeable)<br />
Removable USB 1.1/2.0 full speed memory device (optional accessory)<br />
Data density: approx. 90,000 data points per megabyte.<br />
Communication Interfaces<br />
Ethernet Port<br />
Interface: 10BaseT (10Mbps)<br />
Protocol: TCP/IP<br />
USB Port (not DT82E)<br />
Interface: USB 1.1/2.0 full speed (virtual COM port)<br />
Protocols: ASCII command, TCP/IP (PPP), Modbus, Serial Sensor<br />
Host RS232 Port<br />
Speed: 300 to 115200 baud (57600 default)<br />
Flow Control: Hardware (RTS/CTS), Software (XON/XOFF), None<br />
Handshake lines: DCD, DSR, DTR, RTS, CTS<br />
Modem support: auto-answer and dial out<br />
Protocols: ASCII Command, TCP/IP (PPP), Modbus, Serial Sensor<br />
Serial Sensor Port (not DT81/82E)<br />
Interface: RS232, RS422, RS485<br />
Speed: 300 to 57,600 baud<br />
Flow Control: Hardware (RTS/CTS), Software (XON/XOFF), None<br />
Protocols: ASCII Command, TCP/IP (PPP), Modbus, Serial Sensor<br />
UM-0085-B2 <strong>DT80</strong> <strong>Series</strong> User’s <strong>Manual</strong> Page 307
Network (TCP/IP) Services<br />
Uses Ethernet and/or Host/USB/serial sensor (PPP) ports<br />
Command Interface Server<br />
Allows access to the ASCII command interface via TCP/IP<br />
Web Server<br />
Configure the <strong>DT80</strong> and access current data and status from a web browser.<br />
Supported browsers: Internet Explorer Version 7 or later, Mozilla Firefox, Google Chrome, Apple Safari<br />
Custom pages can be defined.<br />
Download data in CSV format.<br />
Command interface window.<br />
Define mimic displays.<br />
Modbus Server<br />
Access current data and status from any Modbus client (e.g. SCADA system)<br />
Modbus Client (not DT81/82E)<br />
Poll serial or network Modbus sensors<br />
FTP Server<br />
Access logged data from any FTP client or web browser<br />
FTP Client<br />
Automatically upload logged data direct to an FTP server<br />
SNTP Client<br />
Automatically synchronise system time to NTP server<br />
System<br />
Display and Keypad (not DT81)<br />
Type: LCD, 2 line by 16 characters, backlight.<br />
Display Functions: channel data, alarms, system status.<br />
Keypad: 6 keys for scrolling and function execution.<br />
Status LEDs: 4 (Sample, Disk, Attention, Power)<br />
Firmware Upgrade<br />
RS232, Ethernet (FTP), USB or USB disk.<br />
Real Time Clock<br />
Resolution: 0.2ms<br />
Accuracy: ±1 min/year (0°C to 40°C), ±4 min/year (-40°C to 70°C)<br />
Power Supply<br />
External power input: 10 to 30Vdc<br />
Internal 6V lead acid battery: <strong>DT80</strong>/81: 1.2Ahr, DT85/85G: 4.0Ah, <strong>DT80</strong>G: none<br />
Power output for charging external lead acid battery<br />
UM-0085-B2 <strong>DT80</strong> <strong>Series</strong> User’s <strong>Manual</strong> Page 308
Power Consumption<br />
Peak Power: 12W (12Vdc 1A)<br />
<br />
<strong>DT80</strong>/81/85 approximate average power consumption (10 analog channels):<br />
Schedule Rate Ext 12V power consumption 1.2Ah battery life 4.0Ah battery life<br />
1 sec 1400 mW 6 hours 1 day<br />
5 sec 500 mW 1 day 3 days<br />
1 minute 100 mW 10 days 1 month<br />
1 hour 60 mW 3 months 9 months<br />
<br />
DT82E approximate average power consumption (6 analog channels):<br />
Schedule Rate<br />
Ext 12V power consumption<br />
1 sec 950 mW<br />
5 sec 350 mW<br />
1 minute 40 mW<br />
1 hour 10 mW<br />
Physical and Environment<br />
Construction: Powder coated zinc and anodized aluminium.<br />
Dimensions: <strong>DT80</strong>/81: 180 x 137 x 65mm, DT85: 300 x 137 x 65mm<br />
Weight: <strong>DT80</strong>/81: 1.5kg, DT85: 2.5kg<br />
Temperature range: –45°C to 70°C *<br />
Humidity: 85% RH, non-condensing<br />
* reduced battery life and LCD operation outside range –15°C to 50°C<br />
Accessories Included<br />
Resource CD: includes software, video training, and user manual.<br />
USB communications cable<br />
Line adaptor: 110/240Vac to 15Vdc, 800mA<br />
UM-0085-B2 <strong>DT80</strong> <strong>Series</strong> User’s <strong>Manual</strong> Page 309
CEM20 Specifications<br />
Interfaces<br />
<br />
<br />
<br />
<br />
Power/Control inputs: 12Vdc, ground, serial data, serial clock (from logger or previous CEM20)<br />
Power/Control outputs: 12Vdc, ground, serial data, serial clock (to next CEM20)<br />
Analog output: (to logger channel corresponding to CEM20 address)<br />
20 x 4-wire analog inputs<br />
Connections<br />
<br />
<br />
Max total cable length between data logger and furthest CEM20: 100m<br />
Max supported CEM20 units per data logger:<br />
<strong>DT80</strong> & <strong>DT80</strong>G (<strong>Series</strong> 2 only): 5<br />
DT85 & DT85G (<strong>Series</strong> 2 only): 15<br />
Sampling<br />
<br />
<br />
<br />
<br />
Type: Relay multiplexer<br />
Maximum Input Voltage: 30Vdc<br />
Maximum Sampling Speed: 12Hz<br />
Internal RTD reference junction sensor for thermocouple measurements<br />
System<br />
Status LED: Sample activity<br />
Address Selection: 4-way DIP switch. Address 1-15<br />
Power Supply<br />
Recommended: Logger’s switched 12V output<br />
Alternative: External regulated 12Vdc ± 5%<br />
Power Consumption<br />
Sampling: 0.36W (12V 30mA)<br />
Idle: 0.01W (12V 1mA).<br />
Note that in most cases idle power consumption will be zero because the <strong>DT80</strong>'s 12V output will be turned off when not<br />
sampling.<br />
Physical and Environment<br />
Construction: Powder coated steel and anodized aluminium<br />
Dimensions: 180 x 100 x 50mm<br />
Weight: 0.55kg<br />
Temperature Range: -45°C to 70°C<br />
Humidity: 85% RH, non-condensing<br />
Accessories Included<br />
<br />
Analog and power/control cables for connection to the <strong>DT80</strong><br />
UM-0085-B2 <strong>DT80</strong> <strong>Series</strong> User’s <strong>Manual</strong> Page 310
Command Summary<br />
The following table lists all commands supported by the <strong>DT80</strong>. It does not include:<br />
channel definitions (P26)<br />
schedule definitions (P42)<br />
alarm definitions (P74)<br />
Command Description Page<br />
'comment text comment, remainder of line is ignored by <strong>DT80</strong> 55<br />
* repeat last immediate schedule 49<br />
/switch set switch on (uppercase) or off (lowercase) 201<br />
// set all switches to their power-on default values 201<br />
ALL return current values of all alarm tests 82<br />
n return current value of alarm n's test 82<br />
sched return current value of all alarm tests for schedule sched 82<br />
BEGIN clear current job and begin entry of a new job called UNTITLED 54<br />
BEGIN "jobname" clear current job and begin entry of a new job called jobname 54<br />
CATTN clear Attn LED 111<br />
CERRLOG clear error log 211<br />
CEVTLOG clear event log 211<br />
CHARAC return characterisation report 212<br />
CHARACn return line n of characterisation report 212<br />
CLOSEDIRECTPPP manually close PPP connection on host RS232 port 196<br />
COPY srcfile destfile copy file srcfile to destfile 104<br />
COPYD option=value option=value.. unload data from the specified store file various destinations in 92<br />
various formats<br />
CURJOB return name of current job 56<br />
DEL file delete file file 104<br />
DELALLJOBS<br />
delete program text, archive files, logged data and alarms for all 100<br />
jobs<br />
DELD option=value option=value.. delete logged data 99<br />
DELJOB jobspec delete program text and archive files for specified job(s) 56<br />
DELONINSERT delete ONINSERT.DXC for this <strong>DT80</strong> from USB memory device 57<br />
DELONINSERTALL delete global ONINSERT.DXC from USB memory device 57<br />
DELTREE dir delete directory dir and any subdirectories 104<br />
DELVIDEOS delete all video tutorials 136<br />
DIAL commence modem dialling 176<br />
DIR return directory listing for B:\ 104<br />
DIR dir return directory listing for dir 104<br />
DIRJOBS return a list of all stored jobs 56<br />
DIRTREE dir return directory listing for dir and all subdirectories 104<br />
DT=[dtISO] set <strong>DT80</strong> system date/time to dtISO 205<br />
EAA return <strong>DT80</strong> Ethernet adapter address (MAC address) 180<br />
END complete definition of new job 54<br />
ENDSSDIRECT cancel SSDIRECT mode 284<br />
FACTORYDEFAULTS reset all settings to factory default values 209<br />
FORMAT A: clear and re-format entire file system on USB memory device 104<br />
FORMAT B: DELETEALL clear and re-format entire file system on internal flash drive 104<br />
G start all schedules in current job 52<br />
Gsched start all schedules in schedule sched in current job 52<br />
UM-0085-B2 <strong>DT80</strong> <strong>Series</strong> User’s <strong>Manual</strong> Page 311
Command Description Page<br />
H halt all schedules in current job 52<br />
Hsched halt all schedules in schedule sched in current job 52<br />
HANGUP terminate active modem connection 176<br />
HELP list available help topics 16<br />
HELP topic display quick reference information on specified topic 16<br />
IP return <strong>DT80</strong> IP address 180<br />
IPGW return default gateway IP address 180<br />
IPSN return subnet mask 180<br />
LISTD option=value option=value.. return store file details 88<br />
LOCKJOB jobspec<br />
prevent specified job(s) from being overwritten when a new job is 56<br />
entered<br />
LOG "string" save a user specified message to the event log 211<br />
LOGOFF switch off data/alarm logging for all schedules 84<br />
LOGOFFsched switch off data/alarm logging for schedule sched 84<br />
LOGON switch on data/alarm logging for all schedules 84<br />
LOGONsched switch on data/alarm logging for schedule sched 84<br />
NAMEDCVS return current values of all named channel variables 62<br />
NTP attempt to set time from NTP server 207<br />
Pn return the current value of parameter n 198<br />
Pn=value set parameter n to value 198<br />
PASSWORD return 1 if a comms interface password is set, otherwise 0 159<br />
PASSWORD="password" set comms interface password 159<br />
PAUSE value delay for value ms 80<br />
PH return current host RS232 port parameters 168<br />
PH=baudrate,databits,parity,stopbits, set host RS232 port parameters (all parameters are optional) 168<br />
flow<br />
PROFILE return current settings for all profile keys 202<br />
PROFILE section return current settings for all profile keys in section 202<br />
PROFILE section key return current value of specified profile key 202<br />
PROFILE section key= set specified profile key to default 202<br />
PROFILE section= set all profile keys in section to defaults 202<br />
PROFILE section key=keystring set specified profile key to keystring 202<br />
PS return current serial sensor port parameters 172<br />
PS=mode,baudrate,databits,parity, set serial sensor port parameters (all parameters are optional) 172<br />
stopbits,flow<br />
Q terminate an unload 97<br />
RAINFLOW:maxcyc:rej%:m..nIV return a rainflow analysis report 71<br />
REMOVEMEDIA stop using a USB memory device so it can be safely removed 104<br />
RESET clear current job and reset settings to power-on defaults 208<br />
RUNJOB "jobname" replace current job with specified job 55<br />
RUNJOBONINSERT "jobname" create ONINSERT.DXC for this <strong>DT80</strong> on USB memory device 57<br />
RUNJOBONINSERTALL "jobname" create global ONINSERT.DXC on USB memory device 57<br />
Sn=a,b,c,d"units" define span #n (all parameters other than a and b are optional) 58<br />
SATTN set Attn LED 111<br />
SDI12SEND sdi-chan "sdi-cmd" send the specified SDI-12 command 271<br />
SERVICEDATA {filename} generate service report; optionally write to specified file 212<br />
SETDIALOUTNUMBER "phonenum" set the number to call when DIAL command is issued 176<br />
SETMODBUS channels format scaling define data formats used when communicating with Modbus 151<br />
client system<br />
SHOWPROG jobspec return the program text for the specified job(s) 56<br />
SIGNOFF end comms session (password required to reconnect) 159<br />
SINGLEPUSH generate a hardware reset of the <strong>DT80</strong> 208<br />
UM-0085-B2 <strong>DT80</strong> <strong>Series</strong> User’s <strong>Manual</strong> Page 312
Command Description Page<br />
SSDIRECT port "terminator"<br />
forward all subsequent commands, terminated by specified 284<br />
string, to serial channel port (1=serial sensor, 2=host RS232)<br />
STATUS return a status report 211<br />
STATUSn return line n of the status report 211<br />
STATUS14 "jobname" return internal details about specified job 211<br />
Tn=a,b,c"units"<br />
define thermistor scaling function #n (all parameters other than a 59<br />
are optional)<br />
TEST return a test report 210<br />
TESTn return line n of the test report 210<br />
TYPE file return contents of a text file 104<br />
UERRLOG return contents of error log 211<br />
UEVTLOG return contents of event log 211<br />
UNLOCKJOB jobspec allow specified job(s) to be overwritten when a new job is entered 56<br />
X trigger schedule X 49<br />
Xsched trigger schedule sched 47<br />
Yn=a,b,c,d,e,f"units"<br />
define polynomial function #n (all parameters other than a are 59<br />
optional)<br />
a, b, c, d, e, f a floating point value<br />
actions<br />
command(s) to execute when function menu item selected (max<br />
256 characters)<br />
dir<br />
a directory name including drive and full path<br />
drive<br />
fromISO, toISO, dtISO<br />
jobname<br />
<br />
A: (USB memory device), or<br />
B: (internal file system)<br />
date/time in ISO format (yyyy/mm/dd,hh:mm:ss.sss or<br />
yyyy-mm-ddThh:mm:ss.sss), all time fields are optional<br />
a job name (max 8 characters)<br />
jobspec * (all jobs stored on internal file system), or<br />
keystring<br />
label<br />
<br />
"jobname" (the specified job), or<br />
nothing (the current job)<br />
value of profile key (max 80 characters)<br />
label to display in LCD function menu (max 16 characters)<br />
m, n, value an integer<br />
maxcyc, rej%<br />
rainflow analysis parameters<br />
mode, baudrate, databits, parity, stopbits,<br />
flow<br />
password<br />
phonenum<br />
sched<br />
comms port parameters<br />
comms interface password (max 10 characters)<br />
string of digits or other characters accepted by modem ATD<br />
command<br />
a schedule identifier: A-K or X<br />
sdi-chan SDI-12 channel number (5-8)<br />
sdi-cmd<br />
section, key<br />
srcfile, destfile, file<br />
switch<br />
units<br />
Table 14: <strong>DT80</strong> Command Summary<br />
SDI-12 command (max 29 characters)<br />
profile section and key names (max 80 characters)<br />
a file name including drive and full path<br />
a letter A-Z or a-z<br />
units string to use for scaled channels (max 7 characters)<br />
Note that the spaces shown between commands and parameters are generally optional, e.g. BEGIN"LUPIN" and<br />
BEGIN "LUPIN" are equivalent.<br />
If multiple commands are specified on one line they should normally be separated by semi-colons (;), e.g.:<br />
U; PAUSE 5000; LOGONA<br />
although these may be omitted if the result is unambiguous, e.g.:<br />
GA GB GC LOGONA<br />
UM-0085-B2 <strong>DT80</strong> <strong>Series</strong> User’s <strong>Manual</strong> Page 313
ASCII-Decimal Tables<br />
Decimal ASCII Control Description Decimal ASCII Description Decimal ASCII Description Decimal ASCII Description<br />
0 NUL null 32 space 64 @ 96 ` backquote<br />
1 SOH ^A 33 ! 65 A 97 a<br />
2 STX ^B 34 " dbl quote 66 B 98 b<br />
3 ETX ^C 35 # 67 C 99 c<br />
4 EOT ^D 36 $ 68 D 100 d<br />
5 ENQ ^E 37 % 69 E 101 e<br />
6 ACK ^F acknowledge 38 & 70 F 102 f<br />
7 BEL ^G bell 39 ' quote 71 G 103 g<br />
8 BS ^H backspace 40 ( 72 H 104 h<br />
9 HT ^I tab 41 ) 73 I 105 I<br />
10 LF ^J line feed 42 * 74 J 106 j<br />
11 VT ^K vertical tab 43 + 75 K 107 k<br />
12 FF ^L form feed 44 , comma 76 L 108 l<br />
13 CR ^M carriage 45 – dash 77 M 109 m<br />
return<br />
14 SO ^N 46 . period 78 N 110 n<br />
15 SI ^O 47 / slash 79 O 111 o<br />
16 DLE ^P 48 0 80 P 112 p<br />
17 DC1 ^Q XON 49 1 81 Q 113 q<br />
18 DC2 ^R 50 2 82 R 114 r<br />
19 DC3 ^S XOFF 51 3 83 S 115 s<br />
20 DC4 ^T 52 4 84 T 116 t<br />
21 NAK ^U negative 53 5 85 U 117 u<br />
acknowledge<br />
22 SYN ^V 54 6 86 V 118 v<br />
23 ETB ^W 55 7 87 W 119 w<br />
24 CAN ^X 56 8 88 X 120 x<br />
25 EM ^Y 57 9 89 Y 121 y<br />
26 SUB ^Z 58 : colon 90 Z 122 z<br />
27 ESC escape 59 ; semicolon 91 [ 123 {<br />
28 FS 60 < 92 \ backslash 124 |<br />
29 GS 61 = 93 ] 125 }<br />
30 RS 62 > 94 ^ caret 126 ~ tilde<br />
31 US 63 95 _ underline 127 DEL delete<br />
Table 15: Standard ASCII Characters – boldface indicates LCD-displayable characters<br />
This table lists the standard ASCII character set. The printable characters (codes 32-126) may be directly included in a <strong>DT80</strong><br />
program.<br />
For text strings enclosed by "" within a <strong>DT80</strong> program (e.g. channel name, profile settings, alarm action text, etc. – but not<br />
file names), printable or non printable characters may also be entered using the "control character" notation (e.g. ^M for<br />
carriage return) or by entering a backslash followed by the decimal character code (e.g. \013 for carriage return, \034 for<br />
double quotes). Use ^^ or \\ to insert a single ^ or \ character.<br />
Note that if DeTransfer is used to send the command to the <strong>DT80</strong>, all backslashes must be entered as \\ so that they are<br />
not interpreted by DeTransfer. So to output a single \ in an alarm string you would need to enter e.g.<br />
DO"hello\\\\there"<br />
in the DeTransfer send window.<br />
UM-0085-B2 <strong>DT80</strong> <strong>Series</strong> User’s <strong>Manual</strong> Page 314
Decimal ASCII Description Decimal ASCII Description Decimal ASCII Description Decimal ASCII Description<br />
128 € 160 not used 192 À 224 à<br />
129 not used 161 ¡ 193 Á 225 á<br />
130 ‚ 162 ¢ 194 Â 226 â<br />
131 ƒ 163 £ 195 Ã 227 ã<br />
132 „ 164 ¤ 196 Ä 228 ä<br />
133 … 165 ¥ 197 Å 229 å<br />
134 † 166 ¦ 198 Æ 230 æ<br />
135 ‡ 167 § 199 Ç 231 ç<br />
136 ˆ 168 ¨ 200 È 232 è<br />
137 ‰ 169 © 201 É 233 é<br />
138 Š 170 ª 202 Ê 234 ê<br />
139 ‹ 171 « 203 Ë 235 ë<br />
140 Œ 172 ¬ 204 Ì 236 ì<br />
141 not used 173 - 205 Í 237 í<br />
142 Ž 174 ® 206 Î 238 î<br />
143 not used 175 ¯ 207 Ï 239 ï<br />
144 not used 176 ° 208 Ð 240 ð<br />
145 ‘ 177 ± 209 Ñ 241 ñ<br />
146 ’ 178 ² 210 Ò 242 ò<br />
147 " 179 ³ 211 Ó 243 ó<br />
148 " 180 ´ 212 Ô 244 ô<br />
149 • 181 µ 213 Õ 245 õ<br />
150 – 182 214 Ö 246 ö<br />
151 — 183 · 215 × 247 ÷<br />
152 ˜ 184 ¸ 216 Ø 248 ø<br />
153 185 ¹ 217 Ù 249 ù<br />
154 š 186 º 218 Ú 250 ú<br />
155 › 187 » 219 Û 251 û<br />
156 œ 188 ¼ 220 Ü 252 ü<br />
157 not used 189 ½ 221 Ý 253 ý<br />
158 ž 190 ¾ 222 Þ 254 þ<br />
159 Ÿ 191 ¿ 223 ß 255 ÿ<br />
Table 16: Extended ASCII Characters - Windows CodePage 1252 / ISO-8859-1 (Latin1) – boldface indicates LCD-displayable characters<br />
This table lists an "extended ASCII" character set. Any of these characters may be directly included in a <strong>DT80</strong> program, e.g.<br />
by using a non-US keyboard mapping, or by holding down ALT and typing the 4-digit character code (e.g. ALT-0197 for the<br />
Angstrom symbol).<br />
Within text strings enclosed in "", you can also use the backslash notation (e.g. \176 for a degree symbol).<br />
Note that many different character sets have been defined for the "extended ASCII" character codes (128-255). The<br />
character set shown above is the one most commonly used on Windows based computers, but be aware that some of these<br />
characters may appear differently or not appear at all, depending on the application program and font used to display them.<br />
UM-0085-B2 <strong>DT80</strong> <strong>Series</strong> User’s <strong>Manual</strong> Page 315
Table 17: LCD Character Set<br />
This table lists the characters that can be displayed on the <strong>DT80</strong>'s LCD. Note the differences between this character set and<br />
the previous set. Thus to display a sigma symbol (Σ) on the LCD you would use \246 (240+6) in an alarm text or channel<br />
name/units string.<br />
Note that the <strong>DT80</strong> automatically translates the standard units strings degC, degF, degR and Ohm to °C, °F, °R and Ω when<br />
displaying on the LCD.<br />
UM-0085-B2 <strong>DT80</strong> <strong>Series</strong> User’s <strong>Manual</strong> Page 316
RS-232<br />
Signals<br />
The following table lists the standard RS-232 pinouts for both 9-pin (DE-9) and 25-pin (DB-25) DCE and DTE interfaces.<br />
Normally the DTE (<strong>DT80</strong>, computer) device’s connector is male and the DCE (modem) device’s connector is female.<br />
Signal Function Direction DE-9 Pin DB-25 Pin<br />
DCD Data Carrier Detect DTE DCE 1 8<br />
RXD Receive Data DTE DCE 2 3<br />
TXD Transmit Data DTE DCE 3 2<br />
DTR Data Terminal Ready DTE DCE 4 20<br />
GND Signal Ground 5 7<br />
DSR Data Set Ready DTE DCE 6 6<br />
RTS Request To Send DTE DCE 7 4<br />
CTS Clear To Send DTE DCE 8 5<br />
RI Ring Indicator DTE DCE 9 22<br />
Table 18: RS-232 Pinouts<br />
1 2 3 4 5<br />
5 4 3 2 1<br />
6 7 8 9<br />
male DE-9<br />
9 8 7 6<br />
female DE-9<br />
Figure 135: RS-232 pin numbering<br />
Cables<br />
Host Port null modem cable<br />
For applications where a DTE is connected to another DTE (e.g. a <strong>DT80</strong> is connected to a host computer):<br />
<br />
<br />
<br />
the RXD and TXD signals must be "crossed over" so that one device's TXD is connected to the other device's RXD.<br />
The "Request To Send" output changes its meaning to "Clear To Send Output" (i.e. a device sets it active when it is<br />
able to receive data). This allows hardware flow control to operate in both directions.<br />
DCD, DTR, DSR and RI are not normally used.<br />
The following cable (dataTaker product code IBM-6) is used to connect a PC serial port to the <strong>DT80</strong> host RS232 port. The<br />
cable is terminated by a female DE-9 connector at each end. The wiring is symmetrical, i.e. the cable can be connected<br />
either way around.<br />
1 DCD<br />
2 RXD<br />
3 TXD<br />
4 DTR<br />
5 GND<br />
6 DSR<br />
7 RTS<br />
8 CTS<br />
9 RI<br />
female DE-9<br />
1 DCD<br />
2 RXD<br />
3 TXD<br />
4 DTR<br />
5 GND<br />
6 DSR<br />
7 RTS<br />
8 CTS<br />
9 RI<br />
female DE-9<br />
Figure 136: RS-232 null modem cable (IBM-6)<br />
Host Port modem cable<br />
If a DTE is connected to a DCE then a "straight-through" cable is used. The following cable (dataTaker product code MOD-6)<br />
is used to connect between the <strong>DT80</strong> host port and a modem.<br />
UM-0085-B2 <strong>DT80</strong> <strong>Series</strong> User’s <strong>Manual</strong> Page 317
1 DCD<br />
2 RXD<br />
3 TXD<br />
4 DTR<br />
5 GND<br />
6 DSR<br />
7 RTS<br />
8 CTS<br />
9 RI<br />
<strong>DT80</strong> host port<br />
female DE-9<br />
1 DCD<br />
2 RXD<br />
3 TXD<br />
4 DTR<br />
5 GND<br />
6 DSR<br />
7 RTS<br />
8 CTS<br />
9 RI<br />
modem<br />
male DE-9<br />
Figure 137: RS-232 modem cable (MOD-6)<br />
Serial Sensor Port null modem cable<br />
The following cable (dataTaker product code CAB-015) is used to connect a PC to the <strong>DT80</strong> serial sensor port. This cable is<br />
also often used to connect the dataTaker CANgate product to the serial sensor port.<br />
DGND<br />
CTS<br />
RTS<br />
Rx<br />
Tx<br />
<strong>DT80</strong> serial<br />
sensor port<br />
terminal block<br />
BLK<br />
YEL<br />
WHT<br />
PUR<br />
RED<br />
1 DCD<br />
2 RXD<br />
3 TXD<br />
4 DTR<br />
5 GND<br />
6 DSR<br />
7 RTS<br />
8 CTS<br />
9 RI<br />
PC / CANgate<br />
female DE-9<br />
Figure 138: serial sensor RS-232 null modem cable (CAB-015)<br />
Note This cable is only applicable if the serial sensor port mode is set to RS232.<br />
UM-0085-B2 <strong>DT80</strong> <strong>Series</strong> User’s <strong>Manual</strong> Page 318
Upgrading <strong>DT80</strong> Firmware<br />
The <strong>DT80</strong>’s "operating system" (or firmware) is stored in the <strong>DT80</strong>’s Flash memory. This means that you can easily upgrade<br />
your <strong>DT80</strong>’s firmware:<br />
using a USB memory device, or<br />
from a host computer running DeTransfer, or<br />
using an FTP client<br />
It is strongly recommended that you keep your <strong>DT80</strong> up-to-date with the latest firmware. Firmware files are available for free<br />
download from www.datataker.com in the Support/Downloads area.<br />
The same firmware is used for all <strong>DT80</strong> series products (<strong>DT80</strong>, <strong>DT80</strong>G, DT81, DT85 and DT85G). The firmware upgrade file<br />
is named according to its firmware version number – for example, <strong>DT80</strong>-8040001.zip is <strong>DT80</strong>/81/85 firmware Version<br />
8.02.0001 (normally referred to as just "8.04").<br />
Two different firmware packages are available:<br />
The standard package (<strong>DT80</strong>-8040001.zip) is suitable for <strong>Series</strong> 2 loggers<br />
For <strong>Series</strong> 1 loggers, use <strong>DT80</strong>-8040001-series1.zip. This contains the same firmware, but the files relating to the<br />
enhanced web interface are not included, as it is not supported on <strong>Series</strong> 1 loggers.<br />
The above packages are suitable for upgrade using a connected computer running DeTransfer.<br />
Packages are also available for upgrade via USB memory device or FTP. These files have a –usbdisk suffix, e.g.<br />
<strong>DT80</strong>-8040001-usbdisk.zip.<br />
Important All firmware packages include release notes, which describe the changes made in the release and other<br />
information. Always check the release notes for any changes to the upgrade procedure documented here.<br />
Recommended Preparation<br />
In most cases a firmware upgrade can be performed without disturbing the <strong>DT80</strong>'s settings or logged data, although the job<br />
will need to be reloaded if it is not an ONRESET job. If any special procedures are required, these will be detailed in the<br />
firmware release notes.<br />
It is recommended, however, that you carry out the following procedure before upgrading the <strong>DT80</strong>’s firmware to ensure that<br />
nothing is lost in the event of a problem during the upgrade.<br />
1. Connect to the <strong>DT80</strong> using dEX or DeTransfer.<br />
2. Save any previously logged data stored in the <strong>DT80</strong>’s internal memory by unloading it to the host computer or copying<br />
to a USB memory device.<br />
3. In the dEX web interface, note any important profile settings, such as Ethernet IP Address. If you are using DeTransfer<br />
or other terminal software, you can issue the PROFILE command to return the current profile settings.<br />
4. Power the logger from an external supply, and ensure that the internal battery is connected and is fully charged.<br />
5. Verify that there is sufficient free space on the <strong>DT80</strong>'s internal flash disk, as described below.<br />
You are now ready to perform the firmware upgrade.<br />
Note If you have previously used the <strong>DT80</strong> web interface then it is recommended that you clear your web browser's cache to<br />
ensure that after the upgrade you are running the correct version of the web interface. (The browser cache, also referred to<br />
as "temporary internet files", holds copies of downloaded files on the computer's hard disk.)<br />
Free Disk Space<br />
As part of the firmware upgrade process, files may be installed on to the internal flash disk (B:). It is therefore necessary to<br />
ensure that there is sufficient free space on this drive before starting the upgrade. To check the free space, type DIR "B:"<br />
in DeTransfer, or use the Storage status screen in the enhanced web interface.<br />
The standard and <strong>Series</strong> 1 firmware packages install approximately 10MB of files. If these files do not already exist then<br />
10MB of free space will be required.<br />
Note When upgrading using a USB memory device or FTP, a temporary copy of the installation files is made on the internal<br />
flash disk. This means that a minimum of 10MB free space is required during installation, or double this if the files do not<br />
already exist on the logger.<br />
UM-0085-B2 <strong>DT80</strong> <strong>Series</strong> User’s <strong>Manual</strong> Page 319
Firmware Upgrade – USB Flash Device<br />
The simplest way to upgrade the <strong>DT80</strong> firmware is by using a USB memory device. This is also convenient if you have<br />
several loggers to upgrade.<br />
1. Obtain the appropriate firmware upgrade zip file from www.datataker.com or your Datataker representative. This file<br />
should have a –usbdisk suffix.<br />
2. Extract all files from the zip file into the root directory of a USB memory device.<br />
3. Ensure that the <strong>DT80</strong> is powered up and awake, then Insert the USB memory device into the logger. The<br />
oninsert.dxc file on the USB device will then run. This will:<br />
a) copy the firmware upgrade files to the <strong>DT80</strong> internal memory (during this time the green Disk LED will flash), then<br />
b) start the firmware upgrade, which will proceed in a similar way to the RS232/USB method.<br />
4. The logger will automatically restart once the upgrade is complete.<br />
5. Check the firmware version displayed on the LCD, or send the TEST0 command.<br />
Firmware Upgrade – Host USB or RS232 Port<br />
Here’s the procedure for upgrading the firmware of a <strong>DT80</strong> by using DeTransfer (Version 3.18 or later) on a computer<br />
directly connected to the <strong>DT80</strong>’s USB or Host RS-232 port.<br />
The firmware upgrade procedure is as follows:<br />
1. Obtain the appropriate firmware upgrade zip file from www.datataker.com or your Datataker representative. This file<br />
should not have a –usbdisk suffix. Extract all files from the zip file.<br />
2. Review the release notes (which were in the zip file). These identify the changes that have been made to the firmware,<br />
may dictate a change to the upgrade procedure described here.<br />
3. Connect the host computer to the <strong>DT80</strong> using USB. RS232 may also be used (57600 baud, 8 data bits, no parity,<br />
1stop bit)<br />
Start DeTransfer.<br />
4. If you are using USB then the DtUsb driver software will need to be disabled in order to make the USB virtual COM<br />
port available to DeTransfer. Open the DtUsb GUI by double clicking on the purple system tray icon, or selecting<br />
DtUsb in the Windows start menu. Then click Quit to shut down DtUsb.<br />
5. In DeTransfer:<br />
a) Open a connection to the <strong>DT80</strong><br />
b) Choose Upgrade Firmware (<strong>DT80</strong>/800) from the File menu.<br />
c) Select the correct firmware file, then press OK<br />
6. The upgrade process will now proceed automatically. The <strong>DT80</strong>’s LEDs will flash and the LCD display should indicate<br />
that the upgrade is progressing. You will notice that the upgrade proceeds through three phases:<br />
a) A special "loader" program is downloaded to the logger (Attn LED flashes and display shows: DT8x Bootstrap)<br />
b) The main firmware package is downloaded to the logger (Sample LED flashes and display shows: DT8x Loader).<br />
This package normally consists of a number of files (which are installed onto the internal B: drive), followed by the<br />
firmware proper (which is installed into a special area of flash memory).<br />
Note If one or more of the files in the firmware package cannot be installed onto the <strong>DT80</strong>'s internal drive (e.g. due to<br />
insufficient disk space) then an error message (e.g. fwrite: Cannot write data) will be returned to the host<br />
computer and the <strong>DT80</strong> will restart. The firmware version will not have changed. Press the Details button on the<br />
firmware upgrade window to see status and error messages returned by the logger.<br />
c) A hard reset is performed (display shows the normal "sign-on" screen)<br />
Important During the upgrade, do not remove any cables, or reset or power-down the <strong>DT80</strong>.<br />
7. Once the upgrade is complete, check that the version number displayed on the sign-on screen is correct. For example<br />
if the file <strong>DT80</strong>-8040001.dxf was loaded then the display should indicate <strong>DT80</strong> V8.04.<br />
8. Connect to the <strong>DT80</strong> and re-load the required job if required.<br />
The upgraded <strong>DT80</strong> is now ready for use.<br />
UM-0085-B2 <strong>DT80</strong> <strong>Series</strong> User’s <strong>Manual</strong> Page 320
Firmware Upgrade – Remote TCP/IP<br />
The following method can be used to upgrade a <strong>DT80</strong> via a remote TCP/IP connection (Ethernet or PPP).<br />
1. Obtain the appropriate firmware upgrade zip file from www.datataker.com or your Datataker representative. This file<br />
should have a –usbdisk suffix.<br />
2. Extract all files from the zip file into a convenient temporary folder.<br />
3. Load the dEX web interface and open the command window. Alternatively, run DeTransfer and make a TCP/IP<br />
connection to the logger.<br />
4. Connect to the logger using an FTP client. For example, enter<br />
ftp://username:password@ip-address<br />
into the address bar of Windows Explorer (where username and password are the logger's configured FTP username<br />
and password, and ip-address is the logger's IP address).<br />
You should see the contents of the root directory of the logger's internal drive (B:), which will normally contain<br />
EVENTS, INI and JOBS folders, along with a file called FAILSAFE.<br />
5. Upload the LOADER.S and FIRMWARE.BIN files (which you extracted from the zip file) into the logger's root directory<br />
(e.g. by dragging them from the temporary folder where you saved them).<br />
6. Refresh the FTP view to confirm that the files are present. Close the FTP client.<br />
7. In the dEX or DeTransfer send window, type !BOOTIT and press Enter. The upgrade will now start.<br />
8. Disconnect from the logger in dEX or DeTransfer, wait 10 minutes, then re-connect.<br />
9. Verify the new firmware version by sending TEST0<br />
Reverting Back to Old Firmware<br />
The above procedures can also be used to revert back to an earlier version of the firmware, should that be required. The<br />
resource CD shipped with the logger contains a copy of the original firmware that was installed on the <strong>DT80</strong>. Contact<br />
dataTaker support if you need to obtain an installation file for any other non-current firmware version.<br />
In Case of Failed Upgrade<br />
In the unlikely event that something goes wrong during an upgrade (e.g. power to the <strong>DT80</strong> or host computer is lost, or the<br />
firmware file is corrupted), use the following recovery procedure.<br />
1. Reset the <strong>DT80</strong> by inserting a paper clip or similar into the reset hole (Figure 80 (P214))<br />
2. If the old firmware starts correctly, simply repeat the above upgrade procedure.<br />
3. If the firmware does not start correctly (i.e. the normal sign-on display is not shown and the <strong>DT80</strong> does not respond to<br />
commands, or the <strong>DT80</strong> continuously resets) then hold down the Edit/OK key and reset the <strong>DT80</strong>. The Attn LED<br />
should now be flashing slowly (5s on, 5s off) and the display should show <strong>DT80</strong> Bootstrap. Release the Edit/OK<br />
key.<br />
4. At this point you should now be able to repeat the above upgrade procedure using the USB/RS232 method.<br />
If the upgrade repeatedly fails to complete then click the Details button during the upgrade and check for error messages in<br />
the small text window that appears. It is possible that there is insufficient free space on the internal B: drive, for example.<br />
UM-0085-B2 <strong>DT80</strong> <strong>Series</strong> User’s <strong>Manual</strong> Page 321
Error Messages<br />
Standard Messages<br />
The <strong>DT80</strong> returns a message when it detects an error in a command, or an operational difficulty. The form of the error report<br />
is controlled by the /U switch. The default is the verbose form shown in the table below. If the switch is set to /u the error<br />
message is reduced to an error number (e.g. E3). (Note this Switch also reduces the verbosity of other returned data).<br />
Error messages can be switched off by the /m switch. The default is for errors to be reported (/M). During an unload<br />
operation, error reporting is disabled until the unload is complete.<br />
If an error is detected during job entry (i.e. between BEGIN and END) then the remainder of the job is ignored.<br />
The table below lists all of the <strong>DT80</strong> errors, along with an explanation of their likely cause and/or correction.<br />
Error Number and Description<br />
Error Category<br />
Cause/Action Syntax Operation Memory Reading Hardware<br />
E1 – Time set error<br />
<br />
Must be in format defined by P39 and P40<br />
Illegal separator or non-digits entered<br />
E2 – Command line too long<br />
<br />
Command too long (maximum 250 characters)<br />
E3 – Channel option error<br />
<br />
Illegal channel option used<br />
Incompatible options used<br />
Option invalid for channel type<br />
E7 – Day set error<br />
<br />
Illegal day number entered<br />
E8 – Parameter read/set error<br />
<br />
Parameter index out of range<br />
Parameter value out of range<br />
E9 – Switch error<br />
<br />
Illegal switch command character<br />
E10 – Command error<br />
<br />
Unrecognised keyword<br />
E12 – Channel list error<br />
<br />
Channel number outside the legal range<br />
Incomplete channel sequence<br />
Invalid channel type<br />
Polynomials or spans index out of range<br />
E18 – STATUS command error<br />
<br />
STATUSn outside the range 1 to 14<br />
E23 – Scan schedule error<br />
<br />
Schedule ID not A-K, X or S<br />
Scan time interval too large<br />
Scan interval type invalid<br />
Event or counter channels invalid<br />
E25 – Channel table full<br />
<br />
Internal acquisition and alarm table filled (maximum<br />
1000 entries). Additional channels cannot be declared<br />
E29 – Poly/span declaration error<br />
<br />
Polynomial or span index out of range (1 to 50)<br />
Individual terms not separated by a comma<br />
Range of terms outside 1.0e–18 to 1.0e18<br />
E30 – Analog measurement fault<br />
<br />
Faulty circuit board, circuit board connector, or circuit<br />
board power supply<br />
UM-0085-B2 <strong>DT80</strong> <strong>Series</strong> User’s <strong>Manual</strong> Page 322
Error Number and Description<br />
Error Category<br />
Cause/Action Syntax Operation Memory Reading Hardware<br />
<br />
If fault persists after a hard reset contact your<br />
Datataker representative.<br />
E32 – Job not found<br />
The named job cannot be found.<br />
E37 – No current job<br />
A command was entered that operates on the current<br />
job, but there is no job currently loaded.<br />
E39 – Channel list fixed /F<br />
Changes to program are not allowed<br />
E42 – USB device not ready<br />
No USB memory device inserted<br />
<strong>DT80</strong> has not yet read the required system<br />
information from the device (wait a few seconds)<br />
USB device is faulty or not a memory device<br />
E49 – Job has logged data/alarms<br />
A job that has logged data cannot be deleted. Delete<br />
the data first.<br />
E50 – Job locked<br />
A job that has been locked cannot be modified<br />
E51 – ALARM/IF command error<br />
Setpoint character , or >< missing<br />
AND, OR, XOR incorrectly entered<br />
Setpoint not specified or too large<br />
Delay incorrectly specified<br />
E52 – Text memory full<br />
Memory for storage of alarm and expression text is full<br />
E54 – Expression error<br />
Syntax error<br />
Expression too complex<br />
E65 – ALARM undefined<br />
Alarm n does not exist<br />
E74 – Serial sensor CTS detect timeout<br />
Serial sensor: CTS did not go to the required state<br />
within timeout period<br />
E75 – Serial sensor transmit timeout<br />
Serial sensor was not able to transmit (e.g. due to flow<br />
control state) within the timeout period<br />
E80 – Serial device not responding<br />
no response received from SDI-12 sensor<br />
check cabling and sensor address<br />
E81 – Serial device invalid response<br />
garbled response received from SDI-12 sensor<br />
check for address conflict<br />
check for electrical noise<br />
E82 – Serial device data not available<br />
SDI-12 sensor doesn't support the requested<br />
measurement<br />
sensor doesn't support continuous mode<br />
E89 – Serial sensor receive timeout<br />
Serial sensor: expected characters were not received<br />
within timeout period<br />
E90 – Serial sensor scan error<br />
Serial sensor: could not convert the received text as<br />
specified in the control string<br />
E101 – Undefined reference: name<br />
No channel was found with the specified name<br />
<br />
<br />
<br />
<br />
<br />
<br />
<br />
<br />
<br />
<br />
<br />
<br />
<br />
<br />
<br />
<br />
<br />
<br />
<br />
<br />
<br />
UM-0085-B2 <strong>DT80</strong> <strong>Series</strong> User’s <strong>Manual</strong> Page 323
Error Number and Description<br />
Error Category<br />
Cause/Action Syntax Operation Memory Reading Hardware<br />
E102 – Storefile record size too large<br />
There are too many logged channels in the schedule<br />
E103 – Invalid storefile: filename<br />
The indicated storefile appears to be corrupted<br />
E104 – Drive format failed<br />
Unable to format the specified drive. It may be<br />
write-protected or damaged.<br />
E105 – Invalid PROFILE section/key name<br />
Check spelling of section and key name in PROFILE<br />
command<br />
E106 – Invalid PROFILE value<br />
Check that value being set in PROFILE command is<br />
valid<br />
E107 – Counter is already used as a trigger<br />
The specified counter is already used as a schedule<br />
trigger and cannot be used again.<br />
E109 – File IO error: detailed description<br />
<br />
An error occurred while reading or writing to a file on<br />
one of the drives (A: or B:). The detailed description<br />
will contain exact details of the error type. For<br />
example, a write-protected file cannot be written to.<br />
E110 – Error accessing storefile: detailed<br />
description<br />
An error occurred while reading or writing to a storefile<br />
containing logged data. The file may be corrupted.<br />
E112 – Parameter/option conflict<br />
The specified combination of command parameters or<br />
channel options are not valid<br />
E113 – Schedule option error<br />
Invalid schedule option specified<br />
E114 – Command parameter error<br />
Invalid parameter specified for a command<br />
E115 – Serial sensor string error<br />
Invalid syntax within serial sensor control string<br />
E116 – Cannot log: detailed description<br />
<br />
<br />
The <strong>DT80</strong> cannot log data for one or more schedules<br />
for the indicated reason<br />
If the problem was that an existing job of the same<br />
name had logged data/alarms then you need to give<br />
the new job a different name, or delete the old job’s<br />
data using DELDATA/DELALARMS<br />
E117 – Incompatible schedule store units and<br />
trigger<br />
You can only specify storefile size by time (e.g. 12<br />
hours data) if the schedule trigger is time based.<br />
E118 – Error accessing drive x: detailed<br />
description<br />
The indicated drive (A: or B:) could not be accessed<br />
Media may be absent, not formatted or faulty.<br />
E119 – No matching storefiles found<br />
There are no storefiles for the specified job/schedule<br />
E122 – Command incompatible with configured<br />
port function<br />
nSERIAL channel or trigger defined, or SSDIRECT<br />
command used, and specified serial port has not been<br />
configured as a serial channel in the profile<br />
E123 – SSDIRECT mode already active<br />
<br />
SSDIRECT command was issued but SSDIRECT<br />
mode is already active on another comms port. Use<br />
ENDSSDIRECT to cancel SSDIRECT mode.<br />
<br />
<br />
<br />
<br />
<br />
<br />
<br />
<br />
<br />
<br />
<br />
<br />
<br />
<br />
<br />
<br />
<br />
<br />
<br />
<br />
UM-0085-B2 <strong>DT80</strong> <strong>Series</strong> User’s <strong>Manual</strong> Page 324
Error Number and Description<br />
Error Category<br />
Cause/Action Syntax Operation Memory Reading Hardware<br />
E124 – Modbus transaction failed<br />
could not establish connection to Modbus slave<br />
device, or no response to request<br />
E125 - Modbus - write attempt to read-only<br />
register<br />
Modbus discrete inputs and input registers (types 1<br />
and 3) cannot be written to using an expression<br />
E126 - Modbus not supported on this channel<br />
Modbus channel should be 1,2,3 or 4<br />
E127 - Modbus IP address specified on serial<br />
channel<br />
E128 - Modbus serial address specified on<br />
TCP/IP channel<br />
or no address specified<br />
E129 – Modbus - unexpected format of response<br />
packet<br />
E130 - Modbus - unexpected function id in<br />
response<br />
E131 - Modbus - exception response received<br />
slave device does not support the requests used by<br />
the <strong>DT80</strong>.<br />
E132 - Modbus - error in definition of CV<br />
block to send<br />
invalid CV index<br />
E133 - Modbus - reading values to CVs<br />
prevents writing<br />
MODBUS channel cannot write values from CVs and<br />
also assign to CVs<br />
E134 - Modbus - 32 bit format not applicable<br />
to discrete transfer<br />
MBL, MBF options are not applicable when reading<br />
1-bit registers (coils/discrete inputs)<br />
E135 - Modbus - volume of data to transfer<br />
exceeds Modbus message capacity<br />
limit is 123 16-bit registers or 1968 1=bit registers<br />
Table 19: <strong>DT80</strong> Error Messages<br />
<br />
<br />
<br />
<br />
<br />
<br />
<br />
<br />
<br />
<br />
<br />
<br />
UM-0085-B2 <strong>DT80</strong> <strong>Series</strong> User’s <strong>Manual</strong> Page 325
Data Errors<br />
Errors may also occur even though the <strong>DT80</strong>'s measurement system is operating normally – for example if an analog input is<br />
out of range or a connected sensor does not perform correctly. In some cases, the <strong>DT80</strong> returns an error message (see<br />
"Reading" error category in the above table), but mostly there is no message returned. Instead, the <strong>DT80</strong> flags the logged<br />
and/or returned data value as invalid.<br />
Each logged reading has an associated "data state", which identifies whether that particular reading is valid or invalid. The<br />
following data states are possible:<br />
Value when unloaded<br />
Logged data state CSV/free format fixed format Description<br />
OK measured value measured value No error<br />
Overrange OverRange 99999.9 input voltage exceeds max positive input voltage<br />
input voltage exceeds positive linearization limit for sensor<br />
input frequency too high (F channel type)<br />
Underrange UnderRange -99999.9 input voltage exceeds max negative input voltage<br />
input voltage exceeds negative linearization limit for sensor<br />
input frequency too low (F channel type)<br />
Not Yet Set NotYetSet -9e9 <strong>DT80</strong> analog hardware fault<br />
insufficient samples have been taken to calculate a<br />
statistical value<br />
could not read a valid value from a serial device<br />
Reference Error RefError 8e9 Thermocouples and some bridges require a separate reference<br />
channel measurement as part of the measurement process. This<br />
error indicates that although this channel's raw measurement was<br />
OK, the associated reference channel measurement was not.<br />
Calculation<br />
Error<br />
Error -8e9 Maths error such as division by zero<br />
<strong>DT80</strong> Abnormal Resets<br />
If a serious internal hardware or firmware failure occurs, the <strong>DT80</strong> will normally force a hardware reset (equivalent to a<br />
SINGLEPUSH command). A message will be displayed on the LCD (e.g. SW Exception) and the Attn LED will flash until<br />
a keypad button is pressed.<br />
Additional technical details about the cause of the reset will generally be logged to the <strong>DT80</strong>'s event and error log files. You<br />
can view these files using the UEVTLOG and UERRLOG commands, or via the web interface.<br />
Abnormal resets should never occur, but if you do experience one please contact Datataker support. It will assist us if you<br />
can provide the following details:<br />
SERVICEDATA report<br />
the job that was running at the time<br />
any other details regarding how the <strong>DT80</strong> is set up (How does the <strong>DT80</strong> communicate with the host How is it<br />
powered What host application(s) are being used)<br />
the circumstances leading up to the failure (How many times has this happened What was the logger doing<br />
immediately prior to the failure).<br />
UM-0085-B2 <strong>DT80</strong> <strong>Series</strong> User’s <strong>Manual</strong> Page 326
Glossary<br />
4–20mA loop<br />
A common industrial measurement standard. A transmitter controls a current in the range of 4 to 20mA as a function of a<br />
measurement parameter. Any receiver(s) or indicator(s) placed in series can output a reading of the parameter. Main<br />
advantage is 2-wire connection and high immunity to noise pick-up. Usually powered from a 24V supply.<br />
50/60Hz rejection<br />
The most common source of noise is that induced by AC power cables. This noise is periodic at the line frequency. <strong>DT80</strong>s<br />
are able to reject most of this noise by integrating the input for exactly one line cycle period (20.0 or 16.7ms).<br />
Ω<br />
ohm, a unit of resistance<br />
µA<br />
microamp, 10 -6 A<br />
µs<br />
microsecond, 10 -6 s<br />
µStrain<br />
microstrain, strain expressed in parts per million (ppm). Strain is a measure of the stress-induced change in length of a body.<br />
µV<br />
microvolt, 10 -6 V<br />
A<br />
Ampere or amp, a unit of current<br />
actuator<br />
A device that converts a voltage or current input into a mechanical output.<br />
ADC<br />
Analog-to-Digital Converter. Part of the <strong>DT80</strong>’s input circuitry that converts an analog input voltage to a digital number (in<br />
other words, it converts a smoothly-varying signal to a quantised digital value). The <strong>DT80</strong> is a digital instrument, and<br />
therefore requires an ADC to convert analog sensor signals into digital form prior to processing. Important characteristics of<br />
an ADC are its linearity, resolution, noise rejection and speed.<br />
ADC settling time<br />
See channel settling time (P328).<br />
Ah<br />
Ampere-hour, a unit of electrical charge, often used when referring to battery capacity<br />
analog<br />
a quantity that can vary continuously through a potentially infinite number of values — for example, the time swept out by the<br />
hands of a clock, or the output of a thermocouple. Compare with digital.<br />
analog ground<br />
Reference point for the <strong>DT80</strong>'s instrumentation amplifier. This ground is normally isolated from any other ground point so it<br />
can "float" up or down to match the common mode voltage of the input. This isolation extends the <strong>DT80</strong>'s common mode<br />
voltage limits, and helps prevent ground loops.<br />
ASCII<br />
American Standard Code for Information Interchange. A coding system designed for standardising data transmission to<br />
achieve hardware and software compatibility. It assigns a 7-bit code to each of the 128 standard characters: 96 visible<br />
characters — letters, numbers and punctuation marks (including the space character); 32 hardware control characters —<br />
sounding a bell, advancing a printer page, carriage return, line feed and so on.<br />
asynchronous<br />
Not synchronised, not occurring at pre-determined or regular intervals. A telephone conversation is asynchronous because<br />
both parties can talk whenever they like. In an asynchronous communications channel, data is transmitted intermittently<br />
rather than in a constant stream.<br />
Auto-IP<br />
A system where a device on a TCP/IP network can, in the absence of a DHCP server, automatically select its own IP address<br />
UM-0085-B2 <strong>DT80</strong> <strong>Series</strong> User’s <strong>Manual</strong> Page 327
and other network parameters.<br />
autoranging<br />
The process of changing amplifier gain automatically so that the signal is amplified as much as is possible without exceeding<br />
output limits.<br />
base date and time<br />
The <strong>DT80</strong>’s base date is 0:00:00 on 01/01/1989. All timestamps are stored as offsets from this point in time.<br />
bit<br />
The smallest unit of information in a computer. A bit has a single value: either 0 or 1. Computers generally store information<br />
and execute instructions in bit-multiples called bytes.<br />
brackets and braces<br />
Delimiters:<br />
Delimiter<br />
( ) Round brackets<br />
(parentheses)<br />
[ ] Square brackets<br />
{ } Curly brackets<br />
(braces)<br />
bps<br />
Function<br />
bits per second, a measure of data transfer rate<br />
bridge<br />
<br />
<br />
<br />
<br />
<br />
<br />
<br />
identify channel options, e.g. 1V("Flow Rate",Y1)<br />
group terms within expressions, e.g. 1CV=3.14*(2CV+3CV)<br />
enclose a time/date value in current format, e.g. U(11/9/2007,12:03:00)<br />
enclose channel variable to be used within a serial prompt or parse command, e.g.<br />
1SERIAL("%f[17CV]")<br />
enclose a time/date value in dataTaker ISO or ISO8601 format, e.g.<br />
U[2007/09/11,12:03:00] or U[2007-09-11T12:03:00]<br />
enclose channels and commands to be conditionally executed within ALARM and IF<br />
statements , e.g. ALARM1(2CV>3){1CV=1CV+1 HB}<br />
signify output actions in the serial sensor command, e.g.<br />
1SERIAL("{MD004}%f[1CV]")<br />
A sensitive and stable means of measuring small changes in resistances. They are particularly useful when applied to strain<br />
gauges (as found in pressure sensors and load cells). See Bridges (P240).<br />
buffer<br />
An area of memory where data is held temporarily until the system is ready for it, or in case it is needed in the future.<br />
byte<br />
A unit of information that is eight bits long<br />
Carlson meter<br />
A sensor for measuring strain, which works by detecting the change in resistance of a pair of steel wires.<br />
carriage return (CR)<br />
an ASCII character (code 13 decimal) often used to mark the end of a line of text or a data record.<br />
channel definition<br />
A channel’s ID followed by any channel options (in round brackets). See Figure 7(P42).<br />
channel ID<br />
A channel’s number and type (e.g. 3TK). See Components of a typical schedule command (P42).<br />
channel list<br />
A list of channel definitions within one report schedule.<br />
channel settling time<br />
The time allowed for the input signal to the ADC to stabilise before it is measured. This can be controlled using the<br />
measurement delay (MDn) channel option.<br />
channel table<br />
An internal <strong>DT80</strong> data structure that stores details of all defined channels. The channel table is limited to a maximum of 1000<br />
entries.<br />
A channel table entry is used each time a channel is referenced in the current job. For example, the job<br />
RA10S T 4V 1CV(W)=1CV+1 ALARM2(1CV>10)"boo"{1DSO=0}<br />
uses 5 channel table entries (for T, 4V, 1CV, 1CV and 1DSO).<br />
UM-0085-B2 <strong>DT80</strong> <strong>Series</strong> User’s <strong>Manual</strong> Page 328
clock<br />
The <strong>DT80</strong> a real-time clock/calendar, which you can set to your actual time<br />
CMRR<br />
Common-Mode Rejection Ratio. A measure of the influence of common-mode voltage (unwanted) on the output of the<br />
<strong>DT80</strong>’s instrumentation amplifier (see common-mode voltage (P329) below).<br />
More precisely, CMRR is the ratio of the common-mode voltage at the amplifier’s input to the common-mode voltage at the<br />
amplifier’s output, expressed in dB. It indicates the quality of a measuring system’s input electronics. Relevant to basic<br />
(differential) inputs only.<br />
CMRR 20 log<br />
where<br />
V CM<br />
V out<br />
A V<br />
command line<br />
V<br />
V<br />
out<br />
CM<br />
A<br />
is an applied common-mode<br />
voltage<br />
is the resulting output voltage<br />
is the amplifier's voltage gain<br />
V<br />
One or more <strong>DT80</strong> commands typed one after the other, separated by tab or space characters, and ending with a return<br />
character. Limited to a maximum of 250 characters (including spaces, tabs, underscores,…). For example<br />
RA10S T 4V 5TK<br />
is a command line made up of four <strong>DT80</strong> commands (separated by spaces).<br />
common-mode voltage<br />
An unwanted AC and/or DC voltage that offsets both inputs to the <strong>DT80</strong>’s instrumentation amplifier (with respect to amplifier<br />
ground). It is unwanted because it usually originates from nuisance sources such as electrical noise, DC offset voltages<br />
caused by the sensors or the equipment being measured, or from ground loops.<br />
Typically in industrial measurement, the sensor signals you apply to the <strong>DT80</strong>’s input terminals consist of<br />
<br />
<br />
the small component you want to measure (a few mV to a few tens of mV), PLUS<br />
a large unwanted component (a few V to a few tens of V) — the common-mode voltage.<br />
V Wanted<br />
Instrumentation amplifier<br />
(precision, differential, analog input amplifier)<br />
V Unwanted<br />
V Out = Gain x V Diff (ideally)<br />
V Unwanted = V Common-mode (V CM)<br />
V Wanted = V Differential (V Diff)<br />
Figure 139: Common-mode voltage VCM and Differential voltage (VDiff) - 1<br />
When the <strong>DT80</strong> makes a measurement, both of these components are applied to the inputs of the its instrumentation<br />
amplifier. Then, when configured for basic (differential) use, the amplifier does two things:<br />
It rejects most of the common-mode voltage (the unwanted signal). How well the amplifier does this is indicated by its<br />
common-mode rejection ratio — see CMRR (P329).<br />
It amplifies the difference between the signals on its two inputs. This is the wanted signal and is called the differential<br />
voltage — see differential voltage (P330).<br />
Common-mode voltage is calculated as the average of the voltages between the measurement system’s ground and the two<br />
input terminals:<br />
V in (= V 2 Ð V 1)<br />
V 1<br />
V 2<br />
V out<br />
Figure 140: Common-mode voltage VCM and Differential voltage (VDiff) — 2<br />
CR<br />
See carriage return (P328).<br />
crest factor<br />
The peak-to-RMS voltage ratio of an AC signal (Crest factor (P330)).<br />
A pure sine wave has a crest factor of 1.414. If the crest factor is less than 1.4, the waveform is flattened; if the crest factor is<br />
UM-0085-B2 <strong>DT80</strong> <strong>Series</strong> User’s <strong>Manual</strong> Page 329
greater than 1.4, the waveform is peaked.<br />
Peak value<br />
RMS value<br />
Crest factor =<br />
Peak value<br />
RMS value<br />
Figure 141: Crest factor<br />
DAC<br />
Digital-to-Analog-Converter<br />
data acquisition system<br />
A measurement system that scans a range of analog and digital channels, converts the readings to digital format, and<br />
forwards the data to a host. The host does any storage or data manipulation required. See also logging (P332).<br />
data logging system<br />
A data acquisition system with its own on-board data storage and manipulation facilities. See also logging (P332).<br />
dataTaker<br />
The name of the family of stand-alone data logging, acquisition and associated equipment manufactured by Biolab (Aust.)<br />
Pty Ltd trading as Datataker.<br />
dataTaker releases:<br />
1983 dataTaker DT100<br />
1987 dataTaker DT200<br />
1990 dataTaker DT500 series, DT600 series, and the DT50<br />
2000 dataTaker <strong>DT80</strong>0<br />
2005 dataTaker <strong>DT80</strong><br />
2006 dataTaker DT81<br />
2007 dataTaker DT85<br />
2008 dataTaker <strong>DT80</strong>/81/85 <strong>Series</strong> 2, <strong>DT80</strong>G/85G, CEM20<br />
DCE<br />
Data Communications Equipment. A DCE device (a modem, for example) enables a DTE device (such as a computer or a<br />
<strong>DT80</strong>) to communicate over phone lines or data circuits. A DCE device connects to the RS-232 interface of a DTE device.<br />
default<br />
An attribute, value or option that is assumed if none is explicitly specified. A state or group of operating conditions<br />
(determined by the manufacturer and factory-set) to which the <strong>DT80</strong> automatically reverts after a reset.<br />
DHCP<br />
Dynamic Host Configuration Protocol. A system for automatically setting the IP address and other network parameters for a<br />
device on a TCP/IP network.<br />
differential input<br />
An analog input where the difference between two voltages is measured, without reference to ground or any other common<br />
point. For example the 1V command measures the differential voltage between the 1+ and 1- terminals.<br />
differential voltage<br />
The difference between the voltages on the two inputs of the <strong>DT80</strong>’s instrumentation amplifier. See common-mode voltage<br />
(P329).<br />
digital<br />
a quantity that is represented by a number that has a finite number of possible values. The number of bits used to store a<br />
digital value determines the resolution, i.e. how close two values can be and still be resolved (distinguished). Some<br />
quantities are inherently digital, e.g. a logic signal or switch (whose state can be represented by 1 bit)<br />
digital ground<br />
The reference point for most of the <strong>DT80</strong>'s circuits, e.g. power, communications, digital I/O – everything except the analog<br />
input sub-system (see analog ground (P327)).<br />
direct commands<br />
Commands that perform direct tasks within the <strong>DT80</strong> the moment they are sent (for example, switch, parameter, unload,<br />
alarm, job and delete commands).<br />
directory<br />
an area on a data storage device used to store related files. Also known as a folder.<br />
DNS<br />
Domain Name Service, a TCP/IP network protocol. Networked devices, such as the <strong>DT80</strong>, send requests to a DNS server<br />
UM-0085-B2 <strong>DT80</strong> <strong>Series</strong> User’s <strong>Manual</strong> Page 330
whenever they need to translate a domain name (e.g. ftp.moose.com.au) into a numeric IP address (e.g. 203.111.202.44)<br />
DTE<br />
Data Terminal Equipment. The information source and/or destination in an RS-232 communications link. The <strong>DT80</strong>’s Host<br />
RS-232 port and Serial Channel are DTE devices, as is a PC’s RS-232 port (serial port).<br />
The RS232 standard was originally designed for connecting a DTE to a DCE (e.g. a modem). However, a DTE can also be<br />
directly connected to another DTE by means of a null-modem cable<br />
echo<br />
A communications option for commands you send to the <strong>DT80</strong>. When echo is turned on see Table 5: <strong>DT80</strong> Switches (P201)<br />
, commands you send to the <strong>DT80</strong> are automatically returned to the host computer screen.<br />
Echo is useful for troubleshooting: when the echo is on, you can see by the returned commands that the <strong>DT80</strong> is actually<br />
receiving them. (Once you’re confident that it is receiving, you can turn the echo off.) Also, any error message appears right<br />
under the echo of the erroneous command, making the error obvious.<br />
EEPROM<br />
Electrically-Erasable Programmable Read-Only Memory. A special type of PROM that can be erased by exposing it to an<br />
electrical charge. Requires data to be written or erased one byte at a time (compare with Flash (P331) below). Retains its<br />
contents even when power is unavailable.<br />
enable<br />
Turn on or activate<br />
Ethernet<br />
A standard method for connecting a network of computers so that they can share information. The <strong>DT80</strong> supports "10<br />
Base-T" Ethernet, that is it operates at a data rate of 10Mbps and uses Twisted-pair cable. See Ethernet Communications<br />
(P215).<br />
firmware<br />
The "operating system" software stored inside the <strong>DT80</strong>. The <strong>DT80</strong>’s firmware is semi-permanent, and you can upgrade it<br />
with a simple file transfer.<br />
Flash<br />
A special type of EEPROM that can be erased and reprogrammed in blocks (instead of one byte at a time — compare with<br />
EEPROM (P331) above). Flash memory is therefore much faster to erase and re-write. Retains its contents even when power<br />
is unavailable. The <strong>DT80</strong>’s firmware is stored in Flash memory. See also Upgrading <strong>DT80</strong> Firmware (P319).<br />
flow control<br />
The process of controlling the flow of information between communications devices. For example, if data is being sent too<br />
quickly from a <strong>DT80</strong> to its host computer, the computer tells the <strong>DT80</strong> to temporarily stop sending data; then when the<br />
computer has caught up, it tells the <strong>DT80</strong> to resume sending data. Hardware handshaking (hardware flow control; RTS/CTS)<br />
and software handshaking (software flow control; XON/XOFF) are alternative mechanisms of flow control.<br />
folder<br />
Another name for directory<br />
format<br />
A specific way of organising related information. For example, the <strong>DT80</strong>'s internal data memory is formatted as a<br />
DOS/Windows compatible file system.<br />
FTP<br />
File Transfer Protocol. A TCP/IP protocol for copying files from one computer to another.<br />
Gray code<br />
A binary numbering system where two successive values differ by only one bit. Rotary or linear position encoders frequently<br />
provide Gray-coded outputs to avoid the possibility of erroneous readings due to multiple bits changing not quite<br />
simultaneously.<br />
For example, a 3-bit Gray code sequence is 000, 001, 011, 010, 110, 111, 101, 100.<br />
ground<br />
A common return path that is the zero voltage reference level for the equipment or system. It may not necessarily be<br />
connected to earth.<br />
ground loops<br />
More often that not, grounds in a measurement system are not at the same electrical potential — differences may be from<br />
microvolts to many volts. Then, if signal wires happen to connect different grounds together, currents can flow and result in<br />
unpredictable measurement errors. These unintended conduction paths are referred to as ground loops. The <strong>DT80</strong> has<br />
been designed for maximum immunity to ground loops — see Ground Loops (P298).<br />
UM-0085-B2 <strong>DT80</strong> <strong>Series</strong> User’s <strong>Manual</strong> Page 331
host computer<br />
The computer you use for supervising the <strong>DT80</strong><br />
host software<br />
The software you run on the host computer to supervise the <strong>DT80</strong>. See <strong>DT80</strong>-Friendly Software (P13)<br />
hunting<br />
An undesirable oscillation<br />
HWFC<br />
Hardware flow control (RTS/CTS). Also known as hardware handshaking. See flow control (P331).<br />
A device using hardware flow control monitors its Clear To Send (CTS) input and will not send data until the signal is active.<br />
Conversely, a device indicates that it can receive data by driving its RTS output active (which is then connected to the other<br />
device's CTS input)<br />
Hz<br />
Hertz, a unit of frequency<br />
instrumentation amplifier<br />
A precision differential amplifier for amplifying the <strong>DT80</strong>’s analog input signals (wanted) and rejecting any common-mode<br />
voltage (unwanted).<br />
IP address<br />
A device’s address on a TCP/IP Ethernet network. Every device connected to an Ethernet network must be assigned its own<br />
unique IP Number. An IP address is written as four decimal numbers e.g. 192.168.1.209<br />
ISO<br />
International Organization for Standardisation<br />
job<br />
A logical "hold-all" for a group of schedules and other commands, and related data and alarms. Each job has a name and a<br />
directory structure that organizes this information. See Jobs (P21).<br />
kB<br />
kilobyte, 1024 bytes<br />
kbps<br />
kilobits per second, 1024 bps<br />
Kelvin sense point<br />
A particular point in a measurement circuit where a measurement should be made to ensure the best possible accuracy by<br />
ensuring that unwanted voltage drops due to current flows are minimized. Symbol<br />
LED indicator<br />
Light-emitting diode indicator. The <strong>DT80</strong> has three LEDs on the front panel, which light to indicate Sampling, Internal Disk<br />
Activity, Attention Required and Power Status.<br />
logging<br />
Recording or storing data. The <strong>DT80</strong> logs data to its internal memory and/or an external USB memory device. Logging is a<br />
separate, user-configurable operation that the <strong>DT80</strong> performs in addition to its basic function of data acquisition (taking<br />
measurements from sensors connected to its inputs). See also data logging system (P330) and data acquisition system (P330).<br />
lsb<br />
least significant bit (within a byte)<br />
LSB<br />
Least Significant Byte (within a multi-byte word)<br />
mΩ<br />
milliohm, 10 -3 <br />
mA<br />
milliamp, 10 -3 A<br />
MB<br />
megabyte, 1048576 bytes<br />
Mbps<br />
Megabits per second<br />
UM-0085-B2 <strong>DT80</strong> <strong>Series</strong> User’s <strong>Manual</strong> Page 332
Modbus<br />
A widely used control and automation communications protocol, often used in SCADA systems.<br />
monolithic sensors<br />
Also called IC (Integrated Circuit) sensors. Sensors that are constructed on a single piece of silicon using integrated circuit<br />
fabrication techniques. Available sensors include those for measuring temperature (see Temperature – AD590 <strong>Series</strong> IC<br />
Sensors (P248)), pressure, acceleration and concentration of various compounds in gases and liquids.<br />
ms<br />
millisecond, 10 -3 s<br />
msb<br />
most significant bit (within a byte)<br />
MSB<br />
Most Significant Byte (within a multi-byte word)<br />
multidrop<br />
In communications, a multidrop configuration allows multiple devices to be connected in parallel by means of a single<br />
twisted-pair cable. This requires that each device switch off (tri-state) its transmitter when it is not actively transmitting.<br />
multiplexer<br />
A "many-in, one-out" switching network that allows many input signals to time-share one analog input circuit. It sequentially<br />
routes multiple channels to a single signal processing system.<br />
NAT<br />
Network Address Translation. A system used by TCP/IP routers to allow a small number of public IP addresses to be shared<br />
by many different devices on a private network.<br />
noise<br />
Unwanted voltage or current (generally with an AC component) superimposed on the wanted signal.<br />
null-modem cable<br />
A communications cable for connecting two DTE devices together (for example, a PC to another PC, or a <strong>DT80</strong> to a PC).<br />
Also known as a crossover cable.<br />
nybble<br />
Half a byte (four bits)<br />
parse<br />
To identify components of a command string<br />
PC<br />
A personal computer of the IBM or IBM-compatible type. (Although the Macintosh is technically a PC, it is not referred to as<br />
such.)<br />
PCB<br />
Printed Circuit Board<br />
peak-to-peak<br />
The value of an alternating quantity measured from its negative peak to its positive peak.<br />
Peak-to-peak (p-p)<br />
Figure 142: Peak-to-peak measurement<br />
period<br />
The time taken for a cyclic event to repeat itself. Reciprocal of frequency:<br />
1<br />
Period <br />
Frequency<br />
PLC<br />
Programmable Logic Controller. Used to automate monitoring and control of industrial equipment.<br />
plug-and-play<br />
A device whose characteristics are automatically determined when it is plugged in. All USB devices are plug-and-play.<br />
UM-0085-B2 <strong>DT80</strong> <strong>Series</strong> User’s <strong>Manual</strong> Page 333
polling<br />
Requesting information<br />
port<br />
A plug, socket or interface that enables connection to another device for information transfer. For example, the <strong>DT80</strong> has<br />
three ports for communicating with a host computer: Ethernet, USB and RS232.<br />
port (TCP/IP)<br />
A logical endpoint for a connection between two applications over a TCP/IP network. This allows multiple independent<br />
connections to exist over the one physical cable. For example, an application such as DeTransfer can connect to port 7700<br />
to access the logger's command interface, and at the same time a web browser can connect to port 80 to access the logger's<br />
web interface.<br />
PPP<br />
Point-to-Point Protocol. A low-level protocol that allows TCP/IP based protocols to be used over an RS232 connection.<br />
process list<br />
The part of a schedule command that follows the schedule header and trigger, and lists the processes you want the schedule<br />
to carry out. It may include, for example, a channel list and an IF command.<br />
program<br />
A <strong>DT80</strong> program is a group of one or more jobs or commands that you send to the <strong>DT80</strong>.<br />
protocol<br />
The language (or set of rules) that devices use to communicate over a network. For the Information Superhighway, think of<br />
protocols as the "rules of the road". All devices on a network must use the same protocol to communicate with each other.<br />
See TCP/IP (P335).<br />
RAM<br />
Random Access Memory. Memory that allows the storage locations within it to be accessed (written to or read from) directly<br />
(non-sequentially). This characteristic makes RAM very fast. Often simply called memory.<br />
RAM disk<br />
An area of RAM configured by a software program to emulate a disk drive.<br />
real-time<br />
As it happens. The <strong>DT80</strong> can return data directly to the host computer in real time — that is, as each scan is made, its<br />
resulting data is returned to the host computer straight away and displayed on-screen immediately.<br />
resolution<br />
The smallest detectable increment of measurement — that is, the smallest change in input that produces a detectable<br />
change in output. In the field of data acquisition, resolution is the number of bits that the ADC uses to represent the analog<br />
signal — the greater the resolution, the smaller the changes in input signal that can be resolved/detected.<br />
retrieve<br />
To unload or return data and other information from the <strong>DT80</strong> to the host computer, either by:<br />
<br />
<br />
ROM<br />
Unloading through one of the <strong>DT80</strong>’s communications interfaces<br />
Unloading by temporarily inserting a USB memory device into the <strong>DT80</strong><br />
Read Only Memory. Memory that can be randomly read from but not normally written to. The <strong>DT80</strong> uses flash ROM.<br />
RS-232<br />
A common communications and interface standard for connecting two serial devices in a point to point configuration.<br />
RS232 uses a negative voltage (typically –5V) to represent a logic "0" and a positive voltage (typically +5V) to represent a<br />
logic "1". These signals are with respect to a common ground terminal, hence RS232 is said to use single-ended signalling.<br />
RS-422<br />
Another communications interface standard for point to point connection of serial devices. RS-422 uses differential signalling<br />
(a pair of wires for each signal, no signal-ground connection) which provides improved noise immunity and allows operation<br />
over longer distances than RS-232.<br />
RS-485<br />
Yet another communications interface standard. Like RS-422, RS-485 uses differential signalling. RS-485 is designed for<br />
multi-drop operation over a single shared pair of wires. RS-485 is therefore a half duplex protocol –only one device can<br />
transmit at any one time.<br />
RTD<br />
Resistance Temperature Detector. A resistive sensor that changes resistance with changes in temperature.<br />
UM-0085-B2 <strong>DT80</strong> <strong>Series</strong> User’s <strong>Manual</strong> Page 334
sampling speed<br />
The maximum rate at which analog-to-digital conversions can be done. This includes any channel selection time, settling<br />
time (for the signal to stabilise) and processing time (if required).<br />
SCADA<br />
Supervisory Control and Data Acquisition. SCADA systems are used to monitor and control plant status and provide data<br />
logging facilities.<br />
schedule<br />
A collection of channel definitions which will be evaluated when a certain trigger condition is true (e.g. the required time<br />
interval has elapsed, or a digital input has changed state)<br />
schedule header<br />
The schedule’s ID and trigger, e.g. RA1S — see Figure 7(P42).<br />
SDI-12<br />
Serial Data Interface – 1200 baud. A 3-wire multi-drop serial sensor interface, and associated protocol.<br />
serial<br />
One by one. In serial data transfer, data is sent in a single stream of bits, one bit at a time, one after the other. The opposite<br />
of serial is parallel. In parallel data transfer, several streams of bits are sent concurrently.<br />
settling time<br />
The time allowed for an input signal to stabilise after the <strong>DT80</strong> selects the channel, selects the gain, and applies excitation (if<br />
required). See channel settling time (P328).<br />
shared-terminal inputs<br />
Analog inputs where a common reference is used. Also called single-ended inputs. For example, the 1*V, 1+V and 1-V<br />
commands all measure single-ended voltages relative to a common point (the 1# terminal)<br />
See Shared-Terminal Analog Inputs (P18).<br />
shield<br />
A conductor surrounding input signal wires that is generally connected to the <strong>DT80</strong>'s ground. The purpose is to shield the<br />
input signal from capacitively-coupled electrical noise. Such a shield provides little protection from magnetically-induced<br />
noise.<br />
stand-alone<br />
Not connected to a host computer. The <strong>DT80</strong> is designed to operate in stand-alone mode: once programmed, you can<br />
disconnect the <strong>DT80</strong> from the host computer leaving the <strong>DT80</strong> operating totally independently. Later, to download data or<br />
reprogram the <strong>DT80</strong>, you reconnect the host computer.<br />
state<br />
Of an alarm: the true/false result of an alarm test.<br />
SWFC<br />
Software flow control (XON/XOFF). Also known as software handshaking. See flow control (P331).<br />
A device using software flow control will stop transmitting if an XOFF character is received and will resume when an XON<br />
character is received.<br />
switch<br />
A two-state (ON or OFF) command that changes a <strong>DT80</strong> internal setting. For example, sending the switch command /R to<br />
the <strong>DT80</strong> turns ON the return-of-data-to-the-host-computer switch, and sending /r turns it OFF. See Switches (P201) for a<br />
complete listing.<br />
syntax error<br />
An error in the order, arrangement or spelling of the components of a command.<br />
TCP/IP<br />
Transmission Control Protocol / Internet Protocol. A commonly-used family of communication protocols. TCP/IP protocols<br />
are used on the <strong>DT80</strong>’s Ethernet interface, and can also be used on an RS232 link if PPP is enabled.<br />
All TCP/IP protocols allow data to be transported across a local area network or the Internet.<br />
TCP<br />
Transmission Control Protocol. TCP is the default TCP/IP protocol used by the <strong>DT80</strong> to communicate over an Ethernet or<br />
PPP link.<br />
TCP provides:<br />
flow control (prevents data being sent faster than it can be received)<br />
reliable data transfer (errors are detected and data is automatically re-sent)<br />
UM-0085-B2 <strong>DT80</strong> <strong>Series</strong> User’s <strong>Manual</strong> Page 335
support for application protocols, such as e-mail and FTP<br />
thermocouple<br />
A temperature-sensing device constructed from dissimilar metals. See Temperature – Thermocouples (P244).<br />
transducer<br />
A device that converts a physical parameter (temperature, for example) into an electrical voltage or current. It is usually a<br />
sensor with additional electronics for signal conditioning and scaling.<br />
UART<br />
Universal Asynchronous Receiver/Transmitter. A hardware component that provides an RS232 serial interface. The <strong>DT80</strong><br />
uses two UARTs – one for the host RS232 port, one for the serial sensor.<br />
UDP<br />
User Datagram Protocol. A component of the TCP/IP suite of protocols. UDP is a simple "connectionless" protocol that<br />
operates in a similar way to an RS232 link, except that the link can be across a LAN or the Internet.<br />
Unlike TCP, UDP does not guarantee that all data will be delivered.<br />
unshared input<br />
a differential input.<br />
URI<br />
Uniform Resource Identifier. A standard way of identifying a resource (such as a file) on a TCP/IP network. The <strong>DT80</strong> uses<br />
a URI to specify the destination when uploading to an FTP server.<br />
USB<br />
Universal Serial Bus. A standard method of connecting peripheral devices to a host computer. The <strong>DT80</strong> operates both as a<br />
USB device (when talking to a host computer) and as a USB host (when talking to a USB memory device).<br />
See USB (P160)<br />
USB Memory Device<br />
A memory device designed to be connected to USB. These devices can either be hard disk drives or flash memory devices.<br />
They are generally powered from the USB port.<br />
V<br />
volt, a unit of electrical potential (voltage)<br />
version number<br />
The version number of the <strong>DT80</strong>’s firmware consists of a major number, a minor number and a build number, e.g. for Version<br />
6.18.0002, the major number is 6, the minor number is 18 and the build number is 2.<br />
vibrating wire strain gauge<br />
a sensor for measuring strain, which works by detecting changes in the resonant frequency of a steel wire as its length<br />
changes.<br />
whitespace<br />
The set of "blank" ASCII characters, namely ASCII character codes 9 (tab), 10 (line feed), 11 (vertical tab), 12 (form feed), 13<br />
(carriage return) and 32 (space).<br />
XON/XOFF<br />
Transmitter on / transmitter off. Control characters used for software flow control (SWFC), instructing a device to start<br />
transmission (XON) and end transmission (XOFF).<br />
YSI<br />
Yellow Springs Instruments, a manufacturer of thermistors.<br />
UM-0085-B2 <strong>DT80</strong> <strong>Series</strong> User’s <strong>Manual</strong> Page 336
Index<br />
12V terminal 222<br />
Accuracy 305<br />
Adaptive scheduling 80<br />
AGND terminal 295, 298<br />
Alarm 74<br />
Action Processes 79<br />
Order of Execution 79<br />
Action Text 43, 77, 78, 107<br />
Destination 77<br />
Special Characters 78<br />
Substitution Characters 78<br />
Combining Alarms 76<br />
Condition 75<br />
Condition Time Specifier 75<br />
Digital Action 77<br />
Display 108<br />
Number 75<br />
Polling Alarm State 83<br />
Repeating (IF) 74<br />
Alarm Commands<br />
ALARM 74<br />
ALARMR 74<br />
DO 52, 74<br />
IF 74<br />
Analog Channels 17<br />
Attenuators 38, 232, 296<br />
Block Diagram 294<br />
Excitation 19, 237, 296<br />
Gain 18, 38, 232<br />
Independent Input Configuration 233, 234, 236<br />
Input Terminals 18, 231, 295<br />
Multiplexers 18<br />
Shared Input Configuration 18, 233, 234, 235, 335<br />
Termination 38, 296<br />
ASCII-Decimal Tables 314<br />
Auto-IP 181, 327<br />
Battery 215, 220, 223, 230<br />
Charger 220<br />
Charging Link 220<br />
Display 107<br />
External 219, 220, 221<br />
Memory Backup 216, 223<br />
Operating Time 220, 227<br />
Storage 222<br />
Boolean Expression 76<br />
Brackets and braces 328<br />
Bridges 28, 240, 304, 328<br />
3 wire, current excitation 243<br />
4 wire, current excitation 242<br />
4 wire, voltage excitation 242<br />
6 wire, voltage excitation 241<br />
Calculation 61<br />
Calculations 62<br />
Calibration<br />
<strong>DT80</strong> 199, 201, 208, 210<br />
Sensor 58, 59<br />
Carlson Sensor 255<br />
CEM20 12, 300<br />
Troubleshooting 303<br />
Channel Factor 28, 35, 36, 38, 58<br />
Channel List 42<br />
Channel Name 41<br />
Channel Number 27<br />
modifier 27<br />
Sequence 28<br />
Channel Option 35, 38<br />
Default 28, 37<br />
Mutually Exclusive 36<br />
Order of Application 36<br />
Channel Options<br />
=CV 40<br />
2V 38, 252<br />
3W 38<br />
4W 28, 38, 237<br />
A 38<br />
ADn 40<br />
AV 40, 68, 69<br />
BG 41, 107<br />
BR 40, 241<br />
CM 40, 272, 274<br />
DF 39, 67<br />
DMN 40, 68, 69<br />
DMX 40, 68, 69<br />
DT 39, 67<br />
E 38<br />
ESn 38<br />
FEn 41<br />
FFn 41<br />
FMn 41<br />
Fn (function) 39, 60<br />
GL300MV 38<br />
GL30MV 38<br />
GL30V 38<br />
GL3V 38<br />
H (histogram) 40, 70<br />
I 38<br />
IB 39, 67, 69<br />
II 38, 237<br />
UM-0085-B2 <strong>DT80</strong> <strong>Series</strong> User’s <strong>Manual</strong> Page 337
IMN 40, 68, 69<br />
IMX 40, 68, 69<br />
INT 40, 68, 69<br />
LT 38, 266, 306<br />
MDn 38, 299, 328<br />
MN 40, 68, 69<br />
Modbus 40<br />
MX 40, 68, 69<br />
N 38<br />
NA 38<br />
ND 41, 76, 108<br />
NL 22, 41, 84<br />
NR 41<br />
NSHUNT 39<br />
NUM 40, 68<br />
R 39<br />
RAINFLOW 40, 71, 72, 73<br />
RC 39, 67<br />
Rnnn 40, 272<br />
RS 39, 67, 269<br />
SD 40, 50, 68, 69<br />
Sn (span) 39, 58<br />
T 30, 38<br />
TFF 39, 67, 68<br />
TFR 39, 67<br />
TMN 40, 68, 69<br />
TMX 40, 68, 69<br />
Tn (thermistor) 39, 59<br />
TOF 39, 67, 68<br />
TOR 39, 67<br />
TR 33, 39, 245<br />
TRF 39, 68<br />
TRR 39, 67<br />
TZ 40<br />
U 38<br />
V 38<br />
W 61, 84, 108, 142, 201<br />
Yn (polynomial) 39, 59<br />
Channel Type 20, 28<br />
Channel Types<br />
$ 29, 32<br />
AD5xx 29, 35, 248<br />
AS 30, 35<br />
BGI 28, 35, 240, 242, 243<br />
BGV 28, 35, 240, 241, 242<br />
C 30, 35<br />
CALC 29<br />
CMRR 30, 210, 329<br />
CU 29, 35, 247<br />
D 29, 31<br />
DB 30, 35<br />
DBO 30, 35, 262<br />
DELAY 29, 80, 271<br />
DN 30, 35<br />
DNO 30, 35, 262<br />
DS 30<br />
DSO 30, 33, 35, 265<br />
F 28, 35<br />
HSC 30, 35<br />
HV 28, 35, 241, 242<br />
I 28, 35<br />
IBAT 30, 210, 223<br />
IV 29, 72<br />
L 28, 35<br />
LMx35 29, 35, 251<br />
LMxx 29, 249, 250<br />
MODBUS 29<br />
NI 28, 35, 247<br />
PE 30, 268<br />
PT3xx 28, 247, 260, 261<br />
R 28, 35<br />
R100 30<br />
Reference 29<br />
REFT 30, 245<br />
RELAY 30, 35, 77, 175, 262, 265<br />
SDI12 29<br />
SERIAL 29, 35, 275<br />
SSPORT 29, 30, 35<br />
T 29, 31<br />
TMPxx 29, 248, 249<br />
TR 39<br />
Tx (thermocouple) 28, 35<br />
V 28, 35<br />
VANA 30, 210<br />
VBAT 30, 210, 221, 223, 224<br />
VDD 30, 210<br />
VEXT 30, 210, 223, 224<br />
VLITH 30, 210, 223<br />
VREF 30, 210<br />
VRELAY 30, 210<br />
VSYS 30, 210<br />
VZERO 30<br />
WARN 30, 35<br />
YSxx 29, 35, 246<br />
Channel units 41<br />
Channel Variable (CV) 29, 35, 61, 208<br />
UM-0085-B2 <strong>DT80</strong> <strong>Series</strong> User’s <strong>Manual</strong> Page 338
Name 62<br />
Channels 26<br />
Clock/Calendar 31, 205<br />
Command Interface 186<br />
Commands<br />
* 49, 311<br />
83, 311<br />
ALARM<br />
See Alarm Commands<br />
BEGIN 21, 49, 51, 54, 55, 311<br />
CATTN 111, 311<br />
CERRLOG 211, 311<br />
CEVTLOG 211, 311<br />
CHARAC 311<br />
CLOSEDIRECTPPP 311<br />
COPY 104, 105, 311<br />
COPYDATA 103, 311, 312<br />
CURJOB 56, 311<br />
DEL 104, 311<br />
DELALARMS 54, 56, 87, 100<br />
DELDATA 54, 56, 87, 100, 104<br />
DELJOB 100, 311<br />
DELONINSERT 57, 311<br />
DELONINSERTALL 311<br />
DELTREE 104, 311<br />
DELVIDEOS 136, 311<br />
DIAL 176, 311<br />
DIR 84, 85, 87, 104, 311<br />
DIRJOB 104<br />
DIRJOBS 56, 311<br />
DIRTREE 84, 102, 104, 311<br />
DO<br />
See Alarm Commands<br />
DT= 205, 311<br />
EAA 180, 311<br />
END 21, 51, 54, 311<br />
ENDSSDIRECT 284, 311<br />
FACTORYDEFAULTS 209, 311<br />
FORMAT 103, 104, 105, 311<br />
G 52, 311<br />
H 52, 312<br />
HANGUP 176, 312<br />
HELP 16, 312<br />
IF<br />
See Alarm Commands<br />
IP 312<br />
IPGW 180, 312<br />
IPSN 180, 312<br />
LOCKJOB 54, 56, 312<br />
LOG 211, 312<br />
LOGOFF 84, 312<br />
LOGON 84, 312<br />
MOVEDATA 82<br />
NAMEDCVS 62, 312<br />
PASSWORD 159, 312<br />
PAUSE 80, 312<br />
PH 169, 172, 312<br />
Pn 312<br />
PROFILE 198, 201, 202, 204, 312<br />
PS 312<br />
Q 312<br />
RAINFLOW 312<br />
REMOVEMEDIA 86, 104, 105, 312<br />
RESET 61, 198, 201, 208, 262, 312<br />
RUNJOB 55, 82, 312<br />
RUNJOBONINSERT 57, 312<br />
RUNJOBONINSERTALL 57, 312<br />
SATTN 111, 312<br />
SDI12SEND 271, 312<br />
SETDIALOUTNUMBER 176, 203, 312<br />
SETMODBUS 151, 312<br />
SHOWPROG 56, 312<br />
SIGNOFF 160, 312<br />
SINGLEPUSH 57, 61, 160, 169, 172, 186, 198, 201,<br />
208, 312, 326<br />
Sn 58, 312<br />
SSDIRECT 284, 313<br />
STATUS 211, 313<br />
STATUS14 212, 313<br />
TEST 210, 211, 313<br />
Tn 60, 313<br />
TYPE 313<br />
UERRLOG 211, 313, 326<br />
UEVTLOG 211, 313, 326<br />
UNLOCKJOB 54, 56, 313<br />
X 47, 49, 313<br />
Yn 59, 313<br />
Comment 55, 311<br />
Common Mode Voltage 233, 329<br />
Communications 156<br />
Command Interface 159<br />
Ports 157<br />
Protocols 156<br />
Configuration Line 36<br />
Counter Channels 266<br />
High Speed Counter 30, 208, 265, 267<br />
Phase Encoder 30, 268<br />
CSV 24<br />
Current 28, 235, 304<br />
Current Loop, 4-20mA 28, 237, 304<br />
UM-0085-B2 <strong>DT80</strong> <strong>Series</strong> User’s <strong>Manual</strong> Page 339
Date 29, 200<br />
DBD 25<br />
DCE 317, 330, 331<br />
DeLoad 13<br />
DeTransfer 13<br />
dEX 13<br />
DGND terminal 170, 260, 267, 295, 298<br />
DHCP 177, 181, 330<br />
Diagnostics 154, 176, 199, 200, 274, 285, 293<br />
Differential Voltage 329<br />
Digital Channels 19, 259<br />
Counter 208<br />
Input 260<br />
Input Specifications 261<br />
Output 208, 261<br />
Digital Manipulation 39<br />
Directory (folder) 84, 330<br />
DNS 178<br />
DNS server 204<br />
DT81 12, 330<br />
DT82E 12<br />
DT85 12, 222, 234, 294, 295, 296, 330<br />
DT8xG 12<br />
DTE 317, 330, 331<br />
DtUsb 160<br />
Echo 201, 331<br />
Error Message 322<br />
Ethernet 177, 331<br />
Direct Connection 178<br />
LAN Connection 178<br />
LEDs 179<br />
settings 180<br />
Expressions 64<br />
EXT * terminal 38<br />
EXT# terminal 295, 298<br />
File System 84, 102<br />
Firmware 2, 319<br />
Fixed Format Mode 23<br />
Flash 319, 331<br />
Flow Control 167, 173<br />
Format of Returned Data 23<br />
Free Format Mode 23<br />
Frequency 28, 252, 269, 304<br />
Front Panel 106, 214<br />
FTP 143, 148, 186, 204<br />
Gateway 178<br />
Gray code 331<br />
Ground Loop 298<br />
Hardware Reset 214<br />
Histogram<br />
See H Channel Option<br />
Host Port 77, 149, 168, 171, 203, 204, 229, 288<br />
Baud Rate 168, 169, 171, 203<br />
Flow Control 168, 169, 171<br />
Humidity 251<br />
IC Temperature Sensor 248, 249, 333<br />
Internet 184<br />
Intrinsic Functions<br />
See Channel Options: Fn<br />
IP Address 177<br />
Isolation 233, 298<br />
Jobs 21, 45, 54, 332<br />
Job Commands 56<br />
Loading an Existing Job 55<br />
Single Line Jobs 54<br />
Keypad 110<br />
LabVIEW 14<br />
LCD 41, 106, 316<br />
LED<br />
Attn 30, 77, 86, 104, 110, 111, 311, 312<br />
Disk 110<br />
Ethernet 179<br />
Power 110<br />
Sample 110<br />
Logging Data 84<br />
Capacity 85<br />
Checking Status 87<br />
Free Space 87<br />
Number of Records Logged 87<br />
Enabling and Disabling 84<br />
Factors Which May Prevent Logging 86<br />
Schedule Options 86<br />
Speed 85<br />
Store Files 43, 84<br />
Low Power Mode (Sleep) 166, 167, 170, 186, 220, 230,<br />
261, 267<br />
Parameter Settings 199, 200, 230<br />
Mimics 130<br />
Modbus 40, 149, 204, 288, 333<br />
Data Types 151<br />
Register Mapping 150<br />
Serial 149, 288<br />
TCP/IP 149<br />
Modem 79, 172, 173, 203<br />
Baud Rate 174<br />
DCD Signal 33, 173, 174, 175, 203, 317<br />
DSR Signal 33, 173, 174, 175, 317<br />
DTR Signal 33, 173, 174, 317<br />
Initialisation 173, 175<br />
UM-0085-B2 <strong>DT80</strong> <strong>Series</strong> User’s <strong>Manual</strong> Page 340
Power 175, 262<br />
Modem Cable 173, 176<br />
Multiple Reports 36<br />
Noise 299<br />
NTP 205<br />
Null modem cable 159, 166, 331, 333<br />
ONINSERT Job 57, 103, 108<br />
ONRESET Job 57<br />
Operating Environment 218<br />
Optimal Speed 299<br />
Parameters 198, 200, 203, 208<br />
P00 199<br />
P03 199<br />
P04 199<br />
P08 199<br />
P09 82, 199<br />
P11 33, 198, 199, 201, 299<br />
P14 160, 199<br />
P15 186, 199, 230<br />
P16 199<br />
P17 109, 199, 229, 230<br />
P20 109, 199, 229<br />
P21 199, 228<br />
P22 49, 55, 199<br />
P24 199<br />
P26 167, 199<br />
P27 199, 267<br />
P28 199, 223<br />
P31 31, 107, 200<br />
P32 200, 205<br />
P33 23, 200<br />
P36 31, 200<br />
P38 200<br />
P39 31, 107, 200, 205<br />
P40 200<br />
P41 31, 200<br />
P50 200<br />
P51 200<br />
P53 29, 200<br />
P55 200<br />
P56 154, 176, 188, 200, 274, 285, 293<br />
P62 200, 299<br />
PLC 149, 154, 259, 288<br />
Polled Report Schedule 49<br />
Polynomials<br />
See Channel Options: Yn<br />
Power 219<br />
Consumption 224, 228<br />
External 219<br />
Modem 175<br />
Monitoring 223<br />
Outputs 30, 222<br />
PPP 188, 203, 334<br />
Connecting 196<br />
Direct Cable 191<br />
Modem 193<br />
Profile Sections<br />
COMMAND_SERVER 204<br />
ETHERNET 180, 181, 184, 203<br />
FTP_SERVER 187, 204<br />
HOST_MODEM 175, 176, 203<br />
HOST_PORT 168, 171, 176, 203<br />
HTTP_SERVER 204<br />
MODBUS_SERVER 149, 150, 155, 204<br />
NETWORK 204<br />
PARAMETERS 198, 201, 203<br />
PPP 203<br />
STARTUP 204<br />
SWITCHES 203, 208<br />
USB_PORT 203<br />
Profile Settings<br />
ALLOW_ANONYMOUS 187, 204<br />
BPS 168, 171, 203<br />
COMMAND_PROCESSING_TIME 203<br />
DATA_BITS 203<br />
DIAL 176, 203<br />
DNS_SERVER_1 204<br />
DNS_SERVER_2 204<br />
DOC_ROOT 144, 204<br />
ENABLE 203<br />
EXT_POWER_SWITCH 175, 176, 203<br />
FLOW 168, 176, 203<br />
FUNCTION 203<br />
GATEWAY 180, 184, 203<br />
HOST_ADDRESS 150, 155, 204<br />
HOST_IP_ADDRESS 203<br />
HOST_REMOTE_IP_ADDRESS 204<br />
INIT 175, 203<br />
IP_ADDRESS 180, 181, 184, 203<br />
MAINTAIN_OUTPUTS 204<br />
MAX_CD_IDLE 175, 203<br />
MODE 203<br />
PARITY 203<br />
PASSWORD 187, 204<br />
PORT 204<br />
SEND_BANNER_ON_CONNECT 203<br />
SERSEN_ADDRESS 150, 204<br />
UM-0085-B2 <strong>DT80</strong> <strong>Series</strong> User’s <strong>Manual</strong> Page 341
SERSEN_IP_ADDRESS 203<br />
SERSEN_REMOTE_IP_ADDRESS 204<br />
STOP_BITS 203<br />
SUBNET_MASK 180, 184, 203<br />
SUPPORTED 187, 204<br />
TCPIP_PORT 149, 204<br />
USB_IP_ADDRESS 203<br />
USB_REMOTE_IP_ADDRESS 204<br />
USER 187, 204<br />
PWR OUT terminal 222<br />
Rainflow Cycle Counting 71<br />
References 62<br />
Relay<br />
Contact Closure Inputs 260, 261, 269<br />
<strong>DT80</strong> Relay Output 30, 261<br />
Resetting the <strong>DT80</strong> 208<br />
Safe Mode 209<br />
Resistance 28, 35, 237, 247, 304<br />
2 wire measurement 238, 297<br />
3 wire measurement 238, 297<br />
4 wire measurement 237, 238, 239<br />
Parallel Resistor 239<br />
Retrieving Logged Data<br />
Unloading 22<br />
RS-232 166, 169, 170, 317, 330, 331, 334<br />
RS-422 169, 170, 334<br />
RS-485 169, 170, 334<br />
RTD 28, 29, 35, 247, 334<br />
Safe Mode 209<br />
SCADA 149, 153, 288, 335<br />
Scaling 35, 39, 58<br />
Schedule 21, 42<br />
Continuous Trigger 48<br />
Enable Trigger While CV 48<br />
Enable Trigger While Digital 48<br />
Executing Commands 52<br />
Halting & Resuming 52<br />
Immediate 49<br />
Order of Execution 51<br />
Redefining Trigger 50, 51, 80<br />
Statistical 50<br />
Trigger on Counter 46<br />
Trigger on CV 47<br />
Trigger on Digital Channel 46<br />
Trigger on Poll Command 47, 49<br />
Trigger on Serial Channel 46, 283<br />
Trigger on Time Interval 45<br />
Schedule ID 42<br />
Schedule Name 43<br />
Schedule Option 43<br />
defaults 43<br />
Schedule Options 86<br />
"A:" 43<br />
"B:" 43<br />
Alarm Size 43<br />
Alarm Width 43<br />
Data Size 43<br />
NOV 43<br />
OV 43<br />
Schedule Trigger 44<br />
SDI-12 20, 29, 40, 270, 335<br />
Self heating 299<br />
Serial Channel 20, 40, 46, 331<br />
Baud Rate 172<br />
Control String 276, 282<br />
Flow Control 172<br />
Input Action 276, 280<br />
Loopback 285<br />
Output Action 276, 278<br />
Return Value 281<br />
Terminals 285<br />
Serial Sensor Direct Mode 284<br />
Serial sensor port 29, 149, 229, 230, 288<br />
Serial Sensor Port 169<br />
settings 171<br />
Single quotes 77<br />
Sleep Mode 229<br />
Forced Sleep 230<br />
Wake Events 229<br />
Spans<br />
See Channel Options: Sn<br />
Statistics 36, 40, 50, 68<br />
Strain Gauge 304<br />
Subnet Mask 178<br />
Switches 201, 208, 311, 335<br />
// 201, 311<br />
/C 23, 201<br />
/D 201<br />
/E 16, 159, 201<br />
/F 54, 56, 201<br />
/H 23, 201<br />
/I 201<br />
/K 201, 299<br />
/L 201<br />
/M 201, 322<br />
/N 23, 201<br />
/R 22, 201<br />
UM-0085-B2 <strong>DT80</strong> <strong>Series</strong> User’s <strong>Manual</strong> Page 342
S 52, 201<br />
/T 23, 201<br />
/U 23, 201, 211, 322<br />
/W 201<br />
/X 201<br />
/Z 77, 201<br />
Synchronizing to Midnight 52, 69, 201<br />
System Timer (ST) 32, 35<br />
System Variable (SV) 29, 33<br />
System Variables<br />
01SV 33, 87<br />
02SV 33<br />
03SV 33, 87<br />
04SV 33<br />
06SV 33<br />
07SV 33<br />
08SV 33<br />
09SV 33<br />
10SV 33<br />
11SV 33, 39, 245<br />
12SV 33<br />
13SV 33<br />
14SV 33<br />
15SV 33<br />
16SV 33<br />
17SV 33<br />
18SV 33<br />
19SV 34<br />
20SV 34<br />
21SV 34<br />
22SV 34<br />
25SV 34, 176<br />
26SV 34<br />
27SV 34<br />
29SV 34<br />
30SV 34, 87<br />
31SV 34<br />
32SV 34, 87<br />
52SV 34<br />
53SV 34, 87<br />
TCP/IP 112, 149, 156, 159, 177, 208, 288, 335<br />
Temperature 218, 304<br />
Thermistor 29, 246<br />
Thermocouple 28, 244, 326, 336<br />
Units 28, 41, 68, 200, 201<br />
Unload 88<br />
URI 336<br />
USB 160<br />
USB memory device 22, 103<br />
USB port 166<br />
USER.INI 102<br />
Vibrating Wire Strain Gauge 253<br />
Voltage 28, 232, 304<br />
Web Interface 112<br />
Browser Requirements 114, 141<br />
Classic 141<br />
Command window 135, 138<br />
Customising 137, 144<br />
Enhanced 113<br />
Flash Player 113<br />
Help 136, 139<br />
Mimics 130, 140<br />
SSI Directives 144<br />
Status Screens 123<br />
Unloading Data 126<br />
whitespace 336<br />
WK terminal 229, 261<br />
UM-0085-B2 <strong>DT80</strong> <strong>Series</strong> User’s <strong>Manual</strong> Page 343