MATLAB Cheat Sheet Basic Commands Plotting Commands
MATLAB Cheat Sheet Basic Commands Plotting Commands
MATLAB Cheat Sheet Basic Commands Plotting Commands
You also want an ePaper? Increase the reach of your titles
YUMPU automatically turns print PDFs into web optimized ePapers that Google loves.
<strong>MATLAB</strong> <strong>Cheat</strong> <strong>Sheet</strong><br />
<strong>Basic</strong> <strong>Commands</strong><br />
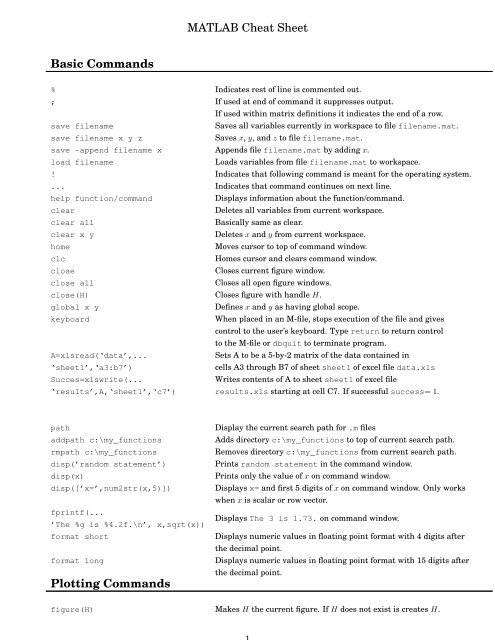
% Indicates rest of line is commented out.<br />
; If used at end of command it suppresses output.<br />
If used within matrix definitions it indicates the end of a row.<br />
save filename<br />
Saves all variables currently in workspace to file filename.mat.<br />
save filename x y z<br />
Saves x, y, and z to file filename.mat.<br />
save -append filename x Appends file filename.mat by adding x.<br />
load filename<br />
Loads variables from file filename.mat to workspace.<br />
! Indicates that following command is meant for the operating system.<br />
... Indicates that command continues on next line.<br />
help function/command<br />
Displays information about the function/command.<br />
clear<br />
Deletes all variables from current workspace.<br />
clear all<br />
<strong>Basic</strong>ally same as clear.<br />
clear x y<br />
Deletes x and y from current workspace.<br />
home<br />
Moves cursor to top of command window.<br />
clc<br />
Homes cursor and clears command window.<br />
close<br />
Closes current figure window.<br />
close all<br />
Closes all open figure windows.<br />
close(H) Closes figure with handle H.<br />
global x y<br />
Defines x and y as having global scope.<br />
keyboard<br />
When placed in an M-file, stops execution of the file and gives<br />
control to the user’s keyboard. Type return to return control<br />
to the M-file or dbquit to terminate program.<br />
A=xlsread(‘data’,...<br />
Sets A to be a 5-by-2 matrix of the data contained in<br />
‘sheet1’,‘a3:b7’)<br />
cells A3 through B7 of sheet sheet1 of excel file data.xls<br />
Succes=xlswrite(...<br />
Writes contents of A to sheet sheet1 of excel file<br />
‘results’,A,‘sheet1’,‘c7’) results.xls starting at cell C7. If successful success= 1.<br />
path<br />
addpath c:\my_functions<br />
rmpath c:\my_functions<br />
disp(’random statement’)<br />
disp(x)<br />
disp([’x=’,num2str(x,5)])<br />
fprintf(...<br />
’The %g is %4.2f.\n’, x,sqrt(x))<br />
format short<br />
format long<br />
<strong>Plotting</strong> <strong>Commands</strong><br />
Display the current search path for .m files<br />
Adds directory c:\my_functions to top of current search path.<br />
Removes directory c:\my_functions from current search path.<br />
Prints random statement in the command window.<br />
Prints only the value of x on command window.<br />
Displays x= and first 5 digits of x on command window. Only works<br />
when x is scalar or row vector.<br />
Displays The 3 is 1.73. on command window.<br />
Displays numeric values in floating point format with 4 digits after<br />
the decimal point.<br />
Displays numeric values in floating point format with 15 digits after<br />
the decimal point.<br />
figure(H) Makes H the current figure. If H does not exist is creates H.
Note that H must be a positive integer.<br />
plot(x,y) Cartesian plot of x versus y.<br />
plot(y)<br />
Plots columns of y versus their index.<br />
plot(x,y,‘s’) Plots x versus y according to rules outlined by s.<br />
semilogx(x,y) Plots log(x) versus y.<br />
semilogy(x,y)<br />
Plots x versus log(y).<br />
loglog(x,y)<br />
Plots log(x) versus log(y).<br />
grid<br />
Adds grid to current figure.<br />
title(‘text’)<br />
Adds title text to current figure.<br />
xlabel(‘text’)<br />
Adds x-axis label text to current figure.<br />
ylabel(‘text’)<br />
Adds y-axis label text to current figure.<br />
hold on<br />
Holds current figure as is so subsequent plotting commands add<br />
to existing graph.<br />
hold off<br />
Restores hold to default where plots are overwritten by new plots.<br />
Creating Matrices/Special Matrices<br />
A=[1 2;3 4]<br />
Defines A as a 2-by-2 matrix where the first row contains the<br />
numbers 1, 2 and the second row contains the number 3, 4.<br />
B=[1:1:10]<br />
Defines B as a vector of length 10 that contains the numbers<br />
1 through 10.<br />
A=zeros(n)<br />
Defines A as an n-by-n matrix of zeros.<br />
A=zeros(m,n)<br />
Defines A as an m-by-n matrix of zeros.<br />
A=ones(n)<br />
Defines A as an n-by-n matrix of ones.<br />
A=ones(n,m)<br />
Defines A as an m-by-n matrix of ones.<br />
A=eye(n)<br />
Defines A as an n-by-n identity matrix.<br />
A=repmat(x,m,n) Defines A as an m-by-n matrix in which each element is x.<br />
linspace(x1, x2, n) Generates n points between x1 and x2.<br />
Matrix Operations<br />
A*B<br />
Matrix multiplication. Number of columns of A must equal number<br />
of rows of B.<br />
Aˆn<br />
A must be a square matrix. If n is an integer and n > 1 than Aˆn is<br />
A multiplied with itself n times. Otherwise, Aˆn is the solution to<br />
A n v i = l i v i where l i is an eigenvalue of A and v i is the corresponding<br />
eigenvector.<br />
A/B<br />
This is equivalent to A*inv(B) but computed more efficiently.<br />
A\B<br />
This is equivalent to inv(A)*B but computed more efficiently.<br />
A.*B,A./B,<br />
A.\B,A.ˆn<br />
Element-by-element operations.<br />
A’ Returns the transpose of A.<br />
inv(A) Returns the inverse of A.<br />
length(A) Returns the larger of the number of rows and columns of A.<br />
size(A) Returns of vector that contains the dimensions of A.<br />
size(A,1) Returns the number of rows in A.<br />
reshape(A,m,n)<br />
Reshapes A into an m-by-n matrix.
kron(A,B) Computes the Kronecker tensor product of A with B.<br />
A = [A X]<br />
Concatenates the m-by-n matrix A by adding the m-by-k matrix X as<br />
additional columns.<br />
A = [A; Y]<br />
Concatenates the m-by-n matrix A by adding the k-by-n vector Y as<br />
additional rows.<br />
Data Analysis <strong>Commands</strong><br />
rand(m,n)<br />
Generates an m-by-n matrix of uniformly distributed random numbers.<br />
randn(m,n)<br />
Generates an m-by-n matrix of normally distributed random numbers.<br />
max(x) If x is a vector it returns the largest element of x.<br />
If x is a matrix it returns a row vector of the largest element in each<br />
column of x.<br />
min(x) Same as max but returns the smallest element of x.<br />
mean(x) If x is a vector it returns the mean of the elements of x.<br />
If x is a matrix it returns a row vector of the means for each column of x.<br />
sum(x) If x is a vector it returns the sum of the elements of x.<br />
If x is a matrix it returns a row vector of the sums for each column of x.<br />
prod(x) Same as sum but returns the product of the elements of x.<br />
std(x) If x is a vector it returns the standard deviation of the elements of x.<br />
If x is a matrix it returns a row vector of the standard deviations for each<br />
column of x.<br />
var(x) Same as std but returns the variance of the elements of x.<br />
Conditionals and Loops<br />
for i=1:10<br />
end<br />
procedure Iterates over procedure incrementing i from 1 to 10 by 1.<br />
while(criteria)<br />
end<br />
procedure<br />
Iterates over procedure as long as criteria is true.<br />
if(criteria 1)<br />
procedure 1<br />
elseif(criteria 2)<br />
procedure 2<br />
else<br />
procedure 3<br />
end<br />
If criteria 1 is true do procedure<br />
1, else if criteria 2 is true do<br />
procedure 2, else do procedure 3.


