Costs of Lithium-Ion Batteries for Vehicles - Transportation ...
Costs of Lithium-Ion Batteries for Vehicles - Transportation ...
Costs of Lithium-Ion Batteries for Vehicles - Transportation ...

You also want an ePaper? Increase the reach of your titles
YUMPU automatically turns print PDFs into web optimized ePapers that Google loves.
<strong>Costs</strong> <strong>of</strong> <strong>Lithium</strong>-<strong>Ion</strong> <strong>Batteries</strong> <strong>for</strong> <strong>Vehicles</strong><br />
ANL/ESD-42<br />
Center <strong>for</strong> <strong>Transportation</strong> Research<br />
Argonne National Laboratory<br />
Operated by The University <strong>of</strong> Chicago,<br />
under Contract W-31-109-Eng-38, <strong>for</strong> the<br />
United States Department <strong>of</strong> Energy
Argonne National Laboratory<br />
Argonne National Laboratory, with facilities in the states <strong>of</strong> Illinois and Idaho,<br />
is owned by the United States Government, and operated by the University<br />
<strong>of</strong> Chicago under the provisions <strong>of</strong> a contract with the Department <strong>of</strong> Energy.<br />
This technical report is a product <strong>of</strong> Argonne's Energy Systems Division.<br />
For in<strong>for</strong>mation on the division's scientific and engineering activities, contact:<br />
Director, Energy Systems Division<br />
Argonne National Laboratory<br />
Argonne, Illinois 60439-4815<br />
Telephone (630) 252-3724<br />
Publishing support services were provided by Argonne’s In<strong>for</strong>mation<br />
and Publishing Division (<strong>for</strong> more in<strong>for</strong>mation, see IPD’s home page:<br />
http://www.ipd.anl.gov/).<br />
Disclaimer<br />
This report was prepared as an account <strong>of</strong> work sponsored by an agency <strong>of</strong> the<br />
United States Government. Neither the United States Government nor any<br />
agency there<strong>of</strong>, nor The University <strong>of</strong> Chicago, nor any <strong>of</strong> their employees<br />
or <strong>of</strong>ficers, makes any warranty, express or implied, or assumes any legal liability<br />
or responsibility <strong>for</strong> the accuracy, completeness, or usefulness <strong>of</strong> any in<strong>for</strong>mation,<br />
apparatus, product, or process disclosed, or represents that its use would not<br />
infringe privately owned rights. Reference herein to any specific commercial<br />
product, process, or service by trade name, trademark, manufacturer, or<br />
otherwise does not necessarily constitute or imply its endorsement,<br />
recommendation, or favoring by the United States Government or any agency<br />
there<strong>of</strong>. The views and opinions <strong>of</strong> document authors expressed herein do not<br />
necessarily state or reflect those <strong>of</strong> the United States Government or any agency<br />
there<strong>of</strong>, Argonne National Laboratory, or The University <strong>of</strong> Chicago.<br />
Available electronically at http://www.doe.gov/bridge<br />
Available <strong>for</strong> a processing fee to U.S. Department <strong>of</strong><br />
Energy and its contractors, in paper, from:<br />
U.S. Department <strong>of</strong> Energy<br />
Office <strong>of</strong> Scientific and Technical In<strong>for</strong>mation<br />
P.O. Box 62<br />
Oak Ridge, TN 37831-0062<br />
phone: (865) 576-8401<br />
fax: (865) 576-5728<br />
email: reports@adonis.osti.gov
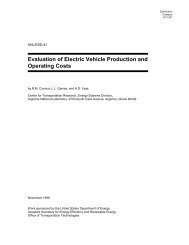
ANL/ESD-42<br />
<strong>Costs</strong> <strong>of</strong> <strong>Lithium</strong>-<strong>Ion</strong> <strong>Batteries</strong> <strong>for</strong> <strong>Vehicles</strong><br />
by Linda Gaines and Roy Cuenca<br />
Center <strong>for</strong> <strong>Transportation</strong> Research, Energy Systems Division,<br />
Argonne National Laboratory, 9700 South Cass Avenue, Argonne, Illinois 60439<br />
May 2000<br />
Work Sponsored by United States Department <strong>of</strong> Energy<br />
Assistant Secretary <strong>for</strong> Energy Efficiency and Renewable Energy<br />
Office <strong>of</strong> <strong>Transportation</strong> Technologies
This report is printed on recycled paper.
Preface<br />
Although recent studies by Argonne National Laboratory’s Center <strong>for</strong> <strong>Transportation</strong> Research<br />
(CTR) have addressed energy-cycle impacts and first and life-cycle battery costs, taking into account<br />
cycle life, shelf life, power density, energy density, and cost, the lithium-ion (Li-ion) battery,<br />
recently adapted <strong>for</strong> use in electric vehicles (EVs) by Nissan, has not yet been addressed. There is<br />
a concern that a commitment to mass production <strong>of</strong> nickel-metal hydride (Ni-MH) batteries — the<br />
present technology leaders <strong>for</strong> EVs — could be a mistake if rapid improvements in other battery<br />
types were to make Ni-MH batteries obsolete be<strong>for</strong>e the investment in their production facilities<br />
could be paid <strong>of</strong>f. For proper investor evaluation, it is necessary to examine the potential <strong>for</strong> Li-ion<br />
batteries to realize significantly lower costs.<br />
This project was originally focused on Li-ion batteries <strong>for</strong> use in EVs or in hybrid vehicles with<br />
a considerable all-electric range, assuming use <strong>of</strong> electricity from the grid. However, consideration<br />
<strong>of</strong> high-power-density Li-ion batteries was included because <strong>of</strong> the large potential <strong>for</strong> power-assist<br />
hybrid vehicles, and the dual-mode hybrids were deemphasized because they are intermediate<br />
between EVs and power-assist hybrids. <strong>Lithium</strong>-polymer batteries and ultracapacitors were not<br />
examined.<br />
Sources <strong>of</strong> in<strong>for</strong>mation <strong>for</strong> this project have included published literature and news releases,<br />
leads developed from published sources, World Wide Web entries, United States Geological Survey<br />
commodity specialists, battery experts in Argonne’s Chemical Technology Division, personal<br />
contacts from such groups as the Advanced Battery Readiness Ad Hoc Working Group, and battery<br />
and material manufacturers. Some <strong>of</strong> the desired in<strong>for</strong>mation was difficult to obtain because the<br />
battery research is still under way. However, it was possible to obtain at least qualitative judgments<br />
concerning where critical cost factors arise and what the prospects are <strong>for</strong> dealing with them.<br />
iii
Contents<br />
Preface ................................................................... iii<br />
Acknowledgments .......................................................... xi<br />
Abstract .................................................................. 1<br />
1 Introduction ............................................................ 3<br />
1.1 Purpose ........................................................... 3<br />
1.2 Background ........................................................ 3<br />
1.3 Study Methodology ................................................. 3<br />
1.4 Report Structure .................................................... 4<br />
2 Battery Design.......................................................... 5<br />
2.1 Basic Cell Chemistry ................................................ 5<br />
2.2 Cell Geometry ..................................................... 5<br />
2.3 How Cell Types Differ ............................................... 6<br />
2.4 From Cells to Modules to Battery Packs ................................. 8<br />
3 Cell Components ........................................................ 11<br />
3.1 Cathodes .......................................................... 11<br />
3.2 Anodes ........................................................... 12<br />
3.3 Separators ......................................................... 13<br />
3.4 Electrolyte ........................................................ 13<br />
3.5 Cell Packaging ..................................................... 14<br />
3.6 Safety Circuits ..................................................... 14<br />
3.7 Module and Battery Pack Materials ..................................... 16<br />
4 Materials and Production Processes ......................................... 17<br />
4.1 Raw Materials <strong>for</strong> Cathode Production ................................... 17<br />
4.1.1 Cobalt ...................................................... 17<br />
4.1.2 Nickel ...................................................... 18<br />
4.1.3 Manganese ................................................... 19<br />
4.1.4 <strong>Lithium</strong> ..................................................... 19<br />
4.2 Cathode Active Material Production ..................................... 20<br />
4.3 Anode Production ................................................... 20<br />
v
Contents (Cont.)<br />
vi<br />
4.4 Separator Production ................................................. 20<br />
4.5 Battery Production Process ............................................ 21<br />
5 Material and Production <strong>Costs</strong> ............................................. 23<br />
5.1 Material <strong>Costs</strong> ...................................................... 23<br />
5.1.1 Cathode Active Materials ....................................... 23<br />
5.1.2 Anode Materials .............................................. 30<br />
5.1.3 Separators ................................................... 30<br />
5.1.4 Electrolyte ................................................... 31<br />
5.1.5 Cell Packaging and Control Circuits ............................... 31<br />
5.2 Battery Production <strong>Costs</strong> .............................................. 32<br />
5.2.1 Labor <strong>Costs</strong> .................................................. 32<br />
5.2.2 Overhead .................................................... 33<br />
5.3 Total Manufacturing <strong>Costs</strong> ............................................ 34<br />
5.4 Purchase Price ...................................................... 34<br />
6 Battery Cost Sensitivity Analysis ........................................... 37<br />
6.1 Total Cell Material Cost .............................................. 37<br />
6.2 Sensitivity to Cathode Material Changes ................................. 39<br />
6.3 Future Material <strong>Costs</strong> and Sensitivity to Them ............................. 41<br />
6.4 Total Sales Price <strong>for</strong> the Battery Pack .................................... 43<br />
7 Recycling Considerations ................................................. 45<br />
7.1 Current Status <strong>of</strong> Li-<strong>Ion</strong> Battery Recycling ............................... 45<br />
7.2 Future Recycling Processes and Infrastructure ............................. 48<br />
7.3 Economics <strong>of</strong> Recycling .............................................. 49<br />
8 Discussion ............................................................. 51<br />
8.1 Conclusions ........................................................ 51<br />
8.2 Japanese Dominance <strong>of</strong> the Li-<strong>Ion</strong> Battery Market .......................... 51<br />
8.3 Possible Follow-On Work ............................................. 52<br />
9 References ............................................................. 53
Figures<br />
2.1 Li-<strong>Ion</strong> Cell Operation .................................................. 5<br />
2.2 Cylindrical Cell Design................................................. 6<br />
2.3 Module with Control Circuit ............................................. 8<br />
2.4 From Cell to Module to Battery Pack ...................................... 8<br />
2.5 Nissan Altra with Li-<strong>Ion</strong> <strong>Batteries</strong> ........................................ 9<br />
2.6 SAFT 6-A·h High-Power Cell and Module .................................. 9<br />
2.7 SAFT Conceptual Design <strong>for</strong> High-Power Battery ............................ 9<br />
3.1 Current-Collector Foils ................................................. 12<br />
3.2 Separator Material ..................................................... 13<br />
3.3 Cell Cans, Caps, and Mandrels ........................................... 14<br />
4.1 Winding Production ................................................... 21<br />
4.2 Calendering Machine .................................................. 21<br />
4.3 Cell Assembly Process ................................................. 21<br />
4.4 Automated Cell Assembly Line .......................................... 22<br />
5.1 Historical Price <strong>of</strong> Cobalt ............................................... 25<br />
5.2 Average Weekly Cobalt Price ............................................ 25<br />
5.3 Historical Price <strong>of</strong> Nickel ............................................... 26<br />
5.4 Nickel Cash Price Variations ............................................ 26<br />
5.5 Historical Price <strong>of</strong> Manganese ........................................... 27<br />
5.6 Historical Price <strong>of</strong> <strong>Lithium</strong> Carbonate ..................................... 28<br />
5.7 Cathode Active Material Price vs. Quantity ................................. 29<br />
6.1 High-Energy Cell Material <strong>Costs</strong> ......................................... 38<br />
vii
Figures (Cont.)<br />
6.2 Sensitivity <strong>of</strong> Total Battery Material Cost to Cost <strong>of</strong> Cathode Material ........... 39<br />
7.1 Sony Li-<strong>Ion</strong> Battery Recycling Concept .................................... 46<br />
7.2 Toxco Recycling Process ............................................... 47<br />
7.3 Toxco Cryogenic Freezing Process........................................ 47<br />
7.4 Toxco <strong>Lithium</strong> Carbonate Recovery ....................................... 48<br />
Tables<br />
2.1 Typical Li-<strong>Ion</strong> Cell Dimensions .......................................... 7<br />
2.2 Estimated Materials Content <strong>of</strong> Typical Li-<strong>Ion</strong> Cells ......................... 7<br />
2.3 SAFT High-Power Module Characteristics ................................. 9<br />
3.1 Cathode Material Energy Storage Capacities ................................ 11<br />
3.2 <strong>Lithium</strong> Salts ......................................................... 13<br />
3.3 Organic Solvents ...................................................... 14<br />
4.1 Comparative Li-<strong>Ion</strong> Cathode Material Data ................................. 17<br />
5.1 Summary <strong>of</strong> Manufacturing Cost Components ............................... 32<br />
5.2 Direct Operations Personnel <strong>for</strong> Cylindrical Cell Production ................... 33<br />
5.3 Rough Estimate <strong>of</strong> 18650 Cell Manufacturing <strong>Costs</strong> .......................... 34<br />
6.1 Material <strong>Costs</strong> <strong>for</strong> 100-A·h High-Energy Cell and 10-A·h High-Power Cell ........ 37<br />
6.2 Cost Contributions <strong>for</strong> High-Power Cell .................................... 38<br />
6.3 Current Cathode Material Prices .......................................... 40<br />
6.4 Optimistic Future Cell Material <strong>Costs</strong> <strong>for</strong> 100-A·h High-Energy Cell<br />
and 10-A·h High-Power Cell............................................. 42<br />
6.5 USABC Goals ........................................................ 42<br />
viii
Tables (Cont.)<br />
6.6 PNGV Targets <strong>for</strong> HEV <strong>Batteries</strong> ......................................... 42<br />
6.7 Materials <strong>Costs</strong> on Different Bases ........................................ 43<br />
6.8 Estimated Li-<strong>Ion</strong> Battery Pack Prices ...................................... 43<br />
ix
Acknowledgments<br />
The authors would like to thank the many people who helped and supported us during the<br />
preparation <strong>of</strong> this report. We received considerable tutorial in<strong>for</strong>mation from other Argonne staff<br />
members, especially Khalil Amine and Donald Vissers in the Chemical Technology Division.<br />
Kim Shedd, Peter Kuck, Joyce Ober, and Thomas Jones, the relevant commodity specialists at the<br />
United States Geological Survey, provided invaluable details and data, as well as technical review.<br />
Harold Haskins at Ford also provided a very thoughtful review. Numerous other industry experts<br />
provided data, insights, and technical review. Our sponsors, Philip Patterson, Kenneth Heitner, and<br />
Raymond Sutula <strong>of</strong> the Energy Management Team at the United States Department <strong>of</strong> Energy,<br />
Office <strong>of</strong> <strong>Transportation</strong> Technologies, Office <strong>of</strong> Advanced Automotive Technologies, provided<br />
funding, encouragement, and useful suggestions.<br />
xi
xii
Abstract<br />
One <strong>of</strong> the most promising battery types under development <strong>for</strong> use in both pure<br />
electric and hybrid electric vehicles is the lithium-ion battery. These batteries are<br />
well on their way to meeting the challenging technical goals that have been set <strong>for</strong><br />
vehicle batteries. However, they are still far from achieving the current cost goals.<br />
The Center <strong>for</strong> <strong>Transportation</strong> Research at Argonne National Laboratory undertook<br />
a project <strong>for</strong> the United States Department <strong>of</strong> Energy to estimate the costs <strong>of</strong><br />
lithium-ion batteries and to project how these costs might change over time, with<br />
the aid <strong>of</strong> research and development. Cost reductions could be expected as the result<br />
<strong>of</strong> material substitution, economies <strong>of</strong> scale in production, design improvements,<br />
and/or development <strong>of</strong> new material supplies. The most significant contributions to<br />
costs are found to be associated with battery materials. For the pure electric vehicle,<br />
the battery cost exceeds the cost goal <strong>of</strong> the United States Advanced Battery<br />
Consortium by about $3,500, which is certainly enough to significantly affect the<br />
marketability <strong>of</strong> the vehicle. For the hybrid, however, the total cost <strong>of</strong> the battery<br />
is much smaller, exceeding the cost goal <strong>of</strong> the Partnership <strong>for</strong> a New Generation<br />
<strong>of</strong> <strong>Vehicles</strong> by only about $800, perhaps not enough to deter a potential buyer from<br />
purchasing the power-assist hybrid.<br />
1
1.1 Purpose<br />
Section 1<br />
Introduction<br />
Because both pure electric vehicles and hybrid vehicles <strong>of</strong>fer the prospect <strong>of</strong> reduced emissions<br />
and decreased reliance on imported petroleum, these vehicle types have attracted great interest from<br />
environmentalists and other groups over the past 20 years or so. However, the promise <strong>of</strong> these<br />
vehicles has not yet been fulfilled. Technical per<strong>for</strong>mance goals are within reach, but the costs<br />
remain too high <strong>for</strong> these vehicles to gain mass-market acceptance. The biggest remaining challenge<br />
is to bring the incremental electric vehicle (EV) cost down, and this means reducing the dominant<br />
component <strong>of</strong> the incremental cost: the cost <strong>of</strong> the battery.<br />
One <strong>of</strong> the most promising new battery types is the lithium-ion battery, in part because <strong>of</strong> its<br />
high energy and power densities, and also because it has the potential to last the lifetime <strong>of</strong> the car,<br />
a major economic advantage over most other batteries. It is the purpose <strong>of</strong> this report to provide<br />
current and projected cost estimates <strong>for</strong> lithium-ion batteries, as a function <strong>of</strong> materials used and<br />
battery type. The areas where potentially significant cost reductions are possible are identified, and<br />
optimistic projections <strong>of</strong> high-volume costs are compared with the cost goals set by the United States<br />
Advanced Battery Consortium (USABC) <strong>for</strong> batteries <strong>for</strong> EVs and with those set by the Partnership<br />
<strong>for</strong> a New Generation <strong>of</strong> <strong>Vehicles</strong> (PNGV) <strong>for</strong> batteries <strong>for</strong> hybrid electric vehicles (HEVs).<br />
1.2 Background<br />
<strong>Lithium</strong>-ion (Li-ion) batteries are currently in large-scale commercial production <strong>for</strong> use in such<br />
consumer electronic products as laptop computers and portable telephones. Among the major<br />
producers are Sony, Sanyo, Varta, and SAFT. Most Li-ion production is in Japan, but Polystor is<br />
now producing small cells in Cali<strong>for</strong>nia. The technology used to produce these small consumer cells<br />
is essentially transferable to production <strong>of</strong> the larger cell sizes that would be put together into battery<br />
packs <strong>for</strong> EVs and HEVs. However, the cost <strong>of</strong> the small cells is far too high <strong>for</strong> such batteries to<br />
be used economically in mass-market vehicles. There<strong>for</strong>e, to improve their competitive position, and<br />
also with a view to potential long-term development <strong>of</strong> the vehicle market, considerable research and<br />
development (R&D) work has been devoted to lowering the costs <strong>of</strong> Li-ion batteries. Much <strong>of</strong> the<br />
ef<strong>for</strong>t has focused on reducing the extremely high cathode costs. However, as cathode costs are<br />
brought down, ef<strong>for</strong>ts to reduce other cost components are also appropriate.<br />
1.3 Study Methodology<br />
This study extends previous Argonne National Laboratory (ANL) cost analyses to Li-ion<br />
batteries. It builds on extensive R&D work supported by the U.S. Department <strong>of</strong> Energy (DOE)<br />
through USABC, as well as on the National Research Council’s (NRC’s) PNGV review and on<br />
published work by Kalhammer et al. (1995) and others. The tasks were conceived as described<br />
below.<br />
3
Task 1: Characterize Materials<br />
Characterize the materials usage <strong>for</strong> Li-ion batteries and determine how the material mix varies<br />
with cell type. Identify the key materials and characterize the different materials under consideration.<br />
In particular, the choice <strong>of</strong> transition metal in the cathode is important. Use <strong>of</strong> nickel (Ni) or<br />
manganese (Mn) instead <strong>of</strong> cobalt (Co) will reduce the cost, but it may also affect per<strong>for</strong>mance. Such<br />
trade-<strong>of</strong>fs must be examined.<br />
Task 2: Characterize Current Material and Battery Production<br />
Determine the current production volume, methods, and costs <strong>for</strong> the candidate materials and<br />
assembled batteries. Identify those cases where high cost could impede battery development.<br />
Consider possible recycling processes <strong>for</strong> high-cost or potentially hazardous components, to remove<br />
another possible impediment to lithium battery use.<br />
Task 3: Identify Cost Reduction Opportunities and Needs<br />
Estimate battery costs and compare them with USABC cost goals <strong>for</strong> EV batteries and with<br />
PNGV cost goals <strong>for</strong> HEV batteries. Evaluate opportunities or needs <strong>for</strong> cost reduction, possibly as<br />
the result <strong>of</strong> R&D that DOE could support. Areas considered would include materials selection,<br />
processing and assembly techniques, and design <strong>for</strong> recyclability.<br />
1.4 Report Structure<br />
Section 2 <strong>of</strong> this report describes the basic chemistry and physical structure <strong>of</strong> Li-ion cells and<br />
explains how cells are put together into battery packs <strong>for</strong> vehicles, while Section 3 provides<br />
additional detail about the structures within the cell. Section 4 discusses the supply picture and<br />
production processes <strong>for</strong> the materials used within the cells, as well as <strong>for</strong> the cells themselves.<br />
Production costs <strong>for</strong> the raw materials and the cells are discussed in Section 5. The sensitivity <strong>of</strong><br />
these costs to various factors is discussed in Section 6, and current and optimistic future battery costs<br />
are compared to development goals. Recycling is discussed in Section 7, and Section 8 presents<br />
conclusions and discussion <strong>of</strong> potential future work.<br />
4
Section 2<br />
Battery Design<br />
In this section, we explain the basic chemistry that takes place inside Li-ion battery cells,<br />
describe cell construction, and tell how cells are assembled into battery packs <strong>for</strong> vehicular use. We<br />
also indicate <strong>for</strong> both EV and HEV batteries the quantities <strong>of</strong> material used per cell and per vehicle<br />
and explain the differences between high-energy and high-power cells. Although several<br />
manufacturers have pilot-scale facilities <strong>for</strong> cell production, no automotive cells or battery packs<br />
have yet been produced on a commercial scale. There<strong>for</strong>e, the designs described here should be<br />
considered as exemplary prototypes, from which actual commercial cell designs may differ.<br />
2.1 Basic Cell Chemistry<br />
The main feature <strong>of</strong> Li-ion cells is that current is carried by lithium ions, from the positive<br />
electrode (cathode) to the negative electrode (anode) during charging, and from negative to positive<br />
during discharging, as shown in Figure 2.1. No lithium metal is present in the cell, thereby<br />
alleviating some serious safety concerns. The ions are small and reside within the crystal structure<br />
<strong>of</strong> the electrode materials. The overall cell chemical reactions <strong>for</strong> cell charging and discharging are<br />
shown below, <strong>for</strong> a typical LiCoO 2 cathode and carbon anode:<br />
Figure 2.1 Li-<strong>Ion</strong> Cell Operation<br />
(Source: Paul Scherrer Institute 2000)<br />
6C + LiCoO 7 6<br />
2 LixC6 + Li (1-x)CoO2 The charge reaction proceeds to the right and the<br />
discharge to the left (Kalhammer et al. 1995). As<br />
the cell is charged, the lithium ions move to the<br />
carbon (x = 1) from the cobalt (x = 0). In actual<br />
practice, not all ions are transported back and <strong>for</strong>th:<br />
0 < x < 1.<br />
2.2 Cell Geometry<br />
The basic cell chemistry and design are the<br />
same <strong>for</strong> all types <strong>of</strong> Li-ion automotive cells.<br />
Figure 2.2 shows a typical cell design. Thin layers<br />
<strong>of</strong> cathode, separator, and anode are rolled up on a<br />
central mandrel and inserted into a cylindrical can.<br />
The gaps are filled with liquid electrolyte. The<br />
basic design remains unchanged on substitution <strong>of</strong><br />
one electrode material <strong>for</strong> another, although the layer thicknesses might change. This is the same<br />
design used <strong>for</strong> most small commercial cells, like the 18650, 1 used in such devices as camcorders.<br />
1 The nomenclature refers to the dimensions. The 18650 is 18 mm in diameter and 65 mm long.<br />
5
Figure 2.2 Cylindrical Cell Design<br />
(Source: Sony 2000)<br />
6<br />
2.3 How Cell Types Differ<br />
Electrical energy requirements <strong>for</strong> hybridelectric<br />
vehicles differ from those <strong>for</strong> pure electric<br />
vehicles, and these requirements affect the cell and<br />
battery design. For pure electric vehicles, a large<br />
amount <strong>of</strong> energy must be stored in order to<br />
transport the vehicle over an acceptable range. The<br />
energy stored in the battery serves the same function<br />
as the gasoline in the fuel tank <strong>of</strong> a conventional<br />
vehicle. Typical EV battery packs store on the order<br />
<strong>of</strong> 35 kWh, which delivers as much energy to the<br />
wheels as about 4 gal <strong>of</strong> gasoline. It is possible to<br />
store as much energy as desired in batteries by<br />
simply increasing their number, but this increases<br />
the weight to unacceptably high values. There<strong>for</strong>e, an important objective in development <strong>of</strong><br />
batteries <strong>for</strong> electric vehicles is to maximize energy density, the energy stored per unit volume, or<br />
specific energy, the energy stored per unit mass. Li-ion cells can be manufactured with energy<br />
densities as high as 175 W·h/L (specific energy, 144 W·h/kg) today, with a targeted value <strong>of</strong><br />
310 W·h/L. Lead-acid batteries typically achieve only 73 W·h/L (Oweis et al. 1999).<br />
For power-assist hybrid vehicles, the main source <strong>of</strong> energy is the liquid fuel; what is needed<br />
from the battery is a power boost <strong>for</strong> rapid acceleration. There<strong>for</strong>e, the attribute <strong>of</strong> the battery to be<br />
maximized is specific power or power density. High-power Li-ion cells currently achieve a specific<br />
power greater than 1,300 W/kg and a power density greater than 2,700 W/L (both pulse 50% depth<br />
<strong>of</strong> discharge, DOD) (Oweis et al. 1999). Cells <strong>for</strong> dual-mode hybrid vehicles would require a<br />
per<strong>for</strong>mance level intermediate between those <strong>of</strong> the high-energy and high-power cells described<br />
here.<br />
The main differences between a cell optimized <strong>for</strong> high energy density, <strong>for</strong> use in a pure EV,<br />
and one optimized <strong>for</strong> high power, <strong>for</strong> use in a HEV, are the size <strong>of</strong> the cell and the relative<br />
quantities <strong>of</strong> the different materials contained in the cell. In this report, we consider the two extremes<br />
<strong>of</strong> design — those <strong>for</strong> EVs and those <strong>for</strong> power-assist hybrids, which require much higher power,<br />
relative to the available energy (the high-power cell with 1,300-W/kg specific power has a specific<br />
energy <strong>of</strong> 70 W·h/kg, about half that <strong>of</strong> the high-energy cell). Grid-connected (dual-mode) HEVs<br />
require intermediate designs, which we have not examined because <strong>of</strong> time constraints. We have<br />
assumed that costs <strong>for</strong> these intermediate designs would lie between the two extreme cases.<br />
Both high-energy and high-power cells utilize the same basic spiral-wound design and the same<br />
materials. However, some modifications <strong>of</strong> the designs are required to achieve the desired<br />
differences in per<strong>for</strong>mance. The high-power cells must be smaller than the high-energy cells in order<br />
to dissipate the higher heat load generated. In addition, high-power batteries require less total energy,<br />
so battery packs <strong>for</strong> HEVs can be made smaller and lighter than those <strong>for</strong> pure EVs. The same<br />
current collectors and separators can be used <strong>for</strong> high-energy and high-power batteries.<br />
Control/safety circuits have no significant differences.
Typical cell dimensions are shown in Table 2.1 <strong>for</strong> current designs <strong>of</strong> high-energy and highpower<br />
automotive cells. Data on commercial 18650 cells (used in camcorders) are also provided, <strong>for</strong><br />
comparison.<br />
Table 2.1 Typical Li-<strong>Ion</strong> Cell Dimensions<br />
Item Sony High-Energy SAFT High-Energy a High-Power b<br />
18650 c<br />
Height (mm) 410 220 151 65<br />
Diameter (mm) 67 54 41 18<br />
Mass (g) 3,300 1,070 380 40<br />
Capacity (A·h) 100 44 9 1.35<br />
a Oweis (1999).<br />
b Spotnitz (1999a).<br />
c Carcone (1998).<br />
Different designs and capacities are proposed by different manufacturers, and one manufacturer<br />
may <strong>of</strong>fer variations. For instance, SAFT’s high-power design is available in 6-A·h and 12-A·h sizes,<br />
which differ only in capacity and height. In addition, use <strong>of</strong> smaller cells <strong>for</strong> vehicles would have<br />
both advantages and drawbacks that should be considered. Cell design, then, is by no means<br />
finalized. Table 2.2 shows estimated material compositions <strong>for</strong> typical Li-ion cells.<br />
Table 2.2 Estimated Materials Content <strong>of</strong> Typical Li-<strong>Ion</strong> Cells<br />
Material/Component Quantity (g)<br />
High-Energy (100-A·h) Cell High-Power (10 A·h ) Cell<br />
Percent by<br />
Weight Quantity (g)<br />
Percent by<br />
Weight<br />
Negative electrode (dry)<br />
Anode material (graphite) 563.6 16.4 14.1 4.3<br />
Binder (PVDF) 69.7 2.0<br />
Current collector (Cu) 151.9 4.4 41.6 12.8<br />
Cathode (dry)<br />
Active material 1,408.6 41.0 74.4 22.9<br />
Carbon 46.4 1.4<br />
Binder (polyvinylidene fluoride) 92.9 2.7<br />
Current collector (Al) 63.0 1.8 19.4 6.0<br />
Rest <strong>of</strong> Cell<br />
Tabs, end plates, terminal assemblies 66.2 1.9 32.2 10.2<br />
Core 0.9 0.0<br />
Container 291.0 8.5 70.1 21.6<br />
Electrolyte 618 18.0 44.0 13.5<br />
Separators 60.5 1.8 16.4 5.0<br />
Other 12.6 3.9<br />
Total 3,432.7 99.9 325 100<br />
7
Figure 2.3 Module with Control<br />
Circuit (Source: Nissan 1999)<br />
8<br />
Figure 2.4 From Cell to Module to Battery Pack<br />
2.4 From Cells to Modules to Battery Packs<br />
Numerous designs are possible <strong>for</strong> assembling cells<br />
into a battery pack <strong>for</strong> an electric or hybrid vehicle. We<br />
describe here one representative design <strong>for</strong> each type.<br />
(Actual designs might vary considerably.) A modular<br />
design is used in most cases, with a number <strong>of</strong> cells<br />
(between 6 and 12 is typical) packaged together into a<br />
unit called a “module.” Because Li-ion cells are subject<br />
to severe damage on overcharge or overdischarge,<br />
control/safety circuitry is included in each module.<br />
Figure 2.3 shows the control circuit on top <strong>of</strong> a module<br />
constructed <strong>of</strong> eight 100-A·h Sony cells. The modules<br />
can then be combined into a battery pack sized to match<br />
the requirements <strong>of</strong> the vehicle. The same modules could<br />
be used in a variety <strong>of</strong> different battery packs.<br />
In the battery pack used in the Nissan Altra, which is the first EV on the road with Li-ion<br />
batteries, 12 <strong>of</strong> the eight-cell modules are assembled into the battery pack <strong>for</strong> the vehicle (see<br />
Figure 2.4 <strong>for</strong> conceptualization <strong>of</strong> pack makeup and Figure 2.5 <strong>for</strong> a photograph <strong>of</strong> the car). The<br />
total mass <strong>of</strong> the battery pack is 364 kg (just under 800 lb), 2 <strong>of</strong> which the cells account <strong>for</strong> 317 kg.<br />
The remaining 47 kg is the circuitry, the module packaging, and the case <strong>for</strong> the entire battery pack.<br />
The approximate size is 100 cm × 200 cm × 18 cm (40 in × 80 in. × 7 in.); the pack fits under the<br />
vehicle’s passenger compartment (Roque 1998; Roque and McLaughlin 1999).<br />
In another EV battery design concept, six 44-A·h SAFT cells would be joined into modules<br />
weighing 7.35 kg (16 lb) each. In addition to the mass <strong>of</strong> the cells, this includes 0.93 kg <strong>for</strong> control<br />
circuitry and module packaging. The capacity and voltage would depend on how the cells were<br />
connected, with the following capacity and voltage pairs possible: (44 A·h, 21 V), (88 A·h, 10.5 V),<br />
and (132 A·h, 7 V) (Oweis 1999). It would be up to the automobile manufacturer to decide how to<br />
package these modules.<br />
One possible design <strong>for</strong> a high-power battery pack consists <strong>of</strong> 100 10-A·h cells connected in<br />
series. SAFT has shown prototypes <strong>of</strong> two high-power air-cooled modules. These contain either 6or<br />
12-A·h cells. Additional specifications are shown in Table 2.3. For each module, there is<br />
____________________<br />
2 Conversion factors: 1 lb (avoirdupois) – 0.454 kg, or 1 kg – 2.20 lb; 1 in. – 2.54 cm, or 1 cm – 0.394 in.
approximately 1.4 kg (3.1 lb) <strong>of</strong> additional<br />
material needed <strong>for</strong> the module case and<br />
control circuitry. To meet the PNGV mass<br />
and volume goals <strong>for</strong> power-assist hybrids<br />
(40 kg, 32 L), a maximum <strong>of</strong> six <strong>of</strong> the 6-A·h<br />
modules or four <strong>of</strong> the 12-A·h modules could<br />
be combined into a battery pack. A<br />
photograph <strong>of</strong> a SAFT 6-A·h cell and module<br />
is shown in Figure 2.6, and a conceptual<br />
battery design using four <strong>of</strong> the 6-A·h<br />
modules is shown in Figure 2.7. Note that this<br />
battery pack is air-cooled; the cooling fan can<br />
be seen in the center <strong>of</strong> the long edge. The<br />
pack has a mass <strong>of</strong> 32 kg (70 lb), and its<br />
dimensions are 71 cm × 30 cm × 15 cm<br />
(28 in. × 12 in. × 6 in.) (volume = 32 L).<br />
Figure 2.6 SAFT 6-A·h High-Power<br />
Cell and Module (Source: Oweis<br />
1999)<br />
Table 2.3 SAFT High-Power Module<br />
Characteristics<br />
Characteristic 6-A·h Module 12-A·h Module<br />
Mass, kg 6.0 9.5<br />
Volume, L 5.2 7.7<br />
Dimensions, mm 239 × 153 × 143 239 × 228 × 143<br />
Energy, W·h/kg 48 61<br />
Peak power, W/kg 1,125 1,150<br />
Peak power, W/L 1,300 1,420<br />
Source: Oweis (1999).<br />
Figure 2.5 Nissan Altra with Li-<strong>Ion</strong> <strong>Batteries</strong><br />
The new Nissan Tino hybrid, scheduled <strong>for</strong> road tests in 2000, has two modules under the floor<br />
<strong>of</strong> the passenger compartment, each containing 48 3.6-A·h cells. The total mass <strong>of</strong> the battery pack<br />
is 40 kg (Miyamoto et al. 2000).<br />
Figure 2.7 SAFT Conceptual Design <strong>for</strong><br />
High-Power Battery (Source: Oweis 1999)<br />
9
3.1 Cathodes<br />
Table 3.1 Cathode Material Energy<br />
Storage Capacities (mA·h/g)<br />
Capacity<br />
Cathode Material Practical Theoretical<br />
LiCoO 2 140 275<br />
LiNiO 2 (or mixed) 190-200 274<br />
LiMn 2O 4 120 148<br />
Section 3<br />
Cell Components<br />
The material used <strong>for</strong> the cathode (positive electrode) is a metal oxide, in which lithium ions are<br />
inserted into the crystal structure, or intercalated. The small, commercial electronics batteries<br />
generally use LiCoO 2, but cobalt is quite expensive, so there is a considerable incentive <strong>for</strong><br />
substitution <strong>of</strong> a cheaper material. Cathode materials based on both nickel and manganese are being<br />
developed <strong>for</strong> vehicle batteries. Sony, which originally used cobalt in its batteries <strong>for</strong> the Nissan<br />
Altra, recently switched to manganese. SAFT and Polystor are developing nickel- or mixed<br />
nickel/cobalt-based cathodes, and Varta and Shin-Kobe (Hitachi) are developing cells with<br />
manganese-based cathodes. Nickel-based cathodes are feasible now, but manganese-based cathodes<br />
are still in the development stage, with a major problem related to the material’s solubility in the<br />
electrolyte, especially at high temperature.<br />
The lithium cobalt and nickel oxides are layered structures, with lithium and nickel or cobalt<br />
occupying alternating layers <strong>of</strong> octahedral sites in a distorted cubic, close-packed oxygen-ion lattice.<br />
The LiMn 2O 4 is generally a spinel structure, with the oxygen ions in a face-centered cubic<br />
arrangement and the lithium and manganese ions in tetrahedral and octahedral arrays, respectively<br />
(Xie et al. 1995). However, Pacific <strong>Lithium</strong> is now producing a layered aluminum-doped manganite<br />
cathode material, developed by the Massachusetts Institute <strong>of</strong> Technology (MIT), which is expected<br />
to have a cost similar to that <strong>of</strong> the spinel but also to have better per<strong>for</strong>mance (Pickering 2000).<br />
The different electrode materials have<br />
different current-carrying capacities, and this<br />
affects the storage capacities <strong>of</strong> the resultant<br />
cells. The increase in energy density <strong>for</strong> nickel,<br />
compared to that <strong>for</strong> cobalt (see Table 3.1),<br />
arises because, <strong>for</strong> cobalt, only 50% <strong>of</strong> the<br />
lithium ions can be “rocked” (transported back<br />
and <strong>for</strong>th between electrodes). The material<br />
becomes less stable as the end-<strong>of</strong>-charge voltage<br />
is increased (maximum voltage is about 4.7 V).<br />
In contrast, about 70% <strong>of</strong> the lithium can be<br />
transported at 4.2 V with nickel-based cathodes (Haskins 1999). The main concern is material<br />
stability. Because nickel is inherently less stable than cobalt, researchers are trying to find dopants<br />
to make the nickel-based material more stable. Companies <strong>of</strong>ten consider the exact percentages <strong>of</strong><br />
nickel and cobalt used, as well as the dopants used to enhance material stability, to be proprietary.<br />
A typical cathode material under consideration is LiNi 0.8Co 0.2O 2. The net impacts <strong>of</strong> changing the<br />
cathode material from 100% Co to 80%-Ni/20%-Co are (1) an increase in capacity <strong>of</strong> 24% and<br />
(2) a reduction in cost (to ~20%) <strong>for</strong> 80% <strong>of</strong> the material. Nickel and cobalt are so similar in<br />
11
Figure 3.1 Current-Collector Foils<br />
(Source: Hohsen Corp. 1998)<br />
3.2 Anodes<br />
12<br />
properties that the dimensions and quantities <strong>of</strong> material<br />
do not really change. However, 24% fewer cells would<br />
be required to achieve the same energy storage in an EV<br />
using a nickel-based battery instead <strong>of</strong> a cobalt-based<br />
one. Alternatively, with the same number <strong>of</strong> cells, the<br />
EV would have a larger range. Research is under way to<br />
develop novel high-voltage cathode materials. One<br />
example is LiCo yNi (1-y)VO 4, which is reported to have an<br />
inverse-spinel structure (Scrosati 2000).<br />
The electrode materials are spread onto a thin<br />
metallic foil substrate, which also serves as the current<br />
collector. For the cathode, aluminum foil (about 20 µm<br />
thick) is used.<br />
The anode, or negative electrode, is generally made <strong>of</strong> graphite, coated on copper foil about<br />
14 µm thick, although other <strong>for</strong>ms <strong>of</strong> carbon can be used. Availability <strong>of</strong> material <strong>for</strong> the anodes is<br />
not an issue.<br />
In the anodes made by using graphite, a single lithium ion can be intercalated <strong>for</strong> each hexagon<br />
in the graphite’s molecular structure, <strong>for</strong> a nominal composition <strong>of</strong> LiC 6 at full charge. The<br />
theoretical capacity <strong>of</strong> graphite is 372 mA·h/g. Development is under way on several other structures<br />
that allow intercalation <strong>of</strong> more than one Li ion per six carbon atoms. In one type, the graphite planes<br />
are disrupted and skewed into a “house-<strong>of</strong>-cards” structure with an average <strong>of</strong> two Li ions per six<br />
carbons. The distance between planes in graphite is 3.34 D, but it is about 3.8 D <strong>for</strong> the less-ordered<br />
structure. The best carbons in current research intercalate 2.5 Li ions and achieve capacities as high<br />
as 750 mA·h/g. This would mean that less anode material could be used to match the capacity <strong>of</strong> a<br />
given cathode. Additional R&D is being done with metal oxide anode materials (e.g., tin oxide) that<br />
<strong>of</strong>fer up to 10 times the capacity <strong>of</strong> current carbons, but so far these materials are not sufficiently<br />
stable (Sandi 1999). Companies involved in R&D on anode materials include Dupont, 3M, IBM, and<br />
FMC. Given the relatively low price <strong>of</strong> anode materials compared with that <strong>of</strong> cathode materials, the<br />
incentive <strong>for</strong> research to reduce anode material costs is relatively less compelling.<br />
While maximum porosity <strong>of</strong> the carbon is sought, minimum effective surface area (
Figure 3.2 Separator<br />
Material (Source:<br />
Hohsen Corp. 1998)<br />
3.4 Electrolyte<br />
3 PE= polyethylene, PP= polypropylene.<br />
3.3 Separators<br />
Separators <strong>for</strong> either high-energy or high-power Li-ion<br />
batteries are typically made from polyolefins using 3- to 8-µm<br />
layers (PP/PE/PP or else just PE) 3 with 50% porosity.<br />
The separators serve two functions. Not only do they keep the<br />
positive and negative electrodes apart, but they serve as a safety<br />
device as well. In the event that a cell becomes too hot, the lowmelting<br />
polymers melt, closing <strong>of</strong>f the pores through which the<br />
ions travel and thereby shutting <strong>of</strong>f the cell current. It is expected<br />
that control circuits (see below) will shut the cell down be<strong>for</strong>e this<br />
happens, since the cell cannot be reused once the shutdown<br />
separator melts.<br />
The electrolyte is usually a 1-molar solution <strong>of</strong> a lithium salt in an organic solvent. Salts under<br />
consideration are listed in Table 3.2, and solvents that could be used in combinations are listed in<br />
Table 3.3 (Vimmerstedt et al. 1995). Note that all <strong>of</strong> the salts are fluorine compounds, which<br />
explains both the costs <strong>of</strong> their production and the potential hazards in the event <strong>of</strong> fire (HF could<br />
be released). Although these salts are very expensive, they are used in relatively dilute solutions in<br />
inexpensive solvents. One battery manufacturer uses a mixture <strong>of</strong> six solvents, increasing the cost<br />
but raising the flash point to 60C, compared to the typical 5C, thereby enhancing the safety <strong>of</strong> the<br />
cells (Ridgway 1999).<br />
There is interest in developing flame-retardant electrolytes. Some work involves using additives<br />
to retard flame, rather than replacing the organic solvents. It is unclear whether SRI International’s<br />
patent (granted in 1998) uses additives or inherently nonflammable solvents (Narang 1998). <strong>Ion</strong>ic<br />
liquids, such as 1-ethyl-3-methylimadozolium, are being investigated <strong>for</strong> use as electrolytes. They<br />
are reported to have high ionic conductivity and to be nonflammable, noncorrosive, and <strong>for</strong>mable<br />
into gels (Koch 2000).<br />
Table 3.2 <strong>Lithium</strong> Salts<br />
Scientific Name Formula Common Name<br />
(<strong>Lithium</strong> hexafluoroarsenate a ) LiAsF 6 —<br />
<strong>Lithium</strong> hexafluorophosphate LiPF 6 —<br />
<strong>Lithium</strong> tetrafluoroborate LiBF 4 —<br />
<strong>Lithium</strong> (bis)trifluoromethanesulfonimide LiN(SO 2CF 3) 2 Li TFSI<br />
<strong>Lithium</strong> tris(trifluoromethanesulfonyl)methide Li C(SO 2CF 3) 3 Li Methide<br />
<strong>Lithium</strong> trifluoromethanesulfonate LiCF 3SO 3 Li Triflate<br />
a Generally no longer under consideration because <strong>of</strong> its toxicity.<br />
13
Table 3.3 Organic Solvents<br />
14<br />
Scientific Name Abbreviation<br />
Propylene carbonate PC<br />
Ethylene carbonate EC<br />
Diethyl carbonate DEC<br />
Dimethyl carbonate DMC<br />
Dimethoxyethane DME<br />
Much research has been directed at the<br />
development <strong>of</strong> gels and solid polymer<br />
electrolytes (SPEs) <strong>for</strong> Li-ion cells. One<br />
developer uses three monomers, a plasticizer,<br />
Figure 3.3 Cell Cans, Caps, and Mandrels<br />
(Source: Hohsen Corp. 1998)<br />
and a lithium salt and polymerizes the mixture in situ. The thickness <strong>of</strong> the electrolyte <strong>for</strong> a creditcard-sized<br />
prismatic cell, rein<strong>for</strong>ced with synthetic fabric, is 20 to 100 µm (Piazza 1998). One plastic<br />
<strong>of</strong>ten mentioned <strong>for</strong> use as the polymeric substrate is polyacrylonitrile (PAN). Solid electrolytes<br />
would <strong>of</strong>fer several advantages, including enhanced safety (because there is no liquid electrolyte to<br />
spill) and lighter weight and design flexibility (because no hard cell can is required). This weight<br />
reduction would be most significant <strong>for</strong> small cells. However, there have been difficulties in<br />
achieving the required per<strong>for</strong>mance (the electrolyte resistance tends to be too high). Several<br />
manufacturers <strong>of</strong> small consumer cells currently manufacture Li-ion polymer cells. Hydro Quebec<br />
and 3M are working on Li-ion polymer batteries <strong>for</strong> EV applications (Irving 1998).<br />
3.5 Cell Packaging<br />
Most automotive cell designs are cylindrical, although some manufacturers do produce<br />
prismatic (rectangular) cells. Cases <strong>for</strong> Li-ion batteries were originally made <strong>of</strong> stainless steel, but<br />
they are now generally aluminum, which is lighter in weight and cheaper. Varta is still using steel,<br />
and NEC Moli Energy uses nickel-plated steel <strong>for</strong> its small consumer cells. The use <strong>of</strong> plastic is<br />
problematic because it could be dissolved by the organic electrolytes.<br />
If solid SPEs were developed, rigid metal cans would not be needed. Aluminum or metallized<br />
polymer foils could be used, and cells could be made in a variety <strong>of</strong> shapes (Hake 1996). The<br />
material would need to be sufficiently tough to pass the required abuse tests. Some small cells have<br />
been introduced in laminated foil pouches.<br />
3.6 Safety Circuits<br />
Li-ion cells require control circuitry to prevent them from overcharging or overdischarging.<br />
Essentially the same control circuitry can be used <strong>for</strong> vehicle cells as <strong>for</strong> small consumer cells,<br />
except that some <strong>of</strong> the components must be somewhat larger. In addition, automotive battery<br />
modules will combine some common components into a single circuit, typically <strong>for</strong> eight cells<br />
(compared with two or four <strong>for</strong> camcorder packs), so the contribution <strong>of</strong> electronics to the total cost<br />
will be much smaller on a percentage basis. This is particularly important in the case <strong>of</strong> the highenergy<br />
batteries used <strong>for</strong> pure electric vehicles. Note that cathode material influences the control
circuit costs; manganese-based cells are self-limiting, and there<strong>for</strong>e they require only minimal<br />
control circuitry (Ridgway 1999).<br />
Li-ion batteries require special protection during charging/discharging and under conditions <strong>of</strong><br />
abuse. Because Li-ion cells lack an inherent balance-adjusting mechanism, such as the gas<br />
recombinative reaction <strong>of</strong> aqueous electrolyte cells, they need an active external system, especially<br />
when many cells are used in series, as in the case <strong>of</strong> electric vehicles. The basic external control<br />
system consists <strong>of</strong> a bypass circuit controlled by a microchip. When the cell in question reaches a<br />
given state <strong>of</strong> charge (or discharge) in advance <strong>of</strong> other cells, the bypass circuit is activated,<br />
discontinuing the charging (or discharging) process until balance is reached again. The state-<strong>of</strong>charge<br />
(SOC) <strong>of</strong> a Li-ion cell can be detected from its cell voltage, because an excellent correlation<br />
exists between SOC and open cell voltage <strong>for</strong> Li-ion cells. There<strong>for</strong>e, the cell controller senses<br />
voltage and activates the bypass circuit on and <strong>of</strong>f when the cell reaches near full charge or near<br />
discharge. In this way, balance is maintained among all cells, and damage to individual cells by<br />
overcharging or overdischarging is avoided. In addition, the protection systems monitor the<br />
temperatures <strong>of</strong> (at least) representative cells and activate cooling systems (e.g., fans) as necessary;<br />
protection systems also <strong>of</strong>fer abuse protection from short circuits and other transients.<br />
The protection system is normally implemented by using a controlling microchip (one per<br />
battery pack if small, or one per module if many cells are used) and two back-to-back MOSFETs 4<br />
per cell to close the bypass circuit. Two elements are needed because each MOSFET can block<br />
current only in one direction, but the system requires control in both directions during charging and<br />
discharging. In a typical EV, the battery pack consists <strong>of</strong> a number <strong>of</strong> modules connected in series<br />
(or in series and in parallel). Each module may have as many as 12 individual cells. In the Sony<br />
implementation, there is one controller and one thermistor per module, but each cell is monitored<br />
individually, and there are eight individual solid-state switches (FETs). The module controller<br />
actuates the bypass circuits as needed and sends the required in<strong>for</strong>mation (temperature, voltages,<br />
etc.) to the central battery pack controller (a larger microchip), which in turn activates the cooling<br />
fans as needed and calculates the overall state-<strong>of</strong>-charge, potential storage capacity, power level <strong>of</strong><br />
the battery charger, etc.<br />
In cases <strong>of</strong> abuse or malfunction, it is possible that Li-ion cells may be exposed to damaging<br />
high currents. In such situations, several other safety devices can further protect the cell or limit the<br />
damage. Many cells include a current-limiting device, which is placed in series with the electrodes.<br />
This polyswitch or PTC (positive temperature coefficient) material consists <strong>of</strong> a blend <strong>of</strong> special<br />
polymers and conductive components that exist in a crystalline structure with low electrical<br />
resistance at room temperature. At high currents, the internal resistance losses increase the<br />
temperature <strong>of</strong> the PTC material, which in turn increases its resistance, thus rapidly controlling the<br />
high current. These devices, however, cannot be used on high-power cells. Additional protection to<br />
limit damage can be obtained from safety vents that open at a predetermined internal cell pressure<br />
to let excess gas escape in a controlled way. Also, the polyethylene layer in the separator film melts<br />
when the internal temperature <strong>of</strong> the cell exceeds a certain limit, thus closing the micropores and<br />
preventing ionic exchange, effectively shutting the cell down. Operation <strong>of</strong> the two last safety<br />
4 FET = field-effect transistor; MOSFET = metal-oxide semiconductor field-effect transistor.<br />
15
devices is not reversible, but the damage is limited and further escape <strong>of</strong> potentially flammable<br />
electrolyte is prevented.<br />
3.7 Module and Battery Pack Materials<br />
The modules should be packaged in a rigid material so that they keep their shape during<br />
installation and vehicle use; this material should not corrode when exposed to the environment. It<br />
is also desirable to use inexpensive, lightweight materials. There<strong>for</strong>e, battery manufacturers have<br />
generally selected plastics <strong>for</strong> the module housings. Similar considerations apply <strong>for</strong> the battery pack<br />
housing; this material will be selected by the auto manufacturers to fit each model vehicle. For the<br />
Nissan Altra, the case <strong>for</strong> the battery pack is made <strong>of</strong> recyclable polybutylene terephthalate (PBT)<br />
plastic, which is mounted on an aluminum frame (Roque 1998).<br />
16
Section 4<br />
Materials and Production Processes<br />
4.1 Raw Materials <strong>for</strong> Cathode Production<br />
General statistics on production <strong>of</strong> raw materials to serve as cathode material are shown in<br />
Table 4.1 and discussed below. The numbers in the sixth and eighth columns are the numbers <strong>of</strong> new<br />
vehicles that could be powered annually by using the equivalent <strong>of</strong> current U.S. consumption <strong>of</strong><br />
these materials. 5 Of course, many more hybrids could be powered with the same quantity <strong>of</strong> material.<br />
Note that cobalt would be the first material to pose a potential supply constraint, followed by<br />
lithium, but there would not be any problems unless EVs achieved significant market penetration<br />
(with no additions to material supply).<br />
Table 4.1 Comparative Li-<strong>Ion</strong> Cathode Material Data<br />
Material<br />
Li 2CO 3<br />
Import<br />
Sources a<br />
Chile, U.S.,<br />
Russia<br />
Co Norway, Finland,<br />
Canada<br />
Ni Canada, Russia,<br />
Norway<br />
Mn Gabon, Australia,<br />
Mexico<br />
a Data from USGS (2000).<br />
b Excluding U.S. production.<br />
c Excluding Ni contained in scrap.<br />
d<br />
In ore; excluding ferromanganese.<br />
4.1.1 Cobalt<br />
1999 World<br />
Mine<br />
Production (T) a<br />
15,000 (Li) b<br />
1999 U.S.<br />
Consumption<br />
(T) a<br />
kg/EV<br />
5 Assuming 96 100-A·h cells <strong>for</strong> EVs and 100 10-A·h cells <strong>for</strong> HEVs.<br />
U.S. EV/y<br />
(10 3 ) kg/HEV<br />
U.S. HEV/y<br />
(10 3 )<br />
2,800 (Li) 9.6 (Li) 292 0.46 (Li) 6,090<br />
28,300 9,200 81.4 113 3.90 2,360<br />
1,140,000 122,000 c<br />
6,740,000 ~220,000 d<br />
81.3 1,500 3.89 31,360<br />
82.1 2,680 3.93 56,000<br />
No mining or refining <strong>of</strong> cobalt took place in the United States in 1999; processors produced<br />
cobalt compounds and cobalt metal powder from imported and recycled materials. Much <strong>of</strong> the<br />
world’s cobalt is produced as a by-product <strong>of</strong> copper mining. Because the copper or nickel ores<br />
generally contain 10% or less cobalt compared with their main products, cobalt is inherently in<br />
17
shorter supply, and there<strong>for</strong>e more expensive, than copper or nickel. Both pyrometallurgical and<br />
hydrometallurgical processes are used to recover cobalt from ores (Shedd 1999). The United States<br />
imports cobalt from Norway (24%), Finland (18%), Canada (14%), Zambia (13%), and several other<br />
countries (USGS 2000). Imports from Africa have decreased since 1991, in favor <strong>of</strong> those from<br />
Scandinavia and Russia.<br />
Cobalt, considered a strategic metal, has many industrial and military uses; <strong>for</strong> this reason, the<br />
U.S. government established a stockpile. The stockpile is being sold, but about 13,000 T remains.<br />
The largest use is in superalloys, used to make jet engine parts; this accounts <strong>for</strong> 45% <strong>of</strong> current U.S.<br />
usage. Other major uses include cemented carbides (9%) and magnetic alloys (8%). Total reported<br />
U.S. consumption in 1999 was 9,200 T, with world mine production at 28,300 T (USGS 2000). One<br />
source (Irving 1998) estimated world production <strong>of</strong> Li-ion batteries at 100 million in 1996,<br />
increasing to 700 million by 2001, which would consume about 4,700 T <strong>of</strong> cobalt, or about 17% <strong>of</strong><br />
world cobalt production. The total quantity in an EV with a battery pack like the Altra’s would be<br />
about 81.4 kg (179 lb), so that all <strong>of</strong> U.S. cobalt use is the equivalent <strong>of</strong> about 113,000 EVs per year.<br />
This means that U.S. production <strong>of</strong> a significant number <strong>of</strong> vehicles that use cobalt-based batteries<br />
(tens <strong>of</strong> thousands annually) could distort the U.S. cobalt market and cause a rise in price. An HEV<br />
using 100 10-A·h cells would require only 4 kg (8.8 lb) <strong>of</strong> cobalt, and so a considerably larger<br />
number <strong>of</strong> HEVs could be produced without causing a major price rise. A similar analysis could be<br />
done <strong>for</strong> world markets, but it is beyond the scope <strong>of</strong> this study.<br />
18<br />
4.1.2 Nickel<br />
Russia is the world’s largest producer <strong>of</strong> nickel, followed by Canada and Australia. Most nickel<br />
is smelted from sulfide ores, but new production in Australia is by hydrometallurgical processes.<br />
However, these units are reported to have corrosion problems, which have caused the price <strong>of</strong> nickel<br />
to rise (Kuck 2000). The only U.S. nickel producer, Glenbrook, produced ferronickel (not used in<br />
batteries); the company suspended mining in 1996 and idled its smelter two years later because <strong>of</strong><br />
low nickel prices. There<strong>for</strong>e, all primary nickel in the United States is imported, with Canada<br />
supplying 38%, Norway 14%, Russia 16%, and Australia 9% in 1995-1998 (USGS 2000). The bulk<br />
<strong>of</strong> the Norwegian material was recovered from matte imported from Canada and Botswana. The U.S.<br />
government no longer stockpiles nickel. All <strong>of</strong> the material in the National Defense Stockpile was<br />
sold between 1993 and 1999 (Kuck 1999).<br />
The apparent U.S. consumption <strong>of</strong> primary nickel in 1999 was 137,000 T, supplied by imports<br />
and recycling <strong>of</strong> nickel-containing materials, mostly stainless steel scrap. Nickel is used to produce<br />
stainless and alloy steel (47%), to make nonferrous alloys and superalloys (34%), and <strong>for</strong><br />
electroplating (13%) (USGS 2000). The current annual U.S. consumption is equivalent to the amount<br />
required <strong>for</strong> almost 1.5 million EVs with Ni-based batteries, or 31 million HEVs. Annual world mine<br />
production is about 1.1 million T, so battery manufacture is unlikely to significantly perturb the<br />
nickel market any time soon, if ever. In addition, large reserves are known to exist, and deep-sea<br />
nodules <strong>of</strong>fer the possibility <strong>of</strong> even more supplies to be tapped.
4.1.3 Manganese<br />
Although the United States possesses manganese ore resources, these ores contain less than<br />
35% Mn, compared to the typical 48-50% Mn ore available elsewhere, so it is not economical to use<br />
domestic resources. Consequently, the United States imports all <strong>of</strong> its manganese ore, from Gabon<br />
(56%), Australia (14%), Mexico (14%), and Brazil (7%) (USGS 2000). In addition, a smaller<br />
quantity <strong>of</strong> manganese dioxide is imported from Australia, South Africa, and Ireland. A few U.S.<br />
companies produce manganese metal (electrolytically) or MnO 2 (chemically or electrolytically).<br />
Additional supplies are obtainable from releases <strong>of</strong> material from the U.S. government stockpile to<br />
the market.<br />
Nearly 90% <strong>of</strong> U.S. manganese is used in the iron and steel industry, <strong>for</strong> sulfur fixing,<br />
deoxidizing, and alloying. U.S. consumption decreased in the 1980s in response to somewhat<br />
reduced steel production levels and because technological change reduced the rate <strong>of</strong> consumption<br />
per ton <strong>of</strong> steel. Apparent U.S. consumption in 1999 was estimated as 745,000 T, or about 11% <strong>of</strong><br />
world mine production (USGS 2000). The world reserve base is sufficient <strong>for</strong> 675 years’ production<br />
at current rates, without deep-sea nodules, so supply is not an issue. The annual U.S. consumption<br />
is equivalent to the material needed <strong>for</strong> over 2.7 million EVs with manganese-based Li-ion batteries,<br />
or about 56 million HEVs. There<strong>for</strong>e, vehicle batteries are very unlikely to make even a ripple in the<br />
U.S. manganese market.<br />
4.1.4 <strong>Lithium</strong><br />
<strong>Lithium</strong> need not be produced in metallic <strong>for</strong>m <strong>for</strong> use in Li-on batteries. In fact, very little<br />
metallic lithium is used, and because that small amount is used where it is produced, it is not a<br />
market commodity. The required raw material <strong>for</strong> these batteries is lithium carbonate. Until recently,<br />
the United States was the world’s largest producer, providing almost 80% <strong>of</strong> the world’s supply in<br />
1976, from mines in North Carolina, Cali<strong>for</strong>nia, and South Dakota and from brines in Nevada, but<br />
only the Nevada operation is still open. Production from brines in South America began in the mid-<br />
1980s, and Chile is now the world’s largest supplier, followed by China, Russia, and the<br />
United States. Almost all lithium carbonate imports to the United States come from Chile, but data<br />
on our current degree <strong>of</strong> import reliance are not available.<br />
The large new operations, especially in South America, recover lithium carbonate through the<br />
concentration <strong>of</strong> mineral-rich brines more economically and with less energy use than production<br />
from ore. In one operation, brines averaging 300 ppm lithium chloride are evaporated in ponds <strong>for</strong><br />
a year or more until the concentration rises to 6,000 ppm. The concentrate is treated with soda ash<br />
to precipitate lithium carbonate, which is filtered out and dried <strong>for</strong> shipment.<br />
The United States is still the world’s largest lithium consumer, as well as the leading producer<br />
<strong>of</strong> value-added lithium chemicals. Major uses are in the production <strong>of</strong> ceramics, glass, primary<br />
aluminum, and lubricants and greases. None <strong>of</strong> these uses is considered strategic, and the<br />
U.S. government does not stockpile lithium, although the U.S. Department <strong>of</strong> Energy did have a<br />
stock <strong>of</strong> lithium hydroxide monohydrate. U.S. consumption in 1999 was estimated to be about<br />
2,800 T <strong>of</strong> contained lithium (USGS 2000). This quantity is equivalent to that required <strong>for</strong> about<br />
290,000 EVs with Li-ion batteries annually, or about 6 million HEVs. There<strong>for</strong>e, significant market<br />
19
penetration by EVs with Li-ion batteries would perturb the market and require expansion <strong>of</strong> imports<br />
or U.S. production. Total world production in 1999 was about 15,000 T <strong>of</strong> contained lithium (63%<br />
in carbonates), and world reserves exceed 12 million T (USGS 2000). There<strong>for</strong>e, long-term supply<br />
should not be a major concern.<br />
4.2 Cathode Active Material Production<br />
The lithium metal oxide cathode compounds are made from lithium carbonate and a salt <strong>of</strong> the<br />
chosen metal by means <strong>of</strong> a series <strong>of</strong> chemical replacement reactions per<strong>for</strong>med in solution. The<br />
desired product is precipitated and spray-dried. Special care is required in process design and<br />
operation in order to achieve the appropriate crystalline and/or particle geometry (spherical <strong>for</strong> the<br />
cobalt-based or nickel-based cathodes). The processes are not particularly capital- or labor-intensive,<br />
although special care is required to handle the powders, especially the nickel oxides, because some<br />
nickel salts and oxides may be toxic and/or carcinogenic.<br />
4.3 Anode Production<br />
The important factor in the purity <strong>of</strong> the anode material is the need to eliminate any oxygencontaining<br />
species on the surface because these would react with the electrolyte. To prevent this<br />
reaction, manufacturers bake the graphite at 2,000F (1,100C) in reducing or inert atmospheres.<br />
This increases the cost <strong>for</strong> other uses, compared to graphite.<br />
Carbon (90%) is mixed with several other ingredients to make the anode paste or slurry. As with<br />
the cathode, polyvinylidene fluoride (PVDF) is used as a binder (~5%), and a small amount <strong>of</strong><br />
carbon black is added to ensure conductivity. In addition, n-methyl pyrrolodinone (NMP) is used to<br />
solubilize the materials to <strong>for</strong>m a uni<strong>for</strong>m mixture. Pressure assures uni<strong>for</strong>m grain size (Sandi1999).<br />
4.4 Separator Production<br />
Two types <strong>of</strong> process are available: wet and dry. The Japanese manufacturers use a wet process<br />
in which the polymer is dissolved in oil. The oil is then evaporated to leave a porous film. They use<br />
polymers <strong>of</strong> ultrahigh molecular weight, which are stronger than shorter-chain compounds.<br />
In the dry process, used in the United States by Celanese to produce Celgard TM , three layers <strong>of</strong><br />
blown polymer film are laminated, drawn down, and annealed below the melting point to control the<br />
polymer structure. The sheet is then rapidly stretched to obtain porosity (Pekala et al. 2000). This<br />
process is very sensitive to operating conditions and even varies with material batches, so careful<br />
control is necessary (H<strong>of</strong>fman 1999; Spotnitz 1999b). This process is limited in the molecular<br />
weights <strong>of</strong> the polymers it can use, so the product is not quite as strong as that from the wet process<br />
(Spotnitz 1999b). However, the additional thickness required in separators <strong>for</strong> EV/HEV cells<br />
compensates <strong>for</strong> the reduced strength.<br />
20
4.5 Battery Production Process<br />
The processes used <strong>for</strong> production <strong>of</strong> small, commercial Li-ion cells (size 18650) are described<br />
here. Essentially the same processes could be used <strong>for</strong> production <strong>of</strong> larger cells <strong>for</strong> electric or hybrid<br />
vehicles.<br />
Figure 4.1 Winding Production (Source:<br />
Hohsen Corp. 1998)<br />
Figure 4.2 Calendering Machine (Source:<br />
Polystor Corp., Inc., 2000)<br />
Figure 4.3 Cell Assembly Process (Source:<br />
Hohsen Corp. 1998)<br />
1. A cathode paste is made from purchased<br />
LiCoO 2 powder (80-85%), binder powder<br />
(10% PVDF), solvent, and additives<br />
(~5% acetylene black [AB], with some<br />
NMP) in a chemical vessel and pumped<br />
to the coating machine.<br />
2. Coating machines spread the paste to a<br />
thickness <strong>of</strong> about 200 to 250 µm (<strong>for</strong><br />
high-energy cells) on both sides <strong>of</strong> the Al<br />
foil (about 20 µm thick, purchased in<br />
rolls). Drying reduces the thickness by 25<br />
to 40%. The coated foil is calendered to<br />
make the thickness more uni<strong>for</strong>m and<br />
then slit to the correct width. (Figure 4.1<br />
shows winding production, with coating<br />
machine at left and calendering at right.<br />
Figure 4.2 shows an actual calendering<br />
machine.)<br />
3. Graphite paste is produced in a process<br />
similar to that used <strong>for</strong> the cathode paste.<br />
The graphite paste is then spread on Cu<br />
foil to produce the anodes. The same<br />
machines used <strong>for</strong> the cathodes can be<br />
used. A small amount <strong>of</strong> material is<br />
trimmed <strong>of</strong>f the edges <strong>of</strong> the foils. There<br />
is also a small amount <strong>of</strong> material lost<br />
when a new roll <strong>of</strong> foil is spliced in,<br />
because the taped area must be cut out.<br />
4. The anode, (purchased) separator, and<br />
cathode layers are wound up and inserted<br />
into (purchased) cylindrical cases.<br />
(Figure 4.3 is a schematic <strong>of</strong> the cell<br />
assembly process, and Figure 4.4 shows a<br />
modern, automated assembly line.) In the<br />
process, the electrodes each get a foil<br />
21
22<br />
conducting tab welded on, which will be<br />
welded to the appropriate electrical<br />
connections (the anode is welded to the<br />
can and the cathode to the can top during<br />
assembly [step 6]).<br />
5. Cells are filled with electrolyte,<br />
purchased premixed from a chemical<br />
house.<br />
6. Insulators, seals, valves, safety devices,<br />
etc. are attached, and the cells are<br />
crimped closed (or welded).<br />
7. Cells, fabricated in a fully discharged<br />
Figure 4.4 Automated Cell Assembly Line condition, are charged by using a<br />
(Source: Polystor Corp., Inc., 2000)<br />
“cycler.” These cyclers will have to<br />
provide high current <strong>for</strong> EV batteries.<br />
Cells are conditioned and tested (times up<br />
to about three weeks have been reported); they are charged, left on the test stand <strong>for</strong> several<br />
days, and then discharged; this cycle is repeated four times to verify product quality. The<br />
amount <strong>of</strong> energy used <strong>for</strong> this is not significant, but a fire hazard could exist because <strong>of</strong> the<br />
large inventory <strong>of</strong> batteries being tested.<br />
8. Cells are filled with electronic circuit boards to control charging/discharging and packed<br />
into cases. For large automotive cells, bypassing may be more difficult.<br />
9. Defective cells (about 1%), nonhomogeneous electrode materials, and leftover separator go<br />
to scrap. The total amount <strong>of</strong> scrap has been (or, it is hoped, could be) reduced to an<br />
insignificant cost factor. However, scrap rates may be higher, with one material supplier<br />
reporting that as little as 40% <strong>of</strong> the input materials in some operations winds up in final<br />
products (Pickering 2000). This question calls <strong>for</strong> additional investigation; no commercial<br />
operation rejecting that much expensive material could remain competitive.
5.1 Material <strong>Costs</strong><br />
Section 5<br />
Material and Production <strong>Costs</strong><br />
In general, costs <strong>of</strong> material production are high <strong>for</strong> new products <strong>for</strong> two reasons. First, where<br />
the process is new, even if it is modeled on a similar one, experience is needed to optimize it. Each<br />
additional new plant incorporates minor improvements on the process “learning curve.” New<br />
technologies can bring larger improvements. Second, a new product is generally produced in small<br />
quantities. A special set-up is required; existing equipment may have to be modified to be suitable.<br />
Small quantities are generally produced in batches, but as the scale increases, continuous processes<br />
that utilize specially designed equipment are introduced. Eventually, as product demand increases,<br />
the maximum practical equipment size is reached (the limit <strong>of</strong> the economies <strong>of</strong> scale), and<br />
additional demand must be satisfied by means <strong>of</strong> duplicate production lines. In the following<br />
sections, where current and projected material prices are discussed, we attempt to separate the two<br />
effects whenever possible. However, they are not entirely independent; in many cases, a new<br />
technology is developed that is only practical at large scales; there<strong>for</strong>e, reductions in cost as<br />
production volume increases cannot always be attributed to either improved technology or<br />
economies <strong>of</strong> scale alone.<br />
5.1.1 Cathode Active Materials<br />
The main source <strong>of</strong> data on minerals is a series <strong>of</strong> reports on mineral commodities, currently<br />
published by the U.S. Geological Survey (USGS), and previously by the U.S. Bureau <strong>of</strong> Mines. The<br />
reports represent by far the most complete and up-to-date in<strong>for</strong>mation available on these materials,<br />
and they are all available on the World Wide Web. Statistics are reported in the Mineral Industry<br />
Surveys (monthly) and Mineral Commodity Summaries (annual). A detailed discussion <strong>of</strong> the<br />
historical variations in the prices <strong>of</strong> these minerals is provided in Metal Prices in the United States<br />
through 1998 (USGS 1998). The USGS commodity specialists 6 also graciously provided additional<br />
insights.<br />
All <strong>of</strong> the mineral raw materials are already established commodities, with well-developed<br />
production processes and infrastructure. Process improvements could reduce production costs<br />
somewhat, but production already takes advantage <strong>of</strong> any scale economies. The major source <strong>of</strong> price<br />
variations <strong>for</strong> these materials is, and will remain, potentially significant market fluctuations<br />
associated with supply and demand.<br />
6 The specialists <strong>for</strong> the relevant materials are Kim Shedd (cobalt), Peter Kuck (nickel), Thomas Jones<br />
(manganese), and Joyce Ober (lithium).<br />
23
24<br />
5.1.1.1 Minerals<br />
Cobalt. The historical average annual price <strong>of</strong> cobalt, from 1959 to 1998, is plotted in<br />
Figure 5.1. The price was low (less than $11/kg, or $5/lb) and flat until the late 1970s, when the<br />
African copper/cobalt-producing region was invaded and the price spiked sharply, to over $70/kg<br />
($32/lb). 7 Since that event, the price has never quite recovered its very low level or its stability.<br />
Weekly spot prices vary even more sharply than do the annual averages, which themselves have<br />
varied by as much as $10/lb from year to year, with the maximum at about $29/lb in 1995 (USGS<br />
1997).<br />
The price <strong>of</strong> the 99.8% pure cobalt required <strong>for</strong> batteries is about $2/lb higher than the price <strong>of</strong><br />
the 99.3% purity material in the historical graph. The price <strong>of</strong> the purer material peaked at $23/lb<br />
in June 1999, then fluctuated within about $2 <strong>of</strong> $19/lb during the rest <strong>of</strong> 1999 and early 2000, as<br />
shown in Figure 5.2. The per-pound price fluctuated between $16.00 and $17.25 during the week<br />
ending April 14, 2000 (MetalPrices LLC 2000a). The potential exists <strong>for</strong> further price decreases as<br />
the U.S. government sells <strong>of</strong>f its National Defense Stockpile and new supplies are developed. Three<br />
new nickel projects began production <strong>of</strong> by-product cobalt in Australia in 1999 (but have<br />
experienced corrosion problems since startup [Kuck 2000]), and several other projects in other parts<br />
<strong>of</strong> the world are under consideration, including some that would recover cobalt from stockpiled<br />
tailings, slags, and concentrates. Since many <strong>of</strong> these projects are in stable areas <strong>of</strong> the world, the<br />
potential <strong>for</strong> major price disruptions in the future is expected to be small. An optimistic projection<br />
(<strong>for</strong> batteries) would put the future price <strong>of</strong> cobalt at about $10/lb. Although the supply additions are<br />
expected to be greater than the increase in demand associated with superalloys and batteries, rapid<br />
growth in use <strong>for</strong> EV batteries could eventually strain supplies, driving the price back up. At $10/lb,<br />
the cobalt required <strong>for</strong> a battery pack like that in the Altra would cost over $800, and that in an HEV<br />
would cost about $40; at a price <strong>of</strong> $18/lb, the cobalt would cost almost $1,500 <strong>for</strong> an EV and $70<br />
<strong>for</strong> an HEV.<br />
Nickel. The average annual price <strong>of</strong> nickel has been rising slowly but steadily <strong>for</strong> the past<br />
40 years, from less than $1/lb to about $2/lb in 1998, as can be seen in Figure 5.3; recent fluctuations<br />
have been on the order <strong>of</strong> $1/lb. (Note that in constant dollars, the price has actually gone down.)<br />
An exception occurred in the late 1980s, when a price spike to over $6/lb was caused by a supply<br />
shortage. Historically, the price has risen during wartime because <strong>of</strong> strategic demands. The price<br />
rose during 1999 to over $3.20/lb. At this price, the material in a nickel-based EV battery would cost<br />
about $260, and that in an HEV would cost $12. The price <strong>of</strong> nickel in early 2000 was over $4/lb,<br />
because <strong>of</strong> strong demand <strong>for</strong> stainless steel and because <strong>of</strong> corrosion problems at new facilities in<br />
Australia (Kuck 2000). (The high, in March 2000, was about $4.70/lb [MetalPrices LLC 2000b].)<br />
There are also short-term fluctuations, as can be seen in Figure 5.4, which shows London Metal<br />
Exchange (LME) prices <strong>for</strong> the past year. Although limited quantities <strong>of</strong> metal are actually traded<br />
on the LME, the exchange serves to set a reference price used by the producers. Several new projects<br />
in various parts <strong>of</strong> the world should supply enough nickel to keep prices down in the future.<br />
Development <strong>of</strong> the huge Voisey Bay deposits by Inco would further increase the Canadian<br />
supply. An environmental panel overseeing the project recommended in March 1999 that it proceed,<br />
___________________<br />
7 Conversion factors: 1 lb (avoirdupois) = 0.454 kg, or 1 kg = 2.20 lb. Units listed first are those originally<br />
cited.
DOLLARS<br />
70<br />
60<br />
50<br />
40<br />
30<br />
20<br />
10<br />
ANNUAL AVERAGE COBALT PRICE<br />
(Dollars per pound)<br />
1992 dollars<br />
Current dollars<br />
0<br />
1959 1962 1965 1968 1971 1974 1977 1980 1983 1986 1989 1992 1995 1998<br />
YEAR<br />
Figure 5.1 Historical Price <strong>of</strong> Cobalt (Source: USGS 1998)<br />
Figure 5.2 Average Weekly Cobalt Price (Source: MetalPrices LLC 2000a)<br />
25
26<br />
DOLLARS<br />
8<br />
7<br />
6<br />
5<br />
4<br />
3<br />
2<br />
1<br />
ANNUAL AVERAGE NICKEL PRICE<br />
(Dollars per pound)<br />
1992 dollars<br />
Current dollars<br />
0<br />
1959 1962 1965 1968 1971 1974 1977 1980 1983 1986 1989 1992 1995 1998<br />
YEAR<br />
Figure 5.3 Historical Price <strong>of</strong> Nickel (Source: USGS 1998)<br />
Figure 5.4 Nickel Cash Price Variations (Source: MetalPrices LLC 2000b)
and production could begin in 2002. Russian production (which entered the western market when<br />
the Soviet Union collapsed and domestic demand plummeted) by Norilsk is growing, which has<br />
driven prices down somewhat. However, Norilsk is hindered by difficulties in financing the costly<br />
systems required to capture the sulfur dioxide emissions from nickel smelting (Kuck 1996). Russian<br />
nickel (and also stainless scrap) is expected to be largely exported until at least 2025. Norilsk Nickel<br />
recently launched a program to modernize and expand its operations on the Taimyr peninsula in<br />
north-central Siberia. In addition to the large and growing supplies from Canada and Russia, three<br />
new projects in Western Australia, commissioned in 1999, have begun producing limited amounts<br />
<strong>of</strong> nickel (Kuck 2000). These new projects are all based on high-pressure leaching <strong>of</strong> nickel (and<br />
cobalt) from laterite ores, a process that is expected to have lower operational costs than smelting.<br />
This new supply at reduced cost is expected to exert further downward pressure on nickel prices. The<br />
increased number <strong>of</strong> sources could also help to prevent large fluctuations in price.<br />
According to Kuck (1999), the price <strong>of</strong> nickel “is driven by world supply and demand,<br />
irrespective <strong>of</strong> production costs” (although producers are likely to drop out if prices go below their<br />
costs). Although supply is expected to continue to grow, demand <strong>for</strong> use in stainless steel production,<br />
which has a strong influence on nickel prices, is also expected to continue to grow at its historical<br />
rate <strong>of</strong> 4.5% annually <strong>for</strong> the next 20 years. Un<strong>for</strong>eseen demands, such as a shift to stainless steel<br />
space frames <strong>for</strong> automobiles (considered by the PNGV), could raise the growth rate. Thus, in spite<br />
<strong>of</strong> increasing supply, no large drop in the price <strong>of</strong> nickel is anticipated.<br />
Manganese. Very little manganese metal is traded or used, so the basis <strong>for</strong> quoting prices is that<br />
<strong>for</strong> ore, expressed in terms <strong>of</strong> the “metric ton unit” (mtu): 1 mtu is equal to 10 kg <strong>of</strong> contained<br />
manganese. Thus, if the price is $2/mtu, this is equivalent to $0.20/kg <strong>of</strong> manganese. However, if<br />
the ore grade is 50%, then this is equivalent to $0.10/kg or $100/T <strong>for</strong> the ore. The price <strong>of</strong><br />
manganese is relatively stable, with no obvious factors on the horizon to change it. Unlike cobalt or<br />
nickel, manganese is not traded on the LME, and most purchasers have annual contracts. As shown<br />
in Figure 5.5, there was one notable disruption in the late 1980s, when the Soviet Union and China<br />
DOLLARS<br />
5.00<br />
4.50<br />
4.00<br />
3.50<br />
3.00<br />
2.50<br />
2.00<br />
1.50<br />
1.00<br />
0.50<br />
A NNUA L A V ERA GE 48%-50% MA NGA NESE ORE PRICE<br />
(Dollars per metric ton unit, c.i.f.)<br />
1992 dollars<br />
Current dollars<br />
0.00<br />
1959 1962 1965 1968 1971 1974 1977 1980 1983 1986 1989 1992 1995 1998<br />
YEAR<br />
Figure 5.5 Historical Price <strong>of</strong> Manganese (Source: USGS 1998)<br />
27
started purchasing large quantities <strong>of</strong> manganese ore and the price rose to almost $4/mtu. The<br />
average 1999 price was about $2.30/mtu (USGS 2000).<br />
The price <strong>of</strong> manganese is highly dependent upon steel production. Battery usage would be<br />
insufficient to affect manganese prices. Manganese ore is so cheap that the quantity contained in an<br />
EV would cost less than $20 at current prices; it is the cost associated with production <strong>of</strong> the cathode<br />
material from it that will dominate the cathode cost <strong>for</strong> manganese-based batteries. Manganese<br />
contained in pure compounds is somewhat more expensive. The manganese in electrolytic<br />
manganese dioxide (the appropriate precursor <strong>for</strong> cathode active material), which itself costs about<br />
$1,600/T, costs about $2.67/kg ($1.21/lb) (Jones 1999). At that price, the manganese in an EV would<br />
cost $219, and that in an HEV would cost $10.50.<br />
<strong>Lithium</strong>. <strong>Lithium</strong> metal is costly (about $50/lb), but the pure metallic <strong>for</strong>m is not required <strong>for</strong><br />
Li-ion cells. The actual lithium compound used to make cathode materials, lithium carbonate<br />
(Li 2CO 3), is considerably less expensive. The price history <strong>of</strong> lithium carbonate is shown in<br />
Figure 5.6. The average price reported <strong>for</strong> lithium carbonate in the United States at the end <strong>of</strong> 1999<br />
was $4.47/kg ($2.03/lb). However, increased production in Chile and Argentina has led to a recent<br />
oversupply, and actual prices paid have been as much as 50% below the list, matching the price <strong>of</strong><br />
only $0.90/lb from Chile and Argentina. A shutdown <strong>of</strong> the Argentine production due to process<br />
problems caused the price to rise again, but the price was still below list in early 2000 (Ober 2000).<br />
Recycled materials and sales from DOE stock put further downward pressure on prices. Large<br />
demand <strong>for</strong> batteries could eventually drive the price up. At the current list price, the lithium<br />
carbonate <strong>for</strong> the batteries in an EV like the Altra would cost about $100, and the material <strong>for</strong> an<br />
HEV battery would cost about $5.<br />
28<br />
Figure 5.6 Historical Price <strong>of</strong> <strong>Lithium</strong> Carbonate (Source: Ober 1999)
5.1.1.2 <strong>Lithium</strong> Metal Oxides<br />
The total quantity <strong>of</strong> LiCoO 2 produced worldwide in 2000 will only be on the order <strong>of</strong> 6,000 T,<br />
which is a relatively small quantity compared to other industrial chemicals (e.g., TiO 2 at about<br />
1.3 million T annually) (American Chemical Society 1996). There<strong>for</strong>e, the potential exists <strong>for</strong> some<br />
cost reduction by production on a larger scale, but it is unlikely that sufficient quantities will ever<br />
be produced to realize full economies <strong>of</strong> scale. The extremely tight specifications on cathode<br />
materials greatly increase production costs. The main determinant <strong>of</strong> price will remain the cobalt<br />
price. Cobalt, even at $18/lb, makes current LiCoO 2 cathodes especially expensive, representing 60%<br />
or more <strong>of</strong> the late 1999 high-volume cathode material price <strong>of</strong> about $25/lb ($55/kg) (Chappell<br />
1999). The price is highly dependent on the quantity purchased, as can be seen <strong>for</strong> cobalt-based<br />
cathode material in Figure 5.7. Manufacturers consider high volume to be tens <strong>of</strong> tons per month.<br />
300<br />
250<br />
200<br />
150<br />
100<br />
50<br />
0<br />
0.1 10 1000 100000<br />
pounds<br />
Figure 5.7 Cathode Active Material Price vs.<br />
Quantity<br />
The $25/lb price is a reduction <strong>of</strong> about<br />
40% from the price a few years ago. If the<br />
price <strong>of</strong> cobalt metal were to drop to $10/lb<br />
($22/kg), the price <strong>of</strong> cobalt-based cathode<br />
material could come down to about $14/lb<br />
($31/kg), below the $16-$20/lb ($35-$40/kg)<br />
drop considered likely by expert opinion in<br />
the industry. There is an economic<br />
incentive, then, to switch to nickel, even at<br />
$4/lb, and especially to manganese.<br />
However, production <strong>of</strong> LiMn 2O 4 is reported<br />
to be more difficult than production <strong>of</strong><br />
LiNiO 2, because higher temperatures and<br />
pressures are required <strong>for</strong> the <strong>for</strong>mer, and because several crystal structures are possible, only one<br />
<strong>of</strong> which has the desired properties. Thus, it is unclear what the cost <strong>of</strong> a viable manganite electrode<br />
would be, if developed. The manganite cathode material has significant potential <strong>for</strong> cost reduction<br />
by development <strong>of</strong> more specific processes, or those based on a different crystal structure (e.g., the<br />
linear structure developed by MIT and being pursued <strong>for</strong> production by Pacific <strong>Lithium</strong>). Although<br />
nickel and manganese are cheaper than cobalt, cathodes based on them are not yet produced in large<br />
quantities, so their current prices do not reflect the lower raw material prices. Both have significant<br />
potential <strong>for</strong> cost reduction simply because <strong>of</strong> scale economies.<br />
The major suppliers <strong>of</strong> cathode active material are in Japan. Because volumes are low, North<br />
American material suppliers may give development <strong>of</strong> these products low priority. There is a wide<br />
range <strong>of</strong> prices ($40 to $80/kg). One manufacturer quoted a price <strong>of</strong> $36/lb ($80/kg) <strong>for</strong> nickel-based<br />
cathode material and $27/lb ($59/kg) <strong>for</strong> manganese-based cathode material (EM Industries 1999).<br />
Another reports that the price <strong>of</strong> manganese-based cathode material is about 25% that <strong>of</strong> cobaltbased<br />
material, in commercial quantities. This would put it at $4.50 to $9.00/lb ($10 to $20/kg). It<br />
is our judgment that cathode materials are likely to be available in the range <strong>of</strong> $10 to $20/lb ($22<br />
to $44/kg) in large volume, but prices below $10/lb ($22/kg) will be difficult to achieve. Pacific<br />
<strong>Lithium</strong> is hoping to produce a manganite electrode material with a price <strong>of</strong> $15/kg ($7/lb) or less<br />
(Desilvestro 2000).<br />
29
Japanese battery material producers give preferential prices to some, but not all, Japanese<br />
battery manufacturers (Ridgway 1999). Additional in<strong>for</strong>mation comes from Toyota, which reports<br />
that the manganese-based batteries they buy from Hitachi cost a factor <strong>of</strong> 5 to 6 times less than the<br />
cobalt-based ones they were purchasing from Sony (Roque 1999). This difference cannot be<br />
explained solely on the basis <strong>of</strong> material costs.<br />
High-power cells need a large surface area and thin electrodes, so small particle sizes are<br />
desired. High-energy cells need more material, so larger particle sizes are best <strong>for</strong> them. The<br />
thickness <strong>of</strong> material on the high-power electrodes is typically only 30 to 35 µm, compared with 180<br />
to 200 µm <strong>for</strong> high-energy cell electrodes. There<strong>for</strong>e, the contribution to total cost by electrode<br />
materials is much less <strong>for</strong> high-power cells, and the costs <strong>of</strong> other components, such as separators<br />
and current collectors, are relatively more important <strong>for</strong> HEV batteries.<br />
30<br />
5.1.2 Anode Materials<br />
The price <strong>of</strong> anode carbon depends on factors like grain size and morphology, which are<br />
carefully controlled. Graphite prices vary with grade; the least expensive (SFG, a synthetic graphite<br />
made by Timical), which costs about $15/kg ($6.80/lb), probably would be suitable <strong>for</strong> HEVs, or it<br />
might be necessary to pay as much as $30/kg ($13.60/lb). The most expensive graphite is MCMB<br />
(Miso-Carbon Misobine, made by Osaka Gas) at $60/kg ($27.30/lb). Typical prices range from $20<br />
to $40/kg ($9 to $18/lb) (Spotnitz 1999b). Automotive batteries can use the cheaper carbons, and<br />
the prices would be still lower <strong>for</strong> large volumes.<br />
Superior Graphite, based in Chicago, Illinois, produces several grades <strong>of</strong> graphite <strong>for</strong> Li-ion<br />
batteries. These grades differ in particle size, surface area, and resistance. Prices depend on customer<br />
specifications and volumes. The least expensive grade has a year 2000 price ranging from $8 to<br />
$16/kg ($3.60 to $7.20/lb), and the most expensive ranges from $30 to $38/kg ($13.60 to $17.25/lb).<br />
These prices are expected to decrease by 2003, only slightly <strong>for</strong> the least expensive grades, but down<br />
to $22 to 32/kg ($10 to $14.50/lb) <strong>for</strong> the most expensive (Wanta 1999). Major production cost<br />
reductions associated with improved technology or economies <strong>of</strong> scale are not expected, because<br />
graphite is an established commercial product.<br />
5.1.3 Separators<br />
The polyethylene and polypropylene raw materials <strong>for</strong> separators are relatively inexpensive,<br />
with a maximum market price generally under about $1.30/kg ($0.60/lb). It is the processing that<br />
makes separators so expensive. Although it is not very capital- or labor-intensive, productivity on<br />
a mass basis is inherently very low because the film is so thin. The prospects are good <strong>for</strong> reducing<br />
the costs somewhat <strong>for</strong> large-scale production; it is hoped that separator film could be made as<br />
cheaply as packaging film. It is possible that process modifications to allow coextrusion <strong>of</strong> the three<br />
layers could reduce manufacturing costs. New technology could potentially <strong>of</strong>fer significant cost<br />
reductions. Each customer has slightly different, exacting specifications; meeting them raises<br />
processing costs. Separators currently cost from $3 to $6 per square meter, depending on volume,<br />
which works out to $120 to $240/kg ($54.50 to $109/lb) <strong>for</strong> material 25 µm thick and with a density<br />
<strong>of</strong> 1 g/cm 3 . The price is likely to go down to $1.25 to $1.50/m 2 (Martin 1999). An optimistic longterm<br />
goal is to bring this cost down to $1/m 2 , or $40/kg ($18/lb), with improvements on current
processes and high-volume sales. A typical 100-A·h cell would contain separator material with an<br />
area <strong>of</strong> about 2.4 m 2 , so an EV would typically require about 240 m 2 . The entire world market is<br />
currently about 25 million square meters per year, enough <strong>for</strong> 100,000 EVs. There<strong>for</strong>e, significant<br />
market penetration by EVs would require expansion <strong>of</strong> separator production capacity. However, the<br />
total mass <strong>of</strong> material used annually is only on the order <strong>of</strong> a million pounds, compared to polymer<br />
production measured in tens <strong>of</strong> billions <strong>of</strong> pounds in the United States alone, so polymer markets will<br />
be unaffected by separator production.<br />
5.1.4 Electrolyte<br />
The salts <strong>for</strong> use in Li-ion battery electrolytes are very expensive; one industry source<br />
(EM Industries 1999) quoted a price <strong>of</strong> $121/kg ($55/lb) <strong>for</strong> LiPF 6, which represents a 50% decrease<br />
from previous price levels. This is a U.S. price <strong>for</strong> modest volumes, but it is only expected to<br />
decrease by 10-15% <strong>for</strong> larger-volume purchases. There is never likely to be production on the<br />
commodity chemical industry scale. Use <strong>of</strong> less costly materials might be possible. At $121/kg, the<br />
salt in one kilogram <strong>of</strong> electrolyte solution costs more than $19, and that in a 100-A·h high-energy<br />
cell costs about $12 ($0.85 <strong>for</strong> a 10-A·h high-power cell). About 80% <strong>of</strong> the world’s supply <strong>of</strong><br />
electrolyte salts is produced by Hashimoto (now called Stellar). Buyers rely on the quality <strong>of</strong> the<br />
product and are reluctant to change suppliers. Although the market is controlled by one supplier,<br />
monopoly pricing is believed to inflate the price by less than 30%.<br />
Electrolyte salts are used in relatively dilute solutions, so most <strong>of</strong> the mass <strong>of</strong> the electrolyte<br />
is solvent. A 1-molar solution <strong>of</strong> LiPF 6 in DEC would contain 84.3% by weight (wt%) solvent. The<br />
solvents are generally relatively inexpensive, but the high purity required (
price, and about 20% <strong>of</strong> the material input ended up as scrap (Nakai 1999). If the can <strong>for</strong> the highenergy<br />
cell weighs 291 g, 364 g <strong>of</strong> material must be purchased, at a maximum price <strong>of</strong> $2/lb<br />
($4.40/kg). The material <strong>for</strong> one can would cost $1.60 at most, and the high-volume can price would<br />
be under $3.20. By the same method, the price <strong>for</strong> the high-power cell can, weighing 70 g, would<br />
be about $0.77. The costs <strong>for</strong> nickel-plated steel cans would be similar, with the lower unit cost <strong>of</strong><br />
the material <strong>of</strong>fset by the higher mass required. We did not estimate costs <strong>for</strong> caps, tabs, and other<br />
small parts, which contribute even less to cell costs than do the cans themselves.<br />
It is possible that the cost <strong>of</strong> the cans could be reduced by using less material (thinner can wall).<br />
The finished cells would still be required to pass the abuse tests, however. Rigid packaging would<br />
not be required at all <strong>for</strong> SPE cells (the material would need to be tough), so packaging costs could<br />
be lowered even more.<br />
The cost <strong>of</strong> the protection devices is relatively modest compared to the cost <strong>of</strong> the cell itself.<br />
Vents and PTC devices are very low in cost, probably on the order <strong>of</strong> pennies per cell. Melting<br />
separators are not cheap, but there is little or no cost associated with adding this useful feature to the<br />
separators, which are required <strong>for</strong> another purpose (to keep the electrodes from shorting out). The<br />
cost <strong>of</strong> the active external controllers is somewhat higher, but still relatively low compared to the<br />
cost <strong>of</strong> the cell. The individual module controllers and thermistors would probably cost $5 to $10<br />
each (<strong>for</strong> an eight-cell module), and the battery pack controller would cost $20 to $30.<br />
5.2 Battery Production <strong>Costs</strong><br />
The three main components <strong>of</strong> cell costs are materials, labor, and overhead. Materials costs<br />
have been discussed in detail; here, we take a brief look at labor and overhead costs, which are<br />
considerably smaller contributors to total Li-ion battery costs. These are calculated on the basis <strong>of</strong><br />
the authors’ engineering estimates <strong>of</strong> the changes required to an existing plant design, <strong>for</strong> which the<br />
costs were known, <strong>for</strong> production <strong>of</strong> larger cells. A summary <strong>of</strong> these results is presented in<br />
Table 5.1.<br />
32<br />
5.2.1 Labor <strong>Costs</strong><br />
Table 5.1 Summary <strong>of</strong> Manufacturing Cost Components<br />
Item High Energy High Power<br />
Plant capacity (10 6 cells/y) 2 6<br />
Workers 120 140<br />
Capital investment ($10 6 ) 30 35<br />
Labor cost ($/cell) 3.50 1.40<br />
Overhead cost ($/cell) 2.50 0.95<br />
Material cost ($/cell) 154.63 11.89<br />
Total manufacturing cost ($/cell) 160.63 14.24<br />
Materials as % <strong>of</strong> total 96 83<br />
A rough estimate <strong>of</strong> the personnel required to operate a plant that produces cylindrical cells on<br />
a balanced production line has been developed, based on expected staffing <strong>of</strong> known process steps.
Table 5.2 provides a rough estimate <strong>of</strong> the personnel required <strong>for</strong> this production line to produce<br />
cylindrical Li-ion batteries. This estimate is consistent with the approximately 90 people employed<br />
on the production lines at a Matsushita plant making small primary lithium cells in Georgia, where<br />
capacity, investment, and other operational details are known. We made the assumption that a plant<br />
producing Li-ion cells by similar processes would have similar costs and operational structure. The<br />
Matsushita plant, which produces 30 million LiMnO 2 cells per year, represents an initial investment<br />
<strong>of</strong> $25 million (Panasonic 1996). An analysis <strong>of</strong> this plant revealed a manufacturing cost structure<br />
on the order <strong>of</strong> 75% to 80% material, 12% to 15% labor, and about 8% overhead. The total<br />
manufacturing cost per cell is around $2, and a battery package with two cells retails <strong>for</strong> slightly over<br />
$10, so we are confident that these estimates are reasonable. The manufacturing costs are, <strong>of</strong> course,<br />
much higher <strong>for</strong> the larger EV cells. However, the cost increases per operation can be correlated with<br />
cell size. Some operations, such as testing, would be proportional to the number <strong>of</strong> cells, rather than<br />
their size. The capacity <strong>of</strong> this plant was reestimated on the basis <strong>of</strong> production <strong>of</strong> larger cells.<br />
Additional process units were added to keep the plant balanced (all machines 100% utilized), and<br />
the number <strong>of</strong> people needed to operate the modified plant was estimated. From the staffing and<br />
capacity estimates, we calculated the labor costs per cell shown in Table 5.1.<br />
5.2.2 Overhead<br />
Table 5.2 Direct Operations Personnel <strong>for</strong><br />
Cylindrical Cell Production<br />
Item No. <strong>of</strong> Persons<br />
Operations, per line, <strong>for</strong> each shift<br />
Mixing and coating lines ~10<br />
Calendering/slitting 3<br />
Cutting, winding, and welding tabs 5<br />
Assembly (automated) 3-5<br />
Inspection 3<br />
Testing, cycling, and packing (wholesale) 5-10<br />
Total plant, direct 19-26<br />
Total personnel (2 lines, 2 shifts) 76-104<br />
To estimate the overhead cost, we used capital and other costs <strong>for</strong> the Matsushita plant because<br />
the equipment and processes used there are very similar to those <strong>for</strong> Li-ion automotive cell<br />
production (Turner 1999). This estimate was meant to be a first approximation to see if capital and<br />
other overhead costs were a major concern <strong>for</strong> automotive cells. We calculated that the capital<br />
charges, utilities, inventory, and taxes would total $0.15/cell, or about 8% <strong>of</strong> the total cell cost. We<br />
then made necessary modifications to this basic plant in order to be able to produce the larger Li-ion<br />
cells (high-energy and high-power versions). The main changes are a higher initial investment (more<br />
machines are needed) and a much lower manufacturing capacity. Using these two parameters, the<br />
overhead <strong>for</strong> a plant producing automotive cells was estimated (see Table 5.1). Capital costs and<br />
other plant overhead costs can be seen not to be a major factor <strong>for</strong> the larger lithium-ion cells, where<br />
material costs clearly dominate.<br />
33
5.3 Total Manufacturing <strong>Costs</strong><br />
To check our results, we did a rough cost estimate <strong>for</strong> the commercial 18650 cells and<br />
determined that the major materials alone make up approximately 75% <strong>of</strong> the total cell cost <strong>of</strong> about<br />
$1.70, as can be seen in Table 5.3. Note that this estimate is consistent with actual current costs. One<br />
Table 5.3 Rough Estimate <strong>of</strong><br />
18650 Cell Manufacturing <strong>Costs</strong><br />
34<br />
Item Cost ($)<br />
Materials<br />
LiCoO2 0.62<br />
Separator 0.14<br />
Electrolyte 0.30<br />
Anode 0.24<br />
Materials subtotal 1.28<br />
Overhead 0.15-0.25<br />
Direct labor 0.18-0.24<br />
Total manufacturing cost ~1.70<br />
manufacturer reports that the cost <strong>of</strong> these small cells is<br />
now under $2 each, having come down from about $18<br />
each in 1992 (Oweis et al. 1999) as a result <strong>of</strong> improved<br />
production processes and reduced material costs at high<br />
volume. Less dramatic cost reductions are expected as the<br />
production volumes <strong>of</strong> the larger cells grow.<br />
Similar processes imply capital and labor costs<br />
similar to those <strong>of</strong> commercial cell production <strong>for</strong><br />
automotive cells. Scale-up to larger-sized cells will entail<br />
more care in the coating and winding operation. A smaller<br />
number <strong>of</strong> larger cells can be produced per line, so labor<br />
and capital costs are greater per cell, but they represent a<br />
smaller percent <strong>of</strong> the total. There<strong>for</strong>e, a similar<br />
breakdown, with even stronger dominance by the materials, is expected <strong>for</strong> the larger cells. If less<br />
expensive materials can be used, the other costs will make up a larger percentage <strong>of</strong> the total, but<br />
materials will still dominate the costs. Even if the materials costs indicated above were cut by a<br />
factor <strong>of</strong> three, they would still account <strong>for</strong> half <strong>of</strong> the total manufacturing cost. However, <strong>for</strong> the<br />
high-power cells, labor and manufacturing overhead costs would eventually become important if<br />
material costs were drastically reduced. There<strong>for</strong>e, we postulate doubling plant productivity, by such<br />
means as increased winding speed, <strong>for</strong> our optimistic calculations <strong>of</strong> possible future battery costs.<br />
5.4 Purchase Price<br />
Thus far, we have estimated the cost to the manufacturer <strong>of</strong> producing the battery. The price<br />
paid by the consumer will be considerably higher, however, because <strong>of</strong> the additional costs that must<br />
be recovered by the battery and vehicle manufacturers and dealers. These include corporate overhead<br />
(in addition to the plant overhead included above), marketing, research, transportation, warranty<br />
costs, pr<strong>of</strong>it, and any other costs that are added to the manufacturing costs, plus the markup <strong>of</strong> the<br />
vehicle manufacturer. The manufacturer’s markup goes toward recovering some <strong>of</strong> the vehicle<br />
manufacturing costs related to sourcing and installation <strong>of</strong> the battery (inventory, purchasing,<br />
preparation, dealer support and margin, etc.).<br />
The level <strong>of</strong> gross margin needed by the battery manufacturer will depend to a large extent on<br />
the volume <strong>of</strong> sales. Sunk costs, such as the costs <strong>of</strong> previous research, development, and<br />
engineering, need to be recovered over the life <strong>of</strong> the product (usually 5 to 10 years), and the higher<br />
the volume, the lower the rates need to be. Typical gross margin rates <strong>for</strong> mature products <strong>of</strong> this<br />
type are on the order <strong>of</strong> 15% to 25%. Advanced batteries are relatively new products, so the margins<br />
are expected to be higher, probably on the order <strong>of</strong> 35%. This is the margin over manufacturing costs<br />
that will be charged by the battery manufacturer to the battery purchaser.
The battery pack will not be sold directly to the final consumer as a stand-alone product; rather,<br />
it will be built into a complete vehicle. It is likely that the auto manufacturer will purchase the<br />
battery directly from the supplier (battery manufacturer), with no “middle men” involved. The auto<br />
manufacturer will pass on to the consumer the costs <strong>for</strong> purchasing and installing components<br />
purchased <strong>for</strong> use in the vehicle (including some general overhead). These costs plus the “dealer<br />
discount,” added to cover dealer costs, make up what we call the “markup,” which is added to the<br />
auto manufacturer’s cost to give the manufacturer’s suggested retail price (MSRP). The markup <strong>for</strong><br />
different components <strong>of</strong> an electric vehicle was discussed in another Argonne report (Cuenca et al.<br />
1999), where it was assumed that the electric drive components, air-conditioning drive, and batteries<br />
would be procured from outside suppliers. It was also assumed that the markup <strong>for</strong> the batteries<br />
would be lower than that <strong>for</strong> the other outsourced components at only 15% (rather than the<br />
approximately 30% usually assumed) to inhibit the development <strong>of</strong> an alternative supply channel<br />
directly from battery manufacturers to the vehicle buyer (independent <strong>of</strong> the auto maker). This low<br />
markup would require reduction <strong>of</strong> the dealer discount on that part <strong>of</strong> the EV cost due to the battery,<br />
but it would help the EV’s competitive position. The conservative assumption <strong>of</strong> only a 15% markup<br />
on batteries is used in this report as well. If the batteries cannot meet their cost goals with this small<br />
markup, they certainly would not do so if the manufacturers demanded a larger return.<br />
The combined markup from manufacturing cost is then estimated to be about 1.55 (1.35 × 1.15).<br />
Thus, the purchase price will be 1.55 times the sum <strong>of</strong> the material cost and the manufacturing cost.<br />
For the high-energy cell, the price (as part <strong>of</strong> a finished vehicle) will be about $250/cell, and <strong>for</strong> the<br />
high-power cell, the price will be about $20/cell. In the future, when the R&D investment is<br />
recovered and plant investments have largely been paid <strong>of</strong>f, the manufacturer’s markup may decrease<br />
to 25%, and the overall markup may decline to about 40%.<br />
35
Section 6<br />
Battery Cost Sensitivity Analysis<br />
This section provides estimates <strong>of</strong> the total costs <strong>for</strong> production <strong>of</strong> Li-ion batteries <strong>for</strong> electric<br />
and hybrid electric vehicles and addresses how these costs could change in the future. It was stated<br />
at a recent battery symposium that material cost accounts <strong>for</strong> 75% <strong>of</strong> product cost (Bard 1998). In<br />
fact, it has been shown in Section 5 that the contribution is even greater <strong>for</strong> Li-ion vehicle batteries,<br />
amounting to 80% or more. There<strong>for</strong>e, the greatest potential <strong>for</strong> reducing costs lies in obtaining<br />
lower-cost materials. The emphasis is on potential cost reductions achievable either by material<br />
substitution or by developing ways to obtain the same materials at lower cost, especially <strong>for</strong> the<br />
cathode materials. On the other hand, if mass-market EV penetration occurred, supply constraints<br />
could eventually cause prices <strong>for</strong> cathode materials to rise. Sensitivity <strong>of</strong> total costs to variations in<br />
material costs is examined.<br />
6.1 Total Cell Material Cost<br />
Earlier sections <strong>of</strong> this report described the major materials in Li-ion cells, provided estimates<br />
<strong>of</strong> their current and future prices, and tabulated quantities <strong>of</strong> the materials contained. This<br />
in<strong>for</strong>mation is put together here to estimate current costs <strong>of</strong> the materials in a cell. In the next<br />
sections, we examine how material costs could be affected by changes in the costs <strong>of</strong> the key input<br />
materials. Table 6.1 shows the approximate breakdown <strong>of</strong> current material costs <strong>for</strong> a 100-A·h highenergy<br />
cell and a 10-A·h high-power cell with cobalt-based cathodes. This table is based on the<br />
material compositions in Table 2.2 and on the material costs from Section 5. Figure 6.1 shows the<br />
high-energy cell material cost breakdown graphically.<br />
Table 6.1 Material <strong>Costs</strong> <strong>for</strong> 100-A·h High-Energy Cell and 10-A·h High-Power<br />
Cell<br />
Material<br />
Price<br />
($/kg)<br />
Quantity<br />
(g)<br />
High-Energy Cell High-Power Cell<br />
Cost/cell<br />
($) %<br />
Quantity<br />
(g)<br />
Cost/cell<br />
($) %<br />
Cathode 55 1,408.6 77.47 48.8 64.8 3.56 28.2<br />
Separator 180 60.5 10.89 6.9 16.4 2.95 23.3<br />
Electrolyte 60 618 37.08 23.4 44 2.64 20.9<br />
Graphite 30 563.6 16.91 10.7 12.7 0.38 3.0<br />
Can and vent 291 3.20 2.0 70 0.77 6.1<br />
Binder 45 162.6 7.32 4.6 8.8 0.40 3.1<br />
Copper 15 151.9 2.28 1.4 41.6 0.62 4.9<br />
Aluminum 20 63 1.26 0.8 19.4 0.39 3.1<br />
Carbon 20 46.4 0.93 0.6 2.2 0.04 0.3<br />
Other 20 67.1 1.34 0.8 44.8 0.90 7.1<br />
Total 3,432.7 158.68 100.0 324.7 12.66 100.0<br />
37
Cathode It can be seen that the cathode<br />
contributes about half <strong>of</strong> the $159 total<br />
material cost <strong>for</strong> the high-energy cell,<br />
Other<br />
more than twice as large a contribution<br />
as any other component, and almost<br />
one-third <strong>of</strong> the $12 total material cost<br />
<strong>for</strong> the high-power cell. This difference<br />
arises because a thinner layer <strong>of</strong><br />
Graphite<br />
cathode paste is used in the high-power<br />
cell. At $159/cell, the cost <strong>of</strong> the<br />
material alone <strong>for</strong> the high-energy cell<br />
is equivalent to $436/kWh (with just the<br />
Separator cathode material, $212/kWh).<br />
There<strong>for</strong>e, research ef<strong>for</strong>ts have been<br />
Electrolyte<br />
focused on the development <strong>of</strong> less<br />
expensive cathode materials. Similarly,<br />
Figure 6.1 High-Energy Cell Material <strong>Costs</strong> the anode graphite’s contribution<br />
decreases from 11% <strong>for</strong> the high-energy<br />
cell to 3% <strong>for</strong> the high-power cell. The<br />
reduction in electrode thickness also causes the separator’s share to rise from 7% <strong>for</strong> the high-energy<br />
cell to 25% <strong>for</strong> the high-power cell. The electrolyte makes an approximately equal and significant<br />
contribution to material costs <strong>for</strong> both cell types, at about 23%.<br />
These cost breakdowns are approximate, having been based on costs taken in the middle <strong>of</strong> a<br />
broad range <strong>of</strong> actual material prices. Actual material compositions may also vary with design details<br />
<strong>of</strong> the different manufacturers. In Table 6.2, the percentage breakdown given above <strong>for</strong> the highpower<br />
cell is compared with estimates provided by the sole U.S. manufacturer.<br />
Table 6.2 Cost Contributions<br />
<strong>for</strong> High-Power Cell (%)<br />
38<br />
Estimated<br />
Contribution<br />
Component ANL Polystor a<br />
Cathode 30 25<br />
Separator 25 25<br />
Anode 5 19<br />
Electrolyte 23 18<br />
Other 17 13<br />
Total 100 100<br />
a Spotnitz (1999a).<br />
Varta does not state a total material cost, but the firm<br />
expects that the anode and cathode materials will each<br />
contribute 20% to the minimum materials cost, with the can<br />
and feedthroughs making up 38% (Brohm et al. 1998). The<br />
high contribution from the can may be associated with their<br />
use <strong>of</strong> small prismatic cells. SAFT expects that the<br />
electrolyte, separator, and cathode material will together<br />
contribute more than 60% to the material costs <strong>of</strong> their<br />
high-energy cells when they achieve their cost goal <strong>of</strong><br />
$200/kWh (<strong>for</strong> production <strong>of</strong> 100,000 batteries per year)<br />
(Broussely et al. 1996).
6.2 Sensitivity to Cathode Material Changes<br />
This section illustrates how cell costs are affected by the cost <strong>of</strong> the cathode materials. Be<strong>for</strong>e<br />
the recent reductions in the price <strong>of</strong> cobalt, cathode costs as high as $125/kg ($57/lb) resulted in total<br />
cell material costs <strong>of</strong> about $250 <strong>for</strong> a 363-W·h high-energy cell ($700/kWh), with the cathode<br />
making up 70% <strong>of</strong> the cell material cost. This is to be compared with the current baseline material<br />
cost <strong>of</strong> $159 <strong>for</strong> $55/kg ($25/lb) cobalt-based cathode material. The material cost <strong>for</strong> the high-power<br />
cell, using $125/kg cathode material, would be about $17, the cathode’s share amounting to almost<br />
50%, compared to $13 and 28% <strong>for</strong> the base case. This indicates why manufacturers have been so<br />
eager to reduce cathode costs. If the cost <strong>of</strong> cathode material could be reduced to $20/kg ($9/lb),<br />
which is half the lower-bound cost <strong>for</strong> current mixed oxides, the total costs <strong>for</strong> materials <strong>for</strong> the highenergy<br />
cell would be reduced by 31% (compared to cobalt at $55/kg), to $110, and <strong>for</strong> the highpower<br />
cell by 18%, to $10.40. The cost <strong>for</strong> cell materials <strong>for</strong> an EV like the Altra would then be<br />
about $10,500 ($300/kWh), and <strong>for</strong> an HEV, about $1,040. One PNGV battery team member<br />
(Haskins 1997) has said, “With continued development, a 40-kWh Li-ion electric vehicle battery<br />
could be produced <strong>for</strong> about $5,000.” As indicated in Figure 6.2, this goal cannot be achieved by<br />
reductions in cathode costs alone. If there is to be hope <strong>for</strong> getting costs down even lower, the costs<br />
<strong>of</strong> other cell components must be reduced as well.<br />
Figure 6.2 Sensitivity <strong>of</strong> Total Battery<br />
Material Cost to Cost <strong>of</strong> Cathode Material<br />
The costs stated above are based on<br />
hypothetical price levels. The actual current<br />
costs <strong>for</strong> alternative cathode materials are<br />
shown in Table 6.3. Although the nickel and<br />
manganese prices in this table suggest that<br />
cathode material costs could eventually be<br />
reduced considerably by switching to lowercost<br />
materials, two factors will affect the<br />
potential <strong>for</strong> cost reduction. First, to achieve<br />
equivalent energy storage, various quantities <strong>of</strong><br />
the different materials will be required. As<br />
discussed earlier, cobalt-based cells and nickelbased<br />
cells will be very similar in design, with<br />
the relative proportions <strong>of</strong> materials in the cells<br />
unchanged. However, the energy stored per cell<br />
will increase with nickel, thereby increasing<br />
the vehicle’s range <strong>for</strong> the same number <strong>of</strong><br />
cells, relative to cobalt. Alternatively, it is<br />
possible to consider keeping the energy stored constant when the cathode is switched from cobalt<br />
to nickel, but decreasing the total number <strong>of</strong> cells and hence further reducing the cost <strong>of</strong> materials<br />
<strong>for</strong> the whole battery pack. The design configuration <strong>of</strong> a cell based on a LiMn 2O 4 cathode will be<br />
slightly different from that <strong>of</strong> one based on LiNiO 2 (or a mixed oxide), the amount <strong>of</strong> material being<br />
increased to compensate <strong>for</strong> the lower practical capacity <strong>of</strong> Mn 2O 4 (120 mA·h/g vs 200 mA·h/g <strong>for</strong><br />
39
40<br />
Table 6.3 Current Cathode Material Prices<br />
Base<br />
Element<br />
Cobalt 18 (40) b<br />
Nickel 4.42 (9.70) d<br />
Manganese 1.21 (2.67) f<br />
a Sandor (1999).<br />
b MetalPrices LLC (2000a).<br />
c Chappell (1999).<br />
d MetalPrices LLC (2000b).<br />
e EM Industries (1999).<br />
Price, $/lb<br />
($/kg) Cathode Material<br />
LiCoO2 LiNi0.8Co0.2O2 LiMn 2O 4<br />
f Based on Mn content in manganese dioxide (Jones 1999).<br />
g Desilvestro (2000).<br />
Current Price,<br />
$/lb ($/kg)<br />
25 (55) c<br />
30 (67) e<br />
27 (59) e<br />
High-Volume Price,<br />
$/lb ($/kg) a<br />
20 (45)<br />
20-23 (45-50)<br />
7 (15) g<br />
nickel). This factor will make nickel look more attractive relative to manganese than the price<br />
differential alone would suggest. Broussely et al. (1996) reported that the same cell material cost<br />
could be achieved with LiNiO 2 or with LiMn 2O 4 that cost 50% as much, implying that twice as much<br />
<strong>of</strong> the manganite is required.<br />
How do the different capacities affect the total battery material costs? If we assume that the<br />
design <strong>of</strong> the battery pack is not unchangeable, then the use <strong>of</strong> mixed oxide cathodes in place <strong>of</strong><br />
cobalt in cells <strong>for</strong> a battery pack <strong>for</strong> an EV like the Altra could enable a reduction in the number <strong>of</strong><br />
modules, perhaps from 12 to 9. This would reduce the total cell material cost from $15,200 to<br />
$8,900, if the cobaltite were priced at $55/kg and the mixed oxide at $30/kg ($13.60/lb). If<br />
manganese-oxide-based cathode material were available at $15/kg ($6.80/lb), the material cost would<br />
be about $9,800, assuming 12 modules. Less cost reduction is achieved because the required number<br />
<strong>of</strong> cells has not been decreased.<br />
A second factor affecting cost reduction potential is limited availability <strong>of</strong> the alternative<br />
cathode materials. Currently, they are available only in extremely small quantities, so prices are both<br />
high and uncertain. Prices would presumably be considerably lower <strong>for</strong> mass quantities. <strong>Costs</strong> <strong>for</strong><br />
both nickel- and manganese-based cathode materials could probably be brought down by at least a<br />
factor <strong>of</strong> two in large-volume production, but processing costs <strong>for</strong> the manganite might limit eventual<br />
cost reductions. One expert ventured a guess <strong>of</strong> $20/kg ($9/lb) <strong>for</strong> the eventual price <strong>of</strong> manganite<br />
in large quantities (Sandor 1999), and Pacific <strong>Lithium</strong> hopes to produce a manganite cathode<br />
material <strong>for</strong> $15/kg ($7/lb) or less, using a new process (Desilvestro 2000). However, the cobaltbased<br />
cathode material is already produced in commercial quantities, so its costs are likely to<br />
decrease the least. These factors increase nickel’s promise, but there is no clear advantage, and<br />
several manufacturers, including Varta, are pursuing manganese-based cathodes. One source
estimated a 20 to 40% material cost reduction associated with using manganite cathodes instead <strong>of</strong><br />
cobaltite (Pacific <strong>Lithium</strong> 2000a).<br />
6.3 Future Material <strong>Costs</strong> and Sensitivity to Them<br />
The most obvious place where cheaper materials could be used or developed is in the cathode,<br />
which is the most expensive component, with development well under way. As cathode costs are<br />
reduced, other cell components make more significant contributions to material costs. Another point<br />
<strong>of</strong> potential impact is the electrolyte, which also makes a significant cost contribution. Perhaps less<br />
expensive salts could be developed. Solid polymer electrolytes could possibly reduce cell costs,<br />
especially <strong>for</strong> small cells, by obviating the need <strong>for</strong> a hard can. The cost <strong>of</strong> the raw materials <strong>for</strong><br />
separators is trivial, but processing costs could be reduced considerably. Use <strong>of</strong> solid electrolytes<br />
could even make the use <strong>of</strong> separators unnecessary.<br />
In Section 5, we considered how costs <strong>for</strong> several important component materials could evolve<br />
over time, either through the use <strong>of</strong> lower-cost materials or by the discovery <strong>of</strong> less costly sources<br />
or production processes <strong>for</strong> the current materials. Here, we estimate how low total material costs<br />
could be if all <strong>of</strong> the possible cost reductions were accomplished. Table 6.4 is similar to Table 6.1<br />
(current material costs), but with extremely optimistic lower-bound material costs assumed <strong>for</strong> all<br />
<strong>of</strong> the cell components. These costs are as low as we expect costs to go with incremental<br />
improvements brought about by R&D, economies <strong>of</strong> scale, etc. The cathode active material cost<br />
reduction is based on use <strong>of</strong> manganite at Pacific <strong>Lithium</strong>’s projected price. Considerable reductions<br />
are possible, with the material costs <strong>for</strong> the high-energy cell potentially decreasing by over 60% and<br />
those <strong>for</strong> the high-power cell by over 55%. However, even the $59 material cost <strong>for</strong> one high-energy<br />
cell is over $160/kWh, and this is just the material cost, not including costs <strong>for</strong> manufacturing and<br />
other tasks. Goals set <strong>for</strong> EV batteries by the USABC are shown in Table 6.5. At current material<br />
costs, Varta’s high-energy Li-ion cell, which uses inexpensive manganite electrodes, still costs<br />
two times the USABC cost target (Kohler 1999). It can be seen that major breakthroughs not<br />
envisioned here, perhaps including totally different active materials or designs, would be required<br />
to meet the commercialization goal <strong>of</strong> $150/kWh and the long-term battery cost goal <strong>of</strong> under<br />
$100/kWh.<br />
Similarly, a high-power battery consisting <strong>of</strong> 100 10-A·h cells would have costs <strong>for</strong> materials<br />
alone <strong>of</strong> about $545, well over the $300 PNGV goal <strong>for</strong> power-assist HEV batteries. The PNGV<br />
goals <strong>for</strong> HEV batteries are shown in Table 6.6. For the power-assist application, most systems meet<br />
or are close to both the mass and volume goals. However, none <strong>of</strong> the batteries comes within a factor<br />
<strong>of</strong> two <strong>of</strong> even the mid-term cost goals, according to recent manufacturer estimates, and some are<br />
as much as a factor <strong>of</strong> six too high. Thus, it is not so much the technical per<strong>for</strong>mance goals that are<br />
hard to meet, but the cost goals.<br />
Note that there are several different ways to express battery material costs, useful <strong>for</strong> different<br />
comparison purposes. Some <strong>of</strong> these are shown in Table 6.7 <strong>for</strong> current and optimistic future<br />
material costs. The high-power cells are cheaper on a mass basis than the high-energy cells, as<br />
expected, because <strong>of</strong> their reduced cathode active material use. They are also cheaper per unit <strong>of</strong><br />
power, but costlier per unit <strong>of</strong> energy stored.<br />
41
42<br />
Table 6.4 Optimistic Future Cell Material <strong>Costs</strong> <strong>for</strong> 100-A·h High-<br />
Energy Cell and 10-A·h High-Power Cell<br />
Material<br />
Price<br />
($/kg)<br />
Quantity<br />
(g)<br />
High-Energy Cell High-Power Cell<br />
Cost/cell<br />
($) %<br />
Quantity<br />
(g)<br />
Cost/cell<br />
($) %<br />
Cathode 15 1,408.6 21.13 35.6 64.8 0.97 17.8<br />
Separator 40 60.5 2.42 4.1 16.4 0.66 12.0<br />
Electrolyte 30 618 18.54 31.2 44 1.32 24.2<br />
Graphite 12 563.6 6.76 11.4 12.7 0.15 2.8<br />
Can and vent 291 3.20 5.4 70 0.77 14.1<br />
Binder 20 162.6 3.25 5.5 8.8 0.18 3.2<br />
Copper 10 151.9 1.52 2.6 41.6 0.42 7.6<br />
Aluminum 15 63 0.95 1.6 19.4 0.29 5.3<br />
Carbon 12 46.4 0.56 0.9 2.2 0.03 0.5<br />
Other 15 67.1 1.01 1.7 44.8 0.67 12.3<br />
Total 3,432.7 59.33 100.0 324.7 5.45 100.0<br />
Table 6.5 USABC Goals<br />
Criterion Units<br />
Mid-Term<br />
Goals<br />
Commercialization<br />
Goals<br />
Long-Term<br />
Goals<br />
Power density W/L 250 460 600<br />
Specific power W/kg 150 300 400<br />
Energy density W·h/L 135 230 300<br />
Specific energy W·h/kg 80 150 200<br />
Calendar life years 5 10 10<br />
Cycle life (DST @ 80% DOD) cycles 600 1000 1000<br />
Sale price (25,000 units @40 kWh) $/kWh
Table 6.7 Materials <strong>Costs</strong> on Different Bases<br />
Cost Basis Current<br />
EV Cell HEV Cell<br />
Optimistic<br />
Future Current<br />
Optimistic<br />
Future<br />
$/kWh 432 160 721 266<br />
$/kW 153 57 28 10<br />
$/kg 46 17 36 13<br />
6.4 Total Sales Price <strong>for</strong> the Battery Pack<br />
How much would a Li-ion battery pack <strong>for</strong> an EV sell <strong>for</strong> now? What are the prospects <strong>for</strong> price<br />
reduction? What would be the price <strong>of</strong> the battery <strong>for</strong> a power-assist hybrid? In this section, we<br />
estimate sales prices <strong>for</strong> Li-ion batteries on the basis <strong>of</strong> the best current material costs and optimistic<br />
future costs. Manufacturing costs are added to material costs to approximate total cell costs. These,<br />
in turn, are multiplied by the number <strong>of</strong> cells per battery pack, and then packaging and circuitry costs<br />
are added to give total manufacturing costs. Sales price is estimated from manufacturing cost by<br />
using the method described in Section 5.4. For the optimistic case, it is assumed that R&D and<br />
equipment investments have been recouped and the manufacturer’s markup can be reduced from<br />
1.35 to 1.25. Actual manufacturing costs are assumed not to decrease. Table 6.8 gives estimated<br />
sales prices <strong>for</strong> a 35-kWh high-energy battery pack and a high-power battery pack composed <strong>of</strong><br />
100 10-A·h cells, under current best-price and optimistic future raw-material cost scenarios; these<br />
prices are compared with USABC and PNGV cost goals. It can be seen that even the optimistic<br />
prices exceed these goals. For the pure electric vehicle, this means that the battery cost is about<br />
$3,500 over the goal, which is enough to significantly affect the marketability <strong>of</strong> the vehicle. For the<br />
hybrid, however, the total cost <strong>of</strong> the battery is much smaller, and the difference is about $800,<br />
perhaps not enough to deter a potential buyer from purchasing the power-assist hybrid. Note that in<br />
the optimistic case <strong>for</strong> the HEV cell, labor and overhead make up 30% <strong>of</strong> the manufacturing cost,<br />
contributing an amount to the total price approximately equal to the PNGV goal. There<strong>for</strong>e, these<br />
cost components would also need to be reduced <strong>for</strong> high-power Li-ion batteries to reach PNGV<br />
goals.<br />
Table 6.8 Estimated Li-<strong>Ion</strong> Battery Pack Prices<br />
Sale Price<br />
Battery Type Baseline Optimistic Goal<br />
High-Energy<br />
(35 kWh)<br />
High-Power<br />
(100 10-A·h cells)<br />
$706/kWh<br />
($24,723)<br />
$250/kWh<br />
($8,767)<br />
>$150/kWh<br />
(USABC)<br />
$2,486 $1,095 $300 (PNGV)<br />
43
Section 7<br />
Recycling Considerations<br />
Recycling <strong>of</strong> batteries is appropriate <strong>for</strong> at least two important reasons. First, public acceptance<br />
in the United States (and government regulations in other places) will demand it, especially since<br />
the main impetus <strong>for</strong> electric vehicles is environmental. Second, there are potential economic reasons<br />
<strong>for</strong> recycling. It <strong>of</strong>ten pays to recover valuable materials, especially if their supply is limited, and it<br />
is costly to dispose <strong>of</strong> materials associated with potential health, environmental, or safety hazards.<br />
This does not mean, however, that all battery components should be recycled. This section examines<br />
existing recycling practices and addresses appropriate directions <strong>for</strong> the future.<br />
7.1 Current Status <strong>of</strong> Li-<strong>Ion</strong> Battery Recycling<br />
No Li-ion automotive batteries have been recycled as yet, but Sony recycles small consumer<br />
cells, and Toxco (Trail, B.C.) recycles a variety <strong>of</strong> lithium batteries, including large military<br />
batteries; their experience is examined here. Nippon Mining and Metals is reported to have begun<br />
recycling <strong>of</strong> small Li-ion batteries in 1997, but no details are available (England 1999). S.N.A.M.<br />
is operating a pilot plant in France (David 1999). Pacific <strong>Lithium</strong> has developed a membrane<br />
technology to recover lithium from spent batteries (Pacific <strong>Lithium</strong> 2000b).<br />
A schematic <strong>of</strong> Sony’s conception <strong>of</strong> Li-ion battery recycling is shown in Figure 7.1. The<br />
recycling process involves calcining to bake out the electrolyte (large batteries would be vented<br />
first), which renders the spent cells inactive <strong>for</strong> disassembly. The cobalt recovery makes the process<br />
economically attractive (use <strong>of</strong> less valuable cathode materials would certainly degrade the<br />
pr<strong>of</strong>itability, 8 although the process is claimed to be economical even at reduced cobalt prices). A<br />
pilot plant in Dothan, Alabama, has a capacity <strong>of</strong> 300 tons and has so far recycled about 2 to 5 tons<br />
<strong>of</strong> small consumer cells per year. A plant in Japan has processed about 120 to 150 tons per year. The<br />
Sony recycling plants are expected to operate as <strong>for</strong>-pr<strong>of</strong>it businesses, without charging a drop-<strong>of</strong>f<br />
fee <strong>for</strong> the spent batteries. The cobalt is (or will be) recovered in Oklahoma, at 95+% purity. Sony<br />
has sought no publicity <strong>for</strong> this activity and <strong>of</strong>fers no incentives <strong>for</strong> recycling; most returns are from<br />
in-warranty repairs, although there is an 800 number on the batteries, to call <strong>for</strong> recycling<br />
in<strong>for</strong>mation. The Sony Electronics Rechargeable Battery Collection Program has been active since<br />
1992 <strong>for</strong> all rechargeable types and includes a drop-<strong>of</strong>f and direct mail system. “It is the policy <strong>of</strong><br />
Sony Electronics, Inc., to encourage and promote environmentally sound recycling <strong>of</strong> all electronic<br />
waste.” (Smith 1999; Small 1999).<br />
8 It certainly is logical that use <strong>of</strong> a less valuable raw material will result in less valuable used materials at the<br />
end <strong>of</strong> the product’s life.<br />
45
46<br />
Li-ion cell manufacturing<br />
(battery plant)<br />
<strong>Lithium</strong> cobalt oxide<br />
Li-ion cell usage<br />
- EVs (10+ years)<br />
- electronics<br />
Spent cells and modules<br />
- EV service removal<br />
- consumer removal<br />
Spent cells to:<br />
Sony Electronics, Inc. - Dothan, Alabama<br />
- calcine to remove residual charge<br />
- heat from burning electrolyte is recovered<br />
- cell maintains original shape<br />
Recycling partner<br />
- cobalt recovery through own proprietary<br />
process<br />
Cobalt products<br />
Other recovered materials<br />
- copper<br />
- iron<br />
Figure 7.1 Sony Li-<strong>Ion</strong> Battery Recycling Concept (Adapted from<br />
Smith 1999)<br />
Early experiments were run in a nitrogen atmosphere. Manual disassembly was used to recover<br />
cathode strips, the most saleable product, although acid digestion or hydrometallurgical processing<br />
could also be used. The latter techniques recovered >50% and >70% <strong>of</strong> the cobalt, respectively.<br />
Disassembly <strong>of</strong> the NP-500 battery, which weighs 95 g, cost $1.25 and was found not to be<br />
economical. The value <strong>of</strong> the cobalt in the battery is only about $0.70, and considerably less than<br />
100% recovery is assumed. Sony hopes that disassembly costs can be reduced by a factor <strong>of</strong> 10<br />
(Smith 1996). Larger cells might be disassembled with labor costs similar to those <strong>for</strong> small cells,<br />
but with considerably greater value in terms <strong>of</strong> recovered materials, making disassembly more<br />
viable.<br />
Toxco, Inc., has a lithium battery recycling operation in Trail, B.C., that processed over one<br />
million pounds <strong>of</strong> batteries in 1998. Toxco processes a variety <strong>of</strong> batteries, from buttons to 570-lb<br />
military batteries, by using a cryogenic process to reduce the reactivity <strong>of</strong> the constituents. A<br />
schematic <strong>of</strong> the process is shown in Figure 7.2. The batteries are chilled to -325F in liquid<br />
nitrogen (see photo, Figure 7.3). Large batteries are then sheared into three pieces in a caustic bath,<br />
which neutralizes any acidic components and dissolves the lithium salts. The salts, precipitated and<br />
dewatered in filter presses, are used to produce lithium carbonate, seen being recovered in<br />
Figure 7.4. Hydrogen and organics burn <strong>of</strong>f at the surface <strong>of</strong> the process bath. The sludge from<br />
Li-ion electronics batteries is sent <strong>for</strong> recovery <strong>of</strong> cobalt. The remaining large pieces are passed<br />
through a hammer mill, after which ferrous and nonferrous metals are recovered. Plastics and paper
Battery<br />
Receiving<br />
& Preparation<br />
Stainless steel<br />
recovery<br />
<strong>Lithium</strong><br />
carbonate<br />
Cooling in liquid<br />
nitrogen<br />
Large <strong>Batteries</strong><br />
Product filter<br />
Spent Brine<br />
Small <strong>Batteries</strong><br />
Vertical<br />
shear<br />
Figure 7.3 Toxco Cryogenic Freezing Process<br />
(Source: Toxco, Inc., 2000)<br />
To atmosphere<br />
Off gas<br />
Rotary<br />
shear<br />
Aluminium<br />
sheet<br />
Scrubber &<br />
Filter<br />
Caustic solution Caustic solution Caustic solution<br />
Mix<br />
Tank<br />
Soda<br />
ash<br />
Carbon filter<br />
Carbon Cake<br />
Figure 7.2 Toxco Recycling Process (Source: Toxco, Inc., 2000)<br />
Hammer<br />
mill<br />
Metals<br />
Plastic<br />
Paper<br />
Debris<br />
separation<br />
Debris slurry<br />
47
48<br />
Figure 7.4 Toxco <strong>Lithium</strong> Carbonate<br />
Recovery (Source: Toxco, Inc., 2000)<br />
float to the top and are recovered <strong>for</strong> disposal or recycling. The carbon sludge is filtered out and<br />
collected as a cake, which it is not currently economical to reuse or even to burn. Materials are<br />
stored in bunkers and fumes are scrubbed. Different battery chemistries can be processed separately<br />
to aid in the recovery <strong>of</strong> usable materials (McLaughlin 1998; McLaughlin 1999). Toxco intends to<br />
recycle as many <strong>of</strong> the materials in the batteries as possible; recovery <strong>of</strong> the electrolyte salts would<br />
be particularly beneficial to the economics. The process is still undergoing development. Toxco’s<br />
subsidiary, LithChem, makes lithium compounds <strong>for</strong> batteries in Baltimore, Ohio. LithChem<br />
produces lithium products from recovered lithium carbonate, as well as LiPF 6 from LiOH <strong>for</strong> use in<br />
electrolytes (Miller 1999). Toxco has begun the permitting procedure <strong>for</strong> a plant in Cali<strong>for</strong>nia to<br />
recycle the Li-ion batteries from Nissan’s electric and hybrid vehicles, which are expected to have<br />
manganese-based cathodes.<br />
S.N.A.M.’s 100-kg/h pilot plant first discharges and husks the battery cells, then pyrolizes them<br />
to burn <strong>of</strong>f solvents and plastics. These steps account <strong>for</strong> 30-40% <strong>of</strong> the process costs. Next, the<br />
remainder is crushed and sifted, and hydrometallurgical processes are used to separate the metallic<br />
components. The process recovers steel or aluminum containers, copper and aluminum supports,<br />
cobalt and lithium hydroxides, and carbon (David 1999). It is unclear how carbon is recovered as<br />
a salable product. Note that a salable cathode product is obtained only if the material is cobalt, with<br />
a nickel content <strong>of</strong> 5% or less.<br />
7.2 Future Recycling Processes and Infrastructure<br />
Routine Li-ion battery recycling will start with electronics batteries. Only the most valuable<br />
materials (e.g., cobalt) will be recovered initially. This is somewhat <strong>of</strong> a problem because prices<br />
fluctuate. Note that the cobalt currently causes battery waste to be classed as hazardous in Cali<strong>for</strong>nia.<br />
<strong>Lithium</strong> itself may be considered a hazardous waste, but EV batteries may get some relief from<br />
hazardous waste rules because they are covered by the EPA’s Universal Waste Rule. Regulatory<br />
issues are discussed in more detail in an earlier report (Vimmerstedt et al. 1995).
Recycling <strong>of</strong> large automotive batteries is much easier than recycling <strong>of</strong> small consumer cells.<br />
First <strong>of</strong> all, the collection logistics are straight<strong>for</strong>ward. The current system <strong>for</strong> return <strong>of</strong> automotive<br />
batteries with each new battery purchase and stripping batteries from wrecks prior to shredding could<br />
be continued. Second, the batteries will be large enough to warrant separation by type to maximize<br />
the value <strong>of</strong> the recovered materials. Third, there is enough material in fairly large pieces to justify<br />
at least partial disassembly. The battery case, such as the PBT plastic one used in the Altra, could<br />
simply be removed <strong>for</strong> recycling or even reuse. It is also plausible to postulate removal <strong>of</strong> the cell<br />
windings from the cans to recover clean aluminum immediately. (Polypropylene cases are recovered<br />
in current lead-acid battery recycling operations; the material is ground and recycled.) Other schemes<br />
would instead shred the entire package, after discharging the cells and venting the electrolyte<br />
solvent. The solvent that is flashed <strong>of</strong>f could be recovered. For safety, most processing schemes<br />
include cryogenics, inert atmospheres, or other techniques to reduce the activity <strong>of</strong> the components.<br />
One possible generic process, proposed by NREL (Vimmerstedt et al. 1995), <strong>for</strong> recovery <strong>of</strong><br />
materials from Li-ion cells without cell venting or disassembly is shown in Figure 7.3.<br />
It is unlikely that the separator material would be worth recovering because the quantity is very<br />
small and it could not be recovered as reusable thin, porous film. Its value as raw material would be<br />
negligible. (Polypropylene costs less than $1/lb, but the cost <strong>of</strong> separator film exceeds $30/lb.)<br />
Aluminum from cell casings and current collectors could be recovered easily, possibly mixed with<br />
copper. The materials <strong>of</strong> most interest are the cathode oxides and the electrolyte salts. The value <strong>of</strong><br />
the potentially recoverable cathode materials will decrease as lower-cost materials are used, but it<br />
is expected to remain high enough to warrant recovery. NREL (Vimmerstedt et al. 1995) sketched<br />
out methods to reclaim metals by electrolytic recovery and ion exchange, but insufficient in<strong>for</strong>mation<br />
is available to assess process viability or economics.<br />
<strong>Lithium</strong> Technology, which has developed a membrane process to recover Li (as LiCl) from<br />
spent batteries, claims it will be economical; at this writing, only preliminary research has been<br />
completed (Keijha 2000).<br />
7.3 Economics <strong>of</strong> Recycling<br />
The manufacturers <strong>of</strong> another battery type have a pilot program with the government <strong>of</strong> Mexico,<br />
wherein used EV batteries are placed in remote areas <strong>for</strong> storage <strong>of</strong> electricity generated by<br />
photovoltaic cells (Gif<strong>for</strong>d 2000). The value <strong>for</strong> Li-ion batteries in such uses would be about that <strong>of</strong><br />
Pb-acid batteries, $50 to 150/kWh. Moreover, the batteries would still be suitable <strong>for</strong> recycling after<br />
reuse. Adding another use phase could significantly improve the lifecycle economics <strong>of</strong> EV batteries.<br />
Although Li-ion batteries might be less suitable <strong>for</strong> remote applications because <strong>of</strong> control system<br />
requirements and possibly greater environmental impacts, other second uses might be appropriate.<br />
Recycling makes economic sense if the revenues from recovered materials plus the avoided<br />
disposal costs are greater than the costs <strong>for</strong> collection and processing. One goal <strong>of</strong> battery recycling<br />
R&D projects is to develop processes that are economically viable on their own. However, there may<br />
be externalities — financial or nonfinancial (e.g., air quality) costs from disposal that accrue to<br />
society as a whole or to groups other than whoever is deciding the fate <strong>of</strong> discarded items. In such<br />
cases, a governmental agency sometimes makes regulations that <strong>for</strong>ce recycling even when it does<br />
not make economic sense. This changes the economics by internalizing the societal cost. The added<br />
49
financial burden can be transferred from the recycler to consumers, who should be considered<br />
responsible <strong>for</strong> safe end-<strong>of</strong>-life treatment <strong>of</strong> items they have used, by such means as deposits on new<br />
batteries. Drop-<strong>of</strong>f fees are not advised, because they would encourage illegal dumping. Regulations<br />
akin to those in place <strong>for</strong> Pb-acid batteries and used engine oil would also be appropriate <strong>for</strong><br />
encouraging returns. Auto wreckers and repair shops could also be given financial and regulatory<br />
incentives to return spent batteries <strong>for</strong> recycling. In Europe, product manufacturers are generally held<br />
responsible <strong>for</strong> end-<strong>of</strong>-life treatment; it is unclear whether this is the most efficient system <strong>for</strong><br />
recycling.<br />
Those recyclers that currently recycle Li-ion batteries charge fees <strong>for</strong> accepting material. These<br />
fees can be expected to decrease as the infrastructure <strong>for</strong> recycling and the markets <strong>for</strong> recycled<br />
materials are established. The consumer might pay a small fee to get rid <strong>of</strong> a battery, and then the<br />
person who collects a truckload <strong>of</strong> batteries might be paid <strong>for</strong> doing so. Sony expects its electronics<br />
battery recycling operation to be pr<strong>of</strong>itable with no drop-<strong>of</strong>f charge, on the basis <strong>of</strong> the value <strong>of</strong> the<br />
cobalt recovered. Toxco is unsure whether automotive batteries would require a drop-<strong>of</strong>f fee or if<br />
they would actually pay <strong>for</strong> the material. They currently charge to take Mn-based lithium batteries,<br />
but they might not need to do so with large volumes. This will depend on the quantity and reliability<br />
<strong>of</strong> this feedstock stream <strong>for</strong> their facilities, as well as on the recovery <strong>of</strong> other salable products (see<br />
Figure 7.4). Toxco is pondering recycling LiPF 6, an expensive battery ingredient, and solvents. The<br />
LithChem salt product (not currently recovered as such from batteries) has 99.99% or better quality<br />
and is already approved (Miller 2000). Perceived quality <strong>of</strong> the recovered products is an important<br />
factor in the economics. For example, one North American battery manufacturer purchases raw<br />
materials only from Japan, in the belief that the purity is higher (Ridgway 1999). It would be<br />
necessary to persuade users <strong>of</strong> the quality <strong>of</strong> recovered products. The cost <strong>of</strong> Toxco’s operation was<br />
initially about $4.50/lb ($10/kg), but it has decreased to less than half that. With larger quantities <strong>of</strong><br />
more uni<strong>for</strong>m input, costs could be expected to decrease, and revenues increase, even more.<br />
Even if there were a high drop-<strong>of</strong>f fee or a payment <strong>of</strong> $1/lb ($2.20/kg), recycling costs or<br />
revenues would not significantly perturb the lifecycle costs <strong>of</strong> Li-ion batteries. The Li-ion battery<br />
pack <strong>for</strong> a typical EV weighs approximately 800 lb. Even if the battery sales price were to come<br />
down to the USABC goal <strong>of</strong> $150/kWh, a 30-kWh pack would cost $4,500, and recycling would<br />
amount to less than 20% <strong>of</strong> the initial cost. (In reality, it is expected to be even less.)<br />
50
8.1 Conclusions<br />
Section 8<br />
Discussion<br />
It is apparent that there is significant potential <strong>for</strong> reduction in the price <strong>of</strong> Li-ion batteries,<br />
although meeting the cost goals set <strong>for</strong> them will remain an extremely difficult task. These price<br />
reductions will be achieved by substitution <strong>of</strong> less expensive materials, as well as by utilization <strong>of</strong><br />
improved production processes and more efficient production in larger plants. Significant R&D will<br />
be required to achieve the reductions.<br />
If electric vehicles were ever to be produced <strong>for</strong> the U.S. mass market, production or imports<br />
<strong>of</strong> several materials would need to be stepped up considerably, with the impact on price depending<br />
on the material. For some, such as cobalt, supplies could eventually be constrained, driving up the<br />
price. Material supply constraints would be a factor <strong>for</strong> pure EVs long be<strong>for</strong>e they would affect the<br />
hybrids, simply because <strong>of</strong> the larger quantities <strong>of</strong> materials required per vehicle. Similarly, hybrids<br />
would be less adversely affected in the event that battery costs remain above the goals set by the<br />
USABC and the PNGV, because batteries represent a much smaller percentage <strong>of</strong> the total cost <strong>of</strong><br />
hybrid vehicles. There<strong>for</strong>e, the research on material cost reduction is more crucial <strong>for</strong> EV<br />
development than <strong>for</strong> HEV development. This can be seen from the several hybrid models expected<br />
to be introduced into the automobile market during 2000.<br />
8.2 Japanese Dominance <strong>of</strong> the Li-<strong>Ion</strong> Battery Market<br />
The Japanese producers currently dominate the production <strong>of</strong> small Li-ion batteries and control<br />
much <strong>of</strong> the intermediate material supply. They have no inherent advantages, such as abundant raw<br />
material reserves (as is the case with Scandinavia’s abundant hydropower <strong>for</strong> aluminum production).<br />
They do not control raw material supplies and have not developed any particularly sophisticated<br />
technology. A policy decision was made to invest large amounts <strong>of</strong> money in the required capital<br />
equipment; as a result, a production infrastructure was built and unit costs are low. American firms<br />
are somewhat risk-averse and may face higher effective costs <strong>of</strong> capital; thus, they tend to start by<br />
producing in smaller volumes. The U.S. government could conceivably counteract these factors by<br />
<strong>of</strong>fering tax credits, low-interest loans, or loan guarantees. In the case <strong>of</strong> small batteries <strong>for</strong> consumer<br />
electronics, the Japanese market dominance is already established. The experience, infrastructure,<br />
and established supply lines would provide a definite advantage <strong>for</strong> Japanese producers; however,<br />
large volume production <strong>of</strong> batteries <strong>for</strong> electric and hybrid batteries has not yet been established.<br />
There<strong>for</strong>e, this market could be somewhat more open <strong>for</strong> U.S. producers, especially if U.S. firms<br />
could develop improved materials and designs, perhaps as the result <strong>of</strong> government-supported<br />
research.<br />
51
8.3 Possible Follow-On Work<br />
Several possibilities exist <strong>for</strong> useful projects to follow the work reported here. First, <strong>for</strong> the sake<br />
<strong>of</strong> comparing battery costs on a consistent basis, it is important to integrate this Li-ion cost work<br />
with the work done at the University <strong>of</strong> Cali<strong>for</strong>nia at Davis on nickel-metal hydride batteries<br />
(Lipman 1999). Next, a similar cost analysis could be done on other promising new battery types,<br />
in particular lithium-polymer and lithium-ion with polymer electrolyte. These battery types might<br />
have a large potential <strong>for</strong> reducing costs if they allowed removal <strong>of</strong> the separator from the cell<br />
design.<br />
<strong>Costs</strong> are not the only factor to be considered in choosing batteries (or in selecting areas <strong>for</strong><br />
R&D). It is also important to make sure that production <strong>of</strong> the batteries, motivated in the first place<br />
by the desire to improve the environmental footprint <strong>of</strong> automobiles, does not itself have a negative<br />
impact on the environment. To this end, it is also important to analyze the environmental impacts<br />
and energy use pr<strong>of</strong>ile <strong>for</strong> the manufacturing <strong>of</strong> these batteries.<br />
The most important function served by this overall economic analysis is to point out the need<br />
<strong>for</strong> continued research on materials <strong>for</strong> high-per<strong>for</strong>mance, long-life batteries. This ef<strong>for</strong>t could<br />
include extensions <strong>of</strong> Li-ion designs to new materials. Because this research is both costly and<br />
uncertain to yield results, private industry is unlikely to pursue the R&D on its own. There<strong>for</strong>e, it<br />
may be that increased sponsorship <strong>of</strong> this long-term, high-risk research by the U.S. government<br />
would be appropriate. Advantages <strong>of</strong> a government role include risk-sharing, reduced development<br />
time, increased U.S. competitiveness, reductions in emissions, and lessened reliance on petroleum<br />
imports.<br />
52
Section 9<br />
References<br />
Alfa Aesar (a Johnson Matthey company), 2000 [URL http://www.alfa.com/products/prodA12477.<br />
html] (accessed May 24, 2000).<br />
American Chemical Society, 1996, Production in the US Chemical Industry, Chemical and<br />
Engineering News, June 24. [URL http://pubs.acs.org/hotartcl/cenear/960624/prod.html]<br />
Bard, S., 1998, “<strong>Batteries</strong>... User’s Perspective,” 15th International Seminar and Exhibit on Primary<br />
and Secondary <strong>Batteries</strong>, Fort Lauderdale, Fla., March 2-5.<br />
Brohm, T., M. Maul, and E. Meissner, 1998, “Advanced <strong>Lithium</strong>-<strong>Ion</strong> <strong>Batteries</strong> <strong>for</strong> Electric<br />
<strong>Vehicles</strong>,” 15th Internation] al Electric Vehicle Symposium, Oct.<br />
Broussely, M., G. Rigobert, and G. Sarre, 1996, “Per<strong>for</strong>mances <strong>of</strong> a <strong>Lithium</strong> <strong>Ion</strong> Battery <strong>for</strong> Electric<br />
Vehicle,” 13th International Electric Vehicle Symposium.<br />
Carcone, J., 1998, “Update on Li-<strong>Ion</strong> <strong>Batteries</strong>,” 15th International Seminar and Exhibit on Primary<br />
and Secondary <strong>Batteries</strong>, Fort Lauderdale, Fla., March 2-5.<br />
Chappell, H., 1999, Sogem, USA, Raleigh, N.C., personal communication, Sept.<br />
Cost, H., 1999, “Status <strong>of</strong> USABC/PNGV Battery Development,” 11th International Battery Waste<br />
Management Seminar, Deerfield Beach, Fla., Nov. 1-3.<br />
Cuenca, R.M., L.L Gaines, and A.D. Vyas, 1999, Evaluation <strong>of</strong> Electric Vehicle Production and<br />
Operating <strong>Costs</strong>, Argonne National Laboratory Report ANL/ESD-41, Aug.<br />
David, J., 1999, Battery Recycling ‘99, 11th International Battery Waste Management Seminar,<br />
Deerfield Beach, Fla., Nov. 1-3.<br />
Desilvestro, H., 2000, Pacific <strong>Lithium</strong>, New Zealand, personal communication, Feb.<br />
EM Industries (Division <strong>of</strong> Merck, Inc.), 1999, Hawthorne, N.Y., personal communication, Sept.<br />
England, N., 1999, PRBA Global Update, 11 th International Battery Waste Management Seminar,<br />
Deerfield Beach, Fla., Nov. 1-3.<br />
Ferro, Inc., 2000, personal communication, March 6-9.<br />
Gif<strong>for</strong>d, P., 2000, Reuse <strong>of</strong> Nickel Metal Hydride <strong>Batteries</strong> in Remote Areas, Advanced Battery<br />
Readiness Ad Hoc Working Group, Washington, D.C., March 22-23.<br />
53
Hake, M., 1996, Rechargeable <strong>Lithium</strong> <strong>Batteries</strong>: Li-<strong>Ion</strong> Technology, Varta Special Report 1/96,<br />
Oct.<br />
Haskins, H., 1999, Ford Motor Company, Dearborn, Mich., personal communication, Dec.<br />
Haskins, H., 1997, “<strong>Lithium</strong> <strong>Ion</strong> Battery Technology Shows Promise,” USCAR web site [URL<br />
http://www.pm.branch.com/lithium.html] (as <strong>of</strong> June 3, 1997).<br />
H<strong>of</strong>fman, D., 1999, Celgard, Charlotte, N.C., personal communication, Nov.<br />
Hohsen Corp., 1998, Osaka, Japan; advertisements in ITE Battery Newsletter, No. 2 (March-April),<br />
published by International Technology Exchange Society, ITE-JEC Press, Inc., Brunswick, Ohio.<br />
Irving, I., 1998, “Overview <strong>of</strong> Li-<strong>Ion</strong> Polymer Rechargeable <strong>Batteries</strong>,” Wireless Design Online,<br />
Oct. 29. [URL http://news.wireless.design...e.com/design_features/1998_1029_1314.html] (accessed<br />
Sept. 27, 1999).<br />
Jones, T.S., 1999, USGS, Reston, Va., personal communication, Dec.<br />
Kalhammer, F.R., et al., 1995, Per<strong>for</strong>mance and Availability <strong>of</strong> <strong>Batteries</strong> <strong>for</strong> Electric <strong>Vehicles</strong>: A<br />
Report <strong>of</strong> the Battery Technical Advisory Panel, prepared <strong>for</strong> Cali<strong>for</strong>nia Air Resources Board,<br />
El Monte, Calif., Dec. 11.<br />
Keijha, J., 2000, HPS– High Purity <strong>Lithium</strong> from Spent <strong>Lithium</strong> Battery Materials, Advanced Battery<br />
Readiness Ad Hoc Working Group, Washington, D.C., March 22-23.<br />
Koch, V., 2000, “Advanced Materials <strong>for</strong> High Power Li-<strong>Ion</strong> <strong>Batteries</strong>,” 17 th International Seminar<br />
and Exhibit on Primary and Secondary <strong>Batteries</strong>, Ft. Lauderdale, Fla., March 6-9.<br />
Kohler, U., 1999, VARTA Status on Advanced <strong>Batteries</strong>, Advanced Battery Readiness Ad Hoc<br />
Working Group Meeting, Washington, D.C., Feb. 18-19.<br />
Kuck, P., 2000, Recycling <strong>of</strong> Ni-Bearing Scrap, Advanced Battery Readiness Ad Hoc Working<br />
Group, Washington, D.C., March 22-23.<br />
Kuck, P., 1999, USGS, personal communication, Dec.<br />
Kuck, P., 1996, Nickel, USGS, Minerals In<strong>for</strong>mation.<br />
Lipman, T.E., 1999, The Cost <strong>of</strong> Manufacturing Electric Vehicle <strong>Batteries</strong>, Report <strong>for</strong> the Cali<strong>for</strong>nia<br />
Air Resources Board, Institute <strong>for</strong> <strong>Transportation</strong> Studies, University <strong>of</strong> Cali<strong>for</strong>nia, Davis, Calif.,<br />
Report Number UCD-ITS-RR-99-5, May.<br />
Martin, T., 1999, Celgard, Charlotte, N.C., personal communication, Nov.<br />
54
McLaughlin, W., 1999, Summary <strong>of</strong> <strong>Lithium</strong> Battery Recycling Status, Advanced Battery Readiness<br />
Ad Hoc Working Group Meeting, Washington, D.C., Feb. 18-19.<br />
McLaughlin, W., 1998, Recycling <strong>of</strong> Large <strong>Lithium</strong> <strong>Batteries</strong>, Advanced Battery Readiness Ad Hoc<br />
Working Group Meeting, Washington, D.C., March 4-5.<br />
MetalPrices LLC, 2000a [URL http://www.MetalPrices.com/metals/co/co_12_month_charts.htm]<br />
(accessed April 20, 2000).<br />
MetalPrices LLC, 2000b [URL http://www.metalprices.com/metals/nickelalloys/ni_chart_12_<br />
month_price.htm] (accessed May 15, 2000).<br />
Miller, D., 2000, EV Battery Recycling, Advanced Battery Readiness Ad Hoc Working Group,<br />
Washington, D.C., March 22-23.<br />
Miller, D., 1999, Toxco, Trail, B.C., Canada, personal communication, Nov.<br />
Miyamoto, T., E. Oohami, T. Horiba, et al., 2000, “Development <strong>of</strong> a <strong>Lithium</strong>-<strong>Ion</strong> Battery System<br />
<strong>for</strong> HEVs,” SAE 2000-01-1057, 2000 World Congress, Detroit, Mich., March 6-9.<br />
Nakai, M., 1999, Matsushita Battery Industrial Corp. <strong>of</strong> America– Materials Division (MBIA-MD),<br />
Columbus, Ga., personal communication, Nov.<br />
Narang, S., 1998, “Nonflammable Electrolyte <strong>for</strong> <strong>Lithium</strong> <strong>Batteries</strong>,” 15th International Seminar and<br />
Exhibit on Primary and Secondary <strong>Batteries</strong>, Fort Lauderdale, Fla., March 2-5.<br />
Nissan, 1999 [URL http://www.nissan-na.com/1.0/1-2-le.html] (as <strong>of</strong> Jan. 14, 1999).<br />
Ober, J., 1999, USGS, personal communication, Nov.<br />
Ober, J., 2000, <strong>Lithium</strong> Market/Supply News, Advanced Battery Readiness Ad Hoc Working Group,<br />
Washington, D.C., March 22-23.<br />
Oweis, S., 1999, Li-<strong>Ion</strong> Battery Technology at SAFT, Advanced Battery Readiness Ad Hoc Working<br />
Group Meeting, Washington, D.C., Feb. 18-19.<br />
Oweis, S., et al., 1999, “<strong>Lithium</strong> <strong>Ion</strong> Technology <strong>for</strong> Hybrid Electric <strong>Vehicles</strong>,” Energy Storage<br />
Technology Conf., University <strong>of</strong> Cali<strong>for</strong>nia at Davis, April 27.<br />
Pacific <strong>Lithium</strong>, 2000a [URL http://www.pacificlithium.com/p110.htm] (accessed Feb. 2, 2000).<br />
Pacific <strong>Lithium</strong>, 2000b [URL http://www.pacificlithium.com/purif.htm] (accessed Feb. 2, 2000).<br />
Panasonic Corp., 1996, “Matsushita Celebrates Official Opening <strong>of</strong> <strong>Lithium</strong> Battery Plant in<br />
Columbus, Georgia,” press release, May 10.<br />
55
Paul Scherrer Institute web site, 2000, Villigen, Switzerland [URL: http://www1.<br />
psi.ch/www_f5_hn/Electrochemistry/lithium.html] (accessed March 20, 2000).<br />
Pekala, R.W., et al., 2000, “Separators: An Overlooked Opportunity to Enhance Battery<br />
Per<strong>for</strong>mance?,” 17th International Seminar and Exhibit on Primary and Secondary <strong>Batteries</strong>,<br />
Ft. Lauderdale, Fla., March 6-9.<br />
Piazza, S., 1998, “<strong>Lithium</strong> <strong>Ion</strong> Polymer <strong>Batteries</strong>,” 15th International Seminar and Exhibit on<br />
Primary and Secondary <strong>Batteries</strong>, Fort Lauderdale, Fla., March 2-5.<br />
Pickering, P., 2000, Pacific <strong>Lithium</strong>, Auckland, New Zealand, personal communication, March.<br />
Polystor Corp., Inc., 2000 [URL http://www.polystor.com/manuf.htm] (accessed May 24, 2000).<br />
Ridgway, M., 1999, NEC Moli Energy, Maple Ridge, B.C., Canada, personal communication, Nov.<br />
Roque, G., 1998, General Update on <strong>Lithium</strong> <strong>Ion</strong> <strong>Batteries</strong> with the Altra EV, Advanced Battery<br />
Readiness Ad Hoc Working Group Meeting, Washington, D.C., March 4-5.<br />
Roque, G., 1999, Nissan Motor Corporation USA, personal communication, Nov.<br />
Roque, G., and W. McLaughlin, 1999, “Preparing <strong>for</strong> the EVs and the EV <strong>Batteries</strong>,”<br />
11th International Battery Waste Management Seminar, Deerfield Beach, Fla., Nov. 1-3.<br />
Sandi, G., 1999, Argonne National Laboratory, Argonne, Ill., personal communication, Oct.<br />
Sandor, G., 1999, FMC Corp. <strong>Lithium</strong> Division, Gastonia, N.C., personal communication, Sept.<br />
Scrosati, B., 2000, “New <strong>Lithium</strong> <strong>Ion</strong> Battery Materials,” 17th International Seminar and Exhibit on<br />
Primary and Secondary <strong>Batteries</strong>, Ft. Lauderdale, Fla, March 6-9.<br />
Shedd, K., 1999, USGS, Reston, Va., personal communication, Dec.<br />
Small, M., 1999, “Update on Sony Li <strong>Ion</strong> Battery Recycling Programs,” 11th International Battery<br />
Waste Management Seminar, Deerfield Beach, Fla., Nov. 1-3.<br />
Smith, D., 1996, Sony <strong>Lithium</strong>-<strong>Ion</strong> Battery Recycling Program, Advanced Battery Readiness Ad Hoc<br />
Working Group Meeting, Washington, D.C., March 21-22.<br />
Smith, D., 1999, <strong>Lithium</strong>-<strong>Ion</strong> Battery Recycling, Advanced Battery Readiness Ad Hoc Working<br />
Group Meeting, Washington, D.C., Feb. 18-19.<br />
Sony, 2000 [URL http://www.world.sony.com/Electronics/BAT/ION/eng/page1.html] (accessed<br />
May 10, 2000).<br />
56
Spotnitz, R., 1999a, <strong>Lithium</strong>-<strong>Ion</strong> <strong>Batteries</strong> <strong>for</strong> Hybrid Electric <strong>Vehicles</strong>, Ad Hoc Working Group<br />
Meeting, Washington, D.C., Feb. 18-19.<br />
Spotnitz, R., 1999b, Polystor Corp., Dublin, Calif., personal communication, March.<br />
Toxco, Inc., 2000 [URL http://www.toxco.com/Pages/Fac.html] (accessed May 24, 2000).<br />
Turner, R., 1999, Matsushita Battery Industrial Corp., Columbus, Ga., personal communication, Jan.<br />
U.S. Geological Survey, 2000, “Mineral Commodity Summaries,” from web site [URL<br />
http://minerals.usgs.gov/minerals/pubs/mcs/] (as <strong>of</strong> Feb. 2000).<br />
U.S. Geological Survey, 1998, “Metal Prices in the United States through 1998,” from web site<br />
[URL http://minerals.usgs.gov/minerals/pubs/metal_prices/] (accessed May 10, 2000).<br />
U.S. Geological Survey, 1997, “Minerals In<strong>for</strong>mation — 1997,” reports <strong>for</strong> <strong>Lithium</strong>, Cobalt, Nickel,<br />
and Manganese, from web site [URL http://minerals.usgs.gov/minerals/pubs/mcs/1997/].<br />
Vimmerstedt, L.J., S. Ring, and C.J. Hammel, 1995, Current Status <strong>of</strong> Environmental, Health, and<br />
Safety Issues <strong>of</strong> <strong>Lithium</strong> <strong>Ion</strong> Electric Vehicle <strong>Batteries</strong>, National Renewable Energy Laboratory<br />
Report NREL/TP-463-7673, Sept.<br />
Wanta, M., 1999, Superior Graphite, Chicago, Ill., personal communication, Nov. 25.<br />
Xie, L., D. Fouchard, and S. Megahed, 1995, “Material Requirements <strong>for</strong> <strong>Lithium</strong>-<strong>Ion</strong> <strong>Batteries</strong>,”<br />
Material Research Society Symposium Proceedings, Vol. 393.<br />
57
Internal<br />
F. Bennett M. Hale<br />
R.M. Cuenca L.R. Johnson<br />
L.L. Gaines (208) R.P. Larsen<br />
G. Griparis D.J. Santini<br />
External<br />
58<br />
Distribution<br />
ANL-E Library<br />
ANL-W Library<br />
K. Heitner, U.S. Department <strong>of</strong> Energy, Office <strong>of</strong> <strong>Transportation</strong> Technologies (25)<br />
P.D. Patterson, U.S. Department <strong>of</strong> Energy, Office <strong>of</strong> <strong>Transportation</strong> Technologies (10)<br />
R. Sutula, U.S. Department <strong>of</strong> Energy, Office <strong>of</strong> <strong>Transportation</strong> Technologies (10)<br />
U.S. Department <strong>of</strong> Energy, Office <strong>of</strong> Scientific and Technical In<strong>for</strong>mation (2)