Genomewide association studies (GWAS) Part I Matti Pirinen
Genomewide association studies (GWAS) Part I Matti Pirinen
Genomewide association studies (GWAS) Part I Matti Pirinen

Create successful ePaper yourself
Turn your PDF publications into a flip-book with our unique Google optimized e-Paper software.
A minicourse on<br />
<strong>Genomewide</strong> <strong>association</strong> <strong>studies</strong><br />
(<strong>GWAS</strong>)<br />
<strong>Part</strong> I<br />
<strong>Matti</strong> <strong>Pirinen</strong><br />
FIMM, University of Helsinki<br />
December 4th 2012
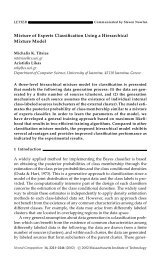
Published Genome-wide <strong>association</strong>s 07/2012<br />
p
Concepts<br />
●<br />
●<br />
●<br />
●<br />
Individuals (humans, mice, flies, grass)<br />
Phenotypes, traits<br />
– Quantitative (height, cholesterol levels)<br />
– Discrete (case-control, Parkinson's disease)<br />
EXPLAIN<br />
– Understanding, mechanisms, therapeutics<br />
– Example: SORT1 (Musunuru 2010)<br />
PREDICT<br />
– Early intervention, agriculture
Y=μ+G+E+(GxE)<br />
●<br />
●<br />
●<br />
●<br />
Y phenotype, μ population mean<br />
E nvironment<br />
– Chemicals, temperature, food, physical activity...<br />
G enetics<br />
– DNA, A,C,G,T, 3e+9 bases, 22 chrs + X + Y,<br />
diploid, meiosis<br />
– Genes → proteins, 2e+4, 1-2 % of DNA<br />
– Single nucleotide polymorphisms (SNPs)<br />
GxE not in this course
Linkage disequilibrium<br />
●<br />
Non-independence of alleles at (two) SNPs in<br />
population<br />
● r² and D', (Wray et al. 2011, p4 BOX 2)<br />
●<br />
●<br />
●<br />
Look at 1000 Genomes browser: rs4988235<br />
LD → SNPs tag each other in a population<br />
sample<br />
Basis for gene mapping with a SNP panel
Heritability<br />
●<br />
●<br />
Y=G+E<br />
Simplest model without measured variants or<br />
environment<br />
– G~N(0,s²), cor(full-sibs)>cor(half-sibs)<br />
– E~N(0,t²), cor(household)>0<br />
– H=var(G)/var(Y)=s²/(s²+t²), heritability<br />
– var(Y) can be decomposed to s² and t² with<br />
variance component models, but environment<br />
is a potential confounder
Example: ACE twin model<br />
●<br />
●<br />
Y=A+C+E<br />
– A, additive genetic component<br />
– C, common environment for twins<br />
– E, non-shared environment for twins<br />
From (many pairs of) monozygotic (identical)<br />
twins AND dizygotic twins, var(A), var(C) and<br />
var(E) can be estimated → estimate of<br />
heritability as 2(cor(MZ)-cor(DZ))<br />
– But with strong assumptions!
Linkage analysis<br />
●<br />
Families<br />
– Does trait correlate with genetic sharing at some<br />
parts of the genome<br />
– Parametric Linkage analysis in pedigrees<br />
– Affected sib-pairs (non-parametric)<br />
– Need for families restricts sample size and thus<br />
size of genetic effects that can be found<br />
– Localisation is coarse since large blocks of<br />
genome are linked in close relatives
Association analysis<br />
●<br />
If a large panel of SNPs can be genotyped,<br />
<strong>association</strong> between each SNP and the trait<br />
can be tested<br />
– Role of LD (HapMap project)<br />
● Risch 2000, Fig 4<br />
●<br />
●<br />
Only samples from (homogeneous) population<br />
(not families) needed<br />
Genome coverage and localisation depend on<br />
#SNPs and LD in the population
Genotyping<br />
●<br />
●<br />
●<br />
Chips<br />
– YOUTUBE: “Microarray method for genetic testing”<br />
– YOUTUBE: “DNA chips and microarrays”<br />
– Currently 50-200 euros per sample<br />
Intensities → genotype calls (Vukcevic p.36)<br />
Problems (Vukcevic p.38)
Genotype probabilities<br />
The data comes with 5 types of “header” information<br />
We report the probability for each of the three genotypes<br />
P(AA) = 0 P(AG) = 0.9985 P(GG) = 0.0015<br />
A null call is represent by three zeros
Quality control<br />
●<br />
Remove individuals and SNPs that show low<br />
quality<br />
● Anderson et al. 2010<br />
●<br />
●<br />
Individuals: Sex discrepancies, missingness,<br />
heterozygosity, relatedness, ancestry<br />
SNPs: missingness, deviation from Hardy-<br />
Weinberg equilibrium, low minor allele<br />
frequency
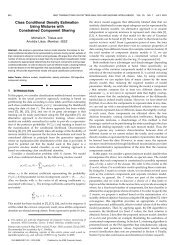
X intensity<br />
Gender
Individual QC
Relatedness<br />
We look for relatedness in two stages:<br />
- Calculate genome-wide allele sharing between all<br />
pairs<br />
- For each individual estimate the portion of their<br />
genome IBD 0,1 and 2 with their closest relative<br />
We exclude individuals until there is no pair of<br />
individuals with more than 5% IBD
Relatedness
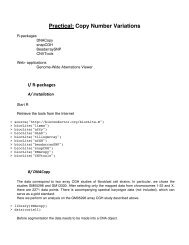
Population structure<br />
For all collections we project individuals onto axis of<br />
variation which are chosen to explain the diversity in<br />
HapMap<br />
We cluster individuals and exclude those who’s ancestry<br />
outlier with respect to the rest of the sample
Population structure
Population structure
QC genotype calls<br />
The optimal approach is either to model the calling<br />
errors or to look at all cluster plots<br />
SNP filtering is then a short cut<br />
The level of SNP filtering is therefore a trade-off<br />
Software for looking at cluster plots using binary data<br />
http://sourceforge.net/projects/evoker/<br />
(Jeff Barrett)
Minor allele frequency<br />
Genotype calling algorithms like to model the extra<br />
clusters
Low Information<br />
Information is good a identify SNPs with insufficient<br />
resolution of genotypes
Hardy-Weinberg<br />
Clustering errors, or putative CNP often distorts<br />
HW equilibrium
Missingness<br />
High missingness is also indicative of clustering<br />
failure or poor cluster resolution
SNP exclusions<br />
The application of SNP exclusions is aimed<br />
at capturing three classes:<br />
- Poor clustering<br />
- Low signal to noise<br />
- Non-SNP like variation (known CNVs)<br />
Guide to looking at cluster plots in the<br />
Supplementary material of WTCCC 2007<br />
paper
Information metric<br />
A natural way to assess the utility of the<br />
calls at a SNP is to assess the information<br />
about the allele frequency. (info column in<br />
SNPTEST output)<br />
Compare two measures of information<br />
- Using expectation of genotype calls<br />
- Accounting for probabilistic genotypes
SNP QC<br />
Most poor cluster plots can be identified by<br />
these simple filters<br />
We have chosen a set of SNP filters on the<br />
basis of the control-control comparison<br />
Filters depend on data quality and requires<br />
an iterative approach for each data set…
Testing for <strong>association</strong><br />
100% of SNPS
Testing for <strong>association</strong><br />
80.69% of SNPS<br />
1% MAF
Testing for <strong>association</strong><br />
78.36% of SNPS<br />
MAF > 1% & info > 0.975
Testing for <strong>association</strong><br />
78.36% of SNPS<br />
MAF > 1% & info > 0.975 & HW < 1e-20
Testing for <strong>association</strong><br />
77.92% of SNPS<br />
MAF > 1% & info > 0.975 & HW < 1e-20 miss < 2%
A “clean” data set<br />
Applying these filters results in a typically only 10 to 100<br />
signals of <strong>association</strong> (e.g. p < 1e-7)<br />
Comparing number of exclusions depends heavily on<br />
low MAF (which depends on population etc)<br />
Important to apply filters to each set of collections or<br />
calls separately<br />
Of those remaining…still lots of checking to do
Fingerprint<br />
markers, gender<br />
checks<br />
Genotype QC, intensity<br />
outlier<br />
Given an individual’s disease status, their genotype at a<br />
SNP, is independent of, and identically distributed to,<br />
other samples conditional on the underlying genotype<br />
frequencies in cases and controls<br />
Duplicate checks,<br />
relatedness<br />
Population structure<br />
analysis
A retracted paper<br />
●<br />
Sebastiani et al. “Genetic signatures of<br />
exceptional longevity in humans” Science July<br />
2010<br />
– Was retracted in July 2011 because QC had not<br />
been done properly!<br />
Sebastiani<br />
et al. 2010<br />
Science