Download the complete presentation - Bourbon
Download the complete presentation - Bourbon
Download the complete presentation - Bourbon

You also want an ePaper? Increase the reach of your titles
YUMPU automatically turns print PDFs into web optimized ePapers that Google loves.
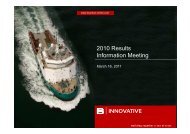
2010 1st half results<br />
INFORMATION MEETING<br />
September 1 st , 2010
Growth of <strong>the</strong> Offshore fleet<br />
Utilisation rate<br />
Q2 2010<br />
388<br />
81%<br />
Number of vessels (end of period)<br />
260<br />
288<br />
326<br />
357<br />
362<br />
273<br />
163<br />
Total fleet<br />
61%<br />
Fleet in operation<br />
77%<br />
June-08 Dec-08 June-09 Dec-09 June -10<br />
Source : Sec filings and companies reports<br />
2
Financial impact of fleet growth in unfavorable markets<br />
H1 2009 H1 2010<br />
Number of ships Dayrates Utilisation rates Revenues<br />
326<br />
388<br />
Number of ships<br />
Vessels cash costs<br />
G&A and o<strong>the</strong>r costs<br />
Operation costs<br />
326<br />
388<br />
EBITDA<br />
Number of ships<br />
Depreciation rate Depreciation costs<br />
Impairment<br />
Depreciation and<br />
provisions<br />
326<br />
388<br />
16 bulk<br />
carriers<br />
EBIT<br />
3
Financial results<br />
Laurent RENARD<br />
Executive Vice President<br />
Finance & Administration
BOURBON - Context<br />
100<br />
90<br />
H1<br />
2009<br />
average<br />
H2<br />
2009<br />
average<br />
H1<br />
2010<br />
average<br />
80<br />
Oil barrel<br />
price ($/d)<br />
70<br />
60<br />
50<br />
40<br />
30<br />
52 57 77<br />
20<br />
10<br />
0<br />
2009<br />
2010<br />
35 000<br />
30 000<br />
25 000<br />
Baltic Supramax<br />
Index ($/d)<br />
20 000<br />
15 000<br />
10 000<br />
13,700 21,000 26,400<br />
5 000<br />
0<br />
1,6<br />
2009 2010<br />
1,5<br />
€/$ Rate<br />
1,4<br />
1,3<br />
1.33 1.45 1.33<br />
1,2<br />
1,1<br />
1,0<br />
2009 2010<br />
5
BOURBON<br />
Income statement<br />
In millions of euros H1 2010 H2 2009 H1 2009<br />
Change %<br />
H1 2010/<br />
H1 2009<br />
Number of owned vessels (end of period) 403 369 335 +20.3%<br />
Revenues 490.4 461. 4 468.4 +4.7%<br />
EBITDA excluding capital gains<br />
146.6<br />
164.9<br />
171.9<br />
% of revenues<br />
29.9%<br />
35.8%<br />
36.7%<br />
Capital gains<br />
22.0<br />
0.2<br />
1.0<br />
Gross Operating Income (EBITDA) 168.5 165.2 172.9 (2.5)%<br />
Impairment charge (34.3)<br />
O<strong>the</strong>r amortization, depreciation and provisions (94.8) (72.3) (59.2)<br />
Operating Income (EBIT) 39.4 92.8 113.7 (65.3)%<br />
Capital employed<br />
Ann. EBITDA / average capital employed excl.<br />
Installments<br />
3 560<br />
13.4%<br />
3 258<br />
15.1%<br />
3 022<br />
18.3%<br />
Gross Capital Expenditures 341 345 398<br />
6
BOURBON<br />
Income statement<br />
In millions of euros H1 2010 H2 2009 H1 2009<br />
Change %<br />
H1 2010/<br />
H1 2009<br />
Operating Income (EBIT) 39.4 92.8 113.7 (65.3)%<br />
Financial Income<br />
13.8<br />
(13.9)<br />
(18.7)<br />
•Cost of net debt<br />
(27.1)<br />
(18.8)<br />
(14.5)<br />
•O<strong>the</strong>r financial gains & expenses<br />
40.9<br />
4.9<br />
(4.2)<br />
Discontinued activities (1.5) 5.4 1.2<br />
O<strong>the</strong>rs (taxes, minority interests by equity<br />
method)<br />
(10.7) (11.2) (13.9)<br />
Net Income, Group share 41.0 73.1 82.3 (50.1)%<br />
7
Growth in revenues +6.3%<br />
(+ 2.7% at constant exchange rates)<br />
In millions of euros<br />
461<br />
2<br />
27<br />
490<br />
+ 6%<br />
(16)<br />
474<br />
Offshore<br />
Bulk<br />
Δ Change<br />
Offshore :<br />
o 33 deliveries in H1 2010<br />
o Decline in charters (€10m)<br />
o Market deterioration<br />
Vrac :<br />
o 5 additional vessels equivalent<br />
H2 2009<br />
Revenues<br />
H1 2010<br />
Revenues<br />
H1 2010 Revenues<br />
at constant<br />
exchange rates<br />
8
EBITDA up 2.0%<br />
(down at constant exchange rates)<br />
In millions of euros<br />
165 (29)<br />
10<br />
1<br />
22<br />
168<br />
+ 2,0%<br />
(7)<br />
161<br />
Δ Change<br />
Offshore<br />
Bulk<br />
Corporate<br />
Net capital<br />
gains<br />
Offshore:<br />
o Organic Growth<br />
o Market downturn<br />
Bulk:<br />
o Expansion of owned fleet<br />
o Improvement in prices<br />
EBITDA<br />
H2 2009<br />
EBITDA<br />
H1 2010<br />
EBITDA<br />
H1 2010<br />
at constant<br />
exchange rates<br />
9
BOURBON<br />
Net Income, Group Share (NIGS)<br />
In millions of euros<br />
168 (34)<br />
(95)<br />
Impairment<br />
Genco sale<br />
39<br />
(27)<br />
41<br />
(1)<br />
(11)<br />
41<br />
amortization,<br />
depreciation<br />
and provisions<br />
Discontinued<br />
activities<br />
O<strong>the</strong>rs<br />
& IS<br />
H1 2010<br />
EBITDA<br />
EBIT<br />
Cost of<br />
net debt<br />
Financial results<br />
O<strong>the</strong>rs*<br />
H1 2010<br />
NIGS<br />
* Of which €26 m of unrealized financial gains<br />
10
Offshore – Key data<br />
In millions of euros H1 2010 H2 2009 H1 2009<br />
Change %<br />
H1 2010/<br />
H1 2009<br />
Number of owned vessels (end of period) 388 357 326 +19%<br />
Revenues 403.8 402.2 407.7 (1)%<br />
Owned vessels<br />
387.3<br />
375.5<br />
363.8<br />
+6.5%<br />
External chartered vessels<br />
16.5<br />
26.7<br />
43.8<br />
(62)%<br />
Gross Operating income (EBITDA)<br />
125.7<br />
154.7<br />
158.7<br />
(21)%<br />
% of revenues<br />
31.1%<br />
38.3%<br />
38.9%<br />
Amortization, depreciation and provisions (84.8) (65.2) (54.3)<br />
Operating Income (EBIT)<br />
40.9<br />
89,5<br />
104,4<br />
(61)%<br />
% of revenues<br />
10.1%<br />
22.2%<br />
25.6%<br />
Capital employed<br />
Ann. EBITDA / average capital employed excl.<br />
installments<br />
3,028<br />
11.5%<br />
2,795<br />
16%<br />
2,563<br />
18.2%<br />
Gross Capital Expenditures 225 271 265<br />
11
Offshore – Revenues virtually stable<br />
In millions of euros<br />
27 (10)<br />
402 (25) 404 +0.4% (9)<br />
10<br />
395<br />
Constant<br />
scope<br />
Effect if<br />
Brazil<br />
consolidated<br />
7,4%<br />
100%<br />
New<br />
vessels<br />
and<br />
ROVs<br />
Chartered<br />
vessels<br />
Δ Change<br />
33 deliveries in H1 2010<br />
Market deterioration<br />
H2 2009<br />
Revenues<br />
H1 2010<br />
Revenues<br />
H1 2010 Revenues<br />
at constant<br />
exchange rates<br />
12
Offshore – Managing costs in an unfavorable market<br />
In millions of euros<br />
248<br />
13<br />
8<br />
20<br />
(11)<br />
278 (9)<br />
+12%<br />
269<br />
Constant<br />
scope<br />
7,4%<br />
Effect if<br />
Brazil<br />
consolidated<br />
100%<br />
New<br />
vessels<br />
and<br />
ROVs<br />
Chartered<br />
vessels<br />
Δ Change<br />
Investments in crew training and in<br />
maintenance optimization<br />
Development of local crews<br />
Costs of moving vessels<br />
H2 2009<br />
Costs<br />
H1 2010<br />
Costs<br />
H1 2010<br />
Costs<br />
at constant<br />
exchange rates<br />
13
Marine de Services Activity<br />
Key data<br />
In millions of euros H1 2010 H2 2009 H1 2009<br />
Change %<br />
H1 2010/<br />
H1 2009<br />
Number of owned vessels (end of period) 373 343 312 +19.6%<br />
Revenues<br />
324.5<br />
323.2<br />
338.2<br />
(4)%<br />
• Owned vessels<br />
• External chartered vessels<br />
319.4<br />
5.1<br />
309.5<br />
13.7<br />
302.5<br />
35.7<br />
+6%<br />
(86%)<br />
EBITDA excluding capital gains<br />
98.8<br />
122.5<br />
132.0<br />
(25)%<br />
% of revenues<br />
30.4%<br />
37.9%<br />
39.0%<br />
Capital gains - 0.5 1,2<br />
Gross Operating Income (EBITDA) 98.8 123.1 133.2 (26)%<br />
16 additional <strong>Bourbon</strong> Liberty vessels in H1<br />
Virtual end of chartering<br />
Unfavorable market<br />
14
Subsea Services Activity<br />
Key data<br />
In millions of euros H1 2010 H2 2009 H1 2009<br />
Change %<br />
H1 2010/<br />
H1 2009<br />
Numbers of owned vessels (end of period) 15 14 14 +7.1%<br />
Revenues<br />
79.3<br />
79.0<br />
69.4<br />
14%<br />
• Owned vessels<br />
67.9<br />
66.0<br />
61.3<br />
11%<br />
• External chartered vessels<br />
11.4<br />
13.0<br />
8.1<br />
40%<br />
EBITDA excluding capital gains<br />
26.9<br />
31.6<br />
25.5<br />
6%<br />
% of revenues<br />
34.0%<br />
40.1%<br />
36.7%<br />
Capital gains - - -<br />
Gross Operating Income (EBITDA) 26.9 31.7 25.5 6%<br />
1 additional IMR vessel<br />
An activity with predominantly long-term contracts<br />
15
Bulk Division – Key data<br />
In millions of euros H1 2010 H2 2009 H1 2009<br />
Change %<br />
H1 2010/<br />
H1 2009<br />
Number of owned vessels (end of period) 15 12 9 66%<br />
Revenues 86.3 58.8 60.5 43%<br />
O<strong>the</strong>r amortization, depreciation and provisions<br />
26.2<br />
16.5<br />
20.9<br />
25%<br />
% of revenues<br />
30.3%<br />
28.1%<br />
34.5%<br />
Capital gains<br />
22.0<br />
-<br />
-<br />
Gross Operating Income (EBITDA) 48.1 16.5 20.9 X 2.3<br />
Impairment charge (34.3) - -<br />
O<strong>the</strong>r (9.6) (6.4) (3.7)<br />
Operating Income (EBIT) 4.2 10.1 17.2 (75)%<br />
5 x 58,000-ton vessels delivered in H1<br />
The sales of bulk carriers decrease <strong>the</strong> operating income by € 12.3 m<br />
Very positive « long-term contract » effect in H1 2009<br />
16
Bulk Division<br />
Strong increase in owned-vessels margin + 49%<br />
In millions of dollars H1 2010 H2 2009<br />
Owned vessels<br />
• Revenues<br />
• Margin*<br />
Margin*/ revenues<br />
59.0<br />
36.3<br />
61 %<br />
44.2<br />
24.3<br />
55%<br />
Growth of <strong>the</strong> fleet<br />
(2 vessels equivalent)<br />
Price increase<br />
Chartered vessels<br />
• Revenues<br />
• Margin*<br />
Margin*/ Revenues<br />
55.5<br />
8.1<br />
15 %<br />
41.1<br />
6.1<br />
15%<br />
Upturn in volume of activity<br />
(2.7 vessels equivalent)<br />
Operating margin* 44.4 30.4<br />
Margin on revenues 38.8 % 35.6%<br />
* Excluding capital gains, overheads and provision for impairment<br />
17
Net Debt at June 30, 2010<br />
In millions of euros<br />
2,033 500<br />
1,517 711<br />
Future disposals<br />
822<br />
Installments on<br />
vessels under<br />
construction<br />
Shareholders’equity at<br />
June 30, 2010<br />
Net debt at<br />
June 30, 2010<br />
Net operating<br />
debt<br />
18
Outlook<br />
• Capital investment of $2,000m:<br />
‣39 vessels on firm order for $580m<br />
• Asset disposals totaling €500m<br />
‣Sales of 10 of 16 bulk carriers already realised at <strong>the</strong> end of<br />
August for $332m<br />
‣Probable sale of Sucrerie <strong>Bourbon</strong> Tay Ninh in <strong>the</strong> near future<br />
19
In Conclusion<br />
• Good resistance of BOURBON EBITDA and significant<br />
decrease of EBIT due to depreciation and impairment<br />
charge<br />
• In Offshore, <strong>the</strong> impact of unfavorable market is more<br />
sensitive in Marine Services Activity, while Subsea<br />
Services Activity is in progress<br />
• The effects of <strong>the</strong> decision to sell Bulk assets will be felt in<br />
<strong>the</strong> second half of 2010<br />
Debt reduction<br />
Lower contribution from <strong>the</strong> Bulk Division to <strong>the</strong> generation of<br />
EBITDA<br />
20
ACTIVITY<br />
Christian LEFEVRE<br />
Executive Vice-President<br />
Operations
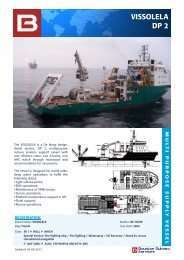
Subsea Services Activity - <strong>Bourbon</strong> Enterprise<br />
1st contract on <strong>the</strong> wind market for BOURBON<br />
• Client - FLUOR Group (United States)<br />
• The biggest offshore wind farm<br />
• 147 km², 26 km off <strong>the</strong> Suffolk coast (UK)<br />
• 140 x 500 MW electric wind turbines (or aerogenerators)<br />
and 2 support platforms<br />
22
Subsea Services Activity - <strong>Bourbon</strong> Enterprise<br />
1st contract on <strong>the</strong> wind market for BOURBON<br />
• Accommodation for <strong>the</strong> charterers’ engineers<br />
• Positioning protection systems for electric<br />
cables (trenching or mechanical protection)<br />
23
Division Offshore<br />
Division Offshore<br />
Market<br />
Activity<br />
Outlook<br />
Marché<br />
Activité<br />
Perspectives
Offshore Division - Market<br />
Growth factors<br />
Drilling rigs<br />
15 delivered in 2010<br />
81.36% utilization rate at June<br />
30, 2010<br />
In service at<br />
June 30<br />
2010<br />
Delivery / Under construction<br />
2010 2011 2012 2013<br />
681 40 46 22 2<br />
Surface units<br />
10 floating units established at<br />
June 30, 2010<br />
327 11 29 28 31<br />
Subsea facilities<br />
178 well heads installed at<br />
June 30, 2010<br />
3,890 128 393 573 582<br />
(Source ODS PETRODATA – INFIELD July 2010)<br />
25
Offshore Division<br />
Market in H1 2010 and trends<br />
• Gulf of Mexico<br />
– The Deepwater Horizon accident has generated<br />
activity for all types of vessels<br />
– Mexico: Pemex announced a 54% increase in its<br />
Exploration/Production budget for 2011<br />
• Brazil<br />
– Demand for vessels continues to grow despite <strong>the</strong><br />
postponement of projects<br />
– Petrobras prefers vessels built in Brazil, but is<br />
chartering foreign vessels to meet its growing<br />
needs<br />
• Africa<br />
– Deepwater offshore activity remains stable and<br />
could increase at <strong>the</strong> end of <strong>the</strong> year with <strong>the</strong><br />
start-up of several major projects<br />
– A slight improvement in continental offshore which<br />
has not yet had an impact on prices<br />
• North Sea<br />
– Light activity in Q1, followed by Q2 holding up<br />
well, both on <strong>the</strong> AHTS and PSV market<br />
• Mediterranean / Middle East / India (MMI)<br />
• Asia<br />
– Vessel overcapacity persists<br />
– Persian Gulf: steady upturn in drilling activities<br />
in 2010 (+ 10 drilling rigs)<br />
– Mediterranean: drilling programs in Libya<br />
postponed to 2011. Good activity in Egypt<br />
– India: drilling programs postponed to end of<br />
2010 (5 drilling rigs)<br />
– Upturn of activity at <strong>the</strong> end of Q2<br />
– Vessel overcapacity persists<br />
– Several deepwater offshore development<br />
projects in Malaysia and Indonesia announced<br />
for Q4 2010 and Q1 2011<br />
– The Australian market is active<br />
26
Offshore Division - Safety<br />
• SAFETY is <strong>the</strong> absolute priority for BOURBON<br />
– Management commitment<br />
– Effective QHSE system<br />
– Management of crews’ skills<br />
4.42<br />
4.42<br />
4.56<br />
– Training on simulator<br />
– Accent on individual behavior<br />
2.28<br />
2.24<br />
2009<br />
TRIR target = 2.00 2010<br />
TRIR target = 1.50<br />
1.29<br />
1.62<br />
0.52<br />
0.44<br />
0.14<br />
0.12<br />
2006 2007 2008 2009 S1 2010<br />
Security performance in <strong>the</strong> last 5 years<br />
TRIR: total recordable incidents for one million hours worked, based on 12 hours/day<br />
LTIR: lost time incident rate for one million hours worked, based on 12 hours/day<br />
Targets 2010:<br />
LTIR: 0.00<br />
TRIR: 1.50<br />
27
Offshore Division<br />
Average daily rates / Utilization rate / Availability rate<br />
Average daily rates<br />
H1 2010<br />
US$<br />
Utilization rate<br />
H1 2010<br />
%<br />
Availability rate<br />
H1 2010<br />
IMR vessels<br />
$ 33,328<br />
($ 30,423)<br />
85.4 %<br />
(89.7%)<br />
88.6 %<br />
Deepwater<br />
supply vessels<br />
$ 19,725<br />
($ 20,202)<br />
90.7 %<br />
(92.9%)<br />
95.9 %<br />
Continental<br />
supply vessels<br />
$12,488<br />
($ 13,009)<br />
74.0 %<br />
(80.3%)<br />
93.9%<br />
Crewboats<br />
$ 4,079<br />
($ 4,124)<br />
77.3%<br />
(76.3%)<br />
90.4 %<br />
TOTAL 91.9 %*<br />
H1 2010<br />
H2 2009<br />
* BOURBON 2015 target: 95%<br />
28
Offshore Division<br />
Average daily rates<br />
In US $ H1 2009 H2 2009 H1 2010<br />
IMR vessels 31,475 30,423 33,328<br />
• Contract renewals at higher rates and<br />
extended provision of services<br />
Deepwater<br />
supply vessels<br />
20,356 20,202 19,725<br />
•Average daily rates held up well despite<br />
market downturn in H2 2009<br />
Continental<br />
supply vessels<br />
12,636 13,009 12,488<br />
• Priority is given to utilization rates ra<strong>the</strong>r than<br />
prices<br />
Crewboats 3,949 4,124 4,079<br />
•Crewboat rates held up well<br />
29
Offshore Division<br />
Utilization rates<br />
In % H1 2009 H2 2009 H1 2010<br />
IMR vessels 86.6 89.7 85.4<br />
• First half marked by numerous programmed<br />
and unprogrammed technical stoppages<br />
Deepwater<br />
supply vessels<br />
93.2 92.9 90.7<br />
•Utilization rates held up well; <strong>the</strong>y increased in<br />
Q2 2010 after a low point in Q1 2010<br />
Continental<br />
supply vessels<br />
89.3 80.3 74.0<br />
• Overcapacity of vessels in Asia and Middle<br />
East/Mediterranean/India (MMI) is affecting our<br />
utilization rates<br />
Crewboats 83.7 76.3 77.3<br />
• Upturn in demand in Q2 2010<br />
30
Marine Services<br />
• Delivery of 32 vessels in H1 2010<br />
− 12 AHTS <strong>Bourbon</strong> Liberty 200 constructed in China and<br />
1 AHTS constructed in India<br />
Angola, Nigeria, Cameroun, Egypt, Tunisia, Malaysia, Brazil<br />
− 4 PSV <strong>Bourbon</strong> Liberty 100 constructed in China<br />
Asia-Sakhaline, Brazil<br />
− 15 crewboats constructed in France, Vietnam<br />
and Nigeria<br />
West Africa, Asia, Brazil<br />
<br />
<br />
Offshore Division<br />
Fleet<br />
13 vessels on long-term contracts<br />
20 vessels on short-term contracts of<br />
which 8 are crewboats<br />
Subsea Services<br />
• Delivery of 1 IMR vessels in <strong>the</strong> H1 2010<br />
− Constructed in France<br />
North Sea<br />
• Delivery of 1 ultra-deep ROV<br />
31
Offshore Division<br />
Fleet at June 30, 2010<br />
Vessels in<br />
operation<br />
Average<br />
age<br />
Vessels on<br />
order<br />
TOTAL<br />
MARINE SERVICES<br />
Deepwater supply vessels 64 5.5 8 72<br />
Continental supply vessels 67 4.0 58 125<br />
Assistance & Salvage tugs 5 15.3 - 5<br />
Total supply vessels 136 5.1 66 202<br />
Crewboats 237 5.9 33 270<br />
Total marine services 373 5.6 99 472<br />
SUBSEA SERVICES<br />
Total IMR vessels 15 4 12 27<br />
ROVs 11 3.4 2 13<br />
TOTAL OFFSHORE NAVIRES<br />
ROVs<br />
388<br />
11<br />
5.6<br />
3.4<br />
111<br />
2<br />
499<br />
13<br />
32
Offshore Division<br />
Human Resources: key features H1 2010<br />
• 153 officers integrated in <strong>the</strong> teams<br />
• 82 officers trained on AHTS simulators at BOURBON Training<br />
Centers - 41 in Marseille and 41 in Singapore<br />
• 74 officers trained on PSV simulators at BOURBON Training<br />
Centers - 57 in Marseille and 17 in Singapore<br />
• 32 trained for IMR (ROV and cranes)<br />
33
Offshore Division<br />
Diversification of client portfolio<br />
At June 30, 2010<br />
100%<br />
90%<br />
33,7%<br />
48,8%<br />
80%<br />
37,1%<br />
O<strong>the</strong>rs<br />
40,6%<br />
70%<br />
Reliance<br />
Majors<br />
17,5%<br />
60%<br />
50%<br />
40%<br />
30%<br />
20%<br />
7,9%<br />
14,1%<br />
40,9%<br />
PEMEX<br />
PETROBRAS<br />
CHEVRON<br />
SHELL<br />
BP<br />
EXXON<br />
3,9%<br />
2,8%<br />
4,6%<br />
4,6%<br />
4,7%<br />
7,4%<br />
7,1%<br />
National oil companies (NOCs)<br />
Autres<br />
• 2003: 3 main clients<br />
2010: 8 main clients, 5 being oil majors<br />
and 2 NOCs<br />
• Our development in continental offshore helps<br />
improve client diversification<br />
10%<br />
TOTAL<br />
24,4%<br />
0%<br />
2003 H1 2010<br />
34
Marine Services - Activity<br />
Commercial development<br />
• Examples of new contracts<br />
− Brazil: 8 <strong>Bourbon</strong> Liberty and 4 crewboats on long term (Petrobras)<br />
− Angola: 3 medium PSV on long term (Total)<br />
− Nigeria: 2 offshore terminal tugs on long term (Chevron)<br />
− Egypt: 2 <strong>Bourbon</strong> Liberty on long term (Petrobel)<br />
− Thailand: 2 <strong>Bourbon</strong> Liberty on long term (PTTEP)<br />
− North Sea: good spot activity for AHTS during second quarter<br />
• Assistance and Salvage<br />
− 4 assistance operations carried out<br />
− The Assistance and Salvage tug, Jason, was commissioned in Toulon<br />
(8 x 1 year contract)<br />
35
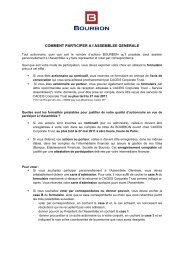
<strong>Bourbon</strong> Liberty Series - 76 Vessels<br />
• <strong>Bourbon</strong> Liberty: a series of 76 vessels, unique in <strong>the</strong> world<br />
(22 PSV and 54 AHTS)<br />
• <strong>Bourbon</strong> Liberty 100: 20 vessels delivered (at June 30,<br />
2010)<br />
• <strong>Bourbon</strong> Liberty 200: 28 vessels delivered (at June 30,<br />
2010)<br />
• Feedback from clients is excellent:<br />
− Low fuel consumption per tonne transported<br />
− Exceptional maneuverability<br />
− Capacity to transport different products<br />
36
<strong>Bourbon</strong> Liberty Series - 76 Vessels<br />
<strong>Bourbon</strong> Liberty 216<br />
<strong>Bourbon</strong> Liberty 223<br />
<strong>Bourbon</strong> Liberty 212<br />
37
Subsea Services - Activity<br />
Commercial development<br />
• Diversification of operating regions<br />
− 2 vessels in <strong>the</strong> Mediterranean on contract for Saipem and ENI<br />
− 1 vessel in North Sea<br />
− 1 vessel on its way to <strong>the</strong> Persian Gulf for a long-term contract<br />
• Mobilization of an IMR vessel equipped with a BOURBON ROV in<br />
Nigeria for a 3-year contract<br />
• Finalization of a 3-year contract for a vessel in Australia<br />
• 18 jumpers and 11 well heads installed by BOURBON vessels<br />
during H1 2010<br />
38
Offshore Division<br />
Outlook<br />
• The global economy still seems to be inclining towards growth at a<br />
reasonable pace in <strong>the</strong> order of 4.5% thanks to more robust growth<br />
in emerging markets (IEA, July 2010)<br />
• The increase in oil expenditure is expected to be 10% in 2010 for<br />
international oil companies and 11% for national oil companies<br />
(Source ESB)<br />
• Activity should grow steadily with <strong>the</strong> increased demand for drilling<br />
rigs<br />
• The significant upturn of production maintenance activities seen<br />
since <strong>the</strong> beginning of <strong>the</strong> year should continue<br />
39
Offshore Division<br />
Outlook<br />
• Contractualization of <strong>the</strong> commissioned fleet of supply vessels<br />
At July 1, 2009 At January 1, 2010 At July 1, 2010<br />
Long-term contractualization<br />
rate<br />
74% 70% 64%<br />
Average residual term of firm<br />
contracts<br />
17 months 15 months 13 months<br />
Average residual term including<br />
options<br />
23 months 24 months 22 months<br />
• Price strategy:<br />
• Maintain a pricing policy tailored to <strong>the</strong> short-term to maximize utilization rates<br />
• Optimize prices in improving segments (continental PSV and deepwater PSV<br />
offshore)<br />
40
Offshore Division - Outlook<br />
Positioning vessels in growth regions for long-term contracts<br />
1 IMR<br />
1 <strong>Bourbon</strong> Liberty<br />
1 AHTS<br />
1 PSV<br />
2 PSV<br />
8 <strong>Bourbon</strong> Liberty<br />
• Market conditions are not making it possible to charge <strong>the</strong> costs of<br />
moving <strong>the</strong> vessels to <strong>the</strong>ir operating regions. Utilization rates are<br />
affected by <strong>the</strong>se movements.<br />
41
Offshore Division<br />
Conclusion<br />
• An upturn in oil companies’ capital investment in Exploration, Production<br />
and Maintenance in H2, and an already notable upturn in West Africa and<br />
Asia<br />
• The accident in <strong>the</strong> Gulf of Mexico will undoubtedly have <strong>the</strong> following<br />
knock-on effects on our activity:<br />
− More rigorous demands from clients in <strong>the</strong> safety and efficiency of offshore<br />
service vessels<br />
− The oldest vessels will be substituted at a faster pace to ensure more modern<br />
fleets, especially in offshore continental<br />
• In this context, <strong>the</strong> offshore vessels offshore market should improve<br />
steadily at <strong>the</strong> end of 2010 and in 2011, especially in <strong>the</strong> segments :<br />
− for PSV of all types<br />
− for AHTS with bollard pull of less than 130t.<br />
BOURBON has very little exposure on AHTS with bollard pull more than 130t<br />
42
Division Vrac<br />
Bulk Division<br />
Market<br />
Activity<br />
Outlook<br />
Marché<br />
Activité<br />
Perspectives
Bulk Division<br />
Market<br />
• In <strong>the</strong> first half, <strong>the</strong> trends of 2009 continued<br />
− Steady upturn in charter rates:<br />
$35 000<br />
Baltic Supramax Index (BSI)<br />
$30 000<br />
$25 000<br />
$20 000<br />
$16 596<br />
$19 782<br />
$22 151<br />
$25 216<br />
$27 627<br />
• On August 27,<br />
<strong>the</strong> BSI was<br />
22,054 $/d<br />
$15 000<br />
$10 875<br />
$10 000<br />
$5 000<br />
$-<br />
H1 T1 2009 H2 T22009 H3 T32009 H4 T42009 H1 T1 2010 H2 T2 2010<br />
Spot BSI<br />
Moyenne BSI quarterly Trimestrielle averageBSI<br />
44
Bulk Division<br />
Demand<br />
• Demand for bulk at a high level in 2010<br />
− The IMF revised its growth forecast for global trade to 9% in July 2010 versus 5.8% in<br />
January 2010<br />
− Leading organizations upwardly revised <strong>the</strong>ir forecasts for 2010 and 2011<br />
− Demand for bulk transport in 2010 should rise to a level close to 8.5%<br />
12,0%<br />
10,0%<br />
8,0%<br />
11.1<br />
%<br />
8.8<br />
%<br />
9.0<br />
%<br />
6,0%<br />
4,0%<br />
2,0%<br />
0,0%<br />
4.6<br />
%<br />
3,4% 10,2% 6,4% 5.8%<br />
OECD OCDE World Croissance Growth OCDE OECD Croissance China Growth Chine FMI IMF Croissance India Growth Inde IMF FMI Growth Croissance in exchanges des<br />
Mondiale<br />
Echanges<br />
Prévisions 2010 en Nov. 2009 Prévisions 2010 en Mai-Juil. 2010<br />
2010 Forecast in Nov.2009D 2010 Forecast in May-July 2010<br />
45
In million deadweight<br />
tons (Mt DWT)<br />
in Mt DWT<br />
Bulk Division<br />
Global offer<br />
• Evolution of <strong>the</strong> global bulk carrier fleet:<br />
− Initial delivery program for 2010: 125.6 Mt dwt<br />
− Actual deliveries in H1 2010: 33.6 Mt dwt, 412 vessels<br />
− Demolitions in H1 2010: 2.1 Mt dwt, 56 vessels<br />
− 7% increase in <strong>the</strong> new fleet of bulk carriers in H1 2010, at a rate similar to 2009:<br />
80<br />
70<br />
60<br />
50<br />
40<br />
30<br />
20<br />
10<br />
0<br />
2009 1rst Half 2010<br />
Orders<br />
41% of<br />
orders not<br />
delivered<br />
Deliveries<br />
0<br />
2<br />
4<br />
6<br />
8<br />
2006 2007 2008 2009<br />
1rst Half<br />
2010<br />
10<br />
12<br />
Demolitions<br />
Source Clarksons Jan 2009, Jan. & Jul. 2010<br />
46
Bulk Division - Activity<br />
Change in size of <strong>the</strong> operating fleet<br />
• Changes in directly-owned fleet in <strong>the</strong> first half:<br />
− 5 x 58,000-ton vessels delivered<br />
− 2 vessels sold<br />
30<br />
25<br />
20<br />
15<br />
10<br />
5<br />
7<br />
4<br />
3<br />
4 5<br />
8<br />
6<br />
4<br />
7<br />
6<br />
3<br />
7 6 5<br />
4 4 4<br />
Operator fleet:<br />
Charters by voyage<br />
TC IN (vessels hired on<br />
long-term charter)<br />
Shipmanager/ directlyowned<br />
fleet:<br />
"Spot" vessels<br />
5<br />
7 7<br />
9<br />
11 11 11<br />
TC OUT (vessels out on<br />
MT/LT charter)<br />
0<br />
Janvier Février Mars Avril Mai Juin<br />
47
Bulk Division<br />
Outlook<br />
• On June 25, decision taken to sell 16 bulk carriers to GENCO, of<br />
which 2 still to be delivered by <strong>the</strong> shipyard<br />
− At end of August, 10 vessels had been delivered to GENCO<br />
− The remaining 6 vessels will be delivered<br />
• In September 2010 for operating vessels<br />
• Between now and Q1 2011 for <strong>the</strong> 2 vessels under construction<br />
• At this stage, only <strong>the</strong> 2 Panamax vessels ordered from <strong>the</strong><br />
Pipavav shipyard are still under contract. There is little likelihood of<br />
<strong>the</strong>ir delivery before <strong>the</strong> cancellation date<br />
48
Bulk Division<br />
Outlook<br />
• The outlook for freight rate growth remains favorable for <strong>the</strong><br />
second half<br />
• At August 31, <strong>the</strong> division is operating:<br />
− 4 directly-owned vessels intended for sale<br />
− The cement carrier Endeavor<br />
− 9 vessels on Long-Term charter consisting of<br />
• 4 Supramax<br />
• 5 Handysize<br />
− 4 spot vessels<br />
• The activity of Setaf-Saget is based on securing modern transport<br />
capacities to serve our clients in <strong>the</strong> best conditions<br />
49
BOURBON 2015<br />
Jacques de CHATEAUVIEUX<br />
Chief Executive Officer
BOURBON 2015 Leadership Strategy<br />
• A comprehensive range of 600 innovative high performance<br />
vessels for exacting clients all over <strong>the</strong> world<br />
• Growth of 17% in Offshore from 2011 to 2015, after more<br />
than 28% per annum since 2002 by additional capital<br />
investment of $2 billion in new vessels<br />
• Increase from 7,000 to 12,000 employees, all determined to<br />
ensure optimal safety of operations<br />
• Improve profitability with <strong>the</strong> fleet’s availability rate rising to<br />
95% and a target operating cost reduction of 4% at constant<br />
rates (excluding inflation) by 2015<br />
51
BOURBON invests for deepwater growth<br />
and shallow water substitution<br />
BOURBON’ s fleet growth<br />
Number of vessels<br />
2002 2009 2015<br />
Deep<br />
27 82 134<br />
AHTS + PSV + IMR<br />
Shallow<br />
AHTS + PSV<br />
28 52 146<br />
Crew boats<br />
77 223 320<br />
600<br />
vessels<br />
52
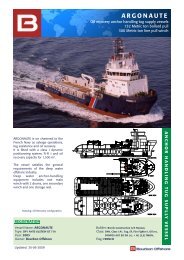
Focus on Shallow water<br />
NEW<br />
• PSV Liberty 010 Maxi Utility (20 units)<br />
1000T dwt<br />
Liquid Mud<br />
Bulk<br />
DP II<br />
Diesel electric<br />
53
Increase customer satisfaction and BOURBON cost efficiency<br />
Safest Operations<br />
- People: no injury<br />
- Assets: no damage<br />
Super Majors<br />
NOCs<br />
Independents<br />
Contractors<br />
Customers top<br />
expectations<br />
More cost optimization<br />
- Fleet cost<br />
- Fuel cost<br />
Availability for<br />
operations<br />
- Crew competence<br />
- Vessel integrity<br />
54
Fuel Consumption<br />
Increase customer satisfaction and BOURBON cost efficiency<br />
• More cost optimization: fuel cost<br />
Traditional<br />
vessels<br />
« New tech »<br />
vessels<br />
Fuel consumption<br />
Diesel electric<br />
Fuel<br />
Fuel<br />
Fuel<br />
Vessel<br />
design<br />
Vessel<br />
management<br />
Fuel Efficiency<br />
Management<br />
System<br />
Costs<br />
>25 years<br />
vessels<br />
Costs<br />
New<br />
vessels<br />
Improved<br />
culture<br />
Costs<br />
New<br />
vessels<br />
Customer-supplier<br />
Joint management<br />
Time<br />
55
Increase customer satisfaction and BOURBON cost efficiency<br />
Leadership strategy relies on our Team<br />
5 000 people to recruit<br />
• Growth/modern fleet<br />
- Attract people<br />
• Development of professional key skills / career management<br />
- Engagement and retention<br />
• High safety culture<br />
- Responsibility<br />
7 000<br />
12 000<br />
+ 60<br />
nationalities<br />
March 2010 2015<br />
Seamen<br />
Shore personnel<br />
56
Standardization of <strong>the</strong> fleet<br />
Deliver services through industrialized processes – Cost efficiency<br />
Series of vessels with identical equipments<br />
Serie<br />
Number<br />
•PSV deep offshore<br />
Diesel electric<br />
DPII<br />
18 + 10 = 28<br />
GPA 670<br />
SPP 35<br />
• AHTS shallow offshore<br />
Diesel electric<br />
DPII<br />
54 + 20 = 74<br />
<strong>Bourbon</strong> Liberty 200<br />
<strong>Bourbon</strong> Liberty 300<br />
• PSV shallow offshore<br />
Diesel electric<br />
DPII<br />
22 +10 = 32<br />
<strong>Bourbon</strong> Liberty 100<br />
<strong>Bourbon</strong> Liberty 100L<br />
• Maxi Utility<br />
Diesel electric<br />
DPII<br />
20<br />
<strong>Bourbon</strong> Liberty 010<br />
57
BOURBON 2015 Leadership Strategy<br />
BOURBON<br />
2015<br />
Horizon<br />
2012<br />
• Offshore average yearly revenue growth 17% 21%<br />
• Offshore EBITDA /revenues (in 2015) 45% 41%<br />
• EBITDA/Capital employed (in 2015) 20% 18%<br />
• Fleet availability rate > 95% -<br />
• Running cost index at constant rate (in 2015) - 4% -<br />
o Increasing 1% vessel availability + €22 m of EBITDA in 2015<br />
o Decreasing 1% running costs + €8 m of EBITDA in 2015<br />
o BOURBON 2015 is based on 1€ = 1.30 $<br />
1 cent of $ per € €10 m of EBITDA in 2015<br />
58
New financing strategy<br />
BOURBON 2015 financing<br />
Reducing gearing from 2011 onwards<br />
• Sale of 500 millions of euros<br />
of assets, mainly in 2010<br />
• New building capex paid at<br />
least 75% at delivery<br />
• China Exim Bank 400M$<br />
financing for 12 years<br />
• Growing paid dividend<br />
2<br />
1,8<br />
1,6<br />
1,4<br />
1,2<br />
1<br />
0,8<br />
0,6<br />
0,4<br />
0,2<br />
0<br />
o Gearing 2015 ≤ 0.5<br />
o Net debt / EBITDA ≤ 2<br />
gearing<br />
59
Creating value<br />
BOURBON 2015 « EQUITY STORY »<br />
• Offshore revenue growth<br />
17% yearly average<br />
• Return on Capital Employed Gross return in 2015 = 20%<br />
• Strategic positioning<br />
• Diversified financing and<br />
positive cash flow from 2013<br />
600 owned vessels<br />
Young and modern fleet<br />
Full range of marine services<br />
Strong regional footprint<br />
Increased yield for shareholders<br />
60
BOURBON 2015<br />
OUR COMMITMENT<br />
SAFETY AND RELIABILITY<br />
OUR TOOLS<br />
600 modern and cost effective vessels<br />
OUR TEAM<br />
Qualified, engaged and working as a<br />
team worldwide<br />
OUR REWARDS • Customers’ satisfaction<br />
• Personnel’ satisfaction<br />
• Shareholders’ satisfaction<br />
« Towards leadership under <strong>the</strong> flag of excellence »<br />
61
APPENDICES
H1 2010 Income statement<br />
In millions of euros H1 2010 H1 2009<br />
Change<br />
%<br />
Revenues 490.4 468.4 4.7%<br />
Gross operating income (EBITDA) 168.5 172.9 (2.5)%<br />
Operating income (EBIT) 39.4 113.7 (65.3)%<br />
Net financial income/ (loss) 13.8 (18.7) ns<br />
Income from current operations before taxes 53.2 95.0 (44.0)%<br />
Income taxes (10.0) (5.7) 76.7%<br />
Share in income/ (loss) of associates - -<br />
Net income before gains on sales of investments and net<br />
income from activities held for sale<br />
43.2 89.4 (51.6)%<br />
Net income from discontinued activities (1.5) 1.2 ns<br />
Net gains on sales of investments - -<br />
Net income 41.8 90.5 (53.9)%<br />
Minority interests (0.7) (8.3) (91.4)%<br />
Net Income, Group Share (NIGS) 41.0 82.3 (50.1)%<br />
63
Simplified balance sheet – June 30, 2010<br />
ASSETS<br />
In millions of euros<br />
June 30,<br />
2010<br />
Dec 31,<br />
2009<br />
LIABILITIES<br />
June 30,<br />
2010<br />
Dec 31,<br />
2009<br />
Net properties, plant and<br />
equipment<br />
Shareholder’s equity 1,517 1,487<br />
2,900 3,096 Financial debt > 1 year 1,416 1,450<br />
O<strong>the</strong>r non-current assets 103 78 O<strong>the</strong>r non-current liabilities 122 63<br />
TOTAL NON-CURRENT<br />
ASSETS<br />
3,003 3,174<br />
TOTAL NON-CURRENT<br />
LIABILITIES<br />
1,538 1,513<br />
O<strong>the</strong>r current assets 487 435 Financial debt < 1 year 776 453<br />
Cash and cash equivalents 168 153 O<strong>the</strong>r current liabilities 313 309<br />
TOTAL CURRENT ASSETS<br />
655 588<br />
TOTAL CURRENT LIABILITIES<br />
Non-current assets held for sale 519 - Liabilities on non-current assets held<br />
for sale<br />
1,089 762<br />
33 -<br />
TOTAL ASSETS 4,177 3,762 TOTAL LIABILITIES 4,177 3,62<br />
Net debt 2,033<br />
Capital employed 3,560<br />
64
Cash flow statement – 1 er half 2010<br />
In millions of euros<br />
Net cash at December 31, 2009 (69)<br />
Net cash flow from operating activities 108<br />
Net cash flow from investing activities (263)<br />
of which property, plan and equipment (317)<br />
Net cash flow from financing activities (inc. Foreign exchange) 55<br />
Of which dividends paid to BOURBON shareholders (59)<br />
Net cash at June 30, 2010 (169)<br />
Change in net cash (100)<br />
65
Revenues by Division – 1 er half 2010<br />
In millions of euros<br />
Offshore Division 403.8<br />
• Africa 258.0<br />
• Europe & ME 61.2<br />
• Asia 40.1<br />
• N. and S. America 44.5<br />
Bulk Division 86.3<br />
• Owned vessels 44.5<br />
• Chartered vessels 41.8<br />
Corporate 0.2<br />
BOURBON 490.4<br />
66
Offshore Division<br />
Employees at June 30, 2010<br />
• Total number of employees : 7,200 people – 85 % seamen<br />
• 94 % of BOURBON employees<br />
• 1,300 new employees in a year (+ 22 %)<br />
• 720 new employees during1 er half 2010 (+ 11 %)<br />
of which:<br />
‣ France: 20%<br />
‣ Norway: 6%<br />
Europe<br />
37%<br />
Africa<br />
32%<br />
of which:<br />
‣ Nigeria: 13%<br />
‣ Angola: 9%<br />
‣ Congo: 5%<br />
Asia + Oceania<br />
16%<br />
N&S America<br />
15%<br />
of which:<br />
‣ Philippines: 6%<br />
of which:<br />
‣ Brasil: 8%<br />
‣ Mexico: 7%<br />
67
Offshore Division<br />
Deliveries expected<br />
Number of vessels<br />
Value<br />
excl. financial<br />
expense<br />
Deliveries<br />
S2-2010<br />
Deliveries<br />
2011<br />
Deliveries<br />
2012 → 2013<br />
TOTAL<br />
M€<br />
19<br />
14<br />
33<br />
Crewboats<br />
Supply Vessels<br />
15<br />
34.2<br />
21<br />
31.6<br />
30<br />
66<br />
65.8<br />
3<br />
193.9<br />
5<br />
300.5<br />
4<br />
428.3<br />
12<br />
922.7<br />
IMR Vessels<br />
37<br />
95.8<br />
40<br />
208.4<br />
34<br />
166.4<br />
111<br />
470.6<br />
TOTAL<br />
323.9<br />
540.5<br />
594.7<br />
1459.1<br />
68
Offshore Division<br />
Contract coverage at June 30, 2010<br />
Long-term<br />
contracts<br />
Short-term<br />
contracts<br />
Under<br />
construction not<br />
contracted<br />
TOTAL<br />
Marine Services<br />
Crewboats<br />
144<br />
96<br />
30<br />
270<br />
Deepwater supply vessels<br />
47<br />
23<br />
7<br />
77<br />
Continental supply vessels<br />
38<br />
29<br />
58<br />
125<br />
Total Marine Services 229 148 95 472<br />
Subsea Services<br />
IMR vessels<br />
12<br />
3<br />
12<br />
27<br />
ROV<br />
2<br />
9<br />
2<br />
13<br />
TOTAL OFFSHORE 241 151 107 499<br />
ROV 2 9 2 13<br />
69
Disclaimer<br />
This document may contain information o<strong>the</strong>r than historical<br />
information, which constitutes estimated, provisional data<br />
concerning <strong>the</strong> financial position, results and strategy of<br />
BOURBON. These projections are based on assumptions that may<br />
prove to be incorrect and depend on risk factors including, but not<br />
limited to: foreign exchange fluctuations, fluctuations in oil and<br />
natural gas prices, changes in oil companies investment policies in<br />
<strong>the</strong> exploration and production sector, <strong>the</strong> growth in competing<br />
fleets, which saturates <strong>the</strong> market, <strong>the</strong> impossibility of predicting<br />
specific client demands, political instability in certain activity zones,<br />
ecological considerations and general economic conditions.<br />
BOURBON assumes no liability for updating <strong>the</strong> provisional<br />
information based on new information in light of future events or<br />
any o<strong>the</strong>r reason.<br />
70