VASILE BUDUI, CRISTIAN-VALERIU PATRICHE ... - Pesd.ro
VASILE BUDUI, CRISTIAN-VALERIU PATRICHE ... - Pesd.ro
VASILE BUDUI, CRISTIAN-VALERIU PATRICHE ... - Pesd.ro

Create successful ePaper yourself
Turn your PDF publications into a flip-book with our unique Google optimized e-Paper software.
PRESENT ENVIRONMENT AND SUSTAINABLE DEVELOPMENT, VOL. 6, no. 1, 2012<br />
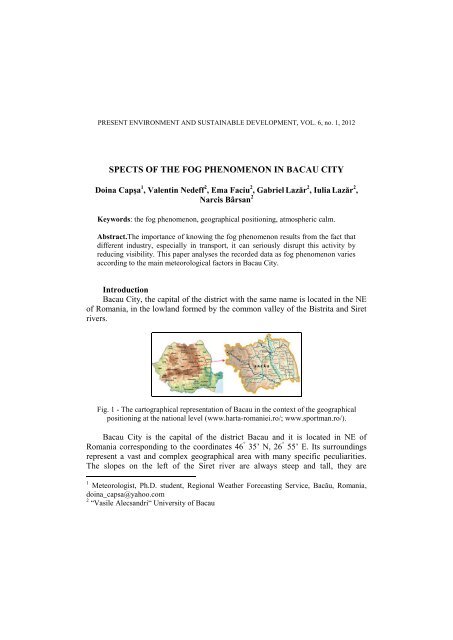
SPECTS OF THE FOG PHENOMENON IN BACAU CITY<br />
Doina Capşa 1 , Valentin Nedeff 2 , Ema Faciu 2 , Gabriel Lazăr 2 , Iulia Lazăr 2 ,<br />
Narcis Bârsan 2<br />
Keywords: the fog phenomenon, geographical positioning, atmospheric calm.<br />
Abstract.The importance of knowing the fog phenomenon results f<strong>ro</strong>m the fact that<br />
different industry, especially in transport, it can seriously disrupt this activity by<br />
reducing visibility. This paper analyses the recorded data as fog phenomenon varies<br />
according to the main meteo<strong>ro</strong>logical factors in Bacau City.<br />
Int<strong>ro</strong>duction<br />
Bacau City, the capital of the district with the same name is located in the NE<br />
of Romania, in the lowland formed by the common valley of the Bistrita and Siret<br />
rivers.<br />
Fig. 1 - The cartographical representation of Bacau in the context of the geographical<br />
positioning at the national level (www.harta-<strong>ro</strong>maniei.<strong>ro</strong>/; www.sportman.<strong>ro</strong>/).<br />
Bacau City is the capital of the district Bacau and it is located in NE of<br />
Romania corresponding to the coordinates 46 ° 35’ N, 26 ° 55’ E. Its sur<strong>ro</strong>undings<br />
represent a vast and complex geographical area with many specific peculiarities.<br />
The slopes on the left of the Siret river are always steep and tall, they are<br />
1 Meteo<strong>ro</strong>logist, Ph.D. student, Regional Weather Forecasting Service, Bacău, Romania,<br />
doina_capsa@yahoo.com<br />
2 “Vasile Alecsandri“ University of Bacau
326<br />
Capşa, Nedeff, Faciu, G. Lazăr, I. Lazăr, Bârsan<br />
accompanied by fragments of terraces and those on the right are slower and they<br />
have a wide unfolding of the terraces. (ANM 2008, www. arpmbc.anpm.<strong>ro</strong>).<br />
The common valley of the two rivers looks like a depression corridor with<br />
north- south orientation with an opening to the west side, Bistrita valley and a<br />
nar<strong>ro</strong>wing to the south, “ the Siret gate” , overlapping to the contact between the<br />
hills of the Tutova and the Carpathian peaks Pietricica- Barboiu.<br />
The meadow steps and the flat or slightly sloping terraces stand as typical<br />
forms of the relief, with the eastern and south- east exhibition having a good<br />
drainage of g<strong>ro</strong>undwater (ANM 2008, www. arpmbc.anpm.<strong>ro</strong>).<br />
The meadows and the terraces near the city are used for the practicing of the<br />
agriculture and high terraces are used for fruit g<strong>ro</strong>wing and viticulture. The terraces<br />
favoured the construction of the ways of communication and they facilitated the<br />
spreading of the constructions (www. arpmbc.anpm.<strong>ro</strong>).<br />
Fig. 2 - The cartographical representation of Bacau- the delimitation of<br />
the urban and peripheral areas.<br />
Bacau City is located at just 9,6 km upstream of the confluence of Siret-<br />
Bistrita, at an altitude of 160,056 m<br />
1. Climatic aspects in the city of Bacau<br />
The climate of the city of Bacau is temperate - continental, with cold winters<br />
and hot dry summers, the result of the action of a complex of natural factors<br />
(general circulation of the atmosphere, the solar radiation, the landscape) and<br />
anth<strong>ro</strong>pogenic factors, the city itself having an essential <strong>ro</strong>le in creating its own
Aspects of the fog phenomenon in Bacău city 327<br />
mezoclime by a number of factors that constantly manifest (the materials of<br />
construction, the rugged p<strong>ro</strong>file, the green spaces) respectively th<strong>ro</strong>ugh secondary<br />
factors (the artificial heating, the polluted atmosphere ). The simultaneous action of<br />
these factors lead to the biogeochemical disturbance at the level of the system, the<br />
direct result being the urban discomfort (Gârţu 1991, ANM 2008).<br />
This area of confluence and the Bistrita river corridor favor the channeling air<br />
masses over its weather conditions characterized by winds f<strong>ro</strong>m the south and<br />
south- east, alternating with periods of atmospheric calm (average speeds of the<br />
wind (1,5m/s), the condition which characterizes the area most of the year and the<br />
frequent appearance of thermal inversion situations. These thermal inversions (the<br />
situation where a blanket of cold air is positioned under a blanket of warm air) can<br />
occur under a stationary atmospheric f<strong>ro</strong>nt of high pressure coupled with low wind<br />
speeds (Stefan 2004, Tasnea and Sarbu 1984).<br />
In these conditions the atmospheric chemical mixtures between the<br />
atmospheric components and pollutants are slowed down, as well as reducing<br />
p<strong>ro</strong>cess, and the pollutants can be accumulated at low altitudes, close to the level of<br />
the g<strong>ro</strong>und (Dayan and Lamb 2005, Bogdan and Marinica 2007).<br />
2. General aspects of the fog phenomenon<br />
The importance of knowing the fog phenomenon results f<strong>ro</strong>m the fact that in<br />
different economic branches, especially in transport (land, air and naval) it can<br />
seriously disrupt this activity by reducing visibility.<br />
The p<strong>ro</strong>vision of this phenomenon is a major difficulty, on the one hand<br />
because of the multitude of meteo<strong>ro</strong>logical parameters which it depends on<br />
temperature, wind, pressure, humidity and on the other hand it depends on the local<br />
conditions (o<strong>ro</strong>graphic). Because of this latter factor the general methods should<br />
have a strictly local application (ANM 2008, www. arpmbc. anpm. <strong>ro</strong>).<br />
According to the international standards, the fog is a phenomenon that reduces<br />
the visibility to less than one kilometre. This phenomenon consists of small water<br />
d<strong>ro</strong>ps suspended in the air.<br />
The fog is formed when the moist air is cooled and it reaches to its point of<br />
dew, it becomes saturated and the vapours f<strong>ro</strong>m the air are condensed forming tiny<br />
d<strong>ro</strong>ps of water. The principle of the fog formation is the same as in cloud<br />
formation, except that this is a cloud which touches the g<strong>ro</strong>und (Bogdan and<br />
Marinică 2007, Gârţu 1991, Mureşan and C<strong>ro</strong>itoru 2008).<br />
The water d<strong>ro</strong>ps which form the fog are very small, the diameter of the d<strong>ro</strong>p is<br />
about 2/100 mm and the distance between them is about 2 mm, so more than 100<br />
diameters. The fog d<strong>ro</strong>ps don’t float in the air, as one might think, they fall like all<br />
the heavier bodies than the air, but the speed of fall is very small due to the very<br />
small volume. The forces that act on the d<strong>ro</strong>p are: the resistance force of the air and
328<br />
Capşa, Nedeff, Faciu, G. Lazăr, I. Lazăr, Bârsan<br />
the closed sensitive weight, but they have opposite meanings, the fall of the fog<br />
d<strong>ro</strong>ps is extremely slow, a fall on the lowest ascendant current it stops it or even it<br />
reverses it. The fall speed of a fog d<strong>ro</strong>plet with a diameter of 2/100 mm is about 1,3<br />
cm/s. (Mureşan and C<strong>ro</strong>itoru 2008, Tasnea and Sarbu 1984).<br />
The total mass of the d<strong>ro</strong>ps which constitutes the fog is 2g/m 3 , lower to the<br />
water mass existing in the air in the vapour state. However the number of d<strong>ro</strong>ps is<br />
very high, f<strong>ro</strong>m 2 grams of water we can get a half billion of d<strong>ro</strong>ps with the 2/100<br />
mm diameter. When the d<strong>ro</strong>ps that form the fog are quite big, the fog wets the<br />
objects which touches them, and if their size continues to g<strong>ro</strong>w up then it turns into<br />
drizzle.<br />
The fog opacity is a remarkable fact, considering the total mass of the<br />
particles of the water extremely small. The maximal distance of visibility of the<br />
objects during the fog it is p<strong>ro</strong>portional to the radius of d<strong>ro</strong>ps and it is inversely<br />
p<strong>ro</strong>portional with the mass of water f<strong>ro</strong>m cubic meter and the fog intensity is<br />
characterized by the maximum distance where the objects can be seen and f<strong>ro</strong>m<br />
where it comes the name of the fog: 100 m, 20 m, etc (Mureşan 2008, INMH<br />
1986).<br />
The fog has a whitish color due to air cooling, it is generally formed very<br />
quickly but it is dissipated very slowly. The general conditions of forming the fog<br />
are: a very high humidity and a wind that blows not too weak (if the temperature is<br />
below ze<strong>ro</strong> degrees, the d<strong>ro</strong>ps freeze resulting the hoar f<strong>ro</strong>st), not too st<strong>ro</strong>ng (in this<br />
case we can’t talk about the fog formation).<br />
2.1. The classification of the fog<br />
2.1.1. The advection fog. For p<strong>ro</strong>ducing this type of fog it is required the<br />
presence of a warm and humid air mass and another cold and dry air. This is a very<br />
persistent fog because its superior surface is very important for the p<strong>ro</strong>duction of<br />
the condensation (fig.3.a). The thickness of this type of fog varies between 100 m<br />
and 1 km and it increases where there is a cooling at the top of the layer. The<br />
dissipation of this type of fog is very slow because it takes a reheating of the cold<br />
surface (it p<strong>ro</strong>duces the disruption of the thermal equilibrium air- g<strong>ro</strong>und) (Stefan<br />
2004, Meteo<strong>ro</strong>logical Institution 1963).<br />
2.1.2 The radiation fog. This fog is formed during the clear nights following<br />
after a warm day during which the evaporation was high, a situation where the<br />
moist air could cool long enough for forming the fog p<strong>ro</strong>vided not to be wind. The<br />
conditions of formation of this type of fog there are also conditions of beautiful<br />
time (fig. 3.b).<br />
The wind speed is almost ze<strong>ro</strong> (less than 10 km/h), the air is very moist and<br />
the clear sky will allow the p<strong>ro</strong>duction of the radiation fog. The air close to the soil<br />
surface is cooled by conduction in order to reach the dew point and the formed
Aspects of the fog phenomenon in Bacău city 329<br />
water d<strong>ro</strong>ps p<strong>ro</strong>duce a thin film of fog. The air continues to cool, increasing the<br />
number of water d<strong>ro</strong>ps thickening the fog, it becomes opaque to infrared. The<br />
upper layer continues to cool, increasing the thickness of the fog. The dissipation is<br />
p<strong>ro</strong>duced by heating f<strong>ro</strong>m the sun or by the intensification of the wind. The<br />
radiation fog is generally formed in large spaces such as airports, highways, fields<br />
and it is the type of fog that disrupts the circulation of the planes and of the cars<br />
(Iordachescu 2011, ANM 2008).<br />
2.1.3 The smog is a type of fog whose method of training can be represented<br />
schematically in Figure 4. a.<br />
Fig. 3 - The graphical representation of the phenomenon of fog formation: a) the formation<br />
of the advection fog; b) the formation of the radiation fog (Iordachescu 2011).<br />
Fig. 4 - The graphical representation of the phenomenon of fog formation: a) the smog<br />
formation; b) the formation of the expansion fog (Iordachescu 2011).<br />
The emission of the gases f<strong>ro</strong>m the large cities may form an extended haze in<br />
the absence of the wind, where the gas tends to remain on the g<strong>ro</strong>und because of
330<br />
Capşa, Nedeff, Faciu, G. Lazăr, I. Lazăr, Bârsan<br />
the water particles (the moisture), blocking the vertical displacement. The<br />
quantities of gas are accumulated in order to form a toxic fog, that it represents the<br />
smog. This fog phenomenon could be confused with the misty and dry air where<br />
there is dispersed dust (Mureşan and C<strong>ro</strong>itoru 2008, Mureşan 2008).<br />
2.1.4 The expansion fog is formed only in the mountains or in the hilly areas<br />
as it is illustrated in Figure 4 b). This type of fog is formed in the valleys due to<br />
high moisture, to a down wind and to a slope which are more or less stepped. The<br />
wind pushes the moist air on the slope, it meets the cold air f<strong>ro</strong>m the altitude and<br />
thus creating fog expansion. The mode of the p<strong>ro</strong>duction of this type of fog can be<br />
explained by the fact that when a moist and a stable air mass cools adiabatically<br />
along a slope and the wind has speeds less than 5 km/h the fog is formed, and if the<br />
wind has speeds bigger than 5 km/h, the fog is b<strong>ro</strong>ken forming Stratus type clouds<br />
(Iordăchescu 2011, Ştefan 2004).<br />
2.1.5. The evaporative fog is a type of fog contrary to the mists of advection, it<br />
requires a warm surface and a very cold air mass (the difference of temperature<br />
between g<strong>ro</strong>und and air must be very big) and it can be represented schematically<br />
as in Figure 5 a). A mass of cold air reaches above a surface as the hot liquids and<br />
the temperature of the air is smaller than the temperature of the water, the air<br />
becomes saturated favoring a rapid condensation and resulting the formation of<br />
large amounts of water d<strong>ro</strong>ps. Such a fog of reducing thickness it is formed on the<br />
lakes and on the rivers (Iordăchescu 2011, Tasnea and Sarbu 1984).<br />
Fig. 5. The graphical representation of the phenomenon of fog formation: a) the<br />
formation of the evaporative fog; b) the formation of mixing fog (Iordăchescu (2011).
Aspects of the fog phenomenon in Bacău city 331<br />
Fig. 6 - Synoptic conditions p<strong>ro</strong>ducing fog on the 16. 12. 2006 (www.wetterzentrale.de).<br />
2.1.6. The mixing fog is a phenomenon that can be explained by the graphical<br />
representation in the Figure 5 b). The warm and moist air and the cold and humid<br />
air (with different densities) will mix p<strong>ro</strong>ducing the fog phenomenon on a small<br />
area, the visibility being bigger than 1 km.<br />
In Figure 6 there are some cartographical examples with satellite view of the<br />
synoptic conditions p<strong>ro</strong>ducing fog (on the 16. 12. 2006).<br />
3. Results and discussions<br />
In order to achieve a more detailed analysis of the fog phenomenon in Bacau<br />
City, the main meteo<strong>ro</strong>logical data were p<strong>ro</strong>cessed during 2005- 2010.<br />
In Figure 7 the wind directions are presented in Bacau City.<br />
Fig. 7 - The wind direction in Bacau City.
332<br />
Capşa, Nedeff, Faciu, G. Lazăr, I. Lazăr, Bârsan<br />
Analyzing the chart above it can be noted that geographical position of Bacau<br />
causes airflow to be oriented on the North- South direction, the winds f<strong>ro</strong>m the<br />
west and east being blocked by existing landforms, respectively by hills.<br />
Fig. 8 - The graphical representation of mean values for the frequency of the winds<br />
on the S- SE and on the N- NV direction and the number of the days when the fog<br />
phenomenon was present between 2005- 2010.<br />
Fig. 9 - The graphical representation of the average values for the winds<br />
frequency on the S- SE direction and the graphical representation of the<br />
periods of atmospheric calm between 2005- 2010.<br />
In Figure 8 the average values are presented for the winds frequency on the S-<br />
SE and N- NV direction and the number of the days when the fog phenomenon was<br />
present between 2005- 2010.
Aspects of the fog phenomenon in Bacău city 333<br />
In Figure 9 the average values are presented for the winds frequency on the S-<br />
SE direction and the periods of atmospheric calm are also presented as well as the<br />
number of days when the fog phenomenon was present between 2005- 2010.<br />
Fig. 10 - The graphical representation of the average values of the number of days<br />
when the fog phenomenon was present, the frequency of the atmospheric calm and<br />
the values of the monthly temperatures between 2005 - 2010.<br />
In Figure 10 the average values of the number of days are presented when the<br />
fog phenomenon was present, there are also presented the monthly distribution of<br />
the average frequency of the periods of atmospheric calm as well as the values of<br />
the monthly temperatures f<strong>ro</strong>m 2005 to 2010.<br />
In Figure 11 the monthly distribution of the average of the number of days is<br />
represented when the fog phenomenon was present and the average of the monthly<br />
total precipitations it is also represented between 2005- 2010.<br />
In Figure 12 a graph is presented where the weather phenomena were<br />
correlated to each other and they are presented in the graphs above, the intensity of<br />
the winds on the N- NV and S- SE direction, the number of days when the fog<br />
phenomenon was present as well as the average of the monthly total precipitations<br />
between 2005- 2010.<br />
Analyzing the graphs above can appreciate the fact that this area of confluence<br />
and the Bistrita river corridor favor the channeling air masses over Bacau City. In<br />
the weather conditions characterized by winds f<strong>ro</strong>m the south and south- eastern<br />
sector alternating with periods of atmospheric calm (the average speeds of the wind<br />
(1,5 m/s), it registers a specific situation of the Bacau area that causes frequent<br />
thermal inversion situations.
334<br />
Capşa, Nedeff, Faciu, G. Lazăr, I. Lazăr, Bârsan<br />
Fig. 11. Graphical representation of the average number of days of fog<br />
phenomenon and average monthly rainfall t in the period 2005-2010.<br />
Fig. 12. The graphical representation of the winds frequency on the N- NV and<br />
S- SE direction, the number of days when the fog phenomenon was present and<br />
the average of the monthly total precipitations between 2005- 2010.<br />
In order to analyse the fog phenomenon in Bacau for any time of year, there<br />
were made graphical representations for the entire analysed period, the<br />
phenomenon was analysed at the level of each calendar month (Figures 13, 14, 15,<br />
16, 17, 18, 19, 20, 21, 22, 23 and 24).
Aspects of the fog phenomenon in Bacău city 335<br />
Fig. 13 - The graphical representation of the average number of foggy days in<br />
January between 2005- 2010<br />
Fig. 14 - The graphical representation of the average number of foggy days in<br />
February between 2005- 2010.<br />
Fig. 15 - The graphical representation of the average number of foggy days in<br />
March between 2005- 2010.
336<br />
Capşa, Nedeff, Faciu, G. Lazăr, I. Lazăr, Bârsan<br />
Fig. 16 - The graphical representation of the average number of foggy days in<br />
April between 2005- 2010.<br />
Fig. 17 - The graphical representation of the average number of foggy days in May<br />
between 2005- 2010.<br />
Fig. 18 - The graphical representation of the average number of foggy days in June<br />
between 2005- 2010.
Aspects of the fog phenomenon in Bacău city 337<br />
Fig. 19 - The graphical representation of the average number of foggy days in July<br />
between 2005- 2010<br />
Fig. 20. The graphical representation of the average number of foggy days in August<br />
between 2005- 2010<br />
Fig. 21. The graphical representation of the average number of foggy days in<br />
September between 2005- 2010.
338<br />
Capşa, Nedeff, Faciu, G. Lazăr, I. Lazăr, Bârsan<br />
Fig. 22 - The graphical representation of the average number of foggy days in<br />
October between 2005- 2010<br />
Fig. 23 - The graphical representation of the average number of foggy days in<br />
November between 2005- 2010<br />
Fig. 24 - The graphical representation of the average number of foggy days in<br />
December between 2005- 2010.
Aspects of the fog phenomenon in Bacău city 339<br />
Analyzing the graphs above we see that in January, February, November and<br />
December the meteo<strong>ro</strong>logical conditions determined the increasing of the fog<br />
phenomenon in this period. In these months the maximum of days is recorded<br />
during the analyzed period where the fog phenomenon was p<strong>ro</strong>duced respectively<br />
17 days in December of 2010. This time of the year corresponds to the cold period<br />
of winter where the temperatures are low and the wind direction is primarily f<strong>ro</strong>m<br />
N- NV but the precipitations are weak in quantity.<br />
During the specific period of spring the fog phenomenon occurred mainly in<br />
April when in 2008 there have been three days with fog.<br />
In the months of autumn the fog phenomenon was recorded in each of the<br />
analyzed six years respectively to a minimum of two days in 2010 and a maximum<br />
of 7 days in 2008.<br />
Excluding June when the fog phenomenon didn’t occur in summer, the fog<br />
phenomenon was recorded sporadically about one day per month th<strong>ro</strong>ughout the<br />
analyzed period 2005- 2010.<br />
Conclusions<br />
The importance of knowing the fog phenomenon results f<strong>ro</strong>m the fact that in<br />
different industries, especially in transport (land, air and naval), it can seriously<br />
disrupt this activity by reducing visibility.<br />
The p<strong>ro</strong>vision of this phenomenon is a matter of major difficulty, on the one<br />
hand because of the multitude of meteo<strong>ro</strong>logical parameters that depend on<br />
temperature, wind, humidity and on the other hand because of the local conditions<br />
(o<strong>ro</strong>graphic). According to this latter factor the general methods should have a<br />
strictly local application.<br />
At the mesoscale, the fog is a short term phenomenon, therefore, it is difficult<br />
to analyzed and to predict.<br />
As a main conclusion of the study, we noticed that the months with the most<br />
days where the fog had occurred there were those f<strong>ro</strong>m the cold season respectively<br />
those of the transition f<strong>ro</strong>m warm season to cold season- in autumn, at the<br />
transition f<strong>ro</strong>m cold season to warm season- in spring, with a maximum in<br />
December followed by November, January and February.<br />
In March, April, May, June, August and September, the number of recorded<br />
days is one to three days during a calendar month and the minimum is recorded in<br />
July when the fog phenomenon wasn’t observed.<br />
The altitude, the urban envi<strong>ro</strong>nment, the depression corridor which is<br />
characteristic to the area and the fact that warm masses of t<strong>ro</strong>pical home reach in<br />
Bacau City, they seem to be responsible for the large number of days with fog, it is<br />
bigger with 2 to 4 days than the average feature area east of the country.
340<br />
Capşa, Nedeff, Faciu, G. Lazăr, I. Lazăr, Bârsan<br />
References:<br />
Dayan U. and Lamb D., (2005), Global and synoptic-scale weather patterns<br />
cont<strong>ro</strong>llingwet atmospheric deposition over central Eu<strong>ro</strong>pe, Atmospheric<br />
Envi<strong>ro</strong>nment 39, pp. 521 - 533.<br />
Bogdan O. and Marinică I. (2007), Hazarde meteo-climatice din zona temperată: geneză<br />
şi vulnerabilitate cu aplicaţii la România, Editura “Lucian Blaga”, Sibiu, pp 422.<br />
Gârţu M. (1991), Câteva consideraţii asupra fenomenului de ceaţă în zona municipiului<br />
Bacău, lucrare internă A.N.M. Bucureşti.<br />
Iordachescu Ş. (2011), P<strong>ro</strong>gnoza ceţii în regiunea Olteniei, lucrare internă, C.M.R Oltenia.<br />
Mureşan T. and C<strong>ro</strong>itoru A.E. (2008), Considerations on fog phenomena in the North-<br />
Western Romania, lucrare internă Universitatea Babeş-Bolyai Cluj.<br />
Mureşan T. (2008), Ceaţa în zona culoarului Someşului Mic în intervalul 1987 - 2007,<br />
lucrare internă A.N.M.<br />
Ştefan Ş. (2004), Fizica atmosferei, Bucureşti, Editura Universităţii din Bucureşti.<br />
Tasnea D. and Sarbu V. (1984), Unele aspecte privind p<strong>ro</strong>ducerea ceţii, funcţie de<br />
temperatura şi umezeala aerului, Studii şi cercetări meteo<strong>ro</strong>logice A.N.M.<br />
Administraţia Naţională de Meteo<strong>ro</strong>logie - ANM (2008), Clima României, Editura<br />
Academiei Române.<br />
Institutul Meteo<strong>ro</strong>logic (1963), Condiţiile meteo<strong>ro</strong>logice care favorizează p<strong>ro</strong>ducerea şi<br />
menţinerea ceţurilor pe ae<strong>ro</strong>porturile Bacău, Iaşi, Suceava, Culegere de lucrări,<br />
pp.137 – 142.<br />
Institutul Naţional de Meteo<strong>ro</strong>logie şi Hid<strong>ro</strong>logie - INMH (1986), Instrucţiuni pentru<br />
observarea, identificarea şi codificarea norilor şi a fenomenelor meteo<strong>ro</strong>logice.<br />
www. arpmbc.anpm.<strong>ro</strong>;<br />
www.wetterzentrale.de.<br />
www.harta-<strong>ro</strong>maniei.<strong>ro</strong>/.<br />
www.sportman.<strong>ro</strong>/