EXPERIMENT 3: Introduction to Spectroscopy
EXPERIMENT 3: Introduction to Spectroscopy
EXPERIMENT 3: Introduction to Spectroscopy

You also want an ePaper? Increase the reach of your titles
YUMPU automatically turns print PDFs into web optimized ePapers that Google loves.
Name________________________________Sec___________<br />
<strong>EXPERIMENT</strong> 3: <strong>Introduction</strong> <strong>to</strong> <strong>Spectroscopy</strong><br />
Background (Read your text <strong>to</strong> review electromagnetic energy)<br />
The word spectroscopy is used <strong>to</strong> refer <strong>to</strong> the broad area of science dealing with the<br />
absorption, emission, or scattering of electromagnetic radiation by molecules, ions, a<strong>to</strong>ms, or<br />
nuclei. Spectroscopic techniques are probably the most widely used analytical methods in the<br />
world <strong>to</strong>day. These techniques are useful in determining the identity of unknown substance or the<br />
concentration of a known solute in solution. The measurement of the interaction of electromagnetic<br />
radiation with matter is called spectrometry and the device used <strong>to</strong> make these measurements is<br />
called a spectrometer . There are many different types of spectrometers designed <strong>to</strong> study the<br />
different regions of the electromagnetic spectrum. Some of the most widely used are: infrared,<br />
visible, ultraviolet, and x-ray spectrometers. The spectrometer you will use can correctly be called<br />
a colorimeter, because it measures the absorption of light in the visible spectrum which we perceive<br />
as color, and the technique used is said <strong>to</strong> be colorimetric.<br />
How It Works<br />
All spectrometers work on the principle that a<strong>to</strong>ms and molecules may exist in only certain<br />
specific energy levels, that is, they are quantized. They can absorb only pho<strong>to</strong>ns having certain<br />
energies or wavelengths. The energies of light absorbed by a molecule can be related <strong>to</strong> motions<br />
(energy modes) of the molecule. A few examples are shown in Table I.<br />
Table I<br />
Molecular Motion Electromagnetic Radiation Absorbed Energy<br />
rotation microwave, infrared low<br />
vibration infrared moderate<br />
electron transitions visible ultraviolet high<br />
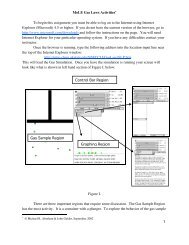
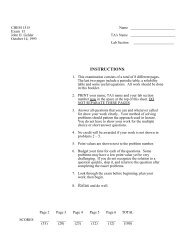
Although spectrometers differ a great deal in design and operation, they all contain the same<br />
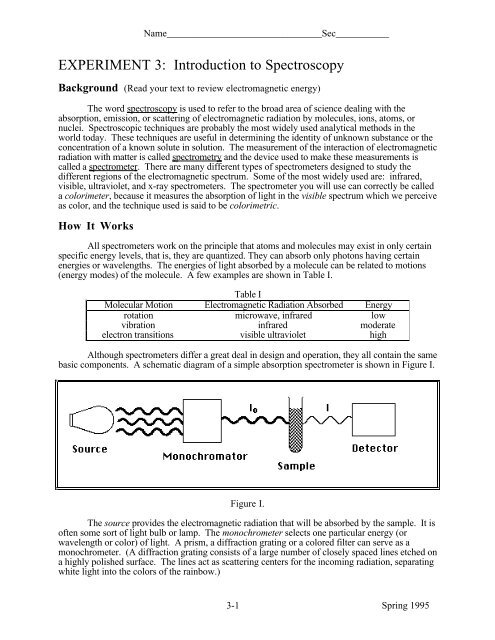
basic components. A schematic diagram of a simple absorption spectrometer is shown in Figure I.<br />
Figure I.<br />
The source provides the electromagnetic radiation that will be absorbed by the sample. It is<br />
often some sort of light bulb or lamp. The monochrometer selects one particular energy (or<br />
wavelength or color) of light. A prism, a diffraction grating or a colored filter can serve as a<br />
monochrometer. (A diffraction grating consists of a large number of closely spaced lines etched on<br />
a highly polished surface. The lines act as scattering centers for the incoming radiation, separating<br />
white light in<strong>to</strong> the colors of the rainbow.)<br />
3-1 Spring 1995
Name________________________________Sec___________<br />
The detec<strong>to</strong>r measures the amount of light that passes through the sample. A pho<strong>to</strong>tube (or<br />
pho<strong>to</strong> cell) or pho<strong>to</strong>multiplier is often used as a detec<strong>to</strong>r. All of these work on essentially the same<br />
principle. Light falling on the surface of the detec<strong>to</strong>r causes current <strong>to</strong> flow in a surrounding<br />
electrical circuit. The amount of current in the circuit is proportional <strong>to</strong> the amount of light striking<br />
the detec<strong>to</strong>r. A spectrometer having a pho<strong>to</strong>tube as a detec<strong>to</strong>r is often called a spectropho<strong>to</strong>meter .<br />
All the parts of the spectrometer work <strong>to</strong>gether as follows (Figure I): Light from the source<br />
passes through the monochrometer producing a beam with a single energy or a narrow band of<br />
energies. The intensity of this beam, I o , is measured by the detec<strong>to</strong>r. The sample is then placed in<br />
the beam between the monochometer and the detec<strong>to</strong>r. If some of the light is absorbed by the<br />
sample, the intensity of the beam reaching the detec<strong>to</strong>r, I, will be less than I o . The detec<strong>to</strong>r<br />
compares the compares the two intensities and reports the result as either percent transmittance<br />
(%T) or Absorbance (A). These terms are defined <strong>to</strong> be:<br />
%T = I<br />
I o<br />
x 100<br />
(the fraction of I o that gets through the sample is called Transmittance)<br />
A = -log T = -log<br />
⎛ I ⎞<br />
⎝ I o ⎠<br />
= 2 - log (%T).<br />
If the monochrometer is a prism or a diffraction grating, all of the energies (or<br />
wavelengths) are available and may be varied.<br />
Molecules do not absorb all wavelengths equally well. Consider a colored object. Human<br />
sight is the brain's interpretation of pho<strong>to</strong>ns of electromagnetic radiation in the visual range (light)<br />
entering the eye. If all the energies (wavelengths, colors) are mixed they are preceived as white<br />
light. If no pho<strong>to</strong>ns at all enter the eye we "see" black. A color is preceived if only pho<strong>to</strong>ns of one<br />
energy (light of one color, monochomatic light) enters the eye, or if pho<strong>to</strong>ns of a complementary<br />
color are missing from the usual white light mix. A white object then appears <strong>to</strong> be white because<br />
it does not absorb any of the light that strikes it. A black object looks black because it absorbs all<br />
of the incident light. A rose looks red if it absorbs all the light except the red or if it absorbs the<br />
light of the color complimentary <strong>to</strong> red - that is, blue-green. Table I shows a brief list of colors<br />
absorbed <strong>to</strong> give observed colors.<br />
Table I Visible Spectrum and Complementary Colors †<br />
Wavelength, nm Color Complementary<br />
(absorbed) (observed)<br />
400-435 Violet Yellow-green<br />
435-480 Blue Yellow<br />
480-490 Green-blue Orange<br />
490-500 Blue-green Red<br />
500-560 Green Purple<br />
560-580 Yellow-green Violet<br />
580-595 Yellow Blue<br />
595-610 Orange Green-blue<br />
610-750 Red Blue-green<br />
† Day, R. A., Jr., and A. L. Underwood. Quantitative Analysis, 3rd ed. (Englewood Cliffs, NJ: Prentice-Hall, Inc.),<br />
1974.<br />
3-2 Spring 1995
Name________________________________Sec___________<br />
In Part II the concentration of a colored species in solution will be determined. In order <strong>to</strong><br />
achieve the most accurate results we need <strong>to</strong> maximize the absorptivity of the species (Part I). We<br />
must select the color (energy, or wavelength) of light from our source that is best absorbed by the<br />
molecule. For example, if a solution is green-blue, it will absorb orange light, and the wavelength<br />
of maximum absorbance, λ max , will fall between 595 and 610 nm (see Table I above.) Amounts<br />
of light absorbed, even in the case of concentrated solutions are very small compared <strong>to</strong> the amount<br />
of light available from the source. It is much easier for the instrument <strong>to</strong> "see" the change if we<br />
make it as large as possible. Instruments like the Spec 20 have a variable monochrometer such as a<br />
prism or diffraction grating, making it is easy <strong>to</strong> select the complementary color from the source by<br />
stepping through the available wavelengths and plotting the absorbance vs. the wavelength. From<br />
the plot we can determine the exact wavelength of the complementary color, which is the<br />
wavelength of the maximum absorbance (λ max ). Values for λ max of many substances can be<br />
found in the chemical literature.<br />
PART I: Operation of the Spectronic 20 and Determination of<br />
λ max<br />
A. Operation of the Spec 20<br />
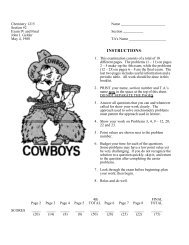
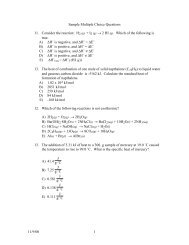
The Spec 20 is a moderately expensive piece of scientific equipment and should be treated with all<br />
due care and respect.<br />
Figure II<br />
In all the instructions that follow refer <strong>to</strong> Figure II.<br />
Operating Instructions (Use with Parts I and II below.)<br />
1. The Spec 20 is turned on by rotating the Power Switch/Zero Control knob (1) until a click is<br />
heard and the Pilot Lamp (3) comes on. The instrument must warm up for about 30 minutes<br />
prior <strong>to</strong> use. You will need at least two solutions, a “Blank” solution which contains the<br />
solvent used in the “Test” solution.<br />
3-3 Spring 1995
Name________________________________Sec___________<br />
2. Use the Wavelength Control knob (4) <strong>to</strong> select the desired wavelength. (In Part I the first<br />
wavelength will be 340 nm; in Part II, the wavelength you use will be λ max which you will<br />
have determined in Part I.)<br />
3. With the Sample Compartment (2) empty, close the door and set the readout scale <strong>to</strong> 0%<br />
transmittance (∞ absorbance) using the Power Switch/Zero Control knob (1). Be sure <strong>to</strong> line<br />
up the needle with its reflection in the mirror when reading the scale.<br />
4. Obtain a Spec 20 cuvette. The cuvette may look like an ordinary test tube, but it is made of<br />
special high quality glass and is much more expensive ($3.50 each!). Clean the cuvette and<br />
rinse it with distilled water, and then fill the cuvette about 3/4 full of solvent (the Blank solvent<br />
is distilled water in this experiment). Carefully wipe away any solution and fingerprints from<br />
the outside of the cuvette using a Kimwipe.<br />
5. Open the lid of the Sample Compartment (2) and slide the cuvette in<strong>to</strong> the opening. Find the<br />
hash mark (small straight line) on the cuvette and line it up exactly with a similar mark on the<br />
sample case. Close the door.<br />
6. With the Blank solution in the Sample Compartment (2), set the read-out scale <strong>to</strong> 100%<br />
transmittance (0 absorbance) with the Transmittance/Absorbance Control knob (5).<br />
7. Remove the cuvette containing the Blank solution from the Sample Compartment and close the<br />
door. If the scale does not read 0% transmittance, repeat step 3 and then steps 5 – 7.<br />
8. When consistent 0% (without Blank) and 100% (with Blank) readings have been obtained, set<br />
the cuvette containing the Blank solution aside. Be sure <strong>to</strong> save the Blank until all<br />
measurements have been made.<br />
10. Clean another cuvette and rinse it with a small portion of the Test solution whose absorbance<br />
is <strong>to</strong> be measured. Then fill it with the Test solution, wipe it with a Kimwipe and place it in<br />
the sample holder with hash marks aligned. Read the absorbance and percent transmittance<br />
and record the values in your Labora<strong>to</strong>ry Notebook.<br />
11. Repeat step 10 for all solutions <strong>to</strong> be determined. When finished, clean and dry the cuvettes<br />
carefully and return them <strong>to</strong> the s<strong>to</strong>reroom.<br />
Note: The percent transmittance scale is linear. It is easy <strong>to</strong> read <strong>to</strong> ±0.01 units at any position on<br />
the scale (0% <strong>to</strong> 100%). The absorbance scale, however is logarithmic and reads from right<br />
<strong>to</strong> left. The graduations along the scale vary. Always read both scales as accurately as you<br />
can and record both values. If you are not certain of the quality of your absorbance readings,<br />
you can check them by converting percent transmittance <strong>to</strong> absorbance using the formula:<br />
A = 2 - log%T<br />
Retain these instructions for use in future experiments with the Spectronic 20.<br />
3-4 Spring 1995
Name________________________________Sec___________<br />
B. Determination of λ max<br />
Check out:<br />
2 Spec 20 tubes (cuvettes)<br />
To determine λ max , you will measure the absorbance and transmittance at 340 nm, increase<br />
the wavelength by 10 nm, take another measurement, etc., until you have reached 580 nm. A plot<br />
of absorbance vs. wavelength will show you λ max .<br />
Rinse and clean both Spec 20 test tubes. Label one of the Spec 20 test tubes as the Blank<br />
and fill it three-quarters full with distilled water. Fill the other test tube the solution <strong>to</strong> be tested.<br />
It is important that before measuring the absorbance (or % transmittance) of the test solution that<br />
the Blank is used <strong>to</strong> calibrate the instrument at each wavelength.<br />
Record your data in your Labora<strong>to</strong>ry Notebook.<br />
Using graph paper supplied at the end of the experiment plot absorbance vs. wavelength<br />
(absorbance on the ordinate, wavelength on the abscissa.) Be sure <strong>to</strong> label and title your plot<br />
appropriately. Note: If the Mac is available you should consider using Cricket Graph <strong>to</strong> plot your<br />
data.<br />
Question:<br />
1) From the graph, what is λ max ________________.<br />
2) Compare this value with the table of absorbances on p. 2-3. Does the λ max value you<br />
obtained fall within the range of absorbances for a solution which is red<br />
Cleanup:<br />
Since you have used only food coloring in water, all waste can go down the drain. Wash and dry<br />
the Spec 20 tubes and return them <strong>to</strong> the s<strong>to</strong>reroom.<br />
3-5 Spring 1995
Name________________________________Sec___________<br />
PART II: Beer's Law<br />
An <strong>Introduction</strong><br />
A plot of absorbance vs. wavelength of light for a sample is called an absorbance spectrum. The<br />
amount of light absorbed is dependent on how well the substance absorbs light, the path length of<br />
the light, and the concentration. These parameters are combined in a mathematical relationship<br />
known as Beer's Law.<br />
Beer's law is a relationship between the light absorbance of a substance and its concentration. It<br />
is often written<br />
A = a . b . c<br />
where<br />
A = Absorbance of solution<br />
a = absorptivity, or how well the substance absorbs light (depends on the<br />
molecule absorbing the light)<br />
b = path length, length of sample holder<br />
c = concentration of solution<br />
Since a and b will not change in our experiment, we can combine them in<strong>to</strong> a new constant, k.<br />
Thus: A = kc. Note that this is the equation of a straight line y = mx + b where y = A, x = c, m =<br />
k and b = 0. (Remember that m is the slope of the line, and b is the y-intercept.) Beer's law then<br />
states that a plot of absorbance vs. concentration will give a straight line passing through the<br />
origin. Such a graph is labeled a "Beer's Law Plot". The slope of the line is characteristic of and<br />
depends upon the solution used.<br />
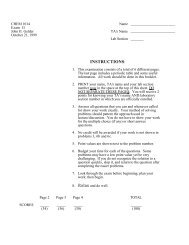
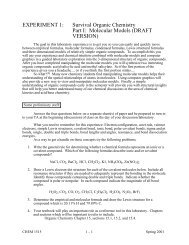
Suppose that a series of solutions of some substance where prepared, each having a<br />
different known concentration. If the absorbance of each solution is measured at the same<br />
wavelength, and a plot is made of absorbance vs. concentration, a plot like Figure II should result.<br />
This figure is called a "Beer's Law Plot".<br />
Absorbance<br />
1.0<br />
0.8<br />
0.6<br />
0.4<br />
0.2<br />
Beer's Law Plot<br />
x2 - x1<br />
y2 - y1<br />
m = (y2-y1)/(x2-x1)<br />
= 0.20/0.000070<br />
= 2900<br />
y = mx + b<br />
y = 2900x + 0<br />
0.0<br />
0.00000<br />
0.00010 0.00020<br />
Concentration, M<br />
0.00030<br />
3-6 Spring 1995
Name________________________________Sec___________<br />
Note that none of the points, lie exactly on the line. The line is a “best fit” - that is, the line<br />
is drawn closest <strong>to</strong> all of the points with the same number of points above and below the line.<br />
Although the line drawn is most accurate when the data points are processed statistically on a good<br />
hand-held calcula<strong>to</strong>r using the “method of least squares,” (linear regression) one can get a very<br />
good approximation by holding a clear ruler on the data points and drawing a line which best<br />
averages the data. You will be expected <strong>to</strong> do a least squares analysis of your data <strong>to</strong> obtain a line<br />
of “best fit.”.<br />
If your calcula<strong>to</strong>r does not have this function built-in you may use the following<br />
mathematical equation <strong>to</strong> obtain the “best fit” slope.<br />
m =<br />
n<br />
∑<br />
i = 1<br />
n<br />
∑<br />
( x i<br />
∑ y i<br />
)<br />
i = 1 i = 1<br />
x i<br />
y i<br />
− n<br />
n<br />
( x i<br />
) 2<br />
n ∑<br />
x 2 i = 1<br />
∑ i<br />
− n<br />
i = 1<br />
n<br />
.<br />
This formula may appear <strong>to</strong> be very complex, but it is actually quite easy <strong>to</strong> use, if you<br />
have access <strong>to</strong> a hand-held scientific calcula<strong>to</strong>r. The variable n is the number of data points. The<br />
values x i and y i are the individual x and y values for for each data point. The Greek letter sigma,<br />
n<br />
Σ, is used in mathematics <strong>to</strong> indicate a sum, so the group of symbols: ∑x i<br />
i = 1<br />
simply means <strong>to</strong> add up all n of the x values. The summations in the equation tell you <strong>to</strong> multiply<br />
each x times its respective y value and add up the products; sum all of the x values; sum all of the<br />
y values; and sum all of the squares of the x values, and finally, square the sum of the x values.<br />
When you have all of the sums, you can substitute the numbers in<strong>to</strong> the equation and calculate the<br />
slope of the line.<br />
Adding all of those values by hand can be tedious. Most scientific calcula<strong>to</strong>rs have<br />
statistical function keys that will do these calculations for you. Some more expensive calcula<strong>to</strong>rs<br />
have the least square (or linear progression) equation pre-programmed, so that you need only enter<br />
the values of the x, y pairs (concentration and absorbance). Check your calcula<strong>to</strong>r's instruction<br />
booklet <strong>to</strong> see what statistical functions it has and how <strong>to</strong> use them.<br />
If one is very careful in plotting the points by hand and drawing the best straight line<br />
possible through the data points, the value obtained for the slope of the line will approach the least<br />
square slope. The least square equation au<strong>to</strong>matically finds the line that is closest <strong>to</strong> all of the data<br />
points. To do this by hand, you have <strong>to</strong> position the line such that the distance between the line<br />
and the points that lie above is equal <strong>to</strong> the distance between the line and the points that lie below.<br />
This is not always easy! It is often less work <strong>to</strong> calculate the least square slope than <strong>to</strong> draw a<br />
good straight line. It will take much practice <strong>to</strong> become expert at drawing best fit lines. (If you<br />
have access <strong>to</strong> a computer with a graphing application and a printer capable of printing graphics,<br />
you are encouraged <strong>to</strong> use them <strong>to</strong> do all plotting in the labora<strong>to</strong>ry. Most commercial graphing<br />
applications will draw best fit lines and calculate their slopes for you.)<br />
3-7 Spring 1995
Name________________________________Sec___________<br />
By demonstrating a linear relationship between absorbance, A, and concentration, c, the<br />
Beer's Law plot not only confirms that the solution you are using conforms <strong>to</strong> Beer's Law, but it<br />
provides a calibration plot you can use <strong>to</strong> determine the concentration of a solution of the same<br />
substance, the concentration of which is not known. For example, if you have an unknown which<br />
has an absorbance of 0.43, you would determine from your calibration curve that the concentration<br />
of the unknown was 0.00012M (see graph above.) You should prove this <strong>to</strong> yourself using the<br />
Beer's Law plot on the previous page.<br />
PART II: Beer's Law<br />
Procedure<br />
Check out per pair:<br />
10 mL Mohr pipet<br />
pipet pump<br />
6 - 18 x 150 mm test tubes<br />
6 - Spec 20 tubes (cuvettes)<br />
2 - 250 mL beakers<br />
Obtain about 40 mL of red s<strong>to</strong>ck solution in a 50 mL beaker. Label test tubes 1-6. Rinse<br />
the pipet with 15 mL of s<strong>to</strong>ck solution, then pipet the volumes listed in Table I in<strong>to</strong> the test tubes.<br />
Rinse the pipet with distilled water and pipet the volume of water indicated in<strong>to</strong> the test tubes.<br />
Table I<br />
Test Tube # Vol. S<strong>to</strong>ck sol'n (mL) Vol. distilled water (mL)<br />
1 (Blank) 0.00 10.00<br />
2 2.00 8.00<br />
3 4.00 6.00<br />
4 6.00 4.00<br />
5 8.00 2.00<br />
6 10.00 0.00<br />
Duplicate the above table in your Labora<strong>to</strong>ry Notebook. Calculate the relative concentration of<br />
solutions 2-6.<br />
Place a piece of parafilm over the <strong>to</strong>p of tube 2 and shake <strong>to</strong> mix. Repeat for 3-6. Describe<br />
the appearance (color of the solution) of the test tubes. Record this information in your Labora<strong>to</strong>ry<br />
Notebook.<br />
Measuring Absorbance<br />
(The “steps” below refer <strong>to</strong> the operating instructions for the Spectronic 20 found in Part I<br />
of this experiment.)<br />
Set the wavelength <strong>to</strong> the value of the maximum absorption (λ max ) which you determined<br />
for the red solution in Part I (step 2). Place solution 1 (distilled water) in a Spec 20 tube <strong>to</strong> use as<br />
the blank <strong>to</strong> calibrate the Spectronic 20 (steps 3-8).<br />
Place each solution in a Spec 20 tube, and measure the absorbance and percent<br />
transmittance of each of the solutions (steps 10 and 11). Record the values in the table you have<br />
prepared in your Labora<strong>to</strong>ry Notebook.<br />
Check the absorbance readings using the mathematical equation given in Part I. Adjust the<br />
values if necessary.<br />
3-8 Spring 1995
Name________________________________Sec___________<br />
Prepare a plot of absorbance (y-axis) vs. concentration (x-axis). Determine the slope and<br />
y-intercept of the least-squares line (line of “best fit”) from your data. Use a graphing program<br />
such as Cricket Graph and place the prin<strong>to</strong>ut of the graph in your Labora<strong>to</strong>ry Notebook.<br />
Questions:<br />
1) Look at your plot. How well does it follow Beer's Law (In other words, how close <strong>to</strong> the<br />
average line you drew are all the points If your plot has points scattered all over the place,<br />
your solutions have not followed Beer’s law very well.)<br />
2) Put your data on the board so you and your classmates can compare the slopes and y-<br />
intercepts you obtained. Copy the collection of data in<strong>to</strong> your Labora<strong>to</strong>ry Notebook. How<br />
do you explain any variation in slope and y-intercept among the student groups<br />
3) From the collected data find the average slope and average y-intercept.<br />
average slope_________________________<br />
average y-intercept_____________________<br />
4) Write the equation for the line you have drawn:<br />
y = ______________________<br />
Determining the concentration of a solution<br />
Obtain from your TA a sample of of known concentration of a particular chemical species and<br />
a sample of the same chemical species of unknown concentration. Record the identification number<br />
of the unknown in your Labora<strong>to</strong>ry Notebook. Determine the concentration of the unknown<br />
solution. Write out your procedure, data tables, calculations and conclusions in your Labora<strong>to</strong>ry<br />
Notebook.<br />
3-9 Spring 1995
Name________________________________Sec___________<br />
Post Lab Questions<br />
1. List the colors of the visible spectrum from high energy <strong>to</strong> low.<br />
2. a. If a solution is green, what color is the light absorbed by the solution ___________<br />
b. If a solution is green, what color is the light transmitted by the solution_____________<br />
3. Lance, a medical technologist in a small rural hospital, uses the Spec 20 for analysis of iron in<br />
the blood. Although the ferric ion, Fe 3+ , is light yellow, it is difficult <strong>to</strong> detect colorimetrically<br />
in dilute solution. Therefore, Lance must add several reagents <strong>to</strong> blood serum, one of which<br />
reduces the iron(III) <strong>to</strong> iron(II), and another which is ferrozine, a compound which complexes<br />
the Fe 2+ ion <strong>to</strong> form a colored species which, like the red food coloring, can be measured<br />
colorimetrically. He obtains the following data: [Note that concentration is given in µg/dL<br />
(micrograms/deciliter).]<br />
Data for Standard Solutions<br />
Concentration,<br />
µg/dL<br />
Absorbance<br />
0.000 0.000<br />
25.00 0.144<br />
75.0 0.444<br />
125.0 0.744<br />
175.0 1.08<br />
225 1.40<br />
Absorbance of sample from patient #555 = 1.17.<br />
a. Show a Beer’s Law plot of the data in the table above.<br />
b. Using your plot, find the concentration of iron in the patient’s blood serum. ___________<br />
c. If normal serum iron is 40-155 µg/dL, what do you expect the doc<strong>to</strong>r <strong>to</strong> tell the patient<br />
4. Can you think of any improvements in the Spec 20 which might make experiments of the<br />
type you have performed easier<br />
3-10 Spring 1995
Name________________________________Sec___________<br />
Post Lab Questions (Continued)<br />
5. How does the Wavelength Control work and what does it do<br />
6. What is the point of using a Blank when calibrating the instrument at a particular wavelength<br />
7. Discuss the difference between spectroscopy, spectrometry and spectrometer.<br />
3-11 Spring 1995
Name________________________________Sec___________<br />
Unknowns<br />
CuSO 4<br />
CuCl 2<br />
MnO 4<br />
–<br />
NiSO 4<br />
NiCl 2<br />
CoSO 4<br />
CoCl 2<br />
Cr 2 O 7<br />
2–<br />
CrO 4<br />
2–<br />
FeSCN 2+<br />
Cu(NH 3 ) 4<br />
2+<br />
3-12 Spring 1995