to download the entire volume as a single PDF file - Geoscience BC
to download the entire volume as a single PDF file - Geoscience BC
to download the entire volume as a single PDF file - Geoscience BC

You also want an ePaper? Increase the reach of your titles
YUMPU automatically turns print PDFs into web optimized ePapers that Google loves.
GEOSCIENCE <strong>BC</strong><br />
SUMMARY OF ACTIVITIES 2011<br />
<strong>Geoscience</strong> <strong>BC</strong> Report 2012-1
GEOSCIENCE <strong>BC</strong><br />
SUMMARY OF ACTIVITIES 2011<br />
<strong>Geoscience</strong> <strong>BC</strong> Report 2012-1
© 2012 by <strong>Geoscience</strong> <strong>BC</strong>.<br />
All rights reserved. Electronic edition published 2012.<br />
This publication is also available, free of charge, <strong>as</strong> colour digital <strong>file</strong>s in Adobe Acrobat ® <strong>PDF</strong> format from <strong>the</strong> <strong>Geoscience</strong><br />
<strong>BC</strong> website: http://www.geosciencebc.com/s/DataRele<strong>as</strong>es.<strong>as</strong>p.<br />
Every re<strong>as</strong>onable effort is made <strong>to</strong> ensure <strong>the</strong> accuracy of <strong>the</strong> information contained in this report, but <strong>Geoscience</strong> <strong>BC</strong> does<br />
not <strong>as</strong>sume any liability for errors that may occur. Source references are included in <strong>the</strong> report and users should verify critical<br />
information.<br />
When using information from this publication in o<strong>the</strong>r publications or presentations, due acknowledgment should be given<br />
<strong>to</strong> <strong>Geoscience</strong> <strong>BC</strong>. The recommended reference is included on <strong>the</strong> title page of each paper. The complete <strong>volume</strong> should be<br />
referenced <strong>as</strong> follows:<br />
<strong>Geoscience</strong> <strong>BC</strong> (2012): <strong>Geoscience</strong> <strong>BC</strong> Summary of Activities 2011; <strong>Geoscience</strong> <strong>BC</strong>, Report 2012-1, 162 p.<br />
ISSN 1916-2960 Summary of Activities (<strong>Geoscience</strong> <strong>BC</strong>)<br />
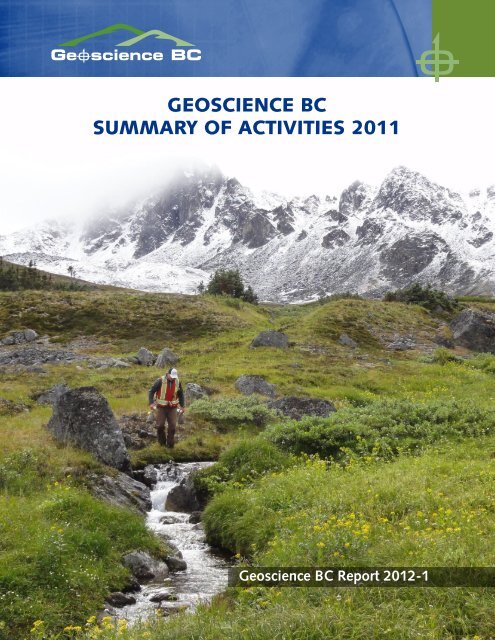
Cover pho<strong>to</strong>: Stream-sediment sampling in <strong>the</strong> QUEST-Northwest project area, northwestern British Columbia.<br />
Pho<strong>to</strong> credit: Wayne Jackaman, Noble Exploration Services Ltd., 2011.<br />
ii <strong>Geoscience</strong> <strong>BC</strong> Summary of Activities 2011
Foreword<br />
<strong>Geoscience</strong> <strong>BC</strong> is ple<strong>as</strong>ed <strong>to</strong> present results of many of our ongoing and recently completed geoscience projects and surveys<br />
in this, our fifth edition of <strong>the</strong> <strong>Geoscience</strong> <strong>BC</strong> Summary of Activities. The <strong>volume</strong> is divided in<strong>to</strong> three sections, and contains<br />
a <strong>to</strong>tal of 16 papers.<br />
The first section contains three papers from <strong>the</strong> QUEST-Northwest project, <strong>Geoscience</strong> <strong>BC</strong>’s latest major mineral<br />
geoscience initiative. The QUEST-Northwest project is designed <strong>to</strong> stimulate new mineral exploration activity in <strong>the</strong> northwestern<br />
part of <strong>the</strong> province, and <strong>to</strong> enhance <strong>the</strong> success of existing exploration activities in <strong>the</strong> region. Like <strong>the</strong> QUEST,<br />
QUEST-West and QUEST-South projects before it, QUEST-Northwest includes both airborne geophysical surveys and regional<br />
geochemical programs. However, <strong>the</strong> QUEST-Northwest program also includes a regional mapping component,<br />
which w<strong>as</strong> undertaken in partnership with <strong>the</strong> <strong>BC</strong> Geological Survey. Simpson and Jackaman describe <strong>the</strong> airborne magnetic<br />
surveys and regional geochemical surveys respectively, while Logan et al. discuss <strong>the</strong> regional mapping program (also<br />
discussed in <strong>the</strong> <strong>BC</strong> Geological Survey’s Geological Fieldwork 2011 <strong>volume</strong>).<br />
The second section of this <strong>volume</strong> describes ongoing <strong>Geoscience</strong> <strong>BC</strong>–supported mineral geoscience projects throughout<br />
<strong>BC</strong>, and is roughly organized by project type and area. Devine provides an update on <strong>Geoscience</strong> <strong>BC</strong>’s Porphyry Integration<br />
Project, which is currently pulling <strong>to</strong>ge<strong>the</strong>r existing geological, geochemical and geophysical dat<strong>as</strong>ets from select <strong>BC</strong> porphyry<br />
deposits. This project is complementary <strong>to</strong> <strong>the</strong> work of Blaine and Hart, who are developing geochemical-exploration<br />
models for <strong>BC</strong> porphyry deposits. Muezelaar and Monecke provide a final report on <strong>the</strong>ir geochemical modelling project<br />
aimed at constraining fluid controls on ore genesis in <strong>the</strong> Eskay Creek deposit.<br />
Two papers deal with till sampling programs in central British Columbia: Stumpf discusses <strong>the</strong> development of a till datab<strong>as</strong>e<br />
for <strong>the</strong> Bulkley River valley region, and Ward et al. provide an update on heavy-mineral analysis of till samples in <strong>the</strong><br />
QUEST Project area. V<strong>as</strong>a et al. discuss chemical variations in pyroxene and Fe-Ti–oxide crystals in b<strong>as</strong>alts of <strong>the</strong> Nicola<br />
Group in sou<strong>the</strong>rn <strong>BC</strong>, and relate <strong>the</strong> results <strong>to</strong> magma alkalinity and <strong>the</strong> location of known deposits. Finally, Höy and<br />
Jackaman describe a new <strong>Geoscience</strong> <strong>BC</strong> mapping project that will focus on <strong>the</strong> Burrell Creek map area in sou<strong>the</strong><strong>as</strong>tern <strong>BC</strong>.<br />
This work is a continuation of work <strong>the</strong> authors previously under<strong>to</strong>ok for <strong>Geoscience</strong> <strong>BC</strong> in <strong>the</strong> Deer Park map area in 2009.<br />
The third section of this <strong>volume</strong> discusses <strong>Geoscience</strong> <strong>BC</strong>’s oil and g<strong>as</strong> projects, which are split between nor<strong>the</strong><strong>as</strong>tern <strong>BC</strong><br />
and <strong>the</strong> Nechako B<strong>as</strong>in in central <strong>BC</strong>. Chapman et al. describe a partnership project between <strong>Geoscience</strong> <strong>BC</strong> and <strong>the</strong> <strong>BC</strong> Oil<br />
and G<strong>as</strong> Commission aimed at completing hydrological modelling in nor<strong>the</strong><strong>as</strong>tern <strong>BC</strong>, which will help guide use and development<br />
of water resources in <strong>the</strong> region, including potential use in unconventional g<strong>as</strong> development. This project is complementary<br />
<strong>to</strong> <strong>the</strong> two major projects <strong>Geoscience</strong> <strong>BC</strong> h<strong>as</strong> undertaken in nor<strong>the</strong><strong>as</strong>tern <strong>BC</strong> over <strong>the</strong> p<strong>as</strong>t few years: <strong>the</strong> Horn River<br />
B<strong>as</strong>in Aquifer Project (Ph<strong>as</strong>es 1 and 2) and <strong>the</strong> Montney Water Project. These projects are focused on understanding surface<br />
and subsurface water sources in <strong>the</strong> Horn River B<strong>as</strong>in and Montney g<strong>as</strong> play respectively. Also in nor<strong>the</strong><strong>as</strong>tern <strong>BC</strong>,<br />
Chalmers et al. examine geological controls on tight-g<strong>as</strong> in <strong>the</strong> Montney play, and Golding et al. and Henderson et al. undertake<br />
stratigraphic studies in <strong>the</strong> area. Finally, Kushnir et al. present <strong>the</strong> results of a rock-property study in <strong>the</strong> Nechako B<strong>as</strong>in<br />
(raw data rele<strong>as</strong>ed <strong>as</strong> <strong>Geoscience</strong> <strong>BC</strong> Report 2011-10; see below), and Spratt et al. discuss <strong>the</strong> use of magne<strong>to</strong>telluric<br />
transfer functions <strong>to</strong> test <strong>the</strong> usefulness of ZTEM data in <strong>the</strong> Nechako B<strong>as</strong>in.<br />
Readers are encouraged <strong>to</strong> visit <strong>the</strong> website for additional information on all <strong>Geoscience</strong> <strong>BC</strong>–funded projects, including<br />
project descriptions, posters and presentations, previous Summary of Activities or Geological Fieldwork papers, and final<br />
dat<strong>as</strong>ets and reports. All papers in this and p<strong>as</strong>t <strong>volume</strong>s are available for <strong>download</strong> through <strong>Geoscience</strong> <strong>BC</strong>’s website<br />
(www.geosciencebc.com). Limited copies of p<strong>as</strong>t <strong>volume</strong>s are also available from <strong>the</strong> <strong>Geoscience</strong> <strong>BC</strong> office.<br />
<strong>Geoscience</strong> <strong>BC</strong> Publications 2011<br />
In addition <strong>to</strong> this Summary of Activities <strong>volume</strong>, <strong>Geoscience</strong> <strong>BC</strong> rele<strong>as</strong>es interim and final products from our projects <strong>as</strong><br />
<strong>Geoscience</strong> <strong>BC</strong> Reports. All <strong>Geoscience</strong> <strong>BC</strong> data and reports can be accessed through our website at<br />
www.geosciencebc.com/s/DataRele<strong>as</strong>es.<strong>as</strong>p. <strong>Geoscience</strong> <strong>BC</strong> dat<strong>as</strong>ets and reports rele<strong>as</strong>ed in 2011 include <strong>the</strong> following:<br />
25 technical papers in <strong>the</strong> <strong>Geoscience</strong> <strong>BC</strong> Summary of Activities 2010 <strong>volume</strong><br />
Nor<strong>the</strong>rn <strong>BC</strong> Sample Reanalysis Project, by W. Jackaman (<strong>Geoscience</strong> <strong>BC</strong> Report 2011-2)<br />
The application of surface organic materials <strong>as</strong> sample media over deeply buried mineralization at <strong>the</strong> Kwanika Central<br />
Zone, North-Central British Columbia, by D.R. Heberlein and C.E. Dunn (<strong>Geoscience</strong> <strong>BC</strong> Report 2011-3)<br />
<strong>Geoscience</strong> <strong>BC</strong> Report 2012-1<br />
iii
Regional Stream Sediment and Water Geochemical Data, Vancouver Island, British Columbia, by W. Jackaman<br />
(<strong>Geoscience</strong> <strong>BC</strong> Report 2011-4)<br />
Catchment Analysis and Interpretation of Stream Sediment Data from QUEST-South, British Columbia, by D.C.<br />
Arne and E.B. Bluemel (<strong>Geoscience</strong> <strong>BC</strong> Report 2011-5)<br />
Ground Testing of Predicted Geology B<strong>as</strong>ed on Stream and Lake Sediment Geochemistry in <strong>the</strong> QUEST Area, Using<br />
Previously Undocumented Bedrock Exposures, by T. Bissig, J. Logan, D.R. Heberlein and F. Ma (<strong>Geoscience</strong> <strong>BC</strong><br />
2011-6)<br />
Preliminary Bedrock Topography and Drift Thickness of <strong>the</strong> Montney Play, by A.S. Hickin and M.A. Fournier<br />
(<strong>Geoscience</strong> <strong>BC</strong> Report 2011-7 / <strong>BC</strong> Ministry of Energy and Mines, Energy Open File 2011-1)<br />
Compilation of Geological Survey of Canada Surficial Geology Maps for NTS 094A and 093P, by A.S. Hickin<br />
(<strong>Geoscience</strong> <strong>BC</strong> Map 2011-8-1 / <strong>BC</strong> Ministry of Energy and Mines, Energy Open File 2011-2)<br />
Till Geochemistry of <strong>the</strong> Colleymount Map Area (093L/01), West-Central British Columbia, by T. Ferbey (<strong>Geoscience</strong><br />
<strong>BC</strong> Report 2011-9 / <strong>BC</strong> Geological Survey Open File 2011-06)<br />
Rock Physical Property Me<strong>as</strong>urements <strong>to</strong> Aid Geophysical Surveys in <strong>the</strong> Nechako B<strong>as</strong>in Oil and G<strong>as</strong> Region, Central<br />
British Columbia, by G. Andrews, S. Quane, R.J. Enkin, K. Russell, A. Kushnir, L. Kennedy, N. Hayward and M.<br />
Heap (<strong>Geoscience</strong> <strong>BC</strong> Report 2011-10)<br />
Montney Water Project: Watershed Posters, by Foundry Spatial Ltd. (<strong>Geoscience</strong> <strong>BC</strong> Report 2011-12)<br />
Preliminary Lithological and Structural Framework of Eocene Volcanic Rocks in <strong>the</strong> Nechako Region, Central British<br />
Columbia, by E. Bordet, C.J.R. Hart, and D. Mitchinson (<strong>Geoscience</strong> <strong>BC</strong> Report 2011-13)<br />
Regional 3-D Inversion Modelling of Airborne Gravity and Magnetic Data: QUEST-South, <strong>BC</strong>, Canada, by Mira<br />
<strong>Geoscience</strong> Ltd. (<strong>Geoscience</strong> <strong>BC</strong> Report 2011-14)<br />
Regional 3-D Inversion Modelling of Airborne Gravity, Magnetic, and Electromagnetic Data, Central <strong>BC</strong>, Canada,<br />
by Mira <strong>Geoscience</strong> Ltd. (<strong>Geoscience</strong> <strong>BC</strong> Report 2011-15)<br />
The Characteristics, Origin and Exploration Potential for Sediment-Hosted Cu±Ag Mineralization in <strong>the</strong> Purcell<br />
Supergroup, Canada, by R.P. Hartlaub, W. J. Davis and C.E. Dunn (<strong>Geoscience</strong> <strong>BC</strong> Report 2011-16)<br />
Porphyry Indica<strong>to</strong>r Minerals (PIMS): A New Exploration Tool for Concealed Deposits in South-Central British Columbia,<br />
by F. Bouzari, C.J.R. Hart, S. Barker and T. Bissig (<strong>Geoscience</strong> <strong>BC</strong> Report 2011-17)<br />
All rele<strong>as</strong>es of <strong>Geoscience</strong> <strong>BC</strong> reports and data are announced through our website and e-mail list. If you are interested in receiving<br />
e-mail regarding <strong>the</strong>se reports and o<strong>the</strong>r <strong>Geoscience</strong> <strong>BC</strong> news, ple<strong>as</strong>e contact info@geosciencebc.com.<br />
Acknowledgments<br />
<strong>Geoscience</strong> <strong>BC</strong> would like <strong>to</strong> thank all authors of <strong>the</strong> Summary of Activities papers, including project proponents, graduate<br />
students, consultants and staff, for <strong>the</strong>ir contributions <strong>to</strong> this <strong>volume</strong>. RnD Technical is also thanked for <strong>the</strong>ir work in editing<br />
and <strong>as</strong>sembling this <strong>volume</strong>.<br />
Christa Sluggett, M.Sc.<br />
Project Geologist and Communications Co-ordina<strong>to</strong>r<br />
<strong>Geoscience</strong> <strong>BC</strong><br />
www.geosciencebc.com<br />
iv <strong>Geoscience</strong> <strong>BC</strong> Summary of Activities 2011
Contents<br />
QUEST-Northwest Projects<br />
Simpson, K.A.: QUEST-Northwest: <strong>Geoscience</strong> <strong>BC</strong>’s new<br />
minerals project in northwestern British Columbia. ....1<br />
Logan, J.M., Diakow, L.J., van Straaten, B.I., Moynihan,<br />
D.P. and Iverson, O.: QUEST-Northwest mapping:<br />
<strong>BC</strong> Geological Survey De<strong>as</strong>e Lake <strong>Geoscience</strong> Project,<br />
nor<strong>the</strong>rn British Columbia. .......................5<br />
Jackaman, W.: QUEST Northwest Project: new regional<br />
geochemical survey and sample reanalysis data,<br />
nor<strong>the</strong>rn British Columbia. ......................15<br />
Minerals Projects<br />
Devine, F.: Porphyry Integration Project: bringing <strong>to</strong>ge<strong>the</strong>r<br />
geoscience and exploration dat<strong>as</strong>ets for British<br />
Columbia'sporphyrydistricts....................19<br />
Blaine,F.A.andHart,C.J.R.: Geochemical-exploration<br />
models for porphyry deposits in British Columbia ....29<br />
Meuzelaar, T. and Monecke, T.: Fluid controls on ore<br />
genesis in <strong>the</strong> Eskay Creek deposit, northwestern<br />
British Columbia ..............................41<br />
Stumpf, A.J.: Development of a datab<strong>as</strong>e for geoscience<br />
field observations, west-central British Columbia ....53<br />
Ward, B.C., Leybourne, M.I. and Sacco, D.A.: Heavy<br />
mineral analysis of till samples within <strong>the</strong> QUEST<br />
Project area, central British Columbia .............59<br />
Vaca, S., Bissig, T., Raudsepp, M. and Hart, C.J.R.:<br />
Chemical variations of pyroxene and Fe-Ti–oxide<br />
crystals in b<strong>as</strong>alts hosting Cu-Au porphyry mineralization<br />
in <strong>the</strong> Quesnel terrane, interior British<br />
Columbia....................................69<br />
Höy, T. and Jackaman, W.: Geological mapping, regional<br />
data compilation and mineral evaluation in <strong>the</strong> Burrell<br />
Creek map area, sou<strong>the</strong><strong>as</strong>tern British Columbia ......79<br />
Oil and G<strong>as</strong> Projects<br />
Chapman,A.,Kerr,B.andWilford,D.:Hydrological<br />
modelling and decision-support <strong>to</strong>ol development for<br />
water allocation, nor<strong>the</strong><strong>as</strong>tern British Columbia ......81<br />
Chalmers, G.R.L., Bustin, R.M. and Bustin, A.A.M.:<br />
Geological controls on matrix permeability of <strong>the</strong><br />
Doig-Montney hybrid shale-g<strong>as</strong>–tight-g<strong>as</strong> reservoir,<br />
nor<strong>the</strong><strong>as</strong>tern British Columbia. ...................87<br />
Golding, M.L., Mortensen, J.K., Zonneveld, J-P. and<br />
Orchard, M.J.: Biostratigraphy and sedimentary<br />
provenance of Lower and Middle Tri<strong>as</strong>sic naturalg<strong>as</strong>–bearing<br />
rocks in nor<strong>the</strong><strong>as</strong>tern British Columbia:<br />
progressreport................................97<br />
Henderson, C.M., Zubin-Stathopoulos, K.D. and Dean,<br />
G.J.: Chronostratigraphic and tec<strong>to</strong>nostratigraphic<br />
summary of <strong>the</strong> Late Paleozoic and Early Tri<strong>as</strong>sic<br />
succession in e<strong>as</strong>t-central British Columbia ........115<br />
Kushnir, A., Andrews, G., Russell, J.K., Enkin, R.J.,<br />
Kennedy, L.A., Heap, M.J. and Quane, S.: Rock<br />
physical-property me<strong>as</strong>urements for <strong>the</strong> Nechako<br />
B<strong>as</strong>in oil and g<strong>as</strong> region, central British Columbia. ..125<br />
Spratt, J.E., Farquharson, C.G. and Craven, J.A.:<br />
Analysis of magne<strong>to</strong>telluric transfer functions <strong>to</strong><br />
determine <strong>the</strong> usefulness of ZTEM data in <strong>the</strong><br />
Nechako B<strong>as</strong>in, south-central British Columbia .....151<br />
<strong>Geoscience</strong> <strong>BC</strong> Report 2012-1<br />
v
vi <strong>Geoscience</strong> <strong>BC</strong> Summary of Activities 2011
QUEST-Northwest: <strong>Geoscience</strong> <strong>BC</strong>’s New Minerals Project in Northwestern British<br />
Columbia (NTS 104G, J, Parts of NTS 104A, B, F, H, I, K, 103O, P)<br />
K.A. Simpson, <strong>Geoscience</strong> <strong>BC</strong>, Vancouver, <strong>BC</strong>, simpson@geosciencebc.com<br />
Simpson, K.A. (2012): QUEST-Northwest: <strong>Geoscience</strong> <strong>BC</strong>’s new minerals project in northwestern British Columbia (NTS 104G, J, parts<br />
of NTS 104A, B, F, H, I, K, 103O, P); in <strong>Geoscience</strong> <strong>BC</strong> Summary of Activities 2011, <strong>Geoscience</strong> <strong>BC</strong>, Report 2012-1, p. 1–4.<br />
Introduction<br />
<strong>Geoscience</strong> <strong>BC</strong> launched its latest regional project,<br />
QUEST-Northwest, in April 2011. The QUEST-Northwest<br />
area is host <strong>to</strong> a number of known mineral deposits and remains<br />
a highly prospective area for <strong>the</strong> discovery of new<br />
copper, gold, silver and molybdenum resources. The project<br />
aims <strong>to</strong> compile and update existing dat<strong>as</strong>ets <strong>as</strong> well <strong>as</strong><br />
provide new geoscience data <strong>to</strong> help focus exploration. The<br />
QUEST-Northwest project coincides with <strong>the</strong> approval of<br />
<strong>the</strong> Northwest Transmission Line, which will provide critical<br />
infr<strong>as</strong>tructure that will make exploration and development<br />
in this part of <strong>the</strong> province more viable and attractive.<br />
The QUEST-Northwest project’s main activities include<br />
bedrock geological mapping, a regional ground geochemical<br />
program and two airborne magnetic surveys flown at a<br />
line spacing of 250 m (Figure 1). The high-resolution airborne<br />
magnetic surveys in <strong>the</strong> north will be complemented<br />
by a compilation of existing high-quality industry airborne<br />
magnetic data in <strong>the</strong> Stewart area <strong>to</strong> <strong>the</strong> south (Figure 1).<br />
Additional projects in <strong>the</strong> QUEST-Northwest area will involve<br />
adding value <strong>to</strong> <strong>the</strong> airborne magnetic surveys and regional<br />
geochemical data <strong>as</strong> well <strong>as</strong> acquisition of new data.<br />
Regional Bedrock Mapping<br />
The QUEST-Northwest regional bedrock mapping program<br />
is a partnership between <strong>Geoscience</strong> <strong>BC</strong> and <strong>the</strong> British<br />
Columbia Geological Survey. Field mapping w<strong>as</strong> led by<br />
<strong>the</strong> <strong>BC</strong> Geological Survey and w<strong>as</strong> undertaken in July and<br />
August 2011. Mapping w<strong>as</strong> undertaken at a 1:50 000 scale<br />
in <strong>the</strong> De<strong>as</strong>e Lake area (Figure 1). Additional follow-up<br />
analyses include geochronology, petrography, geochemistry<br />
and fossil identification. For more detailed information<br />
on <strong>the</strong> regional bedrock mapping program, see Logan et al.<br />
(2012). Rele<strong>as</strong>e of <strong>the</strong> new mapping is planned for <strong>the</strong><br />
Mineral Exploration Roundup 2012 in Vancouver, <strong>BC</strong>.<br />
Geochemical Program<br />
The QUEST-Northwest geochemical program involved <strong>the</strong><br />
collection of new stream sediment and water samples <strong>as</strong><br />
well <strong>as</strong> <strong>the</strong> reanalysis of archived samples from 1987. The<br />
new infill geochemical sampling w<strong>as</strong> undertaken in August<br />
2011 and a <strong>to</strong>tal of 441 stream sediment and water samples<br />
were collected. Details of <strong>the</strong> geochemical program are outlined<br />
in Jackaman (2012). Results of <strong>the</strong> new sampling will<br />
be rele<strong>as</strong>ed in late spring 2012. The results of <strong>the</strong> reanalysis<br />
(997 samples) will be rele<strong>as</strong>ed at Roundup 2012.<br />
Geophysical Program<br />
The QUEST-Northwest geophysical program includes two<br />
airborne magnetic surveys, in <strong>the</strong> De<strong>as</strong>e Lake and Telegraph<br />
Creek are<strong>as</strong> (Block 1 and Block 2; Figure 1). Both<br />
surveys were flown at a line spacing of 250 m, in an e<strong>as</strong>twest<br />
orientation with 2500 m spaced tie lines. The flights<br />
were flown at a nominal height of 80 m above ground level.<br />
The terrain in both survey are<strong>as</strong> is rugged and varied, ranging<br />
from 400 m <strong>to</strong> more than 2000 m elevation (Figure 2).<br />
Block 1 w<strong>as</strong> flown by Aeroquest Airborne (Mississauga,<br />
Ontario) using a HeliMAG stinger system. The survey covered<br />
approximately 5755 km 2 with a <strong>to</strong>tal of 25 357 line km<br />
flown. Block 2 w<strong>as</strong> flown by Geo Data Solutions Inc.<br />
(Laval, Quebec), also using a HeliMAG stinger system<br />
(Figure 3). The survey covered approximately 2361 km 2<br />
with a <strong>to</strong>tal of 11 337 line km flown. Rele<strong>as</strong>e of <strong>the</strong> geophysical<br />
data from both surveys is planned for Roundup<br />
2012.<br />
In addition <strong>to</strong> <strong>the</strong> new data acquisition, a data compilation<br />
project is in development in <strong>the</strong> sou<strong>the</strong>rn portion of <strong>the</strong><br />
QUEST-Northwest area (Figure 1). High-quality industry<br />
airborne magnetic data exist in <strong>the</strong> Stewart area and<br />
<strong>Geoscience</strong> <strong>BC</strong> is currently investigating <strong>the</strong> possibility of<br />
compiling <strong>the</strong>se dat<strong>as</strong>ets.<br />
Summary<br />
Keywords: airborne magnetics, geochemistry, mapping, Quesnel<br />
terrane, Stikine terrane, QUEST-Northwest Project<br />
This publication is also available, free of charge, <strong>as</strong> colour digital<br />
<strong>file</strong>s in Adobe Acrobat ® <strong>PDF</strong> format from <strong>the</strong> <strong>Geoscience</strong> <strong>BC</strong><br />
website: http://www.geosciencebc.com/s/DataRele<strong>as</strong>es.<strong>as</strong>p.<br />
The QUEST-Northwest Project is a multidisciplinary, integrated<br />
project located in a region with a high potential for<br />
new discoveries. It currently includes <strong>the</strong> acquisition of<br />
new airborne magnetic surveys, stream sediment and water<br />
samples, and 1:50 000 mapping (and <strong>as</strong>sociated analytical<br />
analyses). In addition, it involves <strong>the</strong> compilation of exist-<br />
<strong>Geoscience</strong> <strong>BC</strong> Report 2012-1 1
Figure 1. <strong>Geoscience</strong> <strong>BC</strong>’s QUEST-Northwest Project area. The major project activities are outlined. Data from Canadian Council on<br />
Geomatics (2000), M<strong>as</strong>sey et al. (2005), Natural Resources Canada (2007), Province of British Columbia (2008) and <strong>BC</strong> Geological<br />
Survey (2011).<br />
2 <strong>Geoscience</strong> <strong>BC</strong> Summary of Activities 2011
Acknowledgments<br />
The digital elevation model in Figure 1 w<strong>as</strong> prepared by K.<br />
Shimamura and F. Ma created <strong>the</strong> final figure. Aeroquest<br />
Ltd. and Geo Data Solutions Inc. are thanked for providing<br />
images for <strong>the</strong> manuscript. The manuscript benefited from<br />
reviews by P. Kowalczyk and C. Sluggett.<br />
Figure 2. Typical terrain within <strong>the</strong> Block 1 survey area, in <strong>the</strong><br />
De<strong>as</strong>e Lake and Telegraph Creek are<strong>as</strong>. Pho<strong>to</strong> courtesy of L.<br />
Luke, Aeroquest Ltd., Vancouver, British Columbia.<br />
Figure 3. HeliMAG stinger system used by Geo Data Solutions Inc.<br />
<strong>to</strong> fly <strong>the</strong> Block 2 survey in <strong>the</strong> De<strong>as</strong>e Lake and Telegraph Creek are<strong>as</strong>.<br />
Pho<strong>to</strong> courtesy of Geo Data Solutions Inc., Laval, Quebec.<br />
ing geological and geophysical data and <strong>the</strong> reanalysis of<br />
archived geochemical samples. It is anticipated that additional<br />
studies will be undertaken <strong>to</strong> add value <strong>to</strong>, and build<br />
on, <strong>the</strong>se new dat<strong>as</strong>ets. The results from <strong>the</strong> project will<br />
provide fundamental geoscience data <strong>to</strong> <strong>as</strong>sist mineral exploration.<br />
QUEST-Northwest data will be made available<br />
on <strong>Geoscience</strong> <strong>BC</strong>’s website (http://www.geosciencebc<br />
.com/s/DataRele<strong>as</strong>es.<strong>as</strong>p) starting in early 2011.<br />
References<br />
<strong>BC</strong> Geological Survey (2011): MINFILE <strong>BC</strong> mineral deposits datab<strong>as</strong>e;<br />
<strong>BC</strong> Ministry of Energy and Mines, URL<br />
[May 2011].<br />
Canadian Council on Geomatics (2000): Canadian digital elevation<br />
data; Natural Resources Canada, GeoB<strong>as</strong>e ® ,URL<br />
[Oc<strong>to</strong>ber 2004].<br />
Jackaman, W. (2012): QUEST-Northwest Project: new regional<br />
geochemical survey and sample reanalysis data, nor<strong>the</strong>rn<br />
British Columbia (NTS 104F, G, H, I, J, K); in <strong>Geoscience</strong><br />
<strong>BC</strong> Summary of Activities 2011, <strong>Geoscience</strong> <strong>BC</strong>, Report<br />
2012-1, p. 15–18.<br />
Logan, J.M., Diakow, L.J., van Straaten, B.I., Moynihan, D.P. and<br />
Iverson, O. (2012): QUEST-Northwest mapping: <strong>BC</strong> Geological<br />
Survey De<strong>as</strong>e Lake <strong>Geoscience</strong> Project, nor<strong>the</strong>rn<br />
British Columbia (NTS 104I, J); in <strong>Geoscience</strong> <strong>BC</strong> Summary<br />
of Activities 2011, <strong>Geoscience</strong> <strong>BC</strong>, Report 2012-1,<br />
p. 5–14.<br />
M<strong>as</strong>sey, N.W.D, MacIntyre, D.G., Desjardins, P.J. and Cooney,<br />
R.T. (2005): Digital geology map of British Columbia:<br />
whole province; <strong>BC</strong> Ministry of Energy and Mines, GeoFile<br />
2005-1, URL [November 2011].<br />
Natural Resources Canada (2007): Atl<strong>as</strong> of Canada b<strong>as</strong>e maps;<br />
Natural Resources Canada, Earth Sciences Sec<strong>to</strong>r, URL<br />
[November<br />
2011].<br />
Province of British Columbia (2008): TANTALIS–parks, ecological<br />
reserves, and protected are<strong>as</strong>; Geo<strong>BC</strong> (distribu<strong>to</strong>r), URL<br />
[March<br />
2011].<br />
<strong>Geoscience</strong> <strong>BC</strong> Report 2012-1 3
4 <strong>Geoscience</strong> <strong>BC</strong> Summary of Activities 2011
QUEST-Northwest Mapping: <strong>BC</strong> Geological Survey De<strong>as</strong>e Lake <strong>Geoscience</strong> Project,<br />
Nor<strong>the</strong>rn British Columbia (NTS 104I, J)<br />
J.M. Logan, British Columbia Ministry of Energy and Mines, Vic<strong>to</strong>ria, <strong>BC</strong>, Jim.Logan@gov.bc.ca<br />
L.J. Diakow, British Columbia Ministry of Energy and Mines, Vic<strong>to</strong>ria, <strong>BC</strong><br />
B.I. van Straaten, British Columbia Ministry of Energy and Mines, Vic<strong>to</strong>ria, <strong>BC</strong><br />
D.P. Moynihan, University of Calgary, Calgary, AB<br />
O. Iverson, University of Wisconsin–Eau Claire, WI, USA<br />
Logan, J.M., Diakow, L.J., van Straaten, B.I., Moynihan, D.P. and Iverson, O. (2012): QUEST-Northwest mapping: <strong>BC</strong> Geological Survey<br />
De<strong>as</strong>e Lake <strong>Geoscience</strong> Project, nor<strong>the</strong>rn British Columbia (NTS 104I, J); in <strong>Geoscience</strong> <strong>BC</strong> Summary of Activities 2011, <strong>Geoscience</strong><br />
<strong>BC</strong>, Report 2012-1, p. 5–14.<br />
Introduction<br />
The British Columbia Geological Survey De<strong>as</strong>e Lake<br />
<strong>Geoscience</strong> Project is part of <strong>the</strong> <strong>Geoscience</strong> <strong>BC</strong>’s QUEST-<br />
Northwest initiative, a program launched in 2011 <strong>to</strong> stimulate<br />
exploration in <strong>the</strong> northwestern part of <strong>the</strong> province<br />
along Highway 37 (Figure 1). <strong>Geoscience</strong> <strong>BC</strong> h<strong>as</strong> committed<br />
$3.25 million in funding <strong>to</strong> provide two high-resolution<br />
(with a line spacing of 250 m) airborne magnetic surveys, a<br />
collection and analysis of new regional stream sediment<br />
samples, a reanalysis of stream sediment samples and <strong>the</strong><br />
new bedrock mapping described in this paper. The 2011<br />
program of bedrock mapping and mineral deposit studies<br />
undertaken by <strong>the</strong> <strong>BC</strong> Geological Survey, with involvement<br />
from <strong>the</strong> University of Wisconsin–Eau Claire, is complementary<br />
<strong>to</strong> <strong>the</strong> geophysical and geochemical programs<br />
directly administered through <strong>Geoscience</strong> <strong>BC</strong> (see<br />
Jackaman, 2012 and Simpson, 2012). Collectively, <strong>the</strong>se<br />
programs will provide detailed, high-quality geoscience<br />
data that is intended <strong>to</strong> enhance metallic mineral exploration<br />
in an area of prospective geology adjacent <strong>to</strong> Highway<br />
37, near De<strong>as</strong>e Lake, in nor<strong>the</strong>rn British Columbia.<br />
The De<strong>as</strong>e Lake study area is situated within <strong>the</strong> Stikine<br />
terrane, an extensive subduction-generated island arc magmatic<br />
system responsible for recurring calcalkaline and/or<br />
alkaline plu<strong>to</strong>nic events and <strong>as</strong>sociated Cu-Au mineralization,<br />
mainly during Late Tri<strong>as</strong>sic and Early Jur<strong>as</strong>sic. Prospective<br />
Mesozoic volcanic rocks exposed around <strong>the</strong> margins<br />
of <strong>the</strong> Bowser B<strong>as</strong>in form an arcuate belt containing<br />
Keywords: QUEST-Northwest mapping, <strong>Geoscience</strong> <strong>BC</strong>, regional<br />
bedrock mapping, integrated multidisciplinary studies, geochemistry,<br />
Cu-Au metallogeny, molybdenite, Tri<strong>as</strong>sic, Jur<strong>as</strong>sic, Cretaceous,<br />
plu<strong>to</strong>nism, Tsaybahe, Stuhini, Hotailuh, Snow Peak, target<br />
generation, GIS<br />
This publication is also available, free of charge, <strong>as</strong> colour digital<br />
<strong>file</strong>s in Adobe Acrobat ® <strong>PDF</strong> format from <strong>the</strong> <strong>Geoscience</strong> <strong>BC</strong><br />
website: http://www.geosciencebc.com/s/DataRele<strong>as</strong>es.<strong>as</strong>p.<br />
porphyry deposits that include KSM (MINFILE 104B 103;<br />
<strong>BC</strong> Geological Survey, 2011), Galore (MINFILE<br />
104G 090) and Schaft Creek (MINFILE 104G 015) deposits<br />
<strong>to</strong> <strong>the</strong> west and <strong>the</strong> Kemess deposits (MINFILE<br />
094E 094) <strong>to</strong> <strong>the</strong> e<strong>as</strong>t. The De<strong>as</strong>e Lake study area is located<br />
at <strong>the</strong> apex of this arcuate belt, immediately north of <strong>the</strong> Red<br />
Chris Cu-Au porphyry deposit (MINFILE 104H 005) and<br />
also adjacent <strong>to</strong> <strong>the</strong> Hotailuh batholith, a large composite<br />
intrusive complex similar in age <strong>to</strong> <strong>the</strong> intrusions hosting<br />
porphyry mineralization at <strong>the</strong> Galore and Schaft Creek<br />
deposits.<br />
Numerous small plu<strong>to</strong>ns project through mainly Late Tri<strong>as</strong>sic<br />
arc stratigraphy in <strong>the</strong> De<strong>as</strong>e Lake area. Nei<strong>the</strong>r <strong>the</strong><br />
plu<strong>to</strong>ns nor <strong>the</strong> volcanosedimentary rocks have undergone<br />
a thorough regional geological re-evaluation for mineral<br />
potential since being mapped by <strong>the</strong> Geological Survey of<br />
Canada in <strong>the</strong> late 1970s and early 1980s (Gabrielse, 1980;<br />
Anderson, 1983, 1984). Modern detailed bedrock mapping<br />
is essential <strong>to</strong> characterize and refine time-space relationships<br />
of this arc segment around De<strong>as</strong>e Lake <strong>to</strong> <strong>as</strong>sess significance<br />
for mineralization, comparison with mineralized<br />
arc segments elsewhere and integration with <strong>the</strong> airborne<br />
magnetic program. In addition, <strong>the</strong> project will provide<br />
supplementary datab<strong>as</strong>es including rock geochemical cl<strong>as</strong>sification,<br />
magnetic susceptibility and geochronology.<br />
These data will integrate with Regional Geochemical Survey<br />
(RGS) data and airborne geophysics <strong>to</strong> ensure costeffective<br />
exploration targeting porphyry-style mineralization.<br />
In 2011, <strong>the</strong> <strong>BC</strong> Geological Survey completed four fieldb<strong>as</strong>ed<br />
geology studies located within a 70 km radius of <strong>the</strong><br />
De<strong>as</strong>e Lake community (Figure 1b). These standalone<br />
components collectively make up <strong>the</strong> De<strong>as</strong>e Lake <strong>Geoscience</strong><br />
Project, and <strong>the</strong>y consist of<br />
De<strong>as</strong>e Lake regional bedrock mapping;<br />
Hotailuh batholith: intrusive ph<strong>as</strong>es, ages and related<br />
mineralization;<br />
<strong>Geoscience</strong> <strong>BC</strong> Report 2012-1 5
Snow Peak plu<strong>to</strong>n: age, emplacement and molybdenum<br />
mineralization; and<br />
Tsaybahe group: lithological and geochemical characterization<br />
of Middle Tri<strong>as</strong>sic volcanism.<br />
Regional Geology and Previous Work<br />
Kerr (1925; 1948) carried out <strong>the</strong> earliest geological bedrock<br />
mapping surveys in <strong>the</strong> area around De<strong>as</strong>e Lake. Systematic<br />
regional mapping by <strong>the</strong> Geological Survey of Canada<br />
began in 1956 with Operation Stikine, a reconnaissance<br />
mapping program covering four adjoining 1:250 000 map<br />
are<strong>as</strong> in northwestern <strong>BC</strong> (Geological Survey of Canada,<br />
1957). Mapping and <strong>the</strong>matic studies conducted between<br />
1956 and 1991 in <strong>the</strong> NTS 104I and 104J map are<strong>as</strong> are<br />
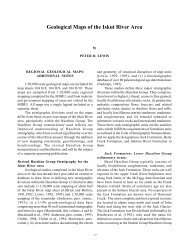
summarized by Gabrielse (1998). Most relevant <strong>to</strong> <strong>the</strong> current<br />
study is Anderson’s work on <strong>the</strong> Hotailuh and Stikine<br />
batholiths (1983; 1984) and, more recently, 1:250 000 scale<br />
geological mapping of <strong>the</strong> Iskut River area (Anderson,<br />
1993). P. Read of Geotex Consultants Ltd. (Vancouver,<br />
British Columbia) h<strong>as</strong> conducted detailed mapping for <strong>the</strong><br />
Geological Survey of Canada in <strong>the</strong> Stikine Canyon area<br />
(Read, 1983, 1984; Read and Psutka, 1990). Regional mapping<br />
projects by <strong>the</strong> <strong>BC</strong> Geological Survey include work <strong>to</strong><br />
<strong>the</strong> south by Ash et al. (1997) around Ta<strong>to</strong>gga Lake and far<strong>the</strong>r<br />
west by Brown et al. (1996) in <strong>the</strong> Stikine River area.<br />
The De<strong>as</strong>e Lake map area straddles <strong>the</strong> early Middle Jur<strong>as</strong>sic<br />
thrust-imbricated boundary between <strong>the</strong> Cache Creek<br />
and Stikine terranes (Figure 2). At this latitude, <strong>the</strong> Stikine<br />
terrane comprises three overlapping island arc successions,<br />
which span 200 m.y. from Devonian <strong>to</strong> Middle Jur<strong>as</strong>sic and<br />
include Stikine, Stuhini and Hazel<strong>to</strong>n volcanic and sedimentary<br />
rocks. Their genetically related plu<strong>to</strong>nic suites include<br />
<strong>the</strong> Devono-Carboniferous Forrest Kerr, <strong>the</strong> Late Tri<strong>as</strong>sic<br />
Stikine and Copper Mountain, <strong>the</strong> Early Jur<strong>as</strong>sic<br />
Tex<strong>as</strong> Creek and <strong>the</strong> Middle Jur<strong>as</strong>sic Three Sisters (Anderson,<br />
1983, 1993; Brown et al., 1996; Logan et al., 2000).<br />
These plu<strong>to</strong>nic suites are <strong>the</strong> roots of cospatial arc rocks exposed<br />
along <strong>the</strong> Stikine arch, an e<strong>as</strong>t-trending area of uplifted<br />
Jur<strong>as</strong>sic and older rocks that bound <strong>the</strong> nor<strong>the</strong>rn margin<br />
of <strong>the</strong> Bowser B<strong>as</strong>in. Long-lived arc magmatism in <strong>the</strong><br />
Stikine arch h<strong>as</strong> produced diverse styles of magmatism<br />
(calcalkaline and alkaline) and large Cu–Au–Ag±Mo mineral<br />
deposits <strong>as</strong>sociated with some intrusive centres (i.e.,<br />
KSM, Snip [MINFILE 104B 004], Galore Creek, Schaft<br />
Creek and Kemess).<br />
The Cache Creek terrane, lying north of <strong>the</strong> King Salmon<br />
fault (KSF), consists of oceanic b<strong>as</strong>alt, silicicl<strong>as</strong>tic rocks<br />
and limes<strong>to</strong>ne of Carboniferous <strong>to</strong> Early Jur<strong>as</strong>sic age. The<br />
terrane for <strong>the</strong> most part is overlain by Jur<strong>as</strong>sic cl<strong>as</strong>tic sediments<br />
of <strong>the</strong> Inklin Formation comprising <strong>the</strong> sou<strong>the</strong><strong>as</strong>tern<br />
extent of <strong>the</strong> Whitehorse Trough.<br />
Figure 1. Location of <strong>the</strong> QUEST-Northwest mapping: British Columbia<br />
Geological Survey De<strong>as</strong>e Lake <strong>Geoscience</strong> Project on <strong>the</strong><br />
a) <strong>BC</strong> terrane map (after M<strong>as</strong>sey et al., 2005); b) detailed view<br />
straddles NTS 104J and 104I 1:250 000 map are<strong>as</strong> at De<strong>as</strong>e Lake,<br />
showing <strong>the</strong> locations of <strong>the</strong> bedrock mapping study (NTS<br />
104J/08, /07E), <strong>the</strong> Hotailuh batholith study, <strong>the</strong> Snow Peak plu<strong>to</strong>n<br />
study and <strong>the</strong> Tri<strong>as</strong>sic arc geochemistry study.<br />
6 <strong>Geoscience</strong> <strong>BC</strong> Summary of Activities 2011
Project Objectives and Results <strong>to</strong> Date<br />
The De<strong>as</strong>e Lake <strong>Geoscience</strong> Project consists of a systematic<br />
bedrock mapping study and three integrated <strong>to</strong>pical<br />
studies. Toge<strong>the</strong>r <strong>the</strong>y cover regional <strong>as</strong>pects of stratigraphy,<br />
magmatic evolution and metallogeny along part of <strong>the</strong><br />
Stikine arch and also within <strong>the</strong> broader footprint of <strong>the</strong><br />
QUEST-Northwest airborne geophysical survey (Simpson,<br />
2012).<br />
De<strong>as</strong>e Lake Regional Bedrock Mapping<br />
The main component, systematic regional bedrock mapping<br />
of <strong>the</strong> NTS 104J/08 and <strong>the</strong> e<strong>as</strong>t half NTS 104J/07 map<br />
are<strong>as</strong> w<strong>as</strong> delivered with <strong>the</strong> following objectives:<br />
publishing 1:50 000 scale geological maps for 104J/08<br />
and <strong>the</strong> e<strong>as</strong>t half of NTS 104J/07, a cumulative area of<br />
1275 km 2 , located immediately west of De<strong>as</strong>e Lake;<br />
determining U-Pb and Ar-Ar ages for layered and intrusive<br />
rock units <strong>as</strong> well <strong>as</strong> mineralized rocks in order <strong>to</strong><br />
constrain magmatic and mineralizing events;<br />
establishing <strong>the</strong> geological controls for mineralized<br />
rocks, <strong>the</strong>n comparing <strong>the</strong>se regionally <strong>to</strong> metallogenic<br />
epochs between 220 and 190 Ma (i.e., Late Tri<strong>as</strong>sic<br />
[Cu–Mo±Au], Late Tri<strong>as</strong>sic <strong>to</strong> Early Jur<strong>as</strong>sic [Cu-Au-<br />
Ag] and Cretaceous <strong>to</strong> Tertiary [Cu-Mo-W]), related <strong>to</strong><br />
alkaline and calcalkaline plu<strong>to</strong>nism known elsewhere in<br />
<strong>the</strong> Stikine terrane;<br />
<br />
determining <strong>the</strong> his<strong>to</strong>ry of magmatism, tec<strong>to</strong>nism and<br />
mineralization along <strong>the</strong> De<strong>as</strong>e Lake transect for comparison<br />
<strong>to</strong> o<strong>the</strong>r parts of <strong>the</strong> Stikine magmatic arc<br />
system.<br />
Results<br />
Regional-scale geological mapping w<strong>as</strong> completed over a<br />
1275 km 2 area extending southwest from <strong>the</strong> community of<br />
De<strong>as</strong>e Lake <strong>to</strong> <strong>the</strong> Tuya River during <strong>the</strong> 2011 summer field<br />
se<strong>as</strong>on. The map area includes NTS 104J/08 and <strong>the</strong> e<strong>as</strong>t<br />
half of NTS 104J/07 (Figure 3). Traverses were helicopter<br />
supported.<br />
The map is underlain mainly by Paleozoic <strong>to</strong> Late Tri<strong>as</strong>sic<br />
sedimentary, volcanic and plu<strong>to</strong>nic arc rocks of <strong>the</strong> Stikine<br />
terrane. In <strong>the</strong> nor<strong>the</strong><strong>as</strong>tern part of <strong>the</strong> map, <strong>the</strong>se are thrust<br />
imbricated with similarly aged volcanic and sedimentary<br />
oceanic rocks of <strong>the</strong> Cache Creek terrane along <strong>the</strong> northdipping<br />
King Salmon fault. Early–Middle Jur<strong>as</strong>sic sedimentary<br />
rocks of <strong>the</strong> Takwahoni and Inklin formations of<br />
<strong>the</strong> Whitehorse Trough overlie <strong>the</strong> Stikine and Cache Creek<br />
terrane rocks, respectively. An equidimensional Late Cretaceous<br />
granite intrudes <strong>the</strong> Early Jur<strong>as</strong>sic Takwahoni sedimentary<br />
rocks, and columnar b<strong>as</strong>alts of <strong>the</strong> Miocene–Pliocene<br />
Tuya Formation unconformably cap some of <strong>the</strong><br />
highest peaks in <strong>the</strong> area. Preserved beneath <strong>the</strong>se young<br />
b<strong>as</strong>alts in <strong>the</strong> southwestern corner of <strong>the</strong> map are lower Ter-<br />
Figure 2. Schematic stratigraphic, plu<strong>to</strong>nic and structural relationships for Stikine and Cache<br />
Creek terrane rocks within <strong>the</strong> map area (Abbreviations: Ck, creek; Cny, canyon; Mtn, mountain).<br />
<strong>Geoscience</strong> <strong>BC</strong> Report 2012-1 7
8 <strong>Geoscience</strong> <strong>BC</strong> Summary of Activities 2011<br />
Figure 3. Generalized geology of <strong>the</strong> NTS 104J/08 and <strong>the</strong> e<strong>as</strong>t half of NTS 104J/07E map are<strong>as</strong>, including work by Ryan (1991) and Gabrielse (1998). Abbreviations: bio, biotite; brcc, breccia;<br />
congl, conglomerate; crse, coarse; hnbl, hornblende; monzn, monzonite; mudstn, muds<strong>to</strong>ne; plag, plagiocl<strong>as</strong>e; px, pyroxene; qtz, quartz; sndst, sands<strong>to</strong>ne; slstn, silts<strong>to</strong>ne; xstl, crystal.
tiary coal-bearing sediments of <strong>the</strong> Tanzilla Canyon<br />
Formation.<br />
South of <strong>the</strong> King Salmon fault, <strong>the</strong> oldest rocks in <strong>the</strong> map<br />
area are Permian limes<strong>to</strong>ne, phyllite, chert and metavolcanic<br />
rocks exposed in north- <strong>to</strong> nor<strong>the</strong><strong>as</strong>terly trending structural<br />
culminations (Figure 3). Despite generally poor exposures<br />
throughout <strong>the</strong> map area, a general stratigraphy can<br />
be recognized for <strong>the</strong> Tri<strong>as</strong>sic Stuhini Group, which in one<br />
locale (<strong>the</strong> headwaters of Itsillitu Creek) appears <strong>to</strong> unconformably<br />
overlie foliated limes<strong>to</strong>ne, chert and metavolcanic<br />
rocks of presumed late Paleozoic age. Here, <strong>the</strong> stratigraphic<br />
b<strong>as</strong>e comprises volcanicl<strong>as</strong>tic beds and coarse<br />
pyroxene brecci<strong>as</strong>. Early work on adjoining map are<strong>as</strong> <strong>to</strong><br />
<strong>the</strong> south (Read, 1983, 1984) reported Early and Middle<br />
Tri<strong>as</strong>sic paleon<strong>to</strong>logical ages from cherty sedimentary<br />
rocks and coarse pyroxene brecci<strong>as</strong> of <strong>the</strong> Tsaybahe group.<br />
However, no direct age constraints are known for <strong>the</strong> overlying<br />
pyroxene brecci<strong>as</strong> in <strong>the</strong> current study area, which are<br />
characterized by thick accumulations of crowded augitephyric<br />
b<strong>as</strong>alt brecci<strong>as</strong> and cl<strong>as</strong>tic volcanic rocks exposed at<br />
<strong>the</strong> <strong>to</strong>ps of <strong>the</strong> ridges in <strong>the</strong> sou<strong>the</strong>rn part of <strong>the</strong> map. These<br />
correlative Tsaybahe group b<strong>as</strong>alt brecci<strong>as</strong> dip north below<br />
a thick pile of mixed, bedded and reworked volcanicl<strong>as</strong>tic<br />
rocks and rare b<strong>as</strong>alt flows that generally fined upward in<strong>to</strong><br />
a well-bedded siliceous section of silts<strong>to</strong>ne with Upper Tri<strong>as</strong>sic<br />
() bivalves. These are overlain by a thick package of<br />
coarse plagiocl<strong>as</strong>e-phyric andesitic b<strong>as</strong>alt flows, in turn<br />
overlain by more m<strong>as</strong>sive plagiocl<strong>as</strong>e- and pyroxene-dominated<br />
volcanicl<strong>as</strong>tic units (Stuhini) identical <strong>to</strong> <strong>the</strong> thickbedded<br />
volcanicl<strong>as</strong>tic units that overlie <strong>the</strong> Tsaybahe group<br />
b<strong>as</strong>alts. The uppermost Tri<strong>as</strong>sic volcanicl<strong>as</strong>tic and flow<br />
unit is unconformably () overlain by quartz-bearing<br />
conglomerate and sands<strong>to</strong>ne rocks of <strong>the</strong> Early Jur<strong>as</strong>sic<br />
Takwahoni Formation.<br />
North of <strong>the</strong> King Salmon fault are structurally imbricated<br />
north-dipping panels of Cache Creek rocks that comprise<br />
<strong>the</strong> King Salmon allochthon (Figures 2, 3). The structurally<br />
lowest panel consists of m<strong>as</strong>sive metab<strong>as</strong>ite, tuff and limes<strong>to</strong>ne<br />
of presumed Carboniferous–Permian age and is<br />
marked along its structural hangingwall contact by<br />
serpentinized ultramafic rocks and zones of listwanite alteration.<br />
The latter is characterized by dun- <strong>to</strong> orangewea<strong>the</strong>ring<br />
foliated zones containing various amounts of<br />
chrome-rich mica, quartz veining and often pyrite. Structurally<br />
overlying this panel and comprising <strong>the</strong> nor<strong>the</strong><strong>as</strong>tern<br />
portion of <strong>the</strong> map area are fine-grained, well-bedded<br />
and variably foliated cl<strong>as</strong>tic rocks of <strong>the</strong> Inklin Formation.<br />
Within this panel and west of <strong>the</strong> south end of De<strong>as</strong>e Lake<br />
are a large pyroxenite body and three west-trending large<br />
outcrops of recrystallized m<strong>as</strong>sive limes<strong>to</strong>ne correlated<br />
with <strong>the</strong> Upper Tri<strong>as</strong>sic Sinwa limes<strong>to</strong>ne (Gabrielse, 1998).<br />
Two stages of deformation affect rocks within <strong>the</strong> map: <strong>the</strong><br />
earlier is characterized by northwest-trending, southwestverging<br />
folds and faults <strong>as</strong>sociated with <strong>the</strong> King Salmon<br />
fault. This deformation is related <strong>to</strong> <strong>the</strong> early Middle Jur<strong>as</strong>sic<br />
obduction of <strong>the</strong> Cache Creek terrane on<strong>to</strong> <strong>the</strong> Stikine<br />
terrane. The later deformational event is characterized by<br />
north-trending structures that gently warp <strong>the</strong> earlier northwest-trending<br />
structures and fold rocks <strong>as</strong> young <strong>as</strong><br />
Tertiary (Ryan, 1991).<br />
Metallic mineral occurrences within <strong>the</strong> map area include<br />
two alkalic porphyry Cu-Au prospects located south of <strong>the</strong><br />
Tanzilla River in m<strong>as</strong>sive volcanicl<strong>as</strong>tic rocks of <strong>the</strong><br />
Stuhini Group, a porphyry Mo-Cu-W prospect (Mack;<br />
MINFILE 104J 014) within <strong>the</strong> Cretaceous Snow Peak<br />
plu<strong>to</strong>n that intruded Takwahoni sediments near <strong>the</strong> headwaters<br />
of Sixteen Mile Creek, and a Ag–Pb–Zn±Au quartz<br />
vein showing (Mac; MINFILE 104J 064) <strong>as</strong>sociated with<br />
<strong>Geoscience</strong> <strong>BC</strong> Report 2012-1 9
dikes cutting Takwahoni sedimentary rocks west of <strong>the</strong><br />
Mack prospect. The Hu alkalic porphyry Cu-Au prospect<br />
(MINFILE 104J 013) is <strong>as</strong>sociated with an e<strong>as</strong>t-trending<br />
multiph<strong>as</strong>e syenite-monzonite intrusion adjacent <strong>to</strong> <strong>the</strong><br />
Hleuy Lake Hydroelectric Power Station and <strong>the</strong> Tan showing<br />
(MINFILE 104J 036) is related <strong>to</strong> a sou<strong>the</strong><strong>as</strong>t-trending<br />
composite pyroxenite-amphibolite-monzonite body. Geochemical<br />
and <strong>as</strong>say samples (n = 15) characterizing b<strong>as</strong>eand<br />
precious-metal mineralization have been collected and<br />
submitted for analyses at Acme Labs in Vancouver, British<br />
Columbia and will be reported in <strong>the</strong> <strong>BC</strong> Geological<br />
Survey’s Geological Fieldwork 2011 <strong>volume</strong> (Logan et al.,<br />
2012).<br />
Along Tuya Creek, at <strong>the</strong> southwestern margin of <strong>the</strong> map<br />
(Figure 3), between 5 <strong>to</strong> 30 m of high volatile B bituminous<br />
coal occurs within <strong>the</strong> Lower Tertiary, Paleocene sediments<br />
of <strong>the</strong> Tuya River coal b<strong>as</strong>in (Ryan, 1991). This area w<strong>as</strong><br />
not visited during <strong>the</strong> current mapping program.<br />
In addition <strong>to</strong> collecting lithological descriptions, structure<br />
data and geochemical and <strong>as</strong>say rock samples, magnetic<br />
susceptibilities were routinely collected for stratified and<br />
plu<strong>to</strong>nic rocks from <strong>the</strong> map are<strong>as</strong>. This data provides rocktype–specific<br />
characterization and ground-truthing capabilities<br />
<strong>to</strong> interpret <strong>the</strong> airborne magnetic survey results.<br />
Iso<strong>to</strong>pic age dating is currently underway <strong>to</strong> provide constraints<br />
on volcanic, plu<strong>to</strong>nic and mineralizing events.<br />
Eleven samples have been submitted for U-Pb, zircon crystallization<br />
age determinations by l<strong>as</strong>er ablation inductively<br />
coupled pl<strong>as</strong>ma–m<strong>as</strong>s spectrometry (ICP-MS) and eight<br />
samples for Ar-Ar step heating on hornblende and biotite<br />
separates. These data will be reported on <strong>as</strong> results are received.<br />
In addition, two detrital zircon samples will be analyzed<br />
<strong>to</strong> complement o<strong>the</strong>r samples of <strong>the</strong> Tsaybahe group<br />
collected in <strong>the</strong> Tsaybahe study (Iverson and Mahoney,<br />
2012).<br />
Detrital zircon samples were collected from mediumgrained<br />
sands<strong>to</strong>ne in a Stuhini volcanicl<strong>as</strong>tic member, and<br />
from <strong>the</strong> b<strong>as</strong>al section of <strong>the</strong> Takwahoni Formation. They<br />
will be used <strong>to</strong> evaluate <strong>the</strong> uplift and evolution of sediment<br />
source regions and complement <strong>the</strong> stratigraphy determined<br />
from field mapping. These results compared <strong>to</strong> detrital<br />
zircons recovered from <strong>the</strong> Tsaybahe study (Iverson and<br />
Mahoney, 2012) will test if <strong>the</strong> Stuhini Group is significantly<br />
younger than rocks <strong>as</strong>signed <strong>to</strong> <strong>the</strong> Tsaybahe group.<br />
Hotailuh Batholith: Intrusive Ph<strong>as</strong>es, Ages and<br />
Related Mineralization<br />
The Hotailuh batholith study, led by B. van Straaten, focuses<br />
on <strong>the</strong> magmatic evolution and mineral potential of<br />
<strong>the</strong> Tri<strong>as</strong>sic–Jur<strong>as</strong>sic Hotailuh batholith and its surrounding<br />
volcanosedimentary rocks. The Hotailuh batholith is<br />
well exposed in a 2275 km 2 area sou<strong>the</strong><strong>as</strong>t of De<strong>as</strong>e Lake<br />
and mainly e<strong>as</strong>t of Highway 37. The batholith coincides<br />
with approximately one third of <strong>the</strong> QUEST-Northwest<br />
Block 1 airborne geophysical survey (Simpson, 2012) and<br />
contains a wide variety of intrusion-related mineral occurrences<br />
including <strong>the</strong> Gnat P<strong>as</strong>s porphyry Cu developed<br />
prospect (Figure 1). The objectives of this project include<br />
fur<strong>the</strong>r developing <strong>the</strong> temporal magmatic and geochemical<br />
evolution of <strong>the</strong> Hotailuh batholith and refining<br />
<strong>the</strong> geochronology (U-Pb) of magmatic events and<br />
<strong>the</strong> geochemistry of plu<strong>to</strong>ns;<br />
establishing <strong>the</strong> formation and preservation potential<br />
for magmatic-hydro<strong>the</strong>rmal mineral deposits within <strong>the</strong><br />
batholith;<br />
reconstructing <strong>the</strong> pressure, temperature, time and deformation<br />
(P-T-t-D) his<strong>to</strong>ry of plu<strong>to</strong>nic suites using<br />
geo<strong>the</strong>rmobarometry, geochronology and <strong>the</strong>rmochronology;<br />
and<br />
building a metallogenic framework that relates mineralizing<br />
and magmatic events.<br />
Results<br />
Nine weeks of fieldwork by two people covered an area of<br />
30 × 40 km, focused on mapping within <strong>the</strong> mineralized<br />
Gnat P<strong>as</strong>s corridor and seven smaller are<strong>as</strong> (Figure 1) chosen<br />
for <strong>the</strong>ir <strong>as</strong>sociation with mineral occurrences and suitability<br />
for understanding <strong>the</strong> internal geology of <strong>the</strong><br />
batholith. The Hotailuh batholith comprises three distinct<br />
plu<strong>to</strong>nic suites (Anderson, 1983; Anderson and Bevier,<br />
1990): <strong>the</strong> Late Tri<strong>as</strong>sic Stikine (Cake Hill, Beggerlay<br />
Creek and Gnat Lake plu<strong>to</strong>ns), <strong>the</strong> Early Jur<strong>as</strong>sic Tex<strong>as</strong><br />
Creek (McBride River plu<strong>to</strong>n) and <strong>the</strong> Middle Jur<strong>as</strong>sic<br />
Three Sisters (Three Sisters plu<strong>to</strong>n; Figure 2, Table 1).<br />
Each plu<strong>to</strong>nic suite generally consists of several individual<br />
plu<strong>to</strong>ns and/or plu<strong>to</strong>nic ph<strong>as</strong>es. The crosscutting relationships<br />
between plu<strong>to</strong>nic suites established by Anderson<br />
Table 1. Ages of plu<strong>to</strong>nic suites and composition of<br />
plu<strong>to</strong>ns comprising <strong>the</strong> Hotailuh batholith.<br />
Age Plu<strong>to</strong>n Lithology<br />
Middle<br />
Jur<strong>as</strong>sic<br />
Three Sisters,<br />
pot<strong>as</strong>sic ph<strong>as</strong>e<br />
Biotite quartz syenite,<br />
granite<br />
Three Sisters,<br />
central ph<strong>as</strong>e<br />
Biotite quartz<br />
monzonite, quartz<br />
monzodiorite<br />
Early<br />
Jur<strong>as</strong>sic<br />
Late<br />
Tri<strong>as</strong>sic<br />
Three Sisters, mafic<br />
ph<strong>as</strong>e<br />
Three Sisters, finegrained<br />
ph<strong>as</strong>e<br />
McBride River<br />
Beggerlay Creek<br />
Cake Hill<br />
Gnat Lake<br />
Acicular hornblende<br />
diorite<br />
Hornblende diorite<br />
Hornblende<br />
granodiorite<br />
Hornblende-rich<br />
diorite/gabbro<br />
Hornblende quartz<br />
monzodiorite, quartz<br />
monzonite<br />
Plagiocl<strong>as</strong>e-bearing<br />
ultramafic<br />
10 <strong>Geoscience</strong> <strong>BC</strong> Summary of Activities 2011
(1983) were mostly confirmed in this study; however, a notable<br />
exception is <strong>the</strong> Gnat Lake ultramafite, which is crosscut<br />
by Cake Hill dikes at one location (van Straaten, 2012).<br />
Contact relationships between <strong>the</strong> Late Tri<strong>as</strong>sic ()<br />
Beggerlay Creek and Cake Hill plu<strong>to</strong>ns w<strong>as</strong> not observed,<br />
nor w<strong>as</strong> <strong>the</strong> relationship between <strong>the</strong> apparently oldest finegrained<br />
mafic ph<strong>as</strong>e of <strong>the</strong> Three Sisters plu<strong>to</strong>n with any<br />
younger ph<strong>as</strong>es, due <strong>to</strong> <strong>the</strong> lack of exposed contacts. However,<br />
several external contact relationships were (re)defined.<br />
For example, <strong>the</strong> plu<strong>to</strong>nic rocks that contact metamorphosed<br />
Toarcian sediments were previously <strong>as</strong>signed<br />
<strong>to</strong> <strong>the</strong> Late Tri<strong>as</strong>sic Cake Hill, but <strong>the</strong>y are more likely related<br />
<strong>to</strong> <strong>the</strong> McBride River plu<strong>to</strong>n. Also, <strong>the</strong> predominantly<br />
mafic Beggerlay Creek plu<strong>to</strong>n w<strong>as</strong> shown <strong>to</strong> comprise several<br />
ultramafic domains that resemble <strong>the</strong> Gnat Lake<br />
ultramafite. Lithogeochemistry and geochronology is<br />
underway <strong>to</strong> test this suggestive genetic link between <strong>the</strong><br />
Beggerlay Creek and Gnat Lake bodies.<br />
Results of <strong>the</strong> field program include 331 field stations and<br />
134 samples collected for follow-up study and analysis.<br />
Five mineral showings were visited (Gnat P<strong>as</strong>s [MINFILE<br />
104I 001], <strong>BC</strong>R [MINFILE 104I 068], Pat [MINFILE<br />
104I 043], Mat [MINFILE 104I 034] and Dalvenie<br />
[MINFILE 104I 003]). Fieldwork also resulted in <strong>the</strong> discovery<br />
of seven new mineralized and altered zones within<br />
<strong>the</strong> Hotailuh batholith. Mineralized samples were collected<br />
and submitted for b<strong>as</strong>e- and precious-metal analyses; results<br />
are pending. Four of <strong>the</strong> new zones are hosted in Late<br />
Tri<strong>as</strong>sic rocks and include 1) a 10 cm wide vein of m<strong>as</strong>sive<br />
pyrite with trace copper in <strong>the</strong> Cake Hill plu<strong>to</strong>n close <strong>to</strong><br />
Highway 37; 2) metre-scale zones of disseminated pyrite<br />
and bornite in <strong>the</strong> Cake Hill plu<strong>to</strong>n 3 km nor<strong>the</strong><strong>as</strong>t of <strong>the</strong><br />
Mat showing; 3) several percent disseminated pyrite in narrow<br />
zones within <strong>the</strong> Gnat Lakes ultramafite; and 4) pyritic<br />
fault zones cutting a large Stuhini inclusion within <strong>the</strong> Cake<br />
Hill plu<strong>to</strong>n, approximately 9 km north-northwest of <strong>the</strong><br />
McBride–Stikine river confluence. The remaining three<br />
zones are hosted in Middle Jur<strong>as</strong>sic intrusive rocks and include<br />
quartz+pyrite±copper sulphide veins located 1) approximately<br />
5 km southwest of <strong>the</strong> Pat showing, 2) on <strong>the</strong><br />
nor<strong>the</strong>rn edge of <strong>the</strong> Three Sisters fine-grained body, and 3)<br />
approximately 3 km north of <strong>the</strong> Three Sisters fine-grained<br />
body (van Straaten, 2012).<br />
The presence of mineralization in both <strong>the</strong> Late Tri<strong>as</strong>sic<br />
(Cake Hill) and Middle Jur<strong>as</strong>sic (Three Sisters) rocks is<br />
suggestive of at le<strong>as</strong>t two mineralizing events within <strong>the</strong><br />
Hotailuh batholith. B<strong>as</strong>ed on current observation within <strong>the</strong><br />
batholith, <strong>the</strong> ca. 171 Ma Three Sisters intrusions apparently<br />
host more mineral showings than <strong>the</strong> ca. 221 Ma Cake<br />
Hill intrusions.<br />
The Cake Hill plu<strong>to</strong>n is overlain nonconformably by Upper<br />
Tri<strong>as</strong>sic and younger rocks (Anderson, 1983; Gabrielse,<br />
1998), suggesting uplift and erosion following its emplacement<br />
but prior <strong>to</strong> <strong>the</strong> end of Late Tri<strong>as</strong>sic arc magmatism<br />
and later intrusion by Middle Jur<strong>as</strong>sic Three Sisters plu<strong>to</strong>nism.<br />
The determination of relative plu<strong>to</strong>n emplacement<br />
depths and subsequent exhumation levels have important<br />
implications for <strong>the</strong> formation and preservation potential of<br />
porphyry and epi<strong>the</strong>rmal deposits. Hornblende geo<strong>the</strong>rmobarometry<br />
and zircon <strong>the</strong>rmochronology on a select suite of<br />
plu<strong>to</strong>nic rocks <strong>as</strong>sociated with mineral prospects will be<br />
used <strong>to</strong> <strong>as</strong>sess depth of emplacement and levels of erosion.<br />
Snow Peak Plu<strong>to</strong>n: Age, Emplacement and<br />
Mineralization<br />
Late Cretaceous Mo and Cu-Mo mineralization is a wellestablished<br />
Cordilleran-wide metallogenic event. At Snow<br />
Peak, sedimentary rocks of <strong>the</strong> Jur<strong>as</strong>sic Takwahoni Formation<br />
are intruded by pre-, syn- and postkinematic porphyry<br />
dikes and a circular Cretaceous grani<strong>to</strong>id. Porphyry Cu-Mo<br />
mineralization is present in <strong>the</strong> Cretaceous Snow Peak<br />
plu<strong>to</strong>n and evaluating <strong>the</strong> magma evolution, emplacement<br />
depth and controls on mineralization w<strong>as</strong> <strong>the</strong> focus of<br />
D. Moynihan’s fieldwork (Moynihan, 2012). The objectives<br />
of his research include<br />
establishing <strong>the</strong> age relationships between <strong>the</strong> Cretaceous<br />
Snow Peak plu<strong>to</strong>n and spatially <strong>as</strong>sociated minor<br />
intrusions; and<br />
characterizing <strong>the</strong> molybdenite mineralization <strong>as</strong>sociated<br />
with Cretaceous magmatism at <strong>the</strong> Snow Peak (i.e.,<br />
Mack) prospect.<br />
Results<br />
The Snow Peak plu<strong>to</strong>n is a steep-sided 15 km 2 equidimensional<br />
body that w<strong>as</strong> intruded in<strong>to</strong> Early Jur<strong>as</strong>sic rocks of<br />
<strong>the</strong> Takwahoni Formation in <strong>the</strong> Late Cretaceous. The intrusion<br />
is a biotite-hornblende monzogranite <strong>to</strong> quartz<br />
monzonite with equigranular and locally K-feldspar–phyric<br />
textures. Molybdenite mineralization is developed along<br />
west-northwest-trending brittle fracture planes in <strong>the</strong> central<br />
part of <strong>the</strong> plu<strong>to</strong>n.<br />
The Takwahoni Formation adjacent <strong>to</strong> <strong>the</strong> Snow Peak<br />
plu<strong>to</strong>n hosts a swarm of dikes and sills, many of which are<br />
hornblende-bearing plagiocl<strong>as</strong>e porphyry with distinctive<br />
round quartz phenocrysts. Field relations indicate that <strong>the</strong><br />
dike swarm is crosscut by <strong>the</strong> plu<strong>to</strong>n, suggesting dikes may<br />
have a separate origin unrelated <strong>to</strong> <strong>the</strong> plu<strong>to</strong>n and its Mo-Cu<br />
mineralization. The U-Pb and Re-Os geochronology is currently<br />
being undertaken <strong>to</strong> establish absolute ages of <strong>the</strong><br />
plu<strong>to</strong>n, <strong>the</strong> dike swarm and Mo mineralization.<br />
Intrusion of <strong>the</strong> Snow Peak plu<strong>to</strong>n led <strong>to</strong> <strong>the</strong> formation of a<br />
contact metamorphic aureole in surrounding rocks of <strong>the</strong><br />
Takwahoni Formation. The aureole is manifested in a rusty<br />
zone of hornfelsed rock, often with a purple tint. Contact<br />
metamorphic biotite is developed over a broad area, and adjacent<br />
<strong>to</strong> <strong>the</strong> contact, met<strong>as</strong>ilts<strong>to</strong>ne and muds<strong>to</strong>ne have been<br />
<strong>Geoscience</strong> <strong>BC</strong> Report 2012-1 11
converted <strong>to</strong> spotted hornfels with abundant cordierite<br />
porphyrobl<strong>as</strong>ts. Cordierite-bearing <strong>as</strong>semblages indicate<br />
low-pressure metamorphism, and petrological work is in<br />
progress <strong>to</strong> provide quantitative constraints on <strong>the</strong> emplacement<br />
depth.<br />
Depositional Setting and Geochemical<br />
Evolution of Tsaybahe and Stuhini Volcanism<br />
A final study undertaken by O. Iverson will compare lithostratigraphic<br />
features and geochemical data collected from<br />
several reference stratigraphic sections through <strong>the</strong> Middle<br />
Tri<strong>as</strong>sic Tsaybahe group and <strong>the</strong> Late Tri<strong>as</strong>sic Stuhini<br />
Group. This research aims <strong>to</strong> test <strong>the</strong> consanguinity of <strong>the</strong>se<br />
superposed stratigraphic successions, potentially providing<br />
insight on earliest deposition and evolution of <strong>the</strong> Tri<strong>as</strong>sic<br />
arc magmatism in <strong>the</strong> Stikine arch.<br />
In <strong>the</strong> vicinity of <strong>the</strong> Stikine Canyon, <strong>the</strong> Tsaybahe group<br />
(Read, 1984; Read and Psutka, 1990) w<strong>as</strong> named informally<br />
for sedimentary and volcanic rocks characterized by<br />
abundant coarse pyroxene-phyric brecci<strong>as</strong> and Early and<br />
Middle Tri<strong>as</strong>sic fossils. They distinguished it from <strong>the</strong><br />
Stuhini Group, which <strong>the</strong>y characterized <strong>as</strong> being primarily<br />
sedimentary and Late Tri<strong>as</strong>sic in age. Subsequent workers<br />
(Gabrielse, 1998; Evenchick and Thorkelson, 2005) could<br />
not distinguish <strong>the</strong> volcanic and sedimentary rocks of <strong>the</strong><br />
Tsaybahe group from those of <strong>the</strong> Stuhini Group on a regional<br />
b<strong>as</strong>is and <strong>the</strong>refore consigned all Tri<strong>as</strong>sic units <strong>to</strong> <strong>the</strong><br />
Stuhini Group.<br />
Iverson collected rock samples from both stratigraphic<br />
packages <strong>as</strong> part of a B.Sc. <strong>the</strong>sis supervised by Mahoney at<br />
<strong>the</strong> University of Wisconsin. The objectives of her research<br />
include<br />
comparing lithogeochemical features of Tsaybahe and<br />
Stuhini group volcanic rocks; and<br />
proposing a model for deposition of <strong>the</strong> Tsaybahe group<br />
and its relationship <strong>to</strong> <strong>the</strong> Stuhini Group.<br />
Results<br />
Lithogeochemical samples of <strong>the</strong> Tsaybahe group (n = 22,<br />
primarily clinopyroxene-phyric b<strong>as</strong>alt), <strong>the</strong> Stuhini Group<br />
(mixed pyroxene-phyric, plagiocl<strong>as</strong>e-phyric, alkalic latite,<br />
n = 17) and <strong>the</strong> Hazel<strong>to</strong>n Group (plagiocl<strong>as</strong>e-phyric andesite,<br />
n = 1) volcanic rocks were collected during <strong>the</strong> course<br />
of <strong>the</strong> mapping following <strong>the</strong> unit designations of Read and<br />
Psutka (1990), Gabrielse (1998) and this study.<br />
Detrital zircon samples were collected from fine-grained<br />
sediments located structurally and stratigraphically below<br />
<strong>the</strong> coarse clinopyroxene-phyric brecci<strong>as</strong> of <strong>the</strong> Tsaybahe<br />
group at two locations: 5 km e<strong>as</strong>t of Gnat P<strong>as</strong>s and 2 km e<strong>as</strong>t<br />
of Tsenaglode Lake. The former sample w<strong>as</strong> collected from<br />
a quartz-bearing tuffaceous horizon recognized within a<br />
well-bedded, 800 m thick section of dark silts<strong>to</strong>ne, sands<strong>to</strong>ne<br />
and lesser conglomerate that underlies <strong>the</strong> volcanic<br />
rocks. E<strong>as</strong>t of Tsenaglode Lake, similar fine-grained<br />
silts<strong>to</strong>ne and sands<strong>to</strong>ne underlie a 200 m thick pile of coarse<br />
pyroxene-phyric brecci<strong>as</strong> but here <strong>the</strong> contact is intruded<br />
and <strong>the</strong> sediments are contact metamorphosed by Middle<br />
Jur<strong>as</strong>sic () monzonite.<br />
Chemical analyses of <strong>the</strong> volcanic samples and heavy mineral<br />
separation for detrital zircon studies of interlayered<br />
sedimentary horizons are currently underway at <strong>the</strong> University<br />
of Wisconsin. The results of <strong>the</strong>se studies <strong>to</strong>ge<strong>the</strong>r<br />
with a stratigraphy and environment of deposition<br />
constitute Iverson’s <strong>the</strong>sis study (Iverson and Mahoney,<br />
2012).<br />
Conclusions<br />
The <strong>BC</strong> Geological Survey De<strong>as</strong>e Lake <strong>Geoscience</strong> Project<br />
is part of <strong>the</strong> new QUEST-Northwest project initiated by<br />
<strong>Geoscience</strong> <strong>BC</strong>. The program consists of four field-b<strong>as</strong>ed<br />
integrated research projects designed <strong>to</strong> investigate <strong>the</strong><br />
stratigraphy, magmatic evolution and metallogeny along<br />
<strong>the</strong> Stikine arch in <strong>the</strong> vicinity of De<strong>as</strong>e Lake. The project<br />
w<strong>as</strong> initiated in <strong>the</strong> summer of 2011 and results of <strong>the</strong> mapping<br />
project will be rele<strong>as</strong>ed <strong>as</strong> a <strong>Geoscience</strong> <strong>BC</strong> Report<br />
and a <strong>BC</strong> Geological Survey open <strong>file</strong>. Preliminary accounts<br />
of <strong>the</strong> integrated research projects will also be published<br />
in <strong>BC</strong> Geological Survey’s Geological Fieldwork<br />
2011 <strong>volume</strong>.<br />
Acknowledgments<br />
The authors acknowledge contributions from many people<br />
regarding various <strong>as</strong>pects of this study. Discussions with<br />
M. Mihalynuk and G. Nixon of <strong>the</strong> <strong>BC</strong> Geological Survey<br />
and B. Anderson of <strong>the</strong> Geological Survey of Canada were<br />
important at <strong>the</strong> inception stage and ongoing ph<strong>as</strong>es of <strong>the</strong><br />
study and are much appreciated. Capable and enthusi<strong>as</strong>tic<br />
<strong>as</strong>sistance throughout <strong>the</strong> 2011 field se<strong>as</strong>on w<strong>as</strong> provided<br />
by T. McCarron, C. Young and M. Hogg. The co-operation<br />
and free discussion of geological ide<strong>as</strong> with various mineral<br />
exploration companies made this study possible from<br />
its earliest stage. Safe and courteous flying by Pacific<br />
Northwest Helicopters in De<strong>as</strong>e Lake w<strong>as</strong> <strong>the</strong> norm and<br />
w<strong>as</strong> much appreciated.<br />
P. McIn<strong>to</strong>sh is thanked for opening her home and ranch for<br />
<strong>the</strong> team’s use during <strong>the</strong> summer mapping project and for<br />
providing two gracious hosts: cook J. Anderson and bull<br />
cook and local his<strong>to</strong>rian D. Callison.<br />
<strong>Geoscience</strong> <strong>BC</strong> provided financial support for <strong>the</strong> field and<br />
analytical programs, and salary support for B.I. van<br />
Straaten, D. Moynihan, O. Iverson and <strong>the</strong> field <strong>as</strong>sistants.<br />
12 <strong>Geoscience</strong> <strong>BC</strong> Summary of Activities 2011
References<br />
Anderson, R.G. (1983): Geology of <strong>the</strong> Hotailuh batholith and surrounding<br />
volcanic and sedimentary rocks, north-central<br />
British Columbia; Ph.D. <strong>the</strong>sis, Carle<strong>to</strong>n University, 669 p.<br />
Anderson, R.G. (1984): Late Tri<strong>as</strong>sic and Jur<strong>as</strong>sic magmatism<br />
along <strong>the</strong> Stikine arch and <strong>the</strong> geology of <strong>the</strong> Stikine<br />
batholith, north-central British Columbia; in Current Research,<br />
Part A, Geological Survey of Canada, Paper 84-1A,<br />
p. 67–73.<br />
Anderson, R.G. (1993): A Mesozoic stratigraphic and plu<strong>to</strong>nic<br />
framework for northwestern Stikinia (Iskut River area),<br />
northwestern British Columbia, Canada; in Mesozoic<br />
Paleogeography of <strong>the</strong> Western United States — Part II, G.<br />
Dunne and K. McDougall (ed.); Society of Economic Paleon<strong>to</strong>logists<br />
and Mineralogists, v. 71, p. 477–494.<br />
Anderson, R.G. and Bevier, M.L. (1990): A note on Mesozoic and<br />
Tertiary geochronometry of plu<strong>to</strong>nic suites, Iskut River<br />
area, northwestern British Columbia; in Current Research,<br />
Part A, Geological Survey of Canada, Paper 90-1E, p. 141–<br />
147.<br />
Ash, C.H., Macdonald, R.W.J., Stinson, P.K., Fr<strong>as</strong>er, T.M., Nelson,<br />
K.J., Arden, K.M. and Lefebure, D.V. (1997): Geology<br />
and mineral occurrences of <strong>the</strong> Ta<strong>to</strong>gga Lake area; <strong>BC</strong> Ministry<br />
of Energy and Mines, Open File 1997-3, URL<br />
[November<br />
2011].<br />
<strong>BC</strong> Geological Survey (2011): MINFILE <strong>BC</strong> mineral deposits datab<strong>as</strong>e;<br />
<strong>BC</strong> Ministry of Energy and Mines, URL<br />
[November 2011].<br />
Brown, D.A., Gunning, M.H. and Greig, C.J. (1996): The Stikine<br />
Project: geology of Western Telegraph Creek map area,<br />
northwestern British Columbia; <strong>BC</strong> Ministry of Energy and<br />
Mines, Bulletin 95, 176 p, URL <br />
[November 2011].<br />
Evenchick, C.A. and Thorkelson, D.J. (2005): Geology of <strong>the</strong><br />
Spatsizi River map area, north-central British Columbia;<br />
Geological Survey of Canada, Bulletin 577, 276 p.<br />
Gabrielse, H., Monger, J.W.H., Leaming, S.F., Anderson, R.G. and<br />
Tipper, H.W. (1980): Geology of De<strong>as</strong>e Lake (104J) maparea,<br />
northwestern British Columbia; Geological Survey of<br />
Canada, Open File 707.<br />
Gabrielse, H. (1998): Geology of Cry Lake and De<strong>as</strong>e Lake map<br />
are<strong>as</strong>, north-central British Columbia; Geological Survey of<br />
Canada, Bulletin 504, 147 p.<br />
Geological Survey of Canada (1957): Operation Stikine; Geological<br />
Survey of Canada, Map 9-1957.<br />
Iverson, O. and Mahoney, B. (2012): Tsaybahe Group –<br />
lithological and geochemical characterization of Middle<br />
Tri<strong>as</strong>sic volcanism; in Geological Fieldwork 2011, <strong>BC</strong> Ministry<br />
of Energy and Mines, Paper 2012-1.<br />
Jackaman, W. (2012): QUEST-Northwest Project: new regional<br />
geochemical survey and sample reanalysis data, nor<strong>the</strong>rn<br />
British Columbia (NTS 104F, G, H, I, J); in <strong>Geoscience</strong> <strong>BC</strong><br />
Summary of Activities 2011, <strong>Geoscience</strong> <strong>BC</strong>, Report 2012-<br />
1, p. 15–18.<br />
Kerr, F.A. (1926): De<strong>as</strong>e Lake area, C<strong>as</strong>siar District British Columbia;<br />
Geological Survey of Canada, Map 2104.<br />
Kerr, F.A. (1948): Lower Stikine and Iskut River are<strong>as</strong>, British Columbia;<br />
Geological Survey of Canada, Memoir 246, 94 p.<br />
Logan, J.M., Drobe, J.R. and McClelland, W.C. (2000): Geology<br />
of <strong>the</strong> Forrest Kerr-Mess Creek area, northwestern British<br />
Columbia (NTS 104B/10, 15 & 104G/2 & 7W); <strong>BC</strong> Ministry<br />
of Energy and Mines, Bulletin 104, 163 p., URL<br />
[November 2011].<br />
Logan, J.M., Moynihan, D.P. and Diakow, L.J. (2012): Geology<br />
and mineralization of <strong>the</strong> De<strong>as</strong>e Lake (104J/8) and e<strong>as</strong>t-half<br />
of <strong>the</strong> Little Tuya River (104J/7E) map sheets; in Geological<br />
Fieldwork 2011, <strong>BC</strong> Ministry of Energy and Mines, Paper<br />
2012-1.<br />
M<strong>as</strong>sey, N.W.D., MacIntyre, D.G., Desjardins, P.J. and Cooney,<br />
R.T. (2005): Digital geology map of British Columbia:<br />
whole province; <strong>BC</strong> Ministry of Energy and Mines, GeoFile<br />
2005-1, URL [November 2011].<br />
Moynihan, D.P. (2012): Age, emplacement and mineralization of<br />
<strong>the</strong> Cretaceous Snow Peak plu<strong>to</strong>n; in Geological Fieldwork<br />
2011, <strong>BC</strong> Ministry of Energy and Mines, Paper 2012-1.<br />
Read, P.B. (1983): Geology, Cl<strong>as</strong>sy Creek (10J/2E) and Stikine<br />
Canyon (104J/1W), British Columbia; Geological Survey of<br />
Canada, Open File 940.<br />
Read, P.B. (1984): Geology Kl<strong>as</strong>tline River (104G/16E), Ealue<br />
Lake (104H/13W), Cake Hill (104I/4W), and Stikine Canyon<br />
(104J/1E), British Columbia; Geological Survey of<br />
Canada, Open File 1080.<br />
Read, P.B. and Psutka, J.F. (1990): Geology of Ealue Lake e<strong>as</strong>thalf<br />
(104H/13E) and Cullivan Creek (104H/14) map are<strong>as</strong>,<br />
British Columbia; Geological Survey of Canada, Open File<br />
2241.<br />
Ryan, B. (1991): Geology and potential coal and coalbed methane<br />
resource of <strong>the</strong> Tuya River coal b<strong>as</strong>in (104J/2, 7); in Geological<br />
Fieldwork 1990, <strong>BC</strong> Ministry of Energy and Mines, Paper<br />
1991-1, p. 419–432, URL [November 2011].<br />
Simpson, K.A. (2012): QUEST-Northwest: <strong>Geoscience</strong> <strong>BC</strong>’s new<br />
minerals project in northwest British Columbia (NTS 104G,<br />
104J, parts of NTS 104A, B, F, H, I, K, 103O, P); in<br />
<strong>Geoscience</strong> <strong>BC</strong> Summary of Activities 2011, <strong>Geoscience</strong><br />
<strong>BC</strong>, Report 2012-1, p. 1–4.<br />
van Straaten, B. (2012): Geology and mineralization of <strong>the</strong><br />
Hotailuh batholith and surrounding rocks (104I/3, 4) map<br />
sheets; in Geological Fieldwork 2011, <strong>BC</strong> Ministry of Energy<br />
and Mines, Paper 2012-1.<br />
<strong>Geoscience</strong> <strong>BC</strong> Report 2012-1 13
14 <strong>Geoscience</strong> <strong>BC</strong> Summary of Activities 2011
QUEST-Northwest Project: New Regional Geochemical Survey and Sample<br />
Reanalysis Data, Northwestern British Columbia (NTS 104F, G, H, I, J, K)<br />
W. Jackaman, Noble Exploration Services Ltd., Sooke, <strong>BC</strong>, wjackaman@shaw.ca<br />
Jackaman, W. (2012): QUEST-Northwest Project: new regional geochemical survey and sample reanalysis data (NTS 104F, G, H, I, J, K),<br />
northwestern British Columbia (NTS 104F, G, H, I, J, K); in <strong>Geoscience</strong> <strong>BC</strong> Summary of Activities 2011, <strong>Geoscience</strong> <strong>BC</strong>, Report 2012-1,<br />
p. 15–18.<br />
Introduction<br />
Since 2005, <strong>Geoscience</strong> <strong>BC</strong> h<strong>as</strong><br />
supported significant enhancements<br />
<strong>to</strong> <strong>the</strong> British Columbia regional<br />
geochemical datab<strong>as</strong>e<br />
(Jackaman, 2011a). As part of <strong>the</strong><br />
QUEST-Northwest Project, <strong>the</strong><br />
datab<strong>as</strong>e is being fur<strong>the</strong>r upgraded<br />
with new field survey results<br />
and sample reanalysis data.<br />
This information will be compiled<br />
<strong>as</strong> part of a large-scale geoscience<br />
initiative, which <strong>to</strong> date<br />
h<strong>as</strong> included stream-b<strong>as</strong>ed infill<br />
sampling and <strong>the</strong> reanalysis of<br />
sediment pulps saved from previous<br />
government-funded surveys.<br />
Results will generate a v<strong>as</strong>t array<br />
of geochemical information that<br />
complements o<strong>the</strong>r components<br />
of <strong>the</strong> QUEST-Northwest Project,<br />
such <strong>as</strong> <strong>the</strong> airborne geophysical<br />
surveys and bedrock<br />
mapping (Simpson, 2012; Logan,<br />
2012, respectively). This<br />
collection of high-quality geoscience<br />
information will help promote and stimulate exploration<br />
interest in <strong>the</strong> project area.<br />
Keywords: Telegraph Creek, De<strong>as</strong>e Lake, mineral exploration,<br />
geochemistry, regional geochemical survey, RGS, multi-element<br />
reanalysis, stream sediment<br />
This publication is also available, free of charge, <strong>as</strong> colour digital<br />
<strong>file</strong>s in Adobe Acrobat ® <strong>PDF</strong> format from <strong>the</strong> <strong>Geoscience</strong> <strong>BC</strong><br />
website: http://www.geosciencebc.com/s/DataRele<strong>as</strong>es.<strong>as</strong>p.<br />
Figure 1. Location of <strong>the</strong> 2011 QUEST-Northwest geochemical infill sampling and reanalysis<br />
programs, northwestern British Columbia.<br />
Northwestern <strong>BC</strong> h<strong>as</strong> been <strong>the</strong> focus of several governmentfunded<br />
reconnaissance-scale regional geochemical surveys<br />
completed between 1987 and 2004 (Lett, 2005). Although<br />
results from this work produced a solid b<strong>as</strong>e of<br />
geochemical information that h<strong>as</strong> guided numerous exploration<br />
activities, limitations <strong>as</strong>sociated with sample site density<br />
and <strong>the</strong> existing geochemical datab<strong>as</strong>e identified a need<br />
<strong>to</strong> incre<strong>as</strong>e <strong>the</strong> number of sample sites and upgrade <strong>the</strong> capacity<br />
of <strong>the</strong> <strong>as</strong>sociated analytical package. To address<br />
<strong>the</strong>se deficiencies, stream-b<strong>as</strong>ed infill sampling w<strong>as</strong> conducted<br />
over parts of <strong>the</strong> study area and <strong>the</strong> reanalysis of archived<br />
sediment pulps is also being completed.<br />
QUEST-Northwest Project Area<br />
Sample reanalysis work covers NTS 104F, G and K<br />
1:250 000 map are<strong>as</strong> (Figure 1). The infill sampling component<br />
included parts of NTS 104G, H, I and J 1:250 000 map<br />
are<strong>as</strong>. To co-ordinate geochemical coverage with <strong>the</strong> airborne<br />
geophysics work, <strong>the</strong> stream sampling w<strong>as</strong> divided<br />
in<strong>to</strong> <strong>the</strong> Telegraph Creek and De<strong>as</strong>e Lake survey are<strong>as</strong><br />
(Figure 2).<br />
The Telegraph Creek survey covers an area of more than<br />
3500 km 2 and extends west from <strong>the</strong> community of Telegraph<br />
Creek, straddling <strong>the</strong> wide and heavily forested<br />
<strong>Geoscience</strong> <strong>BC</strong> Report 2012-1 15
Figure 2. Locations of Telegraph Creek and De<strong>as</strong>e Lake infill sampling are<strong>as</strong> (indicated by <strong>the</strong> d<strong>as</strong>hed red outlines), northwestern British<br />
Columbia.<br />
Stikine River valley. To <strong>the</strong> west and south of <strong>the</strong> valley, <strong>the</strong><br />
area is characterized by high rugged peaks of <strong>the</strong> Boundary<br />
Ranges, and <strong>to</strong> <strong>the</strong> north, <strong>the</strong> more subdued mountains of<br />
<strong>the</strong> Tahltan Highland (Holland, 1976). The De<strong>as</strong>e Lake survey<br />
covers more than 5500 km 2 and also includes parts of<br />
<strong>the</strong> Stikine River valley and <strong>the</strong> Tanzilla River valley. The<br />
area extends e<strong>as</strong>t in<strong>to</strong> <strong>the</strong> Stikine Ranges of <strong>the</strong> C<strong>as</strong>siar<br />
Mountains.<br />
In low-lying regions of <strong>the</strong> survey are<strong>as</strong> (Figure 3), access<br />
w<strong>as</strong> limited by thick tree cover. In addition, <strong>the</strong> availability<br />
of suitable sample material w<strong>as</strong> often hampered by poorly<br />
developed stream drainages <strong>as</strong>sociated with extensive wetland<br />
cover. Exposed are<strong>as</strong> at higher elevations (Figure 4)<br />
provided excellent access <strong>to</strong> streams and numerous opportunities<br />
<strong>to</strong> improve <strong>the</strong> overall sample site coverage.<br />
QUEST-Northwest Infill Surveys<br />
Using helicopter support, stream-b<strong>as</strong>ed sample collection<br />
w<strong>as</strong> carried out in August 2011. A <strong>to</strong>tal of 441 stream sediment<br />
and water samples were systematically collected.<br />
Combined with previous survey results, <strong>the</strong> sample site<br />
density w<strong>as</strong> incre<strong>as</strong>ed <strong>to</strong> one site every 7 km 2 . The sampling<br />
generally included approximately 2 kg of sediment material<br />
and 250 mL of clear water obtained from <strong>the</strong> active<br />
stream channel of first-order drainages. Field observations<br />
of location, sample information and site characteristics<br />
were recorded for each site. Samples were transported back<br />
<strong>to</strong> field camps in <strong>the</strong> community of Telegraph Creek and<br />
near Iskut along Highway 37, where <strong>the</strong> samples were catalogued<br />
and sediments were drip-dried in a contaminantfree<br />
structure and water bottles were s<strong>to</strong>red in a cool, dark<br />
location.<br />
16 <strong>Geoscience</strong> <strong>BC</strong> Summary of Activities 2011
At <strong>the</strong> completion of <strong>the</strong> field program, stream sediment<br />
samples were dried and sieved <strong>to</strong> –80 mesh (
Acknowledgments<br />
Acknowledgments are extended <strong>to</strong> E. Jackaman, S.<br />
Reichheld, J. Dimock, J. Faulkner and L. Quock for <strong>the</strong>ir<br />
contributions <strong>to</strong> <strong>the</strong> field program; M. McCurdy, S. Day<br />
and R. McNeil of NRCan for <strong>the</strong>ir ongoing support of <strong>the</strong><br />
development and maintenance of <strong>the</strong> <strong>BC</strong> RGS program,<br />
Stikine Riversong Lodge and Ta<strong>to</strong>gga Lake Resort for <strong>the</strong>ir<br />
excellent service and hospitality and R. Lett for his program<br />
support and for reviewing this paper.<br />
References<br />
Ballantyne, S.B. (1991): Stream geochemistry in <strong>the</strong> Canadian<br />
Cordillera: conventional and future applications for exploration;<br />
in Exploration Geochemistry Workshop, Geological<br />
Survey of Canada, Open File 2390, p. 6.1–6.74.<br />
Friske, P.W.B. and Hornbrook, E.H.W. (1991): Canada’s National<br />
Geochemical Reconnaissance programme; Transactions of<br />
<strong>the</strong> Institution of Mining and Metallurgy, Section B, v. 100,<br />
p. 47–56.<br />
Gravel, J. and Matysek, P.F. (1988): Regional Geochemical Survey<br />
18–Iskut River (104B), RGS 19–Sumdum (104F) and<br />
Telegraph Creek (104F), RGS 20–Tulsequah (104K); in<br />
Geological Fieldwork 1987, <strong>BC</strong> Ministry of Energy and<br />
Mines, Paper 1988-1, p. 489–492, URL [November<br />
2011].<br />
Holland, S.S. (1976): Landforms of British Columbia: a physiographic<br />
outline; <strong>BC</strong> Ministry of Energy and Mines, Bulletin<br />
48, 138 p, URL [November<br />
2011].<br />
Jackaman, W. (2011a): The British Columbia Regional Geochemical<br />
Survey: new analytical data and sample archive upgrades;<br />
in <strong>Geoscience</strong> <strong>BC</strong> Summary of Activities 2010,<br />
<strong>Geoscience</strong> <strong>BC</strong>, Report 2011-1, p. 181–187, URL [November 2011].<br />
Jackaman, W. (2011b): Nor<strong>the</strong>rn <strong>BC</strong> Sample Reanalysis Project;<br />
<strong>Geoscience</strong> <strong>BC</strong>, Report 2011-2, 11 p., URL [November 2011].<br />
Lett, R.E.W. (2005): Regional geochemical survey datab<strong>as</strong>e on<br />
CD; <strong>BC</strong> Ministry of Energy and Mines, GeoFile 2005-17,<br />
CD-ROM, URL [November 2011].<br />
Logan, J.M., Diakow, L.J., van Straaten, B.I., Moynihan, D.P. and<br />
Iverson, O. (2012): QUEST-Northwest mapping: <strong>BC</strong> Geological<br />
Survey De<strong>as</strong>e Lake <strong>Geoscience</strong> Project, nor<strong>the</strong>rn<br />
British Columbia (NTS 104I, J); in <strong>Geoscience</strong> <strong>BC</strong>, Summary<br />
of Activities 2011, <strong>Geoscience</strong> <strong>BC</strong>, Report 2012-1,<br />
p. 5–14.<br />
Simpson, K. (2012): QUEST-Northwest: <strong>Geoscience</strong> <strong>BC</strong>’s new<br />
minerals project in northwestern British Columbia (NTS<br />
104G, J, parts of NTS 104A, B, F, H, I, K, 103O, P); in<br />
<strong>Geoscience</strong> <strong>BC</strong> Summary of Activities 2011, <strong>Geoscience</strong><br />
<strong>BC</strong>, Report 2012-1, p. 1–4.<br />
18 <strong>Geoscience</strong> <strong>BC</strong> Summary of Activities 2011
Porphyry Integration Project: Bringing Toge<strong>the</strong>r <strong>Geoscience</strong> and Exploration<br />
Dat<strong>as</strong>ets for British Columbia’s Porphyry Districts<br />
F. Devine, Merlin <strong>Geoscience</strong>s Inc., Atlin, <strong>BC</strong>, fdevine@merlingeo.com<br />
Devine, F. (2012): Porphyry Integration Project: bringing <strong>to</strong>ge<strong>the</strong>r geoscience and exploration dat<strong>as</strong>ets for British Columbia’s porphyry<br />
districts; in <strong>Geoscience</strong> <strong>BC</strong> Summary of Activities 2011, <strong>Geoscience</strong> <strong>BC</strong>, Report 2012-1, p. 19–28.<br />
Introduction<br />
Understanding <strong>the</strong> geology of porphyry systems is necessary<br />
<strong>to</strong> focus exploration for porphyry mineralization.<br />
However, bridging <strong>the</strong> gap between conceptual ide<strong>as</strong> or focused<br />
scientific insights and practical exploration methods<br />
can be a challenge. Interpreting patterns, trends and features<br />
in geophysical and geochemical data from porphyry<br />
systems in <strong>the</strong> context of complex magmatic-hydro<strong>the</strong>rmal<br />
systems can be difficult, particularly when data may be<br />
limited or restricted in aerial extent.<br />
Geological models for porphyry systems have been developed<br />
over several decades by numerous researchers, providing<br />
guidance <strong>to</strong> explorers on both <strong>the</strong> regional and <strong>the</strong><br />
more detailed levels of porphyry exploration (see Thompson,<br />
1995). In <strong>BC</strong>, research related <strong>to</strong> porphyry systems h<strong>as</strong><br />
seen several periods of collaboration resulting in seminal<br />
<strong>volume</strong>s such <strong>as</strong> CIM Special Volume 15 (Su<strong>the</strong>rland<br />
Brown, 1976) and CIM Special Volume 46 (Schroeter,<br />
1995), <strong>as</strong> well <strong>as</strong> integrated research projects on alkalic systems<br />
(e.g., research in <strong>the</strong> 1990s by <strong>the</strong> Mineral Deposit Research<br />
Unit [MDRU]; research in <strong>the</strong> 2000s by MDRU and<br />
<strong>the</strong> Centre for Ore Deposit Research [CODES], see Chamberlain<br />
et al., 2007; <strong>as</strong> well <strong>as</strong> research and mapping by <strong>the</strong><br />
<strong>BC</strong> Geological Survey [<strong>BC</strong>GS], e.g., Pre<strong>to</strong> et al., 2004; Logan<br />
et al., 2006, 2007). These projects have advanced <strong>the</strong><br />
level of understanding of <strong>the</strong> tec<strong>to</strong>nic and local magmatichydro<strong>the</strong>rmal<br />
controls on <strong>BC</strong>’s porphyry systems, <strong>as</strong> well<br />
<strong>as</strong> developed more detailed conceptual models for specific<br />
porphyry cl<strong>as</strong>ses.<br />
As explorers gain a better understanding of <strong>the</strong> details of porphyry<br />
systems, <strong>the</strong>re is a need <strong>to</strong> review <strong>the</strong>se models in <strong>the</strong><br />
context of practical exploration methods. It is important not<br />
only <strong>to</strong> understand <strong>the</strong> variations within <strong>the</strong> models, but<br />
also <strong>to</strong> recognize what <strong>the</strong> variations within different porphyry<br />
systems look like in exploration dat<strong>as</strong>ets. Identifying<br />
which features of geological, geochemical and geophysical<br />
Keywords: porphyry, integration, district, exploration<br />
This publication is also available, free of charge, <strong>as</strong> colour digital<br />
<strong>file</strong>s in Adobe Acrobat ® <strong>PDF</strong> format from <strong>the</strong> <strong>Geoscience</strong> <strong>BC</strong><br />
website: http://www.geosciencebc.com/s/DataRele<strong>as</strong>es.<strong>as</strong>p.<br />
dat<strong>as</strong>ets are linked <strong>to</strong> mineralized porphyry centres is <strong>the</strong><br />
key <strong>to</strong> successful exploration.<br />
The porphyry integration project is working <strong>to</strong> develop integrated<br />
geological, geophysical and geochemical maps<br />
and dat<strong>as</strong>ets for thirteen important porphyry districts in <strong>BC</strong>.<br />
The exploration data are drawn from public and, where<br />
possible, private company contributions. The goal is <strong>to</strong> develop<br />
an integrated model for porphyry discovery that links<br />
conceptual geological models with practical field exploration.<br />
Porphyry Integration Project<br />
Some of <strong>BC</strong>’s more advanced porphyry districts have exploration<br />
dat<strong>as</strong>ets that span decades, and full compilation<br />
of <strong>the</strong>se data h<strong>as</strong> not yet been completed. Integrating <strong>the</strong><br />
data and <strong>the</strong>n interpreting <strong>the</strong> geological, geophysical and<br />
geochemical context for known mineralization in <strong>the</strong>se districts,<br />
some of which have developed mines, will provide<br />
an excellent resource <strong>to</strong> aid in <strong>the</strong> development of focused<br />
exploration strategies for o<strong>the</strong>r porphyry occurrences in<br />
<strong>BC</strong>. Compiling examples of how porphyry system features<br />
manifest in exploration dat<strong>as</strong>ets and explaining <strong>the</strong> significance<br />
of <strong>the</strong> findings in <strong>the</strong> context of <strong>the</strong> current understanding<br />
of porphyry systems, is fundamental <strong>to</strong> strong science-b<strong>as</strong>ed<br />
exploration and is <strong>the</strong> concept for <strong>the</strong> porphyry<br />
integration project. The porphyry integration project w<strong>as</strong><br />
outlined in detail in Devine (2011) and <strong>the</strong> following article<br />
is intended <strong>to</strong> provide a brief update on <strong>the</strong> progress <strong>to</strong> date.<br />
Selected <strong>BC</strong> Porphyry Districts<br />
The districts chosen for evaluation during this project reflect<br />
<strong>the</strong> variety in porphyry systems in <strong>BC</strong> (Figure 1). Porphyry<br />
deposits in <strong>BC</strong> may be grouped in<strong>to</strong> ‘pre-accretion’<br />
and ‘post-accretion’ settings, b<strong>as</strong>ed on <strong>the</strong> timing of <strong>the</strong>ir<br />
emplacement relative <strong>to</strong> tec<strong>to</strong>nic accretion <strong>to</strong> <strong>the</strong> North<br />
American continental margin (e.g., McMillan et al., 1995;<br />
Figure 1). The calcalkalic and alkalic cl<strong>as</strong>sification is also<br />
reflected in this grouping by <strong>the</strong> direct links between tec<strong>to</strong>nic<br />
processes and magma series. The pre-accretion porphyries<br />
are those developed in <strong>the</strong> Stikine and Quesnel arc<br />
terranes; <strong>the</strong>y include both calcalkalic Cu-Mo-(Au) and<br />
alkalic Cu-Au systems, commonly found <strong>to</strong> occur within<br />
coeval magmatic and volcanic host rocks. The porphyry<br />
<strong>Geoscience</strong> <strong>BC</strong> Report 2012-1 19
districts in Quesnel and Stikine terrane include many of<br />
<strong>BC</strong>’s richest Cu-porphyry deposits. The post-accretion deposits<br />
are more widespread across terrane boundaries and<br />
occur in magmatic suites emplaced in<strong>to</strong> older rocks, inboard<br />
of <strong>the</strong> continental margin. They are calcalkalic Cu-<br />
Mo and Mo dominant systems formed from more evolved<br />
magmatic systems.<br />
Variation within porphyry systems is also reflected in <strong>the</strong><br />
earlier divisions of cl<strong>as</strong>sic, volcanic and plu<strong>to</strong>nic (McMillan<br />
and Panteleyev, 1988), which reflect <strong>the</strong> variety of emplacement<br />
settings for porphyry systems. The dominant<br />
controls include hostrock variation and resultant reactivity<br />
of hostrocks, <strong>as</strong> well <strong>as</strong> variable degrees of structural control,<br />
ei<strong>the</strong>r pre-emplacement, synemplacement or post-<br />
Figure 1. Locations of porphyry districts in British Columbia identified for compilation and integration by <strong>the</strong> Porphyry Integration Project<br />
(blue rectangles); digital elevation model developed by <strong>the</strong> Canadian Council on Geomatics (2004). The locations of porphyry<br />
showings, prospects and developed prospects are from <strong>the</strong> MINFILE datab<strong>as</strong>e (<strong>BC</strong> Geological Survey, 2011).<br />
20 <strong>Geoscience</strong> <strong>BC</strong> Summary of Activities 2011
emplacement. Toge<strong>the</strong>r with <strong>the</strong> variations in magmatic<br />
and hydro<strong>the</strong>rmal character of calcalkalic and alkalic systems<br />
<strong>the</strong>se controls may lead <strong>to</strong> a variety of porphyry<br />
mineralization settings and styles.<br />
The districts chosen for evaluation in <strong>the</strong> project represent<br />
<strong>the</strong>se porphyry system variations within <strong>BC</strong> (Figure 1).<br />
Data availability, quality and quantity were also taken in<strong>to</strong><br />
consideration, and <strong>the</strong> result is a working list of 13 <strong>BC</strong> porphyry<br />
districts. They include Tri<strong>as</strong>sic and Jur<strong>as</strong>sic alkalic<br />
and calcalkalic districts within <strong>the</strong> Stikine and Quesnel terranes,<br />
represented by Copper Mountain, Iron M<strong>as</strong>k, Mount<br />
Polley, Mount Milligan, Duckling Creek (Lorraine), Galore<br />
Creek, Red Chris, Kemess and Highland Valley. Postaccretion<br />
districts are represented by Endako, Huckleberry<br />
and Bell-Granisle. The list is somewhat weighted <strong>to</strong>ward<br />
<strong>the</strong> alkalic cl<strong>as</strong>s due <strong>to</strong> <strong>the</strong> high level of exploration interest<br />
in <strong>the</strong>se gold-rich, potentially high-grade, although smaller<br />
footprint deposits. This interest in alkalic systems h<strong>as</strong> been<br />
reflected in <strong>the</strong> recent research by <strong>the</strong> MDRU-CODES collaboration<br />
(Chamberlain et al., 2007), <strong>BC</strong>GS initiatives<br />
(e.g., Logan et al., 2006, 2007), <strong>as</strong> well <strong>as</strong> recent <strong>Geoscience</strong><br />
<strong>BC</strong> Quesnellia Exploration Strategy (QUEST) initiatives<br />
<strong>to</strong> develop dat<strong>as</strong>ets over <strong>the</strong> Quesnel and Stikine<br />
terranes <strong>to</strong> encourage new exploration.<br />
District-Scale Approach<br />
The ‘district-scale’approach is fundamental <strong>to</strong> <strong>the</strong> focus of<br />
<strong>the</strong> project. Encouragement for developing strong districtscale<br />
understanding of porphyry systems comes from <strong>the</strong><br />
recognition that porphyry deposits commonly occur in<br />
clusters <strong>as</strong>sociated with certain magmatic suites and that<br />
deposits of different ages, mineralization styles and metal<br />
ratios may occur within a <strong>single</strong> district (e.g., Cadia Ridgeway,<br />
Wilson et al., 2003). Mineralization occurring peripheral<br />
<strong>to</strong> <strong>the</strong> main porphyry centres may also be economically<br />
significant and warrant inclusion in any district-scale<br />
model for porphyry exploration. The idea of adopting a<br />
porphyry ‘footprints’approach <strong>to</strong> research and exploration<br />
recognizes that <strong>the</strong> alteration and hydro<strong>the</strong>rmal manifestations<br />
of a porphyry systems may extend much far<strong>the</strong>r<br />
outwards than <strong>the</strong> mineralized zones and provide a larger<br />
target area for exploration.<br />
While deposit-scale variations within a district are important<br />
<strong>to</strong> understanding <strong>the</strong> intricacies of porphyry systems,<br />
<strong>the</strong> variations can be quite complex and dependent on a<br />
number of specific local fac<strong>to</strong>rs. Significant effort h<strong>as</strong> been<br />
put in<strong>to</strong> understanding <strong>the</strong> geological details of many <strong>BC</strong><br />
porphyry deposits (e.g., Su<strong>the</strong>rland Brown, 1976;<br />
Schroeter, 1995). The district-scale controls are certainly<br />
dependent on local characteristics; however, <strong>the</strong> step back<br />
in scale allows for <strong>the</strong> recognition of o<strong>the</strong>r magmatic and<br />
structural features that may be controlling porphyry mineralization<br />
within a wider region.<br />
This district-scale challenge is familiar <strong>to</strong> explorers who<br />
commonly rely on broad aeromagnetic, electromagnetic,<br />
induced polarization (IP) and geochemistry surveys <strong>to</strong> focus<br />
<strong>the</strong>ir efforts. Insight in<strong>to</strong> <strong>the</strong> manifestation of <strong>the</strong> more<br />
subtle features of porphyry systems within <strong>the</strong>se data, at <strong>the</strong><br />
district-scale, is highly useful <strong>to</strong> field exploration.<br />
Development of Data Layers and<br />
Presentation<br />
The approach for data collection and integration over <strong>the</strong><br />
selected districts h<strong>as</strong> been systematic and h<strong>as</strong> followed <strong>the</strong><br />
general order listed below:<br />
1) collection of available public geochemical and geological<br />
data<br />
2) review of <strong>as</strong>sessment reports for his<strong>to</strong>ric soil geochemistry<br />
data, and digitizing when of value <strong>to</strong> <strong>the</strong> project<br />
3) engagement with companies in <strong>the</strong> district of interest<br />
following a review of his<strong>to</strong>ric work<br />
4) development of consistent maps and digital dat<strong>as</strong>ets by<br />
<strong>the</strong> project team<br />
5) integration of spatial data and geological evaluation<br />
Stage 1 compilation includes regional public data: <strong>BC</strong> regional<br />
geochemical survey (RGS), aeromagnetic surveys,<br />
QUEST electromagnetic and gravity data. Figure 2 is an example<br />
of a set of regional data presented in a consistent format<br />
at <strong>the</strong> district-scale for <strong>the</strong> Mount Polley area. The <strong>BC</strong><br />
Geological Survey geological compilation for Mount<br />
Polley can be compared with <strong>the</strong> regional magnetic, radiometric<br />
(K-Th) and stream-sediment geochemistry data. By<br />
comparing <strong>the</strong>se integrated data at a similar scale and format<br />
it is possible <strong>to</strong> develop interpretations of trends.<br />
Stage 2 compilation includes more detailed, district-specific<br />
data such <strong>as</strong> ground geophysical surveys, for example<br />
local ground magnetic and IP surveys. Soil geochemistry<br />
surveys are also included in this compilation, many of<br />
which have been <strong>file</strong>d in his<strong>to</strong>ric <strong>as</strong>sessment reports. The<br />
distribution and availability of <strong>the</strong>se district-specific data is<br />
more limited than <strong>the</strong> government-developed regional<br />
dat<strong>as</strong>ets. Compilation of <strong>the</strong>se data is on-going and will<br />
result in several new digital products.<br />
Where possible, companies have been contributing digital<br />
data, such <strong>as</strong> detailed geophysical surveys or his<strong>to</strong>ric soil<br />
geochemistry data, <strong>to</strong> complete certain district dat<strong>as</strong>ets<br />
(stage 3 compilation).<br />
During <strong>the</strong> course of <strong>the</strong> project, maps of <strong>the</strong> data are being<br />
produced in-house by <strong>the</strong> <strong>Geoscience</strong> <strong>BC</strong> project team.<br />
Figures 2 and 3 are examples of some of <strong>the</strong> GIS-b<strong>as</strong>ed<br />
maps that are being used <strong>to</strong> organize and view <strong>the</strong> multilayered,<br />
multi-disciplinary data. The concept of scale consistency<br />
between districts is important in <strong>the</strong> development<br />
of data layers. Not only are maps being used <strong>to</strong> evaluate<br />
dat<strong>as</strong>ets within <strong>the</strong> districts, but also <strong>to</strong> compare and con-<br />
<strong>Geoscience</strong> <strong>BC</strong> Report 2012-1 21
Figure 2. Examples of layers of regional data over <strong>the</strong> Mount Polley alkalic Cu-Au porphyry district, British Columbia; <strong>the</strong> locations of developed<br />
pits are shown in black outlines, and <strong>the</strong> locations of undeveloped mineralized zones are shown in grey outlines (taken from Imperial<br />
Metals Corporation (2011): a) geological map of Logan et al. (2007); <strong>the</strong> intrusive complex between Polley and Bootjack lakes is host <strong>to</strong> <strong>the</strong><br />
mineralized zones that comprise <strong>the</strong> district; b) <strong>to</strong>tal magnetic field map generated by <strong>Geoscience</strong> <strong>BC</strong> (G<strong>BC</strong>) from <strong>the</strong> 2005 Geological Survey<br />
of Canada Hydraulic Survey (Carson et al., 2006); a more detailed magnetic survey of <strong>the</strong> Mount Polley area w<strong>as</strong> undertaken by Shives<br />
et al. (2003); c) first vertical derivative of <strong>the</strong> <strong>to</strong>tal magnetic intensity (TMI) image generated by G<strong>BC</strong> from Carson et al. (2006); d) isostatic<br />
Bouguer gravity image from <strong>the</strong> Quesnellia Exploration Strategy (QUEST) project data (Sander Geophysics, 2008); e) radiometric image<br />
generated by G<strong>BC</strong> from Carson et al. (2006); f) compilation of Cu values in regional stream-sediment data (Jackaman, 2008). All geophysical<br />
data layers are produced by P. Kowalcyzk on behalf of <strong>Geoscience</strong> <strong>BC</strong>; <strong>the</strong> regional stream-sediment data compilation is by<br />
D. Heberlein for <strong>Geoscience</strong> <strong>BC</strong>. All maps are in UTM NAD83 projection, Zone 10.<br />
22 <strong>Geoscience</strong> <strong>BC</strong> Summary of Activities 2011
<strong>Geoscience</strong> <strong>BC</strong> Report 2012-1 23
Figure 3. Examples of 1:50 000 scale compilation maps of geology and first-vertical derivative magnetic survey images generated from regional<br />
data over several alkalic Cu-Au districts in British Columbia. Maps are produced <strong>to</strong> <strong>the</strong> same scale using consistent colour ramps<br />
and legends <strong>to</strong> allow for comparing and contr<strong>as</strong>ting data between districts: a) and b) geology map of Iron M<strong>as</strong>k batholith, compilation by Logan,<br />
et al. (2006), first vertical derivative magnetic survey map generated from <strong>the</strong> 1995 Iron M<strong>as</strong>k geophysical survey (Shives and Carson,<br />
1995); c) and d) Copper Mountain geology compilation of Pre<strong>to</strong> et al. (2004), first vertical derivative magnetic data generated from <strong>the</strong> 1971<br />
Geological Survey of Canada aeromagnetic survey (Natural Resources Canada, 2011); e) and f) geology of <strong>the</strong> Mount Milligan area from<br />
<strong>the</strong> <strong>BC</strong> Digital Geology compilation (M<strong>as</strong>sey et al., 2005), with more detailed geology in <strong>the</strong> vicinity of <strong>the</strong> deposit developed by Placer<br />
Dome Inc., published in Jago and Tosdal (2009), first vertical derivative magnetic survey map is generated from <strong>the</strong> 2005 Mount Milligan<br />
geophysical survey (Shives, 2005) and <strong>the</strong> 2008 Z-Axis Tipper Electromagnetic (ZTEM) survey test block over <strong>the</strong> Mt. Milligan area<br />
(Geotech Ltd., 2009). All levelled first vertical derivative products were produced by P. Kowalczyk for <strong>Geoscience</strong> <strong>BC</strong>.<br />
24 <strong>Geoscience</strong> <strong>BC</strong> Summary of Activities 2011
<strong>Geoscience</strong> <strong>BC</strong> Report 2012-1 25
tr<strong>as</strong>t between districts (Figure 3). The development of consistent<br />
legends and scales is paramount <strong>to</strong> <strong>the</strong> value of <strong>the</strong><br />
maps for fur<strong>the</strong>r interpretation of <strong>the</strong> relationships of<br />
exploration data within and between districts.<br />
Looking Forward<br />
The porphyry integration project is ongoing and h<strong>as</strong> made<br />
steady progress over <strong>the</strong> p<strong>as</strong>t year. The data compilation<br />
component of <strong>the</strong> project h<strong>as</strong> taken longer than anticipated<br />
and is scheduled for completion over <strong>the</strong> winter of 2012.<br />
Data interrogation and interpretation h<strong>as</strong> started and will<br />
ramp-up once <strong>the</strong> data compilation ph<strong>as</strong>e is complete.<br />
Maps and digital products developed during <strong>the</strong> course of<br />
<strong>the</strong> project will be made available publically through<br />
<strong>Geoscience</strong> <strong>BC</strong>’s website (http://www.geosciencebc.com/<br />
s/DataRele<strong>as</strong>es.<strong>as</strong>p) in 2012.<br />
Acknowledgments<br />
The o<strong>the</strong>r members of <strong>the</strong> Porphyry Integration Project<br />
team, including D. Heberlein, P. Kowalczyk and F. Ma<br />
along with K. Simpson for <strong>Geoscience</strong> <strong>BC</strong>, are acknowledged<br />
for <strong>the</strong>ir contribution. Mineral Deposit Research<br />
Unit (MDRU) participants F. Blaine, T. Bissig and<br />
D. Mitchinson are also thanked. The Porphyry Integration<br />
Project is grateful for <strong>the</strong> on-going contributions from company<br />
participants on specific porphyry districts.<br />
References<br />
<strong>BC</strong> Geological Survey (2011): MINFILE <strong>BC</strong> mineral deposits datab<strong>as</strong>e;<br />
<strong>BC</strong> Ministry of Energy and Mines, URL<br />
[November 2011].<br />
Canadian Council on Geomatics (2004): Canadian digital elevation<br />
data; Natural Resources Canada, GeoB<strong>as</strong>e ,URL<br />
[November 2011].<br />
Carson, J.M., Dumont, J.M., Potvin, R., Shives, R.B.K., Harvey,<br />
B.J.A. and Buckle, J.L. (2006): Geophysical series - NTS<br />
93A/12 - Hydraulic, British Columbia; Geological Survey<br />
of Canada, Open File 5290, URL [November 2011].<br />
Chamberlain, C.M., Jackson, M., Jago, C.P., P<strong>as</strong>s, H.E., Simpson,<br />
K.A., Cooke, D.R. and Tosdal, R.M. (2007): Toward an integrated<br />
model for alkali porphyry copper deposits in British<br />
Columbia (NTS 093A, N; 104G): in Geological Fieldwork<br />
2006, <strong>BC</strong> Ministry of Energy and Mines, Paper 2007-1,<br />
p. 259–273, URL [November 2011].<br />
Devine, F. (2011): Porphyry Integration Project: combining British<br />
Columbia’s wealth of dat<strong>as</strong>ets with modern exploration<br />
geoscience at <strong>the</strong> district scale <strong>to</strong> provide new insight in<strong>to</strong><br />
porphyry-deposit exploration strategies; in <strong>Geoscience</strong> <strong>BC</strong><br />
Summary of Activities 2010, <strong>Geoscience</strong> <strong>BC</strong>, Report 2011-<br />
1, p. 1–4, URL [November<br />
2011].<br />
Geotech Ltd. (2009): Helicopter-borne Z-Axis Tipper Electromagnetic<br />
(ZTEM) and aeromagnetic survey, Mt. Milligan<br />
test block; <strong>Geoscience</strong> <strong>BC</strong>, Report 2009-7, URL [November 2011].<br />
Imperial Metals Corporation (2011): Mount Polley exploration,<br />
zone map; Imperial Metals Corporation, URL<br />
<br />
[November 2011]<br />
Jackaman, W. (2008): QUEST Project sample reanalysis;<br />
<strong>Geoscience</strong> <strong>BC</strong>, Report 2008-3, 4 p., URL [November 2011].<br />
Jago, C.J. and Tosdal, R.M. (2009): Distribution of alteration in an<br />
alkalic porphyry copper-gold deposit at Mount Milligan,<br />
central British Columbia (NTS 094N/01); in <strong>Geoscience</strong> <strong>BC</strong><br />
Summary of Activities 2008, <strong>Geoscience</strong> <strong>BC</strong>, Report 2009-<br />
1, p. 33–48, URL <br />
[November 2011].<br />
Logan, J.M., Bath, A., Mihalynuk, M.G., Rees, C.J., Ullrich, T.D.<br />
and Friedman, R. (2007): Regional geology of <strong>the</strong> Mount<br />
Polley area, central British Columbia; <strong>BC</strong> Ministry of Energy<br />
and Mines, <strong>Geoscience</strong> Map 2007-1, URL [November 2011].<br />
Logan, J.M., Mihalynuk, M.G., Ullrich, T.D. and Friedman, R.<br />
(2006): Geology of <strong>the</strong> Iron M<strong>as</strong>k batholith; <strong>BC</strong> Ministry of<br />
Energy and Mines, Open File 2006-11, URL [November<br />
2011].<br />
M<strong>as</strong>sey N.W.D., MacIntyre, D.G., Desjardins, P.J. and Cooney,<br />
R.T. (2005): Digital geology map of British Columbia:<br />
whole province; <strong>BC</strong> Ministry of Energy and Mines, GeoFile<br />
2005-1, URL [November 2011].<br />
McMillan, W.J. and Panteleyev, A. (1988): Porphyry copper deposits;<br />
in Ore Deposit Models, R.G. Roberts and<br />
P.A. Sheahan (ed.), <strong>Geoscience</strong> Canada Reprint Series 3,<br />
Geological Association of Canada, p. 45–58 and <strong>Geoscience</strong><br />
Canada, Geological Association of Canada, v. 7,<br />
no. 2, p. 52–63.<br />
McMillan, W.J., Thompson, J.F.H., Hart, C.J.R. and Johns<strong>to</strong>n, S.T.<br />
(1995): Regional geological and tec<strong>to</strong>nic setting of porphyry<br />
deposits in British Columbia and Yukon Terri<strong>to</strong>ry; in<br />
Porphyry Deposits of <strong>the</strong> Northwestern Cordillera of North<br />
America, T.G. Schroeter (ed.), Canadian Institute of Mining,<br />
Metallurgy and Petroleum, Special Volume 46, p. 41–57.<br />
Natural Resources Canada (2011): Aeromagnetic data; Geological<br />
Survey of Canada, <strong>Geoscience</strong> Data Reposi<strong>to</strong>ry, Survey<br />
British Columbia – 82-40A, URL [November,<br />
2011]<br />
Pre<strong>to</strong>, V.A., Nixon, G.T. and Macdonald, E.A.M. (2004): Alkaline<br />
Cu-Au porphyry systems in British Columbia: Copper<br />
Mountain; <strong>BC</strong> Ministry of Energy and Mines, <strong>Geoscience</strong><br />
Map 2004-3, URL [November 2011].<br />
Sander Geophysics (2008): Airborne gravity survey Quesnellia<br />
Region, British Columbia; <strong>Geoscience</strong> <strong>BC</strong>, Report 2008-8,<br />
26 <strong>Geoscience</strong> <strong>BC</strong> Summary of Activities 2011
URL [November<br />
2011].<br />
Schroeter, T.G., edi<strong>to</strong>r (1995): Porphyry deposits of <strong>the</strong> northwestern<br />
Cordillera of North America; Canadian Institute of Mining<br />
and Metallurgy, Special Volume 46, 888 p.<br />
Shives, R.B.K. (2005): Helicopter-borne gamma ray spectrometric<br />
and magnetic <strong>to</strong>tal field geophysical survey, Mount<br />
Milligan Area, British Columbia (Parts of NTS 092N/01;<br />
093N/02E; 093O/04W); <strong>BC</strong> Ministry of Energy and Mines,<br />
Open File 2005-09 and Geological Survey of Canada, Open<br />
File 2535, URL <br />
[November 2011].<br />
Shives, R.B.K. and Carson, J.M. (1995): Airborne geophysical<br />
survey, Iron M<strong>as</strong>k batholith, British Columbia; <strong>BC</strong> Ministry<br />
of Energy and Mines, Open File 2005-13 and Geological<br />
Survey of Canada Open File 2817, URL<br />
[November 2011].<br />
Shives, R.B.K., Carson, J.M., Ford, K.L., Holman, P.B. and<br />
Cathro, M. (2003): Helicopter-borne gamma ray spectrometric<br />
and magnetic <strong>to</strong>tal field geophysical survey, Imperial<br />
Metals Corporation’s Mount Polley Mine area, British Columbia<br />
(Part of NTS 93A/12); <strong>BC</strong> Ministry of Energy and<br />
Mines, Open File 2004-10 and Geological Survey of Canada,<br />
Open File 4619, URL [November 2011].<br />
Su<strong>the</strong>rland Brown, A., edi<strong>to</strong>r (1976): Porphyry deposits in <strong>the</strong> Canadian<br />
Cordillera; Canadian Institute of Mining and Metallurgy,<br />
Special Volume 15, 510 p.<br />
Thompson, J.F.H. (1995): Exploration and research related <strong>to</strong> porphyry<br />
deposits; in Porphyry Deposits of <strong>the</strong> Northwestern<br />
Cordillera of North America, T.G. Schroeter (ed.), Canadian<br />
Institute of Mining, Metallurgy and Petroleum, Special Volume<br />
46, p. 857–870.<br />
Wilson, A.J., Cooke, D. R. and Harper, B.L. (2003): The<br />
Ridgeway gold-copper deposit: a high-grade alkalic porphyry<br />
deposit in <strong>the</strong> Lachlan Fold Belt, New South Wales,<br />
Australia; Economic Geology, v. 98, p. 1637–1666.<br />
<strong>Geoscience</strong> <strong>BC</strong> Report 2012-1 27
28 <strong>Geoscience</strong> <strong>BC</strong> Summary of Activities 2011
Geochemical-Exploration Models for Porphyry Deposits in British Columbia<br />
F.A. Blaine, Mineral Deposit Research Unit, University of British Columbia, Vancouver, <strong>BC</strong>,<br />
fredblaine@hotmail.com<br />
C.J.R. Hart, Mineral Deposit Research Unit, University of British Columbia, Vancouver, <strong>BC</strong><br />
Blaine, F.A. and Hart, C.J.R. (2012): Geochemical-exploration models for porphyry deposits in British Columbia; in <strong>Geoscience</strong> <strong>BC</strong> Summary<br />
of Activities 2011, <strong>Geoscience</strong> <strong>BC</strong>, Report 2012-1, p. 29–40.<br />
Introduction<br />
Exploration geochemistry using surficial material h<strong>as</strong> been<br />
used <strong>to</strong> great success in British Columbia for a number of<br />
years and is a commonly used <strong>to</strong>ol in porphyry-deposit exploration.<br />
However, <strong>as</strong> deposits become scarcer and exploration<br />
focuses on are<strong>as</strong> under deeper and/or more complex<br />
cover, greater care h<strong>as</strong> <strong>to</strong> be taken in <strong>the</strong> choice of sampling<br />
media and/or analytical method <strong>as</strong> well <strong>as</strong> in <strong>the</strong> interpretation<br />
of <strong>the</strong> resulting geochemical data <strong>to</strong> achieve maximum<br />
benefit. Exploration is fur<strong>the</strong>r complicated by <strong>the</strong> introduction<br />
of newer techniques in recent years, including proprietary<br />
selective leaches and analytical methods, making it<br />
necessary <strong>to</strong> be aware of both <strong>the</strong> strengths and limitations<br />
of <strong>the</strong>se various techniques and methods. In many c<strong>as</strong>es,<br />
time or budget limitations or a lack of knowledge about an<br />
area preclude carrying out a proper site-specific orientation<br />
survey, which makes it very difficult <strong>to</strong> determine proper<br />
sampling media and analytical techniques. In <strong>the</strong>se c<strong>as</strong>es, it<br />
is necessary <strong>to</strong> turn <strong>to</strong> his<strong>to</strong>rical exploration studies of similar<br />
deposits covered by similar surficial environments <strong>to</strong><br />
help predict <strong>the</strong> geochemical expressions of <strong>the</strong> deposit in<br />
<strong>the</strong> surficial material and maximize one’s chances of success.<br />
Geochemical-exploration models, which are developed from<br />
known processes and deposits, can provide <strong>the</strong> necessary<br />
framework <strong>to</strong> develop successful geochemical-exploration<br />
programs.<br />
Geochemical-exploration models were first developed and<br />
presented by Bradshaw (1975) for deposits in <strong>the</strong> Canadian<br />
Cordillera and Canadian Shield. Bradshaw (1975) created<br />
general, conceptual geochemical-exploration models for<br />
ore deposits in <strong>BC</strong>, b<strong>as</strong>ed on fundamental scientific principles<br />
and a limited number of c<strong>as</strong>e his<strong>to</strong>ries. The exploration<br />
models summarized <strong>the</strong> potential controls on geochemical<br />
dispersion and dispersal, and <strong>the</strong> expected results on<br />
geochemical distribution.<br />
Keywords: geochemical-exploration models, geochemistry, regional<br />
geochemical survey, geochemical survey, orientation survey,<br />
porphyry deposits, soil, till, vegetation<br />
This publication is also available, free of charge, <strong>as</strong> colour digital<br />
<strong>file</strong>s in Adobe Acrobat ® <strong>PDF</strong> format from <strong>the</strong> <strong>Geoscience</strong> <strong>BC</strong><br />
website: http://www.geosciencebc.com/s/DataRele<strong>as</strong>es.<strong>as</strong>p.<br />
Subsequently, much research h<strong>as</strong> been done expanding on<br />
<strong>the</strong>se models for varied environments in <strong>the</strong> Canadian<br />
Shield (Cameron et al., 2004) and are<strong>as</strong> outside of Canada,<br />
in arid (Butt, 2005; Aspandiar et al., 2008) and tropical environments<br />
(Butt and Zeegers, 1992), <strong>as</strong> well <strong>as</strong> for<br />
volcanogenic m<strong>as</strong>sive sulphide and shale-hosted Pb-Zn-<br />
Ag deposits in <strong>the</strong> Canadian Cordillera (Lett, 2000, 2001;<br />
Lett and Bradshaw, 2003). Although proposed by Lett and<br />
Bradshaw (2003), fur<strong>the</strong>r refinement of models for porphyry<br />
deposits in <strong>the</strong> Canadian Cordillera h<strong>as</strong> not been addressed<br />
until this time. This study expands on <strong>the</strong> general<br />
conceptual models presented by Bradshaw (1975) and develops<br />
empirically-defined geochemical-exploration models<br />
for specific surficial environments, specifically for porphyry<br />
deposits in <strong>BC</strong>. These empirically-defined models<br />
will be b<strong>as</strong>ed on his<strong>to</strong>rical exploration data from both industry<br />
and government sources. The data necessary <strong>to</strong> complete<br />
this study have been captured from many sources, including<br />
regional geochemical surveys carried out by <strong>the</strong><br />
Geological Survey of Canada and <strong>the</strong> <strong>BC</strong> Geological Survey<br />
(<strong>BC</strong>GS); <strong>the</strong> results of updated sampling and archivalsample<br />
analysis available from <strong>Geoscience</strong> <strong>BC</strong>; depositand<br />
area-specific studies carried out by <strong>the</strong> <strong>BC</strong>GS and<br />
<strong>Geoscience</strong> <strong>BC</strong>; and his<strong>to</strong>rical geochemical data generated<br />
through exploration by industry.<br />
Industry-generated geochemical-exploration data have<br />
been collected and maintained in <strong>the</strong> <strong>BC</strong> <strong>as</strong>sessment report<br />
indexing system (ARIS) since <strong>the</strong> early 1950s. There is a<br />
wealth of his<strong>to</strong>rical information available within this<br />
dat<strong>as</strong>et for deposits that have been subsequently well characterized.<br />
However, <strong>the</strong> majority of this information h<strong>as</strong><br />
been submitted in paper form, and is s<strong>to</strong>red and made available<br />
<strong>to</strong> <strong>the</strong> public in Adobe ® Acrobat ® <strong>PDF</strong> format; <strong>the</strong>refore,<br />
<strong>the</strong> geochemical data is not currently available in a<br />
readily-accessible digital format. A secondary purpose of<br />
this project w<strong>as</strong> <strong>to</strong> capture this data digitally and produce a<br />
province-wide geochemistry datab<strong>as</strong>e for porphyry deposits.<br />
Objectives for <strong>the</strong> project include<br />
compiling a consistent and comprehensive geochemical<br />
datab<strong>as</strong>e for porphyry deposits in <strong>BC</strong> through acquisi-<br />
<strong>Geoscience</strong> <strong>BC</strong> Report 2012-1 29
tion of data from <strong>as</strong>sessment reports and<br />
industry sources;<br />
categorizing deposits and geochemical data<br />
b<strong>as</strong>ed on deposit and environmental variables<br />
likely <strong>to</strong> affect geochemical distribution;<br />
generating geochemical-exploration models<br />
for specific deposit types and surficial<br />
environments b<strong>as</strong>ed on relevant cl<strong>as</strong>sification<br />
criteria <strong>to</strong> provide<br />
- dominant geochemical dispersion and<br />
dispersal mechanisms;<br />
- typical or expected mineralization-element<br />
<strong>as</strong>sociations;<br />
- location, extent and magnitude of element<br />
enrichments or depletions;<br />
- potential sources of false anomalies or<br />
of element enrichments or depletions<br />
and, where possible, <strong>the</strong> means <strong>to</strong> identify<br />
<strong>the</strong>m;<br />
- preferred sampling material and horizon,<br />
<strong>as</strong> well <strong>as</strong> preferred analytical<br />
method; and<br />
- guidelines for data interpretation.<br />
Porphyry Selection and Data<br />
Collection<br />
Of <strong>the</strong> 279 porphyry deposits listed within MINFILE (<strong>BC</strong><br />
Geological Survey, 2011) and cl<strong>as</strong>sified <strong>as</strong> ‘developed<br />
prospect’, ‘p<strong>as</strong>t producer’ or ‘current producer’, 73 were<br />
determined <strong>to</strong> have geochemical data contained within 273<br />
<strong>as</strong>sessment reports in ARIS. These geochemical reports<br />
present <strong>the</strong> results of industry-conducted, surficial geochemical<br />
surveys involving over 150 000 samples. However, <strong>the</strong><br />
data contained within <strong>the</strong>se reports are of highly variable<br />
quality and much of <strong>the</strong> data is of limited use or is not<br />
extractable due <strong>to</strong> poor print quality. The initial 73 porphyry<br />
deposits were subsequently reduced <strong>to</strong> 41 (Figure 1)<br />
and, <strong>to</strong> date, data for some 70 500 samples, summarized in<br />
Table 1, have been captured from <strong>as</strong>sessment reports. To be<br />
selected for entry, reports must contain a minimum amount<br />
of information, including sample type and sampling horizon,<br />
digestion method, analytical finish and detailed spatial<br />
data. For inclusion in<strong>to</strong> <strong>the</strong> porphyry geochemical datab<strong>as</strong>e,<br />
it is necessary <strong>to</strong> convert local grid co-ordinates <strong>to</strong><br />
UTM; where conversion is not possible, data are included<br />
for interpretation purposes only.<br />
Acombination of manual entry and optical character recognition<br />
(OCR) using ABBYY ® FineReader ® software w<strong>as</strong><br />
used <strong>to</strong> capture <strong>the</strong> data from <strong>the</strong> <strong>as</strong>sessment reports. All<br />
OCR-collected data were manually verified against analytical<br />
certificates or submitted data tables <strong>to</strong> ensure <strong>the</strong> highest<br />
level of data quality and consistency. Due <strong>to</strong> <strong>the</strong> large<br />
Figure 1. Location of selected porphyry deposits and distribution of Quaternary<br />
cover in British Columbia (from M<strong>as</strong>sey et al., 2005).<br />
amount of data, various data sources and often incomplete<br />
or missing quality-control data, full quality-<strong>as</strong>surance–<br />
quality-control procedures were not completed for all surveys;<br />
however, comments on data quality will eventually<br />
be included in <strong>the</strong> completed datab<strong>as</strong>e. Where data were reported<br />
below <strong>the</strong> detection limit of <strong>the</strong> method, values were<br />
maintained in <strong>the</strong> datab<strong>as</strong>e <strong>as</strong> <strong>the</strong> negative of <strong>the</strong> detection<br />
limit.<br />
All geochemical data and metadata were converted <strong>to</strong> a<br />
consistent format, including column headings, units and<br />
projection method; metadata w<strong>as</strong> added <strong>as</strong> required; and<br />
data were added <strong>to</strong> <strong>the</strong> m<strong>as</strong>ter datab<strong>as</strong>e, which w<strong>as</strong> compiled<br />
using Microsoft ® Access ® . This datab<strong>as</strong>e will be<br />
made available at <strong>the</strong> conclusion of <strong>the</strong> project and will be<br />
included with <strong>the</strong> final report.<br />
Table 1. Summary of industrygenerated<br />
geochemical data<br />
collected from <strong>the</strong> British Columbia<br />
<strong>as</strong>sessment report indexing system<br />
(ARIS).<br />
Sample Type<br />
Current Totals<br />
Soils (B-horizon) 61 000<br />
Soils (o<strong>the</strong>r) 6 000<br />
Tills 2 000<br />
Streams 1 000<br />
Vegetation 500<br />
TOTAL 70 500<br />
30 <strong>Geoscience</strong> <strong>BC</strong> Summary of Activities 2011
Controls on Geochemical Distribution and<br />
Porphyry-Cl<strong>as</strong>sification Criteria<br />
Although this study is restricted <strong>to</strong> porphyry deposits in a<br />
relatively restricted area, <strong>the</strong>re are a number of variables<br />
that influence both <strong>the</strong> nature and geometry of <strong>the</strong> deposits<br />
and that also affect <strong>the</strong> development of <strong>the</strong> <strong>as</strong>sociated geochemical<br />
signature in <strong>the</strong> surficial material. These variations<br />
result in a unique set of conditions for each porphyry<br />
system and even for individual deposits in a <strong>single</strong> porphyry<br />
system. Therefore, in order <strong>to</strong> develop usable and appropriate<br />
geochemical-exploration models, deposits must<br />
be categorized b<strong>as</strong>ed on a limited number of processes or<br />
deposit characteristics, which will control <strong>the</strong> dominant<br />
geochemical expressions of a porphyry deposit in <strong>the</strong><br />
surficial environment, and on <strong>the</strong> fac<strong>to</strong>rs that control or influence<br />
<strong>the</strong>se processes, which can be broadly categorized<br />
<strong>as</strong> primary, secondary and postsecondary processes.<br />
Cl<strong>as</strong>sification of <strong>the</strong> porphyry deposits of interest is found<br />
in Table 2 and explained below.<br />
Primary Processes<br />
In this paper, primary processes are deposit-specific mechanisms<br />
that control <strong>the</strong> geochemical distribution of elements<br />
within <strong>the</strong> deposit itself and relate <strong>to</strong> <strong>the</strong> ore-forming<br />
processes and/or mineralization styles. These primary processes<br />
control <strong>the</strong> inherent geochemical signature of <strong>the</strong> deposit<br />
itself and any <strong>as</strong>sociated alteration, which is subsequently<br />
modified or redistributed by secondary processes.<br />
Moreover, <strong>to</strong> address primary processes, deposits are cl<strong>as</strong>sified<br />
b<strong>as</strong>ed on <strong>the</strong> porphyry-type cl<strong>as</strong>sification developed<br />
by Lefebure and Ray (1995), which categorizes porphyry<br />
deposits <strong>as</strong> ‘alkalic’, ‘calc-alkalic’ and ‘porphyry Mo’ deposits.<br />
It is recognized that this is somewhat of a generalization<br />
since individual deposits will vary within <strong>the</strong>se<br />
groupings and whenever possible, <strong>the</strong> characteristics of individual<br />
deposits that can affect <strong>the</strong> resulting surficial geochemistry<br />
are discussed.<br />
Secondary Processes<br />
Secondary processes result in <strong>the</strong> transfer or modification<br />
of <strong>the</strong> ore-deposit material and can include both physical<br />
and chemical mechanisms. These processes include <strong>the</strong><br />
physical transport of material through geomorphological<br />
processes (colluvial, alluvial, fluvial, eolian and glacial),<br />
and wea<strong>the</strong>ring of <strong>the</strong> ore deposits and overlying bedrock.<br />
Glaciation is <strong>the</strong> secondary process that will perhaps exert<br />
<strong>the</strong> greatest control on <strong>the</strong> geochemical expression in <strong>BC</strong>,<br />
<strong>as</strong> widespread glaciation throughout <strong>the</strong> province h<strong>as</strong> occurred<br />
most recently during <strong>the</strong> Late Wisconsinan (maxima<br />
circa 14 500 BP; Clague and James, 2002). This glacial<br />
event h<strong>as</strong> caused widespread distribution of tills and o<strong>the</strong>r<br />
glacial deposits throughout <strong>BC</strong> (Figure 1), and <strong>the</strong> nature<br />
and distribution of <strong>the</strong>se materials h<strong>as</strong> had a profound effect<br />
on <strong>the</strong> geochemical signature of deposits. For <strong>the</strong> purpose<br />
of identifying secondary processes, surficial cover is divided<br />
in<strong>to</strong> four categories b<strong>as</strong>ed upon soil (terrain)<br />
mapping done by <strong>the</strong> <strong>BC</strong> Ministry of Environment (2011):<br />
Table 2. Cl<strong>as</strong>sification of selected British Columbia porphyry deposits, b<strong>as</strong>ed on fac<strong>to</strong>rs that can affect <strong>the</strong> surficial<br />
geochemical expression, <strong>as</strong> well <strong>as</strong> <strong>the</strong> dispersion and dispersal mechanisms. These fac<strong>to</strong>rs are temperature, expressed in<br />
terms of periods of frost-free days (ffp) and amount of non-snow precipitation (nsp); relief, expressed in terms of <strong>to</strong>pography;<br />
and porphyry type, <strong>as</strong> presented in Lefebure and Ray (1995).<br />
<strong>Geoscience</strong> <strong>BC</strong> Report 2012-1 31
Residual soils: soils developed directly from <strong>the</strong> wea<strong>the</strong>ring<br />
of <strong>the</strong> bedrock on which <strong>the</strong>y reside<br />
Locally-derived transported cover (geochemically attached):<br />
<strong>the</strong>se materials have a direct connection <strong>to</strong> <strong>the</strong><br />
underlying bedrock and may be developed through glacial<br />
wea<strong>the</strong>ring and localized transport (a few tens of<br />
metres) or through colluvial processes (colluvium and<br />
some till veneers)<br />
Transported cover (geochemically detached): <strong>the</strong>se materials<br />
have no direct geochemical connection <strong>to</strong> <strong>the</strong> underlying<br />
bedrock and are sourced from distal materials<br />
(i.e., till blankets, outw<strong>as</strong>h, glaciolacustrine deposits)<br />
Blind deposits: <strong>the</strong> current surface of wea<strong>the</strong>red bedrock<br />
h<strong>as</strong> not reached <strong>the</strong>se deposits and <strong>the</strong>y are <strong>the</strong>refore<br />
blind <strong>to</strong> <strong>the</strong> surface<br />
Postsecondary Processes<br />
Postsecondary processes, for <strong>the</strong> purpose of this paper, are<br />
defined <strong>as</strong> those processes that modify or transport a geochemical<br />
signature after <strong>the</strong> deposition of <strong>the</strong> material, and<br />
which are generally independent of <strong>the</strong> physical transport<br />
of mineralized material. These processes include hydromorphic,<br />
phreatic, vadose zone and g<strong>as</strong>eous transport, <strong>as</strong><br />
well <strong>as</strong> transportation by vegetation. Also included in <strong>the</strong>se<br />
postsecondary processes are bio- and cryoturbation, <strong>as</strong> <strong>the</strong>y<br />
are processes that modify <strong>the</strong> postdepositional distribution<br />
of material; however, <strong>the</strong>se processes are not prevalent<br />
throughout most of <strong>BC</strong>.<br />
Controlling Fac<strong>to</strong>rs<br />
Climate<br />
The overall climate in <strong>BC</strong> during <strong>the</strong> l<strong>as</strong>t postglacial period<br />
h<strong>as</strong> been fairly stable, becoming steadily cooler and wetter<br />
throughout approximately <strong>the</strong> p<strong>as</strong>t 14 000 years (Hebda,<br />
2007). However, due <strong>to</strong> <strong>the</strong> broad range of climate zones<br />
within <strong>BC</strong>, climatic conditions can vary greatly between<br />
deposits, a fac<strong>to</strong>r which can have a considerable effect on<br />
<strong>the</strong> generation of geochemical anomalies by controlling <strong>the</strong><br />
secondary and postsecondary processes (Butt, 2005;<br />
Aspandiar et al., 2008). The two dominant climatic controls<br />
are temperature and availability of water (precipitation).<br />
Climate data for deposit locations (from <strong>BC</strong> Geological<br />
Survey, 2011) were determined using <strong>the</strong> Climate<strong>BC</strong><br />
model developed at <strong>the</strong> University of British Columbia<br />
(2011) and b<strong>as</strong>ed on <strong>the</strong> PRISM (Parameter-Elevation Regressions<br />
on Independent Slopes Model) climate-mapping<br />
system presented in Daly et al. (2002). Although climate<br />
can be an important fac<strong>to</strong>r, <strong>the</strong> influence of temperature and<br />
water availability decre<strong>as</strong>es <strong>as</strong> relief incre<strong>as</strong>es; <strong>as</strong> a result,<br />
physical transport processes will dominate in are<strong>as</strong> of steep<br />
<strong>to</strong>pography (Butt, 2005).<br />
Temperature<br />
Temperature can affect <strong>the</strong> geochemical signature of an ore<br />
deposit in <strong>the</strong> surficial environment through a number of<br />
different mechanisms. Warmer climates promote chemical<br />
wea<strong>the</strong>ring and incre<strong>as</strong>e <strong>the</strong> availability of elements liberated<br />
through wea<strong>the</strong>ring. Moreover, temperature controls<br />
<strong>the</strong> availability of water throughout <strong>the</strong> year <strong>as</strong> water is not<br />
available during winter months due <strong>to</strong> freezing. Low temperatures<br />
and long periods of frost can also promote frostinduced<br />
fracturing, leading <strong>to</strong> wea<strong>the</strong>ring and incre<strong>as</strong>ed<br />
colluvial processes.<br />
Porphyry deposits were cl<strong>as</strong>sified b<strong>as</strong>ed on temperature according<br />
<strong>to</strong> <strong>the</strong>ir frost-free period (ffp), which is <strong>the</strong> number<br />
of consecutive days that <strong>the</strong> area experiences temperatures<br />
above freezing. Two cl<strong>as</strong>sifications were made, with deposits<br />
falling in<strong>to</strong> period categories of ei<strong>the</strong>r more or less<br />
than 50 frost-free days. Frost-free period w<strong>as</strong> chosen over<br />
mean annual temperature, <strong>as</strong> it w<strong>as</strong> considered a better indica<strong>to</strong>r<br />
of <strong>the</strong> potential effects of temperature, highlighting<br />
<strong>the</strong> unavailability of water and frost-driven processes that<br />
prevail during winter months.<br />
Precipitation<br />
Precipitation, or <strong>the</strong> availability of water, is <strong>the</strong> main fac<strong>to</strong>r<br />
controlling postsecondary processes and it can also have an<br />
effect on secondary physical-transport mechanisms. Although<br />
<strong>the</strong> amount of precipitation (Butt, 2005) is an important<br />
fac<strong>to</strong>r, so is se<strong>as</strong>onality; <strong>the</strong>refore, <strong>the</strong> cl<strong>as</strong>sification<br />
of <strong>the</strong> deposits falls in<strong>to</strong> two categories b<strong>as</strong>ed upon whe<strong>the</strong>r<br />
<strong>the</strong> amount of non-snow precipitation (nsp) is greater or<br />
lesser than 500 mm. Precipitation received <strong>as</strong> snow will<br />
more likely be introduced <strong>to</strong> <strong>the</strong> hydrological system <strong>as</strong><br />
runoff, thus incre<strong>as</strong>ing alluviation, ra<strong>the</strong>r than, <strong>to</strong> any significant<br />
extent, <strong>to</strong> <strong>the</strong> local groundwater system, where <strong>the</strong><br />
aforementioned postsecondary processes occur.<br />
Incre<strong>as</strong>ed availability of water in are<strong>as</strong> of low <strong>to</strong> moderate<br />
relief will generally cause a higher water table and incre<strong>as</strong>e<br />
<strong>the</strong> likelihood of phreatic and hydromorphic processes occurring,<br />
where<strong>as</strong> in are<strong>as</strong> with lower water tables, <strong>the</strong> dominant<br />
processes will be g<strong>as</strong>eous transport and vadose zone<br />
processes.<br />
Physiography<br />
The relief of <strong>the</strong> area surrounding a deposit h<strong>as</strong> strong control<br />
over <strong>the</strong> processes responsible for physical transport<br />
and soil development. Steep are<strong>as</strong> will prevent soil formation<br />
and result in physical transport (alluvial and colluvial<br />
processes) exerting <strong>the</strong> dominant control on geochemical<br />
dispersal. Moreover, in steep are<strong>as</strong> rainfall will be more<br />
likely <strong>to</strong> manifest itself in <strong>the</strong> form of runoff, decre<strong>as</strong>ing <strong>the</strong><br />
likelihood of water infiltration and incre<strong>as</strong>ing that of alluvial<br />
processes. Deposits are cl<strong>as</strong>sified, generally b<strong>as</strong>ed on<br />
<strong>to</strong>pography, <strong>as</strong> being of slight (
or steep (>300 m elevation-change/km) relief; however, local<br />
variations in relief are common and interpretation is<br />
b<strong>as</strong>ed primarily on local <strong>as</strong>sessment of elevation.<br />
Development of Geochemical-Exploration<br />
Models<br />
The geochemical-exploration models for this project were<br />
developed by determining <strong>the</strong> element <strong>as</strong>sociations and<br />
<strong>the</strong>ir distribution between sampled media and mineralization,<br />
and linking those distributions <strong>to</strong> <strong>the</strong> process generating<br />
<strong>the</strong> geochemical pattern. Relating <strong>the</strong> geochemical expression<br />
<strong>to</strong> mineralization and/or geology, and relating <strong>the</strong><br />
expression <strong>to</strong> a process is a necessary exercise for each deposit<br />
<strong>as</strong> well <strong>as</strong> within each deposit. At <strong>the</strong> conclusion of <strong>the</strong><br />
project, <strong>the</strong>se geochemical expression-process relationships<br />
will be compiled in<strong>to</strong> a generalized graphical representation<br />
of <strong>the</strong> individual geochemical-exploration models.<br />
At this stage, <strong>the</strong>se models are incomplete and are also<br />
beyond <strong>the</strong> scope of this paper. Geochemical expressions<br />
and related processes for selected deposits are discussed<br />
below <strong>to</strong> highlight <strong>the</strong> importance of <strong>the</strong>ir study and that of<br />
<strong>the</strong> data extracted from <strong>as</strong>sessment reports.<br />
Discussion<br />
This paper presents a preliminary discussion and interpretation<br />
of observed geochemical behaviour for <strong>the</strong> Mount<br />
Polley (MINFILE 093A 008; <strong>BC</strong> Geological Survey,<br />
2011), Mount Milligan (MINFILE 093N 194) and Galaxy<br />
(MINFILE 092INE007) porphyry deposits, over which<br />
substantial B-horizon surveys were conducted and <strong>the</strong> results<br />
reported in ARIS; details of <strong>the</strong> deposits and surveys<br />
are summarized in Table 3.<br />
The Mount Polley and Mount Milligan deposits are alkalic<br />
porphyry deposits characterized by a warm, dry climate<br />
(>50 days ffp and 50 days ffp and
Figure 2. Copper distribution in B-horizon soils at <strong>the</strong> Mount Polley porphyry deposit, and illustration of <strong>as</strong>sociated geochemical expressions<br />
and distribution processes. Surficial material data modified from soil (terrain) mapping by <strong>the</strong> <strong>BC</strong> Ministry of Environment (2011); digital<br />
elevation data obtained from GeoB<strong>as</strong>e ® (Canadian Council on Geomatics, 2000); lake information obtained from M<strong>as</strong>sey et al. (2005);<br />
and geochemical data from McNaugh<strong>to</strong>n (1987). Note: complete dat<strong>as</strong>et extends beyond <strong>the</strong> limits of <strong>the</strong> map.<br />
34 <strong>Geoscience</strong> <strong>BC</strong> Summary of Activities 2011
Figure 3. Copper distribution in B-horizon soils at <strong>the</strong> Mount Milligan porphyry deposit, and illustration of <strong>as</strong>sociated geochemical expressions<br />
and distribution processes. Surficial material data modified from soil (terrain) mapping by <strong>the</strong> <strong>BC</strong> Ministry of Environment (2011). Digital<br />
elevation data obtained from GeoB<strong>as</strong>e ® (Canadian Council on Geomatics, 2000); lake information obtained from M<strong>as</strong>sey et al. (2005);<br />
and geochemical data from Heberlein et al. (1984). Note: complete dat<strong>as</strong>et extends beyond <strong>the</strong> limits of <strong>the</strong> map.<br />
<strong>Geoscience</strong> <strong>BC</strong> Report 2012-1 35
Figure 4. Copper distribution in B-horizon soils at <strong>the</strong> Galaxy porphyry deposit, and illustration of <strong>as</strong>sociated geochemical expressions and<br />
distribution processes. Surficial material data modified from soil (terrain) mapping by <strong>the</strong> <strong>BC</strong> Ministry of Environment (2011); digital elevation<br />
data obtained from GeoB<strong>as</strong>e ® (Canadian Council on Geomatics, 2000); and geochemical data from Caron (2007).<br />
36 <strong>Geoscience</strong> <strong>BC</strong> Summary of Activities 2011
Figure 5. Gold distribution in lodgepole-pine (Pinus con<strong>to</strong>rta latifolia) bark at <strong>the</strong> Mount Milligan porphyry deposit, and illustration of <strong>as</strong>sociated<br />
geochemical expressions and distribution processes. Surficial material data modified from soil (terrain) mapping by <strong>the</strong> <strong>BC</strong> Ministry of<br />
Environment (2011); digital elevation data obtained from GeoB<strong>as</strong>e ® (Canadian Council on Geomatics, 2000); lake information obtained<br />
from M<strong>as</strong>sey et al. (2005); and geochemical data from Dunn et al. (1997). Note: complete dat<strong>as</strong>et extends beyond <strong>the</strong> limits of <strong>the</strong> map.<br />
<strong>Geoscience</strong> <strong>BC</strong> Report 2012-1 37
deposit and are<strong>as</strong> in <strong>the</strong> vicinity of <strong>the</strong> Mount Polley<br />
deposit.<br />
At Mount Polley, in are<strong>as</strong> covered by a shallow till veneer<br />
(approximately 1 m or less), <strong>the</strong>re are elevated (Cu, Mo,<br />
Au) and reduced (As) soil geochemical signatures coincident<br />
with <strong>the</strong> mineralization (Figure 2). This area is also<br />
bounded by elevated Pb and Zn in soil forming a halo<br />
around <strong>the</strong> mineralized bedrock (Figure 2). Compared <strong>to</strong><br />
Mount Polley, <strong>the</strong> till cover at <strong>the</strong> Galaxy deposit is slightly<br />
thicker; however, <strong>the</strong> B-horizon soil geochemistry also exhibits<br />
elevated Cu, Mo and Au coincident with <strong>the</strong> mineralized<br />
zone (Figure 3). Evident at Galaxy, though not at<br />
Mount Polley, is a zone of depressed barium concentrations<br />
in soil also coincident with <strong>the</strong> mineralized zone, but this<br />
may be an effect related <strong>to</strong> <strong>the</strong> low solubility of some Ba<br />
minerals (e.g., barite) in <strong>the</strong> aqua-regia digestion of <strong>the</strong> soil<br />
samples. The geochemical analyses of soil samples at Galaxy<br />
did not generate reliable data for As, Pb and Zn, and<br />
<strong>the</strong>refore <strong>the</strong>se elements cannot be compared with <strong>the</strong> data<br />
collected at <strong>the</strong> Mount Polley deposit.<br />
Associated with <strong>the</strong> coincident soil geochemical anomalies<br />
discussed above at <strong>the</strong> Mount Polley and Galaxy deposits<br />
are glacial dispersal fans, in <strong>the</strong> shallow cover, which extend<br />
<strong>the</strong> soil anomalies in <strong>the</strong> direction of glacial transport.<br />
At Mount Polley (Figure 2), <strong>the</strong> glacial dispersal fan shows<br />
elevated Cu, Au and Mo, <strong>the</strong> highest values being coincident<br />
with mineralization. At Galaxy, <strong>the</strong> dispersal fan<br />
shows elevated Cu (Figure 4) and Au, but provides no conclusive<br />
evidence for glacial dispersal of Mo.<br />
Ano<strong>the</strong>r possibility for predominantly locally-derived<br />
cover is material transported by gravity or colluvial processes.<br />
Both <strong>the</strong> Mount Polley and Mount Milligan deposits<br />
have are<strong>as</strong> of steep relief proximal <strong>to</strong> mineralization,<br />
where colluvial processes have <strong>the</strong> potential <strong>to</strong> transport<br />
mineralized material. These are<strong>as</strong> of steep elevation show<br />
evidence of gravity-transported anomalies and geochemical<br />
analysis of B-horizon soils reveals elevated Cu, Au,<br />
±Mo and ±Co values in soils overlying colluvium<br />
developed from mineralized zones (Figures 2, 3).<br />
Complex, Multiprovenance Cover<br />
Are<strong>as</strong> of <strong>the</strong> Mount Polley and Mount Milligan deposits are<br />
covered by complex multiprovenance till blankets, which<br />
may be intermixed with local colluvium. In most c<strong>as</strong>es involving<br />
complex cover, B-horizon soils are inadequate <strong>to</strong><br />
determine <strong>the</strong> location of mineralization and <strong>the</strong>re is no<br />
conclusive, coincident, elevated geochemical signature in<br />
soil relating <strong>to</strong> <strong>the</strong> mineralization at <strong>the</strong>se deposits. However,<br />
at Mount Milligan <strong>the</strong>re is evidence of geochemical<br />
haloes in <strong>the</strong> B-horizon soils, which show elevated levels of<br />
As, Zn and Pb surrounding mineralization (Figure 3).<br />
Although <strong>the</strong>re are no coherent coincident geochemical indica<strong>to</strong>rs<br />
within <strong>the</strong> B-horizon soils overlying <strong>the</strong> thicker,<br />
complex transported cover at Mount Polley and Mount<br />
Milligan, <strong>the</strong>re are patchy, elevated concentrations of Cu,<br />
Mo and Au in soils following <strong>the</strong> direction of glacial dispersal<br />
at both deposits, which may be related <strong>to</strong> <strong>the</strong> up-ice<br />
mineralization (Figures 2, 3). These elevated values could<br />
indicate <strong>the</strong> presence of lenses of locally-derived material<br />
in <strong>the</strong> till blankets or of small windows <strong>to</strong> <strong>the</strong> underlying till<br />
veneer.<br />
Vegetation and Tills<br />
The vegetation survey of lodgepole-pine (Pinus con<strong>to</strong>rta<br />
latifolia)-bark conducted at <strong>the</strong> Mount Milligan deposit by<br />
Dunn et al. (1997) w<strong>as</strong> successful in identifying are<strong>as</strong> of<br />
mineralization under are<strong>as</strong> of complex cover and revealed<br />
elevated Au (Figure 5), Cu, Mo and As in bark directly overlying<br />
or immediately adjacent <strong>to</strong> mineralization. A till survey<br />
by Sibbick et al. (1997) conducted at <strong>the</strong> same time <strong>as</strong><br />
<strong>the</strong> sampling of lodgepole-pine bark, also found similar element-distribution<br />
patterns. The maximum Au value in<br />
bark (Figure 5), located over <strong>the</strong> nor<strong>the</strong><strong>as</strong>tern area of mineralization,<br />
may reflect transported cover material from <strong>the</strong><br />
sou<strong>the</strong>rn mineralized area and may not be an in situ anomaly;<br />
this situation may also apply in <strong>the</strong> c<strong>as</strong>e of Cu, As and<br />
Mo.<br />
Hydromorphic Anomalies<br />
Hydromorphic anomalies are formed through transport and<br />
concentration of elements by an aqueous process and are<br />
generally recognized through <strong>the</strong> common <strong>as</strong>sociation of<br />
elements that are enriched during <strong>the</strong>se processes. An example<br />
of a hydromorphic anomaly interpreted from <strong>the</strong> soil<br />
geochemical data from <strong>the</strong> Mount Milligan deposit is<br />
shown in Figure 3; a small soil-Cu anomaly overlying a<br />
mineralized area h<strong>as</strong> formed in a <strong>to</strong>pographic depression<br />
and yielded elevated Mn, Fe and Co concentrations; <strong>the</strong>se<br />
elements are generally found <strong>as</strong>sociated with hydromorphic<br />
anomalies.<br />
Fluvial Concentration of Heavy Minerals<br />
An elongate area of elevated Cu, Co and Fe concentration<br />
in soil labelled ‘enrichment by heavy minerals’(Figure 3) is<br />
located along a valley bot<strong>to</strong>m overlying fluvial sediments<br />
at <strong>the</strong> Mount Milligan deposit. It should be noted that <strong>the</strong><br />
linear appearance of this anomaly is somewhat exaggerated<br />
due <strong>to</strong> a slight b<strong>as</strong>eline shift in <strong>the</strong> geochemistry between<br />
<strong>the</strong> main survey lines and <strong>the</strong> infill lines; however, when<br />
comparing this anomaly <strong>to</strong> <strong>the</strong> adjacent infill lines, it remains<br />
readily apparent. The higher concentration of Cu, Co<br />
and Fe in <strong>the</strong> soil is also an <strong>as</strong>sociation typical of a<br />
hydromorphic anomaly; however, Mn is not elevated and<br />
<strong>the</strong>re are also elevated Ti and V <strong>as</strong>sociated with this area.<br />
The higher Ti and V can be indicative of elements concentrated<br />
by accumulation of heavy minerals; <strong>the</strong> proximity of<br />
38 <strong>Geoscience</strong> <strong>BC</strong> Summary of Activities 2011
<strong>the</strong> soil anomaly <strong>to</strong> <strong>the</strong> fluvial sediments, in which heavy<br />
minerals (e.g., magnetite) might accumulate, supports this<br />
possibility.<br />
Summary<br />
Available data from multiple sources, including government,<br />
<strong>Geoscience</strong> <strong>BC</strong>, academic institutions and industry,<br />
have been compiled <strong>to</strong> allow <strong>the</strong> generation of empirically<br />
derived geochemical-exploration models. This compilation<br />
included geochemical data for over 70 000 surficialmaterial<br />
samples collected by industry; although publicly<br />
available, <strong>the</strong>se data were only available in a largely unusable<br />
<strong>PDF</strong> format. The data were integrated in<strong>to</strong> a comprehensive<br />
geochemical datab<strong>as</strong>e for 41 porphyry deposits<br />
throughout <strong>BC</strong> (presented in Table 2). This datab<strong>as</strong>e is being<br />
used, along with data for known mineralization,<br />
surficial-material mapping, digital elevation models, climate<br />
models, geology and geophysics, <strong>to</strong> generate geochemical-exploration<br />
models showing generalized or expected<br />
geochemical dispersion and dispersal patterns for<br />
porphyry deposits in <strong>BC</strong>. These models, developed for specific<br />
deposit types and climatic environments, provide <strong>the</strong><br />
framework for <strong>the</strong> interpretation of geochemical-exploration–program<br />
design and data in are<strong>as</strong> not covered by<br />
proper orientation surveys, maximizing <strong>the</strong> potential for<br />
success in are<strong>as</strong> for which limited information is available.<br />
The limited data presented here highlight <strong>the</strong> importance of<br />
integrating detailed surficial mapping and geochemicaldistribution<br />
controls and processes in<strong>to</strong> survey design and<br />
data interpretation. Without this integration, an area can<br />
e<strong>as</strong>ily be excluded, b<strong>as</strong>ed on perceived negative results, or<br />
upgraded, b<strong>as</strong>ed on false positive results. The selection of<br />
<strong>the</strong> proper sample media and method is <strong>the</strong> key <strong>to</strong> exploration<br />
success and, in many c<strong>as</strong>es, one sample media may not<br />
be suitable <strong>to</strong> properly cover even a relatively small area.<br />
Acknowledgments<br />
The authors would like <strong>to</strong> thank <strong>Geoscience</strong> <strong>BC</strong> and <strong>the</strong><br />
Mineral Deposit Research Unit at <strong>the</strong> University of British<br />
Columbia for providing funding for this project. Many<br />
thanks <strong>to</strong> <strong>the</strong> members of <strong>the</strong> project advisory committee<br />
for <strong>the</strong>ir discussion of ide<strong>as</strong> necessary <strong>to</strong> <strong>the</strong> success of this<br />
project, and especially <strong>to</strong> R. Lett and P. Bradshaw for spearheading<br />
it from <strong>the</strong> start. The authors would also like <strong>to</strong><br />
thank N. Bueckert, L. Bueckert, C. Oliver and M. Tang for<br />
<strong>the</strong>ir help with data collection. Many thanks <strong>as</strong> well <strong>to</strong><br />
R. Lett for his thorough and insightful review of this paper.<br />
References<br />
Aspandiar, M.F., Anand, R.R. and Gray, D.J. (2008): Geochemical<br />
dispersion mechanism through transported cover: implications<br />
for mineral exploration in Australia; CRC LEME Open<br />
File Report 246, p. 1–84.<br />
<strong>BC</strong> Geological Survey (2011): MINFILE <strong>BC</strong> mineral deposits datab<strong>as</strong>e;<br />
<strong>BC</strong> Ministry of Energy and Mines, URL [Oc<strong>to</strong>ber 2011].<br />
<strong>BC</strong> Ministry of Environment (2011): <strong>BC</strong> terrain data; <strong>BC</strong> Ministry<br />
of Environment, Environmental Stewardship Division,<br />
URL <br />
[Oc<strong>to</strong>ber 2011].<br />
Bradshaw, P.M.D. (1975): Conceptual models in exploration geochemistry<br />
– <strong>the</strong> Canadian Cordillera and Canadian Shield;<br />
Journal of Geochemical Exploration, v. 4. p. 1–213.<br />
Butt, C.R.M (2005): Geochemical dispersion, process and exploration<br />
models; in Regolith Expression of Australian Ore<br />
Systems, C.R.M. Butt, I.D.M. Robertson, K.M. Scott and<br />
M. Cornelius (ed.), CRC LEME, Perth, p. 81–106.<br />
Butt, C.R.M. and Zeegers, H., edi<strong>to</strong>rs (1992): Regolith exploration<br />
geochemistry in tropical and subtropical terrains; in Handbook<br />
of Exploration Geochemistry, Elsevier, Amsterdam,<br />
v. 4, 607 p.<br />
Cameron, E.M., Hamil<strong>to</strong>n, S.M., Leybourne, M.I., Hall, G.E. and<br />
McClenaghan, M.B. (2004): Finding deeply buried deposits<br />
using geochemistry; Geochemistry: Exploration, Environment,<br />
Analysis, v. 4, p. 7–32.<br />
Canadian Council on Geomatics (2000): Canadian digital elevation<br />
data; Natural Resources Canada, GeoB<strong>as</strong>e ® ,URL<br />
[Oc<strong>to</strong>ber 2011].<br />
Caron, L (2007): Grid work, soil geochemistry and geophysics on<br />
<strong>the</strong> Galaxy property located in <strong>the</strong> Af<strong>to</strong>n area; <strong>BC</strong> Ministry<br />
of Energy and Mines, Assessment Report 29628, 88 p., URL<br />
[Oc<strong>to</strong>ber 2011].<br />
Clague, J.J and James, T.S. (2002): His<strong>to</strong>ry and isostatic effects of<br />
<strong>the</strong> l<strong>as</strong>t ice sheet in sou<strong>the</strong>rn British Columbia; Quaternary<br />
Science Reviews, v. 21, p. 71–87.<br />
Daly, C., Gibson, W.P., Taylor, G.H., Johnson, G.L. and P<strong>as</strong>teris, P.<br />
(2002): A knowledge-b<strong>as</strong>ed approach <strong>to</strong> <strong>the</strong> statistical mapping<br />
of climate; Climate Research, v. 22, p. 99–113.<br />
Dunn, C.E., Balma, R.G. and Sibbick, S.J. (1997):<br />
Biogeochemical survey using lodgepole pine bark: Mount<br />
Milligan central British Columbia; <strong>BC</strong> Ministry of Energy<br />
and Mines, Open File 1996-17, 115 p., URL<br />
[Oc<strong>to</strong>ber<br />
2011].<br />
Hebda, R. (2007): Biodiversity: geological his<strong>to</strong>ry in British Columbia;<br />
in Report on <strong>the</strong> Status of Biodiversity in <strong>BC</strong>,<br />
Biodiversity <strong>BC</strong> Technical Subcommittee, URL [Oc<strong>to</strong>ber<br />
2011].<br />
Heberlein, D., Rebagliati, C.M. and Hoffman, S.J. (1984): 1984<br />
Geological and geochemical exploration activities, Phil A,<br />
B, and 1, claim groups; <strong>BC</strong> Ministry of Energy and Mines,<br />
Assessment Report 12912, 290 p., URLs ,<br />
<br />
[Oc<strong>to</strong>ber 2011].<br />
Lefebure, D.V. and Ray, G.E., edi<strong>to</strong>rs (1995): Selected British Columbia<br />
mineral deposit pro<strong>file</strong>s, <strong>volume</strong> 1 – metallics and<br />
coal; <strong>BC</strong> Ministry of Energy and Mines, Open File 1995-20,<br />
135 p., URL
<strong>Geoscience</strong>/PublicationsCatalogue/OpenFiles/1995/Pages/<br />
1995-20.<strong>as</strong>px> [Oc<strong>to</strong>ber 2011].<br />
Lett, R.E. and Jackaman, W. (2000): Geochemical exploration<br />
models, <strong>volume</strong> 1: VMS deposits in south central <strong>BC</strong>; <strong>BC</strong><br />
Ministry of Energy and Mines, Open File 2000-31, 31 p.,<br />
maps, CD-ROM.<br />
Lett, R.E. (2001): Geochemical exploration models, <strong>volume</strong> 2:<br />
shale-hosted Pb-Zn-Ag deposits in NE <strong>BC</strong>; <strong>BC</strong> Ministry of<br />
Energy and Mines, Open File 2001-7, 70 p., maps, appendices,<br />
URL [Oc<strong>to</strong>ber 2011].<br />
Lett, R.E.W. and Bradshaw, P. (2003): Atl<strong>as</strong> of landscape geochemical<br />
models for porphyry copper, VMS and gold deposits<br />
in <strong>the</strong> Cordillera from Al<strong>as</strong>ka <strong>to</strong> Nevada; Association of<br />
Applied Geochemists, Explore newsletter, no. 118, p. 20–<br />
23.<br />
M<strong>as</strong>sey, N.W.D., MacIntyre, D.G., Desjardins, P.J. and Cooney,<br />
R.T. (2005): Digital geology map of British Columbia:<br />
whole province; <strong>BC</strong> Ministry of Forests, Lands and Mines,<br />
GeoFile 2005-1, URL [Oc<strong>to</strong>ber 2011].<br />
McNaugh<strong>to</strong>n, K (1987): 1986 geochemical, geophysical and drilling<br />
report on <strong>the</strong> BJ, Bootjack, CB and Polley mineral<br />
claims; <strong>BC</strong> Ministry of Energy and Mines, Assessment Report<br />
16040, 494 p., URLs , , [Oc<strong>to</strong>ber<br />
2011].<br />
Sibbick, S.J., Balma, R.G. and Dunn, C.E. (1997): Till geochemistry<br />
of <strong>the</strong> Mount Milligan area; <strong>BC</strong> Ministry of Energy and<br />
Mines, Open File 1996-22, 18 p., URL<br />
[Oc<strong>to</strong>ber<br />
2011].<br />
University of British Columbia (2011): Climate<strong>BC</strong>: a program <strong>to</strong><br />
generate climate normal data for genecology and climate<br />
change studies in western Canada; University of British Columbia,<br />
Centre for Forest Conservation Genetics, URL<br />
<br />
[Oc<strong>to</strong>ber 2011].<br />
40 <strong>Geoscience</strong> <strong>BC</strong> Summary of Activities 2011
Fluid Controls on Ore Genesis in <strong>the</strong> Eskay Creek Deposit, Northwestern British<br />
Columbia (NTS 104B/09, /10)<br />
T. Meuzelaar, Department of Geology and Geological Engineering, Colorado School of Mines, Golden CO,<br />
tmeuzela@mymail.mines.edu<br />
T. Monecke, Department of Geology and Geological Engineering, Colorado School of Mines, Golden CO<br />
Meuzelaar, T. and Monecke, T. (2012): Fluid controls on ore genesis in <strong>the</strong> Eskay Creek deposit, northwestern British Columbia (NTS<br />
104B/09, /10); in <strong>Geoscience</strong> <strong>BC</strong> Summary of Activities 2011, <strong>Geoscience</strong> <strong>BC</strong>, Report 2012-1, p. 41–52.<br />
Abstract<br />
Geochemical modelling w<strong>as</strong> performed <strong>to</strong> constrain fluid<br />
controls on <strong>the</strong> formation of <strong>the</strong> Eskay Creek sulphide and<br />
sulphosalt deposit in northwestern British Columbia. Using<br />
recently published H 2 S solubility data, models of<br />
seafloor sulphide precipitation were developed for several<br />
modern seafloor vents of known fluid compositions. The<br />
modelling suggests that a fluid with a pH of 4.5–5.0 could<br />
have precipitated sphalerite at Eskay Creek at temperatures<br />
of 180–220ºC. Such a fluid could have sufficient alkalinity<br />
<strong>to</strong> reach carbonate saturation, which is required <strong>to</strong> explain<br />
<strong>the</strong> origin of <strong>the</strong> carbonate-kaolinite alteration in <strong>the</strong><br />
muds<strong>to</strong>ne hosting <strong>the</strong> stratiform orebodies of cl<strong>as</strong>tic sulphide<br />
and sulphosalt deposits. The geochemical modelling<br />
demonstrates that <strong>the</strong> Eskay Creek deposit formed from a<br />
near-neutral and relatively reducing fluid. As <strong>the</strong> chemical<br />
character of <strong>the</strong> hydro<strong>the</strong>rmal fluid is not unusual for submarine<br />
hydro<strong>the</strong>rmal systems, exploration for volcanichosted,<br />
precious-metal deposits such <strong>as</strong> Eskay Creek can be<br />
guided by criteria not unlike those used in <strong>the</strong> search for<br />
conventional m<strong>as</strong>sive sulphide deposits.<br />
Purpose of Research<br />
The Eskay Creek deposit (MINFILE 104B 008; <strong>BC</strong> Geological<br />
Survey, 2011) in northwestern <strong>BC</strong> represents an unusual<br />
volcanic-hosted sulphide and sulphosalt deposit that<br />
is characterized by high precious-metal concentrations (average<br />
of 48.4 g/t Au and 132.2 g/t Ag), a geochemical <strong>as</strong>sociation<br />
of <strong>the</strong> precious metals with <strong>the</strong> epi<strong>the</strong>rmal suite of<br />
elements, and low temperatures (
dian Cordillera (Figure 1). The hostrock succession of <strong>the</strong><br />
deposit is part of <strong>the</strong> Upper Hazel<strong>to</strong>n Group, which formed<br />
by extensional, continental-margin arc volcanism between<br />
181 and 172 Ma (Barrett and Sherlock, 1996; Childe,<br />
1996).<br />
The hostrocks of <strong>the</strong> deposit are folded in<strong>to</strong> a shallowly<br />
north-plunging, north-nor<strong>the</strong><strong>as</strong>t-trending, upright open<br />
anticline (Figure 1). The ore zones of <strong>the</strong> Eskay Creek deposit<br />
occur on <strong>the</strong> western limb of <strong>the</strong> fold, near <strong>the</strong> fold<br />
closure, and dip gently 30–45° <strong>to</strong> <strong>the</strong> west. The metamorphic<br />
grade in <strong>the</strong> mine area is lower greenschist (Roth et al.,<br />
1999). The bulk of <strong>the</strong> mineralization consists of stratiform<br />
cl<strong>as</strong>tic beds and laminations of commonly graded sulphide<br />
and sulphosalt debris, which are hosted by a thick interval<br />
of carbonaceous muds<strong>to</strong>ne at <strong>the</strong> contact between felsic<br />
volcanic rocks and overlying b<strong>as</strong>alt (Brit<strong>to</strong>n et al., 1990;<br />
Ettlinger, 1992). In addition <strong>to</strong> <strong>the</strong> stratiform orebodies,<br />
economic concentrations of precious metals have been recognized<br />
in discordant zones of sulphide veins and disseminations<br />
in <strong>the</strong> footwall rhyolite.<br />
The stratigraphic footwall of <strong>the</strong> deposit is composed of<br />
multiple rhyolite units and <strong>as</strong>sociated volcanicl<strong>as</strong>tic deposits,<br />
reaching a maximum apparent thickness of approximately<br />
100 m in <strong>the</strong> mine area (Brit<strong>to</strong>n et al., 1990). Hydro<strong>the</strong>rmal<br />
alteration is widespread throughout <strong>the</strong> footwall<br />
rhyolite (Robinson, 1991; Barrett and Sherlock, 1996).<br />
Secondary pot<strong>as</strong>sium-feldspar formation and moderate<br />
silicification occurred in <strong>the</strong> periphery of <strong>the</strong> stratiform<br />
ores and in deeper parts of <strong>the</strong> footwall. Immediately underlying<br />
<strong>the</strong> stratiform ore zones, a tabular zone of more intense<br />
and texturally destructive chlorite and white mica alteration<br />
is recognized (Ettlinger, 1992; Roth et al., 1999).<br />
An unusual hydrocarbon alteration occurs locally below<br />
<strong>the</strong> stratiform ore zones (Ettlinger, 1992; Barrett and Sherlock,<br />
1996; Roth et al., 1999).<br />
The footwall rhyolite is overlain by carbonaceous muds<strong>to</strong>ne,<br />
which hosts <strong>the</strong> stratiform ore zones of cl<strong>as</strong>tic sulphide<br />
and sulphosalt deposits. The carbonaceous muds<strong>to</strong>ne<br />
h<strong>as</strong> an apparent stratigraphic thickness that ranges from 60 m (Brit<strong>to</strong>n et al., 1990); it is laminated, thinly bedded<br />
or m<strong>as</strong>sive and contains abundant intercalated, tan-coloured<br />
beds of fine-grained volcanicl<strong>as</strong>tic material. Calcareous<br />
and siliceous intervals are present, but not common.<br />
The carbon content generally decre<strong>as</strong>es <strong>to</strong>ward <strong>the</strong> <strong>to</strong>p of<br />
<strong>the</strong> unit. The muds<strong>to</strong>ne contains radiolarians, dinoflagellates,<br />
rare belemnites and corals, suggesting a marine<br />
depositional environment (Brit<strong>to</strong>n et al., 1990; Robinson,<br />
Figure 1. Geology of <strong>the</strong> Eskay Creek anticline, showing <strong>the</strong> location of <strong>the</strong> surface projection of <strong>the</strong> ore zones (modified from Alldrick et al.,<br />
2005). Inset shows <strong>the</strong> location of <strong>the</strong> deposit in <strong>the</strong> Stikine terrane (modified from Gabrielse et al., 1991).<br />
42 <strong>Geoscience</strong> <strong>BC</strong> Summary of Activities 2011
1991; Nadaraju, 1993; Monecke et al., 2005). Thin pyrite<br />
laminations are common throughout <strong>the</strong> unit. The occurrence<br />
of flame structures at <strong>the</strong> b<strong>as</strong>e of <strong>the</strong> sulphide laminations<br />
indicates that <strong>the</strong> pyrite is cl<strong>as</strong>tic in origin (Brit<strong>to</strong>n et<br />
al., 1990; Monecke et al., 2005). In addition <strong>to</strong> <strong>the</strong> sulphide<br />
laminations, thin veins and veinlets of pyrite crosscutting<br />
bedding are widespread close <strong>to</strong> <strong>the</strong> contact with <strong>the</strong><br />
underlying rhyolite.<br />
B<strong>as</strong>alt sills and dikes occur throughout <strong>the</strong> carbonaceous<br />
muds<strong>to</strong>ne unit. The occurrence of muds<strong>to</strong>ne-matrix b<strong>as</strong>alt<br />
breccia along <strong>the</strong> bot<strong>to</strong>m and <strong>to</strong>p margins of coherent b<strong>as</strong>alt<br />
intervals indicates that <strong>the</strong> lava intruded <strong>the</strong> muds<strong>to</strong>ne<br />
when it w<strong>as</strong> still wet and unconsolidated (Monecke et al.,<br />
2005). The relative proportion of b<strong>as</strong>alt incre<strong>as</strong>es in <strong>the</strong> upper<br />
part of <strong>the</strong> hostrock succession of <strong>the</strong> Eskay Creek deposit.<br />
Both intrusive and extrusive b<strong>as</strong>alt units occur at this<br />
stratigraphic level, forming an interval up <strong>to</strong> 150 m thick,<br />
which generally thins southward, away from <strong>the</strong> deposit<br />
(Brit<strong>to</strong>n et al., 1990).<br />
Previous work<br />
Results of a detailed mineralogical and geochemical study<br />
of <strong>the</strong> carbonaceous muds<strong>to</strong>ne hosting <strong>the</strong> Eskay Creek deposit<br />
(Meuzelaar and Monecke, 2011) revealed a number of<br />
important geochemical trends, which can be used both for<br />
numerical-model parameterization and target vec<strong>to</strong>ring<br />
when exploring for precious and b<strong>as</strong>e metals. The occurrence<br />
of carbonate minerals appears <strong>to</strong> correlate with <strong>the</strong><br />
distance <strong>to</strong> <strong>the</strong> mineralized zones, with higher dolomite-ankerite<br />
and magnesite-siderite abundances indicating proximity<br />
<strong>to</strong> <strong>the</strong> ore zones at <strong>the</strong> b<strong>as</strong>e of <strong>the</strong> muds<strong>to</strong>ne unit.<br />
Magnesian calcite is abundant in <strong>the</strong> stratigraphic hangingwall<br />
proximal <strong>to</strong> <strong>the</strong> stratiform ore zones.<br />
In addition <strong>to</strong> carbonate alteration, which appears <strong>to</strong> be <strong>the</strong><br />
most reliable vec<strong>to</strong>r of proximity within tens <strong>to</strong> hundreds of<br />
metres of mineralized zones, <strong>the</strong> composition of chlorite<br />
appears <strong>to</strong> vary systematically. Chlorite close <strong>to</strong> mineralization<br />
is characterized by an incre<strong>as</strong>ed Mg content, which<br />
is consistent with compositional trends observed in <strong>the</strong> carbonate<br />
mineralogy. Local silicification of muds<strong>to</strong>ne h<strong>as</strong><br />
been noted. Strongly altered muds<strong>to</strong>ne samples collected<br />
close <strong>to</strong> <strong>the</strong> upflow zones of hydro<strong>the</strong>rmal fluids are characterized<br />
by Na 2 O depletion, which is caused by feldspardestructive<br />
alteration commonly <strong>as</strong>sociated with submarine<br />
sulphide mineralization (e.g., Large, 1977; Schardt et<br />
al., 2001). Proximity <strong>to</strong> mineralization is also reflected in<br />
elevated F contents in sheet silicates, systematic changes in<br />
<strong>the</strong> Cs/Rb ratio of white mica and <strong>the</strong> Ni/V ratio in organic<br />
carbon.<br />
The muds<strong>to</strong>ne samples show incre<strong>as</strong>es in <strong>the</strong> galena, chalcopyrite<br />
and sphalerite contents with proximity <strong>to</strong> ore. Pyrite<br />
contained in background muds<strong>to</strong>ne samples is mostly<br />
of diagenetic origin. However, pyrite that is distinctly enriched<br />
in As h<strong>as</strong> also been recognized This type of pyrite is<br />
interpreted <strong>to</strong> have formed in <strong>as</strong>sociation with <strong>the</strong> sulphide<br />
and sulphosalt mineralization. Mineralogical variations in<br />
<strong>the</strong> muds<strong>to</strong>ne samples in proximity <strong>to</strong> ore are reflected by<br />
incre<strong>as</strong>ed Ag, As, Au, Cd, Cu, Sb, Pb, Te and Zn concentrations<br />
in whole-rock geochemical analyses. There is a strong<br />
correlation between <strong>the</strong> precious- and b<strong>as</strong>e-metal contents<br />
of <strong>the</strong> carbonaceous muds<strong>to</strong>ne, which is reflective of <strong>the</strong><br />
overall metal signature of <strong>the</strong> Eskay Creek deposit.<br />
H 2 S Solubility<br />
Numerical simulation of <strong>the</strong> ore-forming processes at<br />
Eskay Creek and of those responsible for <strong>the</strong> formation of<br />
<strong>the</strong> <strong>as</strong>sociated carbonate-kaolinite alteration halo requires<br />
an adequate description of <strong>the</strong> H 2 S solubility in <strong>the</strong><br />
hydro<strong>the</strong>rmal fluids.<br />
Duan et al. (2007) summarized <strong>the</strong> results of previous experimental<br />
investigations, which have thus far been conducted<br />
only under a comparably narrow range of temperatures,<br />
pressures and salinities. Duan et al. (2007) also<br />
discussed <strong>the</strong> limitations of <strong>the</strong> various experimental studies<br />
and proposed a new <strong>the</strong>rmodynamic model calculating<br />
<strong>the</strong> H 2 S solubility in pure water and aqueous NaCl solutions.<br />
The model calculates <strong>the</strong> chemical potential of H 2 Sin<br />
<strong>the</strong> vapour ph<strong>as</strong>e using <strong>the</strong> equation of state presented in<br />
Duan et al. (1996), where<strong>as</strong> <strong>the</strong> chemical potential of H 2 Sin<br />
<strong>the</strong> liquid ph<strong>as</strong>e is modelled using <strong>the</strong> approach described<br />
by Pitzer (1973). The proposed model is valid for solutions<br />
of varied electrolyte compositions, with ionic strengths<br />
(me<strong>as</strong>ured in terms of <strong>the</strong> NaCl molality) of 0–6 molal, at<br />
temperatures of 0–227°C, and H 2 S fugacities of 0–200 bar<br />
(an online solubility calcula<strong>to</strong>r is available at http://<br />
calc.geochem-model.org/).<br />
To conduct modelling for <strong>the</strong> present study, <strong>the</strong> H 2 S-solubility<br />
data of Duan et al. (2007) w<strong>as</strong> initially used <strong>to</strong> calculate<br />
<strong>the</strong> equilibrium constant K for <strong>the</strong> reaction and <strong>the</strong> corresponding<br />
m<strong>as</strong>s-action equation<br />
H 2 S(aq) = H 2 S(g)<br />
K=f[H 2 S(g)]/a[H 2 S(aq)] (1)<br />
where f is <strong>the</strong> fugacity of <strong>the</strong> g<strong>as</strong> and a is <strong>the</strong> activity of H 2 S<br />
in <strong>the</strong> solution. The fugacity of H 2 S <strong>as</strong> a g<strong>as</strong> and <strong>the</strong> activity<br />
of H 2 S in solution were made dimensionless b<strong>as</strong>ed on <strong>the</strong><br />
choice of an appropriate standard state (Bethke, 2008).<br />
The values of <strong>the</strong> equilibrium-constant K for different temperatures<br />
calculated this way were inserted in<strong>to</strong> <strong>the</strong> Lawrence<br />
Livermore National Labora<strong>to</strong>ry (LLNL) <strong>the</strong>rmochemical<br />
datab<strong>as</strong>e (Delany and Lundeen, 1990), replacing<br />
<strong>the</strong> equilibrium constants originally given in <strong>the</strong> datab<strong>as</strong>e.<br />
The original equilibrium constants for <strong>the</strong> LLNL and <strong>the</strong><br />
extended LLNL <strong>the</strong>rmochemical datab<strong>as</strong>es at temperatures<br />
ranging from 0 <strong>to</strong> 300ºC are given in Figure 2.<br />
<strong>Geoscience</strong> <strong>BC</strong> Report 2012-1 43
Figure 2. Temperature dependency of <strong>the</strong> equilibrium-constant K for <strong>the</strong> reaction<br />
H 2 S(aq) = H 2 S(g), according <strong>to</strong> <strong>the</strong> Lawrence Livermore National Labora<strong>to</strong>ry<br />
(LLNL) <strong>the</strong>rmochemical datab<strong>as</strong>e (Delany and Lundeen, 1990) and<br />
<strong>the</strong> extended LLNL datab<strong>as</strong>e.<br />
The corrected equilibrium-constant data for <strong>the</strong> same temperature<br />
range, at ionic strengths of 0–2 molal and H 2 S<br />
fugacities of 0–200 atm, are shown in Figure 3. Inspection<br />
of <strong>the</strong> data shows that <strong>the</strong> ionic strength h<strong>as</strong> little influence<br />
on <strong>the</strong> equilibrium constant. Comparison with <strong>the</strong> original<br />
equilibrium constants in both LLNL datab<strong>as</strong>es reveals that<br />
<strong>the</strong>y significantly underpredict H 2 S solubility above 150°C<br />
at H 2 S fugacities ranging from 1 <strong>to</strong> 40 atm. Duan et al.<br />
(2007) also noted that equilibrium constants calculated using<br />
<strong>the</strong> SUPCRT92 software (Johnson et al., 1992) underestimate<br />
H 2 S solubility above 150ºC. At 50 atm, <strong>the</strong> LLNL<br />
data underpredict solubility across <strong>the</strong> <strong>entire</strong> temperature<br />
range, where<strong>as</strong> at higher fugacities of 100–200 atm both<br />
LLNLdatab<strong>as</strong>es underpredict H 2 S solubility below 100ºC.<br />
As a final step, <strong>the</strong> equilibrium constants describing <strong>the</strong> HS -<br />
and H + partitioning were corrected in <strong>the</strong> LLNL datab<strong>as</strong>e.<br />
The solubility data for dissolved H 2 S and vapour-ph<strong>as</strong>e<br />
H 2 S are given by <strong>the</strong> following two reactions:<br />
H 2 S(aq) = H + +HS - (2)<br />
H 2 S(g) = H + +HS - (3)<br />
Given that HS - and H + partitioning data for <strong>the</strong> P-T-x NaCl<br />
range of <strong>the</strong> solubility model from Duan et al. (2007) are<br />
not available, it is not possible <strong>to</strong> quantify equilibrium constants<br />
for <strong>the</strong>se reactions. As reaction (1) is simply reaction<br />
(3) subtracted from reaction (2), <strong>the</strong> LLNL datab<strong>as</strong>e w<strong>as</strong><br />
modified <strong>to</strong> calculate <strong>the</strong> equilibrium constant k1 for reaction<br />
(1) from Duan et al. (2007) followed by <strong>the</strong> subtraction<br />
of k1 from k2, <strong>the</strong> equilibrium constant for reaction (2).<br />
This yields k3, <strong>the</strong> equilibrium constant for reaction (3),<br />
which w<strong>as</strong> used <strong>to</strong> replace <strong>the</strong> existing values in <strong>the</strong> LLNL<br />
datab<strong>as</strong>e.<br />
Following correction of <strong>the</strong> equilibrium-constant data, <strong>the</strong><br />
LLNL datab<strong>as</strong>e w<strong>as</strong> used for modelling of <strong>the</strong> present<br />
study. It is important <strong>to</strong> note that <strong>the</strong> datab<strong>as</strong>e is configured<br />
for modelling at 1 atm, temperatures of 0–300ºC and activities<br />
calculated according <strong>to</strong> <strong>the</strong> B-dot equation of Helgeson<br />
et al. (1969) and Helgeson and Kirkham (1974). The 1 atm<br />
steam-saturation limitation appears somewhat troublesome<br />
given that seafloor hydro<strong>the</strong>rmal venting occurs at a confining<br />
pressure corresponding <strong>to</strong> <strong>the</strong> hydrostatic pressure at<br />
a water depth of several hundreds <strong>to</strong> thousands of metres.<br />
However, Duan et al. (2007) pointed out that <strong>the</strong> fugacity<br />
coefficient of H 2 S in <strong>the</strong> vapour ph<strong>as</strong>e of H 2 S-H 2 O mixtures<br />
differs little from that of pure H 2 S within <strong>the</strong> temperature<br />
range of <strong>the</strong> model. As long <strong>as</strong> fluid temperature and hydrostatic<br />
confining pressure are below <strong>the</strong> two-ph<strong>as</strong>e curve for<br />
seawater (Bischoff and Rosenbauer, 1984), H 2 S solubility<br />
can be estimated from H 2 S fugacity apart from <strong>the</strong> saturation<br />
pressure of H 2 O. Ohmo<strong>to</strong> (1996) showed that <strong>the</strong> twoph<strong>as</strong>e<br />
curve of seawater is indeed an important control on<br />
<strong>the</strong> formation of modern, seafloor m<strong>as</strong>sive-sulphide accumulations.<br />
An additional constraint on modelling is imposed<br />
by <strong>the</strong> fact that <strong>the</strong> LLNL datab<strong>as</strong>e is valid only for<br />
solutions with ionic strengths of up <strong>to</strong> 3.0 molal if Na and Cl<br />
are <strong>the</strong> dominant solutes. This condition is met in <strong>the</strong> c<strong>as</strong>e<br />
of most chloride waters sampled from modern seafloor vent<br />
sites (cf. Hanning<strong>to</strong>n et al., 2005).<br />
Models of Sulphide Precipitation in Modern<br />
Vent Analogues<br />
The quality of <strong>the</strong> equilibrium-constant data calculated<br />
above w<strong>as</strong> evaluated by modelling sulphide precipitation<br />
from chloride waters of known compositions, which were<br />
sampled at modern seafloor vent sites. For this purpose, <strong>the</strong><br />
44 <strong>Geoscience</strong> <strong>BC</strong> Summary of Activities 2011
comprehensive compilation of modern seafloor fluid compositions<br />
by Hanning<strong>to</strong>n et al. (2005) w<strong>as</strong> used. Although<br />
<strong>the</strong> datab<strong>as</strong>e provides vent-fluid compositions for about 60<br />
active vent sites worldwide, only 12 chloride waters were<br />
chosen for <strong>the</strong> present study. Most chloride waters ei<strong>the</strong>r<br />
had temperatures exceeding <strong>the</strong> limits of <strong>the</strong> solubility<br />
model (227ºC) by Duan et al. (2007) and <strong>the</strong> LLNL<br />
<strong>the</strong>rmochemical datab<strong>as</strong>e (300ºC) or were not analyzed for<br />
all parameters required for geochemical modelling. In addition,<br />
<strong>the</strong> higher temperature vent fluids are likely poor analogues<br />
<strong>as</strong> sulphide and sulphosalt deposition at Eskay<br />
Creek occurred largely at temperatures below 200ºC (Sherlock<br />
et al., 1999). The compositions of <strong>the</strong> 12 representative<br />
modern seafloor chloride waters are summarized in<br />
Table 1. Their pH values and contents of <strong>to</strong>tal dissolved<br />
solids are plotted in Figure 4.<br />
The 12 chloride waters represent four different tec<strong>to</strong>nic settings,<br />
including mid-ocean ridges, sedimented ridges,<br />
ridge-hotspot intersections and back-arc spreading centres<br />
and/or rifts; <strong>the</strong> latter is probably closest <strong>to</strong> <strong>the</strong> tec<strong>to</strong>nic setting<br />
of <strong>the</strong> Eskay Creek deposit. Table 1 shows that <strong>the</strong> pH<br />
of <strong>the</strong> hydro<strong>the</strong>rmal fluids broadly correlates with platetec<strong>to</strong>nic<br />
setting and generally decre<strong>as</strong>es from sedimented<br />
ridges (pH = 5.0–6.0), <strong>to</strong> ridge-hotspot intersections<br />
(pH = 4.0–4.5), mid-ocean ridges (pH = 3.0–4.0) and back-<br />
Figure 3. Temperature dependency of <strong>the</strong> equilibrium-constant K for <strong>the</strong> reaction H 2 S(aq) = H2S(g) at five selected<br />
H 2 S fugacities and ionic strengths (NaCl molality) ranging from 0 <strong>to</strong> 2.0 molal (calculation is b<strong>as</strong>ed on<br />
Duan et al., 2007).<br />
<strong>Geoscience</strong> <strong>BC</strong> Report 2012-1 45
Table 1. Composition of representative chloride waters from modern seafloor vent sites located in different tec<strong>to</strong>nic<br />
settings (data compilation from Hanning<strong>to</strong>n et al., 2005).<br />
arc spreading centres and/or rifts (pH = 2.5–4.0). The<br />
higher pH of <strong>the</strong> chloride waters from sedimented ridges is<br />
likely a reflection of <strong>the</strong> neutralizing capacity of <strong>the</strong> sedimentary<br />
hostrocks. Figure 5 shows that <strong>the</strong> Zn and Pb concentrations<br />
for ten of <strong>the</strong> vent samples (data for two samples<br />
are ei<strong>the</strong>r missing or below detection limit) are generally inversely<br />
proportional <strong>to</strong> pH, suggesting that <strong>the</strong> more acidic<br />
fluids have a higher capacity for transporting metals.<br />
One representative chloride water sample from each of <strong>the</strong><br />
four tec<strong>to</strong>nic settings, generally representing a median content<br />
of <strong>to</strong>tal dissolved solids, w<strong>as</strong> selected for numerical<br />
Figure 4. Scatter diagram of acidity (pH at 25°C) versus contents of <strong>to</strong>tal dissolved solids<br />
for representative chloride waters collected from different modern seafloor vent<br />
sites (data from Hanning<strong>to</strong>n et al., 2005). The composition of seawater is given for comparison.<br />
Abbreviations: AS, Axial Seamount; BH, Bent Hill; DD, Dead Dog; EP, 21ºN,<br />
EPR; GY, Guaym<strong>as</strong>; MG, Menez Gwen; NC, North Cleft; PC, Pacmanus; SC, South<br />
Cleft; SE, 17ºN, SEPR; VW, Vienna Wood.<br />
46 <strong>Geoscience</strong> <strong>BC</strong> Summary of Activities 2011
Table 1 (continued)<br />
modelling. The four sites chosen were South Cleft (midocean<br />
ridge), Dead Dog (sedimented ridge), Menez Gwen<br />
(ridge-hotspot intersection), and Pacmanus (back-arc rift).<br />
The four modelled vent fluids were speciated and cooled<br />
via simple, poly<strong>the</strong>rmal reaction-path models at fixed H 2 S<br />
fugacities (constrained by aqueous-H 2 S concentrations of<br />
<strong>the</strong> vent fluids) using The Geochemist’s Workbench ® software<br />
(Bethke, 2008) and <strong>the</strong> LLNL <strong>the</strong>rmochemical datab<strong>as</strong>e,<br />
modified using H 2 S-solubility corrections from Duan<br />
et al. (2007) at discrete pressures of 5–200 atm. Figure 6<br />
shows an example output for one of <strong>the</strong> reaction-path<br />
models.<br />
Modelling showed that <strong>the</strong> chalcopyrite mineral-solubility<br />
data in <strong>the</strong> LLNL datab<strong>as</strong>e yielded incorrect results. Consequently,<br />
data from <strong>the</strong> MINTEQ datab<strong>as</strong>e (Allison et al.,<br />
1991) w<strong>as</strong> used. As H 2 S-solubility data calculated according<br />
<strong>to</strong> Duan et al. (2007) are only slightly affected by<br />
Figure 5. Scatter diagram of Zn versus Pb for representative chloride waters collected from different<br />
modern seafloor vent sites (data from Hanning<strong>to</strong>n et al., 2005). Abbreviations: AS, Axial<br />
Seamount; BH, Bent Hill; DD, Dead Dog; EP, 21ºN, EPR; GY, Guaym<strong>as</strong>; NC, North Cleft; PC,<br />
Pacmanus; SC, South Cleft; VW, Vienna Wood.<br />
<strong>Geoscience</strong> <strong>BC</strong> Report 2012-1 47
Figure 6. Results of a poly<strong>the</strong>rmal reaction-path model using The Geochemist’s<br />
Workbench® software (Bethke, 2008) for chloride waters from <strong>the</strong> Pacmanus vent<br />
site. Chalcopyrite precipitation w<strong>as</strong> modelled using <strong>the</strong>rmodynamic data from <strong>the</strong><br />
MINTEQ datab<strong>as</strong>e (Allison et al., 1991). All o<strong>the</strong>r sulphides are modelled using<br />
data from <strong>the</strong> Lawrence Livermore National Labora<strong>to</strong>ry datab<strong>as</strong>e.<br />
changes in ionic strength, a mid-range ionic strength of<br />
1.0 molal (<strong>to</strong>tal dissolved solids of 55 g/kg) w<strong>as</strong> chosen so<br />
that only H 2 S corrections for temperature and pressure required<br />
evaluation. Figure 7 shows calculated dissolved H 2 S<br />
concentrations at 1.0 molal ionic strength for discrete temperatures<br />
between 0 and 300ºC, using <strong>the</strong> modified LLNL<br />
dat<strong>as</strong>ets at pressures between 5 and 200 atm. Solubility data<br />
above <strong>the</strong> temperature limit (227ºC) of <strong>the</strong> model by Duan<br />
et al. (2007) and above boiling temperatures and below <strong>the</strong><br />
boiling pressures were estimated using polynomial-trend<br />
fits.<br />
Me<strong>as</strong>ured dissolved H 2 S concentrations of <strong>the</strong> four vent<br />
fluids ranged from 0.0016 molal at Menez Gwen <strong>to</strong><br />
0.0068 molal at Pacmanus. Figure 7 can be applied <strong>to</strong> estimate<br />
H 2 S fugacity using dissolved-H 2 S concentrations and<br />
vent temperatures (<strong>the</strong> plot cannot be used <strong>to</strong> estimate mineralization<br />
depth <strong>as</strong> H 2 S fugacity is independent of watersaturation<br />
pressure). In addition, <strong>the</strong>re is a high uncertainty<br />
in <strong>the</strong> H 2 S-solubility curves at high temperatures and low<br />
pressures, <strong>as</strong> solubility curves in this region contain extrapolated<br />
data. None<strong>the</strong>less, first-order estimates suggest H 2 S<br />
fugacities of 10–20 atm at South Cleft, and of 30–40 atm at<br />
Dead Dog, Menez Gwen and Pacmanus.<br />
Figure 7.TheH 2 S-solubility data derived from <strong>the</strong> model presented in Duan et al. (2007) plotted<br />
<strong>as</strong> a function of temperature for different H 2 S fugacities.<br />
48 <strong>Geoscience</strong> <strong>BC</strong> Summary of Activities 2011
Figure 8. Temperatures of first precipitation of chalcopyrite, pyrite, galena and sphalerite for chloride waters sampled from <strong>the</strong> South Cleft,<br />
Dead Dog, Menez Gwen and Pacmanus vent sites at a range of H 2 S fugacities.<br />
Figure 8 shows <strong>the</strong> temperatures of first precipitation of<br />
chalcopyrite, pyrite, galena and sphalerite for H 2 S<br />
fugacities ranging from 5 <strong>to</strong> 200 atm. In general, precipitation<br />
temperatures are proportional <strong>to</strong> fluid pH, with nearneutral<br />
fluids from Dead Dog precipitating sulphides at <strong>the</strong><br />
highest temperatures, where<strong>as</strong> <strong>the</strong> chloride waters at South<br />
Cleft and Pacmanus precipitate sulphides at distinctly<br />
lower temperatures (Table 2). The calculated sulphide-precipitation<br />
temperatures conform closely <strong>to</strong> observations<br />
made on <strong>the</strong> modern seafloor (cf. Hanning<strong>to</strong>n et al., 2005).<br />
Homogenization temperatures of fluid inclusions in<br />
sphalerite from Eskay Creek range up <strong>to</strong> 180–220ºC<br />
(Sherlock et al., 1999). Modelling of <strong>the</strong> present study suggests<br />
that a fluid with a pH of 4.0–5.0 is necessary <strong>to</strong> generate<br />
sphalerite at <strong>the</strong>se temperatures (<strong>as</strong>suming that <strong>the</strong> homogenization<br />
temperatures are similar <strong>to</strong> <strong>the</strong> temperatures<br />
of formation). The crossover pH between CO 2 dissolved in<br />
chloride waters and <strong>the</strong> generation of bicarbonate waters is<br />
approximately 4.5 at 200ºC (Bischoff and Rosenbauer,<br />
1996). This suggests that a fluid with a pH somewhat higher<br />
Table 2. Calculated sulphide-precipitation temperatures for four representative modern seafloor vent sites.<br />
<strong>Geoscience</strong> <strong>BC</strong> Report 2012-1 49
than that of <strong>the</strong> chloride waters from Menez Gwen would<br />
be capable of reaching carbonate saturation under those<br />
conditions, which would have been critical for generating<br />
<strong>the</strong> carbonate-kaolinite alteration halo at Eskay Creek. Although<br />
<strong>the</strong> hydro<strong>the</strong>rmal fluids venting at Pacmanus represent<br />
<strong>the</strong> closest modern analogue <strong>to</strong> <strong>the</strong> mineralizing fluids<br />
at Eskay Creek in terms of tec<strong>to</strong>nic setting and local hostrock<br />
composition, <strong>the</strong> numerical modelling shows that <strong>the</strong><br />
alkalinity and pH of <strong>the</strong> chloride waters venting at<br />
Pacmanus are <strong>to</strong>o low <strong>to</strong> explain <strong>the</strong> formation of <strong>the</strong> carbonate-kaolinite<br />
alteration halo observed at Eskay Creek.<br />
This alteration must have been caused by a bicarbonate<br />
water of higher alkalinity and near-neutral pH.<br />
Future Modelling Work<br />
The present modelling, largely b<strong>as</strong>ed on <strong>the</strong>rmochemical<br />
data from <strong>the</strong> LLNL datab<strong>as</strong>e, successfully evaluated <strong>the</strong><br />
role of simple cooling on sulphide precipitation in seafloor<br />
hydro<strong>the</strong>rmal vents of different compositions. Predicted<br />
sulphide-precipitation temperatures closely conformed <strong>to</strong><br />
seafloor observations, indicating that <strong>the</strong> data of Duan et al.<br />
(2007) provide a reliable approximation of H 2 S solubility.<br />
Modelling of <strong>the</strong> present study also showed that chalcopyrite-solubility<br />
data from <strong>the</strong> MINTEQ dat<strong>as</strong>et (Allison et<br />
al., 1991) is more reliable than that from <strong>the</strong> LLNL datab<strong>as</strong>e.<br />
Future modelling will evaluate whe<strong>the</strong>r MINTEQ<br />
data are also more appropriate <strong>to</strong> describe solubility for<br />
o<strong>the</strong>r sulphide ph<strong>as</strong>es commonly precipitating at seafloor<br />
hydro<strong>the</strong>rmal vents.<br />
Following adequate description of sulphide precipitation,<br />
geochemical modelling will focus on <strong>the</strong> formation of <strong>the</strong><br />
carbonate-kaolinite alteration at Eskay Creek, which represents<br />
for exploration <strong>the</strong> most useful vec<strong>to</strong>r <strong>to</strong> mineralization.<br />
This will require a better understanding of <strong>the</strong> controls<br />
on carbonate solubility, which is a direct function of dissolved<br />
and vapour-ph<strong>as</strong>e CO 2 concentrations. Similar <strong>to</strong><br />
<strong>the</strong> H 2 S-solubility data, CO 2 solubility in most <strong>the</strong>rmochemical<br />
datab<strong>as</strong>es is currently only parameterized at low<br />
pressures and temperatures. To overcome this problem, <strong>the</strong><br />
CO 2 -solubility model of Duan and Sun (2003) and Duan et<br />
al. (2006), which is accurate over geologically relevant<br />
temperatures, pressures and fluid-solute levels, will be<br />
implemented using <strong>the</strong> approach established in this paper.<br />
Once H 2 SandCO 2 solubility in <strong>the</strong> mineralizing hydro<strong>the</strong>rmal<br />
fluids is correctly described over <strong>the</strong> relevant pressure<br />
and temperature ranges, geochemical modelling will be<br />
able <strong>to</strong> show whe<strong>the</strong>r simple interaction with <strong>the</strong> wallrock<br />
and simple cooling of <strong>the</strong> chloride waters forming <strong>the</strong> sulphide<br />
and sulphosalt mineralization at Eskay Creek could<br />
have resulted in <strong>the</strong> generation of <strong>the</strong> bicarbonate waters responsible<br />
for <strong>the</strong> formation of <strong>the</strong> carbonate-kaolinite alteration.<br />
Future model calculations will also explore an alternative<br />
hypo<strong>the</strong>sis that involves <strong>the</strong> effervescence of CO 2<br />
from <strong>the</strong> chloride waters at higher temperatures, coupled<br />
with <strong>the</strong> subsequent take-up of <strong>the</strong> CO 2 by cooler, ambient<br />
pore waters, possibly producing waters of sufficient<br />
alkalinity and near-neutral pH <strong>to</strong> form <strong>the</strong> carbonatekaolinite<br />
alteration halo.<br />
Acknowledgments<br />
The authors gratefully acknowledge <strong>the</strong> financial support<br />
provided by <strong>Geoscience</strong> <strong>BC</strong>, Barrick Gold Corporation, <strong>the</strong><br />
Michael-Jürgen-Leisler-Kiep Foundation and <strong>the</strong> German<br />
Research Foundation. This study would not have been possible<br />
without <strong>the</strong> help provided by T. Roth, M.D. Hanning<strong>to</strong>n<br />
and R. Tosdal. R. Kleeberg is thanked for providing analytical<br />
support.<br />
References<br />
Alldrick, D.J., Nelson, J.L., Barresi, T., Stewart, M.L. and<br />
Simpson, K. (2005): Geology of <strong>the</strong> Upper Iskut River area,<br />
British Columbia; <strong>BC</strong> Ministry of Energy and Mines, Open<br />
File 2006-2, scale 1: 100 000.<br />
Allison, J.D., Brown, D.S. and Novo-Gradac, K.J. (1991): User’s<br />
manual for MINTEQA2/PROFEFA2, version 3.0: a geochemical<br />
<strong>as</strong>sessment model for environmental systems;<br />
United Stales Environmental Protection Agency, Environmental<br />
Research Labora<strong>to</strong>ry, 107 p.<br />
Barrett, T.J. and Sherlock, R.L. (1996): Geology, lithogeochemistry<br />
and volcanic setting of <strong>the</strong> Eskay Creek Au-Ag-<br />
Cu-Zn deposit, northwestern British Columbia; Exploration<br />
and Mining Geology, v. 5, p. 339–368.<br />
<strong>BC</strong> Geological Survey (2011): MINFILE <strong>BC</strong> mineral deposits datab<strong>as</strong>e;<br />
<strong>BC</strong> Ministry of Energy and Mines, URL [November 2011].<br />
Bethke, C.M. (2008): Geochemical and Biogeochemical Reaction<br />
Modeling; Cambridge University Press, New York, 543 p.<br />
Bischoff, J.L. and Rosenbauer, R.J. (1984): The critical point and<br />
two-ph<strong>as</strong>e boundary of seawater, 200°–500°C; Earth and<br />
Planetary Science Letters, v. 68, p. 172–180.<br />
Bischoff, J.L. and Rosenbauer, R.J. (1996): The alteration of rhyolite<br />
in CO 2 charged water at 200 and 350°C: <strong>the</strong> unreactivity<br />
of CO 2 at higher temperature; Geochimica et Cosmochimica<br />
Acta, v. 60, p 3859–3867.<br />
Brit<strong>to</strong>n, J.M., Blackwell, J.D. and Schroeter, T.G. (1990): #21 zone<br />
deposit, Eskay Creek, northwestern British Columbia; <strong>BC</strong><br />
Ministry of Energy and Mines, Exploration in British Columbia<br />
1989, p. 197–223.<br />
Childe, F. (1996): U-Pb geochronology and Nd and Pb iso<strong>to</strong>pe<br />
characteristics of <strong>the</strong> Au-Ag rich Eskay Creek volcanogenic<br />
m<strong>as</strong>sive sulfide deposit, British Columbia; Economic Geology,<br />
v. 91, p. 1209–1224.<br />
Delany, J.M. and Lundeen, S.R. (1990): The LLNL <strong>the</strong>rmochemical<br />
datab<strong>as</strong>e; Lawrence Livermore National Labora<strong>to</strong>ry,<br />
Report URCL-21658, 150 p.<br />
Duan, Z., Møller, N. and Weare, J.H. (1996): Prediction of <strong>the</strong> solubility<br />
of H 2S in NaCl aqueous solution: an equation of state<br />
approach; Chemical Geology, v. 130, p. 15–20.<br />
Duan, Z. and Sun, R. (2003): An improved model calculating CO 2<br />
solubility in pure water and aqueous NaCl solutions from<br />
50 <strong>Geoscience</strong> <strong>BC</strong> Summary of Activities 2011
273 <strong>to</strong> 533 K and from 0 <strong>to</strong> 2000 bar; Chemical Geology,<br />
v. 193, p 257–271.<br />
Duan, Z., Sun, R., Zhu, C. and Chou, I.M. (2006): An improved<br />
model for <strong>the</strong> calculation of CO 2 solubility in aqueous solutions<br />
containing Na + ,K + ,Ca 2+ ,Mg 2+ ,Cl - , and SO 4 2- ;Marine<br />
Chemistry, v. 98, p. 131–139.<br />
Duan, Z., Sun, R., Liu, R. and Zhu, C. (2007): Accurate <strong>the</strong>rmodynamic<br />
model for <strong>the</strong> calculation of H 2S solubility in pure<br />
water and brines; Energy and Fuels, v. 21, p. 2056–2065.<br />
Ettlinger, A.D. (1992): Hydro<strong>the</strong>rmal alteration and brecciation<br />
underlying <strong>the</strong> Eskay Creek polymetallic m<strong>as</strong>sive sulphide<br />
deposit; in Geological Fieldwork 1991, <strong>BC</strong> Ministry of Energy<br />
and Mines, Paper 1992-1, p. 535–541.<br />
Gabrielse, H., Monger, J.W.H., Wheeler, J.O. and Yorath, C.J.<br />
(1991): Morphogeological belts, tec<strong>to</strong>nic <strong>as</strong>semblages and<br />
terranes; in Geology of <strong>the</strong> Cordilleran Orogen in Canada,<br />
H. Gabrielse and C.J. Yorath (ed.), Geological Survey of<br />
Canada, Geology of Canada, no. 4, p. 15–28 (also Geological<br />
Society of America, Geology of North America, v. G-2).<br />
Hanning<strong>to</strong>n, M.D., Poulsen, K.H., Thompson, J.F.H. and Silli<strong>to</strong>e,<br />
R.H. (1999): Volcanogenic gold in <strong>the</strong> m<strong>as</strong>sive sulfide environment;<br />
Reviews in Economic Geology, v. 8, p. 325–356.<br />
Hanning<strong>to</strong>n, M.D., de Ronde, C.E.J. and Petersen, S. (2005): Seafloor<br />
tec<strong>to</strong>nics and submarine hydro<strong>the</strong>rmal systems; Economic<br />
Geology, 100 th Anniversary Volume, p. 111–141.<br />
Helgeson, H.C., Garrels, R.M. and Mackenzie, F.T. (1969): Evaluation<br />
of irreversible reactions in geochemical processes involving<br />
minerals and aqueous solutions–II. Applications;<br />
Geochimica et Cosmochimica Acta, v. 33, p. 455–481.<br />
Helgeson, H.C. and Kirkham, D.H. (1974): Theoretical prediction<br />
of <strong>the</strong> <strong>the</strong>rmodynamic behavior of aqueous electrolytes at<br />
high pressures and temperatures, II. Debye-Huckel parameters<br />
for activity coefficients and relative partial molal properties;<br />
American Journal of Science, v. 274, p. 1199–1261.<br />
Johnson, J.W., Oelkers, E.H. and Helgeson, H.C. (1992):<br />
SUPCRT92: a software package for calculating <strong>the</strong> standard<br />
molal <strong>the</strong>rmodynamic properties of minerals, g<strong>as</strong>es, aqueous<br />
species, and reactions from 1 <strong>to</strong> 5000 bar and 0 <strong>to</strong><br />
1000ºC; Computers and <strong>Geoscience</strong>s, v. 18, p. 889–947.<br />
Large, R.R. (1977): Chemical evolution and zonation of m<strong>as</strong>sive<br />
sulfide deposits in volcanic terrains; Economic Geology,<br />
v. 72, p. 549–572.<br />
Meuzelaar, T. and Monecke, T. (2011): Carbonaceous muds<strong>to</strong>ne<br />
hosting <strong>the</strong> Eskay Creek deposit (NTS 104B/09, /10), northwestern<br />
British Columbia: multivariate statistical analysis<br />
of compositional trends; in <strong>Geoscience</strong> <strong>BC</strong> Summary of Activities<br />
2010, <strong>Geoscience</strong> <strong>BC</strong>, Report 2011-1, p. 45–56.<br />
Monecke, T., Gale, D., Roth, T. and Hanning<strong>to</strong>n, M.D. (2005): The<br />
submarine volcanic succession hosting <strong>the</strong> m<strong>as</strong>sive sulfide<br />
and sulfosalt Eskay Creek deposit, Canada; in Mineral Deposit<br />
Research: Meeting <strong>the</strong> Global Challenge, Y. Mao and<br />
F.P. Bierlein (ed.), Proceedings of <strong>the</strong> 8 th Biennial SGA (Society<br />
for Geology Applied <strong>to</strong> Mineral Deposits) Meeting,<br />
August 18–21, 2005, Beijing, Peoples Republic of China,<br />
Springer, p. 655–658.<br />
Nadaraju, G.D. (1993): Tri<strong>as</strong>sic–Jur<strong>as</strong>sic biochronology of <strong>the</strong><br />
e<strong>as</strong>tern Iskut River map area, northwestern British Columbia,<br />
M.Sc. <strong>the</strong>sis, University of British Columbia, 268 p.<br />
Ohmo<strong>to</strong>, H. (1996): Formation of volcanogenic m<strong>as</strong>sive sulfide<br />
deposits: <strong>the</strong> Kuroko perspective; Ore Geology Reviews,<br />
v. 10, p. 135–177.<br />
Pitzer, K.S. (1973): Thermodynamics of electrolytes–I. Theoretical<br />
b<strong>as</strong>is and general equations; Journal of Physical Chemistry,<br />
v. 77, p. 268–277.<br />
Robinson, H.M. (1991): Mineralisation and alteration patterns of<br />
<strong>the</strong> Central Lens (21B Zone), Eskay Creek, British Columbia,<br />
Canada; M.Sc. <strong>the</strong>sis, Imperial College, University of<br />
London, 129 p.<br />
Roth, T., Thompson, J.F.H. and Barrett, T.J. (1999): The precious<br />
metal-rich Eskay Creek deposit, northwestern British Columbia;<br />
Reviews in Economic Geology, v. 8, p. 357–373.<br />
Schardt, C., Cooke, D.R., Gemmell, J.B. and Large, R.R. (2001):<br />
Geochemical modeling of <strong>the</strong> zoned footwall alteration<br />
pipe, Hellyer volcanic-hosted m<strong>as</strong>sive sulfide deposit, western<br />
T<strong>as</strong>mania, Australia; Economic Geology, v. 96, p. 1037–<br />
1054.<br />
Sherlock, R.L., Roth, T., Spooner, E.T.C. and Bray, C.J. (1999):<br />
Origin of <strong>the</strong> Eskay Creek precious metal-rich volcanogenic<br />
m<strong>as</strong>sive sulfide deposit: fluid inclusion and stable iso<strong>to</strong>pe<br />
evidence; Economic Geology, v. 94, p. 803–824.<br />
<strong>Geoscience</strong> <strong>BC</strong> Report 2012-1 51
52 <strong>Geoscience</strong> <strong>BC</strong> Summary of Activities 2011
Development of a Datab<strong>as</strong>e for <strong>Geoscience</strong> Field Observations, West-Central British<br />
Columbia (Part of NTS 093L)<br />
A.J. Stumpf, Illinois State Geological Survey, Prairie Research Institute, University of Illinois Urbana-<br />
Champaign, Champaign, IL, USA, <strong>as</strong>tumpf@illinois.edu<br />
Stumpf, A.J. (2012): Development of a datab<strong>as</strong>e for geological field observations, west-central British Columbia (part of NTS 093L); in<br />
<strong>Geoscience</strong> <strong>BC</strong> Summary of Activities 2011, <strong>Geoscience</strong> <strong>BC</strong>, Report 2012-1, p. 53–58.<br />
Introduction<br />
The recording, analysis and publication of field observations,<br />
me<strong>as</strong>urements and interpretations are an integral part<br />
of developing geoscience investigations. His<strong>to</strong>rically,<br />
<strong>the</strong>se field-acquired data and <strong>as</strong>sociated research materials<br />
were recorded, compiled and maintained in hard copy by<br />
individual scientists using various schem<strong>as</strong>. At <strong>the</strong> completion<br />
of <strong>the</strong> study, field maps and notebooks are archived in<br />
data reposi<strong>to</strong>ries and libraries (Schumacher, 2002). To<br />
date, <strong>the</strong>re are only a few programs, such <strong>as</strong> Natural Resources<br />
Canada’s Consolidating Canada’s <strong>Geoscience</strong> Knowledge<br />
Program (http://ess.nrcan.gc.ca /2002_2006/ccgk/<br />
index_e.php), that have been developed <strong>to</strong> specifically catalogue<br />
and digitize geological information previously<br />
available only in hard copy.<br />
Although recent technological advancements now allow<br />
geological information <strong>to</strong> be directly inputted in<strong>to</strong> digital<br />
datab<strong>as</strong>es from <strong>the</strong> field (e.g., Brodaric, 2004), <strong>the</strong>re remains<br />
a requirement that <strong>the</strong>se cus<strong>to</strong>m datab<strong>as</strong>es be designed<br />
<strong>to</strong> allow data <strong>to</strong> be queried, appended and edited by<br />
<strong>the</strong> geoscientist. Fur<strong>the</strong>rmore, <strong>the</strong> datab<strong>as</strong>es must also be compatible<br />
with corporate data structures and readily converted<br />
<strong>to</strong> o<strong>the</strong>r <strong>file</strong> formats.<br />
Keywords: datab<strong>as</strong>e, geoscience, Quaternary geology, mineral<br />
exploration, QUEST-West<br />
This publication is also available, free of charge, <strong>as</strong> colour digital<br />
<strong>file</strong>s in Adobe Acrobat ® <strong>PDF</strong> format from <strong>the</strong> <strong>Geoscience</strong> <strong>BC</strong><br />
website: http://www.geosciencebc.com/s/DataRele<strong>as</strong>es.<strong>as</strong>p.<br />
To this end, a datab<strong>as</strong>e w<strong>as</strong> developed <strong>to</strong> s<strong>to</strong>re observations<br />
made in <strong>the</strong> field for <strong>the</strong> <strong>Geoscience</strong> <strong>BC</strong>–supported project,<br />
Surficial Geochemistry and Lithology of <strong>the</strong> Bulkley River<br />
Valley, Central British Columbia, which is currently only<br />
available from <strong>the</strong> author in hard copy. This datab<strong>as</strong>e will<br />
<strong>as</strong>sist users of <strong>the</strong> accompanying till geochemistry and cl<strong>as</strong>t<br />
lithology data <strong>to</strong> explore and query o<strong>the</strong>r information collected<br />
at each sampling site (e.g., location, drainage cl<strong>as</strong>s,<br />
<strong>to</strong>pographic position, character of sampled material, lithology<br />
of cl<strong>as</strong>ts in <strong>the</strong> material and bedrock lithology if observed<br />
at <strong>the</strong> sampling site). This paper is a preliminary<br />
guide <strong>to</strong> <strong>the</strong> structure of <strong>the</strong> datab<strong>as</strong>e, which will be rele<strong>as</strong>ed<br />
<strong>as</strong> part of <strong>the</strong> final project report in early 2012<br />
through <strong>Geoscience</strong> <strong>BC</strong>.<br />
Field Data<br />
Field observations were made at a <strong>to</strong>tal of 146 sampling<br />
sites for a study of <strong>the</strong> till geochemistry and cl<strong>as</strong>t lithology<br />
in west-central <strong>BC</strong> (Stumpf, 2011) in an area approximately<br />
340 km e<strong>as</strong>t of Prince Rupert and 400 km west of<br />
Prince George (Figure 1). The project area is centred along<br />
<strong>the</strong> Bulkley River valley and adjacent are<strong>as</strong> (encomp<strong>as</strong>sing<br />
parts of NTS map are<strong>as</strong> 093L/07, /08, /09, /10, /11, /15; Figure<br />
1) within <strong>the</strong> <strong>Geoscience</strong> <strong>BC</strong>’s QUEST-West Project<br />
area and <strong>the</strong> Mountain Pine Beetle–Impacted Zone.<br />
In a similar manner <strong>to</strong> <strong>the</strong> till geochemistry surveys conducted<br />
by Levson (2002) and Ferbey (2011), <strong>the</strong> selection<br />
of field sample sites for this project w<strong>as</strong> undertaken <strong>to</strong> provide<br />
<strong>as</strong> complete coverage of <strong>the</strong> project area <strong>as</strong> possible<br />
using existing access routes. The sites were also selected <strong>to</strong><br />
set <strong>the</strong> greatest density of samples along transects perpendicular<br />
<strong>to</strong> <strong>the</strong> regional ice-flow direction. Along transects<br />
paralleling <strong>the</strong> ice flow, less dense sampling w<strong>as</strong> carried<br />
out. Samples of various geological materials—predominantly<br />
glacial till, but also silt and clay (glacial lake sediment)<br />
or diamic<strong>to</strong>n reworked by water and gravity—were<br />
collected from natural and manmade exposures such <strong>as</strong><br />
roadcuts, cuts along <strong>the</strong> shore of rivers and lakes, borrow<br />
pits and hand-dug holes. The average sampling depth belowlandsurfacerangedfrom0.20<strong>to</strong>22m.<br />
At each sample site, a series of observations were made describing<br />
<strong>the</strong> site location and conditions, landscape position<br />
and vegetation, and properties of <strong>the</strong> geological materials<br />
(Table 1). The field sites were marked with metal tags<br />
and flagging tape, both labelled with site numbers that were<br />
<strong>as</strong>signed in sequential order. The location of sample sites<br />
were plotted on 1:50 000 NTS b<strong>as</strong>e maps with <strong>the</strong> aid of air<br />
pho<strong>to</strong>graphs and a handheld GPS unit. The co-ordinates<br />
from <strong>the</strong> GPS for each sample site were recorded in <strong>the</strong> field<br />
on a hard-copy card similar <strong>to</strong> <strong>the</strong> form shown in Figure 2.<br />
The co-ordinates were recorded in <strong>the</strong> UTM projection,<br />
referenced <strong>to</strong> NAD 83, Zone 9.<br />
<strong>Geoscience</strong> <strong>BC</strong> Report 2012-1 53
Sedimen<strong>to</strong>logical data including sediment descriptions,<br />
primary and secondary structures, matrix texture, presence<br />
of fissility, compactness, sediment genesis and thickness,<br />
<strong>to</strong>tal percentage and modal size, rounding and presence of<br />
striated cl<strong>as</strong>ts were also collected at each site (Table 1).<br />
This information w<strong>as</strong> used <strong>to</strong> identify geological materials<br />
with different processes of transportation and deposition.<br />
For example, <strong>the</strong> information w<strong>as</strong> used <strong>to</strong> distinguish<br />
diamic<strong>to</strong>n that w<strong>as</strong> cl<strong>as</strong>sified <strong>as</strong> till from deposits of<br />
glaciogenic debris flows, colluvial processes, proximal<br />
glaciofluvial meltwater or subaqueous debris flows or icerafted<br />
debris in glacial lakes. This information is very important<br />
<strong>to</strong> <strong>the</strong> understanding of <strong>as</strong>sociated anomaly patterns<br />
because variations in geochemistry from local sources are<br />
reflected in some materials where<strong>as</strong> regional trends are observed<br />
in o<strong>the</strong>rs. Additional information w<strong>as</strong> collected describing<br />
<strong>the</strong> soil horizons, local slope, drainage cl<strong>as</strong>s,<br />
dominant tree species, bedrock striae and bedrock lithology<br />
(Table 1).<br />
Figure 1. Location and till sample sites of <strong>the</strong> project area in west-central British Columbia (project area delineated by <strong>the</strong> green box on <strong>the</strong><br />
inset map). <strong>Geoscience</strong> <strong>BC</strong>’s QUEST-West Project area and <strong>the</strong> Mountain Pine Beetle–Impacted Zone are outlined by <strong>the</strong> red and light blue<br />
lines, respectively, on <strong>the</strong> inset map.<br />
54 <strong>Geoscience</strong> <strong>BC</strong> Summary of Activities 2011
Table 1. Guide <strong>to</strong> field observations collected for <strong>the</strong> project along <strong>the</strong> Bulkley River valley (after Levson, 2002). The data is input<br />
in<strong>to</strong> a relational datab<strong>as</strong>e with a structure outlined in Tables 2–4. The 'Unit' field contains codes for deposit type, thickness and<br />
depositional processes (from Howes and Kenk, 1997).<br />
Parameter<br />
Description<br />
Year<br />
Year sample collected<br />
Day_Month Day and month sample collected<br />
Type<br />
Type of regional survey: LITH, cl<strong>as</strong>t lithology; TS, till<br />
ID<br />
Sample site number<br />
Collec<strong>to</strong>r<br />
Scientist(s) that collected <strong>the</strong> sample:<br />
AS, Andrew Stumpf; EB, Erin O Brien; LV, Vic<strong>to</strong>r Levson; DM, Dan Meldrum; DH, David Huntley; CC, Craig<br />
Map50 NTS 1:50 000 scale map (in 093L)<br />
Status Identifies <strong>the</strong> collection of multiple samples from a <strong>single</strong> site. Quality control identifier: 00, routine sample; 10,<br />
first field duplicate; 20, second field duplicate<br />
UTMZ<br />
Site location UTM zone<br />
UTME83<br />
Site location UTM e<strong>as</strong>ting (metres) referenced <strong>to</strong> NAD83 datum<br />
UTMN83<br />
Site location UTM northing (metres) referenced <strong>to</strong> NAD83 datum<br />
Lat<br />
Latitude (decimal degrees) calculated from NAD83 UTM coordinates<br />
Long<br />
Longitude (decimal degrees) calculated from NAD83 UTM coordinates<br />
Elev<br />
Elevation of land surface (in feet above mean sea level) taken from <strong>BC</strong> TRIM map<br />
Depth<br />
Depth of sample from land surface (in metres)<br />
Unit*<br />
Surficial deposit type and thickness/depositional process:<br />
b, blanket; C, colluvial; FG, glaciofluvial sediments; LG, glaciolacustrine sediments; M, morainal; R, bedrock<br />
map symbol: b, blanket; r, redeposited; v, veneer; ^, overlying;<br />
(e.g., FG^Mb, glaciofluvial sediments over morainal blanket)<br />
Material<br />
Sample material type:<br />
C, clay; Dmm, diamic<strong>to</strong>n (m<strong>as</strong>sive, matrix-supported); G, gravel; S, sand; Z, silt;<br />
prefix: c, clayey, g, gravelly, s, sandy, z, silty<br />
(e.g., szDmm, sandy <strong>to</strong> silty diamic<strong>to</strong>n)<br />
Exposure<br />
Sample material exposed in:<br />
1, roadcut; 2, shore of river or lake; 3, borrow pit; 4, hand-dug hole<br />
Terrain<br />
Position of site location on slope:<br />
1, flat; 2, lower slope; 3, midslope; 4, upper slope; 5, ridgecrest<br />
Terrain_Com Topographic position (description)<br />
Aspect<br />
Azimuth (direction) that <strong>the</strong> land surface is sloping<br />
Slope<br />
Inclination of <strong>the</strong> land surface at <strong>the</strong> site location<br />
Drainage<br />
Drainage cl<strong>as</strong>s: 1, poor; 2, moderate; 3, well<br />
Note: 0.5 is intermediate between any two cl<strong>as</strong>ses<br />
Vegetation Dominant tree species at site location:<br />
al, alder; <strong>as</strong>, <strong>as</strong>pen; b, birch; bf, balsam fir; cc, clearcut; d, deciduous; f, fir; j, juniper; p, lodgepole pine; pop,<br />
poplar; s, spruce; saf, subalpine fir; sw, swamp; ws, white spruce<br />
Soil<br />
Thickness (m) of soil horizon(s); X, disturbed ground<br />
Fissility<br />
0, none; 1, weak; 2, moderate; 3, strong<br />
Density<br />
1, loose; 2, stiff; 3, hard<br />
Oxidation<br />
0, none; 1, mild; 2, moderate; 3, high<br />
Note: 0.5 is intermediate between any two cl<strong>as</strong>ses<br />
Jointing<br />
0, none; 1, few; 2, some; 3, many<br />
Matrix Proportion of matrix material in bulk sample: 60, 70, 80, 90<br />
Matrix_Colour Matrix colour:<br />
b, brown; bl, blue; bt, blue tinge; cb, chocolate brown; db, dark brown; dg, dark grey; dgr, dark green; dgb,<br />
dark greyish brown; dr, dark red; g, grey; gb, grey brown; gr, green; lb, light brown; lg, light grey; o, orange;<br />
ob, orange brown; ol, olive; p, purple; r, red; rb, reddish brown; y, yellow; t, tan; tb, tan brown<br />
Matrix_Texture Matrix texture:<br />
1, sandy; 2, silty; 3, silty sand; 4, sandy silt; 5, o<strong>the</strong>r (see comments)<br />
Cl<strong>as</strong>t_Mode Size of pebbles:<br />
1, small pebble; 2, medium pebble; 3, large pebble;<br />
Note: 0.5 is intermediate between any two mode cl<strong>as</strong>sifications<br />
Max_Cl<strong>as</strong>t_Size Maximum cl<strong>as</strong>t size observed (b-axis dimension in cm)<br />
Cl<strong>as</strong>t_Shape Shape of cl<strong>as</strong>ts:<br />
1, angular; 2, subangular; 3, subrounded; 4, rounded; 5, well rounded<br />
Note: 0.5 is an intermediate value between any two shape cl<strong>as</strong>sifications<br />
Cl<strong>as</strong>t_Striated Proportion of striated cl<strong>as</strong>ts:<br />
0, none; 1, rare (10%)<br />
Bedrock_Lith Bedrock lithology:<br />
n/v, not exposed; AND, andesite; B, b<strong>as</strong>alt; CH, chert; COAL, coal; CONG, conglomerate; DIO, diorite; FP,<br />
feldspar porphyry; GR, granitic; GRD, granodiorite; GRN, greens<strong>to</strong>ne; GW, greywacke; LAPT, lapilli tuff; LST,<br />
limes<strong>to</strong>ne; METSEDS, met<strong>as</strong>ediments; MS, muds<strong>to</strong>ne; RHY, rhyolite; SH, shale; SS, sands<strong>to</strong>ne; SY, syenite;<br />
Comments Relevant information about <strong>the</strong> sedimen<strong>to</strong>logy, geology, location, or site characteristics<br />
<strong>Geoscience</strong> <strong>BC</strong> Report 2012-1 55
Datab<strong>as</strong>e Construction<br />
A datab<strong>as</strong>e w<strong>as</strong> developed using Microsoft ® Access ® 2010<br />
<strong>to</strong> input field data including site information, observations<br />
and interpretations. The datab<strong>as</strong>e w<strong>as</strong> designed <strong>to</strong> facilitate<br />
retrieval, interpretation and analysis of information <strong>as</strong>sociated<br />
with <strong>the</strong> collection of till and cl<strong>as</strong>t lithology samples,<br />
and is b<strong>as</strong>ed on a relational datab<strong>as</strong>e using Microsoft Access<br />
forms and tables developed at <strong>the</strong> Illinois State<br />
Geological Survey (Stiff, 2002).<br />
The data is input via ei<strong>the</strong>r a write-access form or three datab<strong>as</strong>e<br />
tables that allow researchers <strong>to</strong> query, append <strong>to</strong> and<br />
edit <strong>the</strong> data housed in <strong>the</strong> datab<strong>as</strong>e. Each field site h<strong>as</strong> a<br />
unique identification code (‘Sys_ID’). This identification<br />
code is used <strong>to</strong> establish a 1:1 relationship between <strong>the</strong><br />
‘Field ID’table and <strong>the</strong> o<strong>the</strong>r two tables containing location<br />
information and geographic descriptions (‘Header’ table)<br />
and geological observations and interpretations (‘Descriptions’<br />
tables).<br />
The ‘Field_ID’table contains identification codes that have<br />
been <strong>as</strong>signed <strong>to</strong> a particular site (Table 2). The ID is a<br />
unique number for each sample site <strong>as</strong>signed by <strong>the</strong> project<br />
geologist. The ‘M<strong>as</strong>ter_Num’ field w<strong>as</strong> created <strong>to</strong> follow<br />
<strong>the</strong> <strong>file</strong> structure of geochemical datab<strong>as</strong>es maintained by<br />
<strong>Geoscience</strong> <strong>BC</strong> (Jackaman, 2007) and <strong>the</strong> <strong>BC</strong> Geological<br />
Survey (Lett, 2008). This field is also a unique identifier<br />
containing sample identification information, a compound<br />
of <strong>the</strong> fields ‘Type’, ‘Map50’, <strong>the</strong> l<strong>as</strong>t two characters of<br />
‘Year’and <strong>the</strong> ‘ID’. The ‘Type’indicates <strong>the</strong> type of survey<br />
Figure 2. Example of <strong>the</strong> datab<strong>as</strong>e input form.<br />
Table 2. Structure of <strong>the</strong> ‘Field ID’ table (length in number of characters; abbreviations: CHAR, text field; NUM, numerical<br />
field).<br />
TABLE_FIELD TYPE LENGTH FORM EXPLANATION<br />
SYS_ID NUM 12 sequential, system-generated identifier<br />
ID CHAR 4 sample number in survey<br />
YEAR CHAR 4 year sample w<strong>as</strong> collected<br />
DAY_MONTH CHAR 4 day and month sample w<strong>as</strong> collected<br />
MASTER_NUM CHAR 15 unique samples identification combines type of regional sample, NTS map<br />
area, collection year and original sample site number (e.g., TILL93L09966402)<br />
TYPE CHAR 7 type of regional survey<br />
STATUS CHAR 2 sample quality control identifier<br />
Table 3. Structure of <strong>the</strong> ‘Header’ table (length in number of characters; abbreviations:<br />
CHAR, text field; NUM, numerical field).<br />
TABLE_FIELD TYPE LENGTH FORM EXPLANATION<br />
SYS_ID NUM 12 sequential, system-generated identifier<br />
COLLECTOR CHAR 15 initials of field scientist(s) collecting <strong>the</strong> sample<br />
MAP50 CHAR 5 NTS 1:50 000 scale map<br />
UTME83 NUM 14 site location UTM e<strong>as</strong>ting (6 decimal places)<br />
UTMN83 NUM 14 site location UTM northing (6 decimal places)<br />
UTMZ NUM 2 site location UTM zone<br />
LAT NUM 10 latitude in decimal degrees (6 decimal places)<br />
LONG NUM 10 longitude in decimal degrees (6 decimal places)<br />
ELEV NUM 5 elevation of site location (in feet)<br />
DEPTH NUM 3 depth of sample (m) (1 decimal place)<br />
56 <strong>Geoscience</strong> <strong>BC</strong> Summary of Activities 2011
Table 4. Structure of <strong>the</strong> ‘Descriptions’ table (length in number of characters; abbreviations: CHAR, text field;<br />
NUM, numerical field).<br />
TABLE_FIELD TYPE LENGTH FORM EXPLANATION<br />
SYS_ID NUM 12 sequential, system-generated identifier<br />
UNIT CHAR 5 deposit type and thickness/depositional process<br />
MATERIAL CHAR 5 sampled material type and texture<br />
EXPOSURE NUM 1 condition that material is exposed<br />
TERRAIN NUM 1 position of site location on slope<br />
TERRAIN_COM CHAR 100 <strong>to</strong>pographic position (description)<br />
ASPECT NUM 3 azimuth of slope (degrees)<br />
SLOPE NUM 2 inclination of land surface (degrees)<br />
DRAINAGE NUM 2 drainage cl<strong>as</strong>s<br />
VEGETATION CHAR 10 predominant tree species<br />
SOIL NUM 3 thickness of soil horizon (m)<br />
FISSILITY NUM 1 degree of fissility developed<br />
DENSITY NUM 1 field me<strong>as</strong>ure of density, consistency or compaction<br />
OXIDATION NUM 1 degree of oxidation<br />
JOINTING NUM 1 density of joints and fractures<br />
MATRIX NUM 2 proportion of matrix material (percent)<br />
MATRIX_COLOUR CHAR 3 primary color of matrix material<br />
MATRIX_TEXTURE CHAR 15 in field estimate of matrix texture<br />
CLAST_MODE NUM 2 average size of pebbles<br />
MAX_CLAST_SIZE NUM 3 maximum size of cl<strong>as</strong>ts (cm)<br />
CLAST_SHAPE NUM 1 dominant shape of cl<strong>as</strong>ts<br />
CLAST_STRIATED NUM 3 proportion of striated cl<strong>as</strong>ts in bulk sample (percent)<br />
BEDROCK_LITH CHAR 8 bedrock lithology at site location (if exposed)<br />
COMMENTS CHAR 100 descriptive details relating <strong>to</strong> sedimen<strong>to</strong>logy, geology, site location, etc.<br />
that w<strong>as</strong> completed. For this project, only till geochemistry<br />
and cl<strong>as</strong>t lithology surveys were completed. The ‘Status’ is<br />
a unique quality-control identifier <strong>as</strong>signed <strong>to</strong> field duplicate<br />
samples sent for geochemical analyses. One field duplicate<br />
sample w<strong>as</strong> collected for every 20 samples in <strong>the</strong><br />
survey and <strong>the</strong> duplicate samples were collected at <strong>the</strong> same<br />
site of <strong>the</strong> preceding sample in <strong>the</strong> sampling sequence. This<br />
sampling pro<strong>to</strong>col is adapted from similar QA-QC procedures<br />
used by <strong>Geoscience</strong> <strong>BC</strong>, <strong>the</strong> <strong>BC</strong> Geological Survey<br />
and <strong>the</strong> Geological Survey of Canada for geochemical surveys<br />
(e.g., Cook and Dunn, 2007). These duplicate samples<br />
were randomly submitted <strong>to</strong> <strong>the</strong> labora<strong>to</strong>ry without any<br />
indication of <strong>the</strong>ir proximity.<br />
The ‘Header’ table includes information about <strong>the</strong> site and<br />
its location (Table 3). A geoscientist can update fields in<br />
this table <strong>as</strong> more accurate or more complete data become<br />
available.<br />
The ‘Descriptions’ table includes information describing<br />
<strong>the</strong> physical, chemical and engineering properties of <strong>the</strong><br />
geological materials sampled, <strong>as</strong> well <strong>as</strong> <strong>the</strong> <strong>to</strong>pography,<br />
drainage cl<strong>as</strong>s, predominant tree species and soil formation<br />
at <strong>the</strong> land surface (Table 4). Additional detailed comments<br />
are included in <strong>the</strong> table describing specific <strong>as</strong>pects of<br />
sedimen<strong>to</strong>logy, geology and <strong>the</strong> site location that cannot be<br />
entered in <strong>the</strong> o<strong>the</strong>r fields (e.g., direction of glacier flow<br />
inferred from striated bedrock).<br />
Conclusion<br />
This digital datab<strong>as</strong>e of descriptive sedimen<strong>to</strong>logy, geology<br />
and characteristics of <strong>the</strong> land surface, along with <strong>the</strong><br />
<strong>as</strong>sociated geospatial information, will add <strong>to</strong> <strong>the</strong> functional<br />
data reposi<strong>to</strong>ries available from <strong>Geoscience</strong> <strong>BC</strong>. The<br />
datab<strong>as</strong>e structure will first be used <strong>to</strong> distribute <strong>the</strong> results<br />
of <strong>the</strong> <strong>Geoscience</strong> <strong>BC</strong>–supported project, Surficial Geochemistry<br />
and Lithology of <strong>the</strong> Bulkley River Valley, Central<br />
British Columbia, in early 2012. In addition, <strong>the</strong> datab<strong>as</strong>e<br />
h<strong>as</strong> a digital framework that is compatible with o<strong>the</strong>r<br />
data reposi<strong>to</strong>ries maintained by <strong>Geoscience</strong> <strong>BC</strong> and <strong>the</strong> <strong>BC</strong><br />
Geological Survey. The ‘open access’structure permits datab<strong>as</strong>e<br />
query and edit functions. Because <strong>the</strong> datab<strong>as</strong>e w<strong>as</strong><br />
constructed using an industry-standard datab<strong>as</strong>e system,<br />
data can e<strong>as</strong>ily be exported <strong>to</strong> o<strong>the</strong>r systems (e.g., Oracle ® ,<br />
MySQL ® ) or linked with GIS software. This datab<strong>as</strong>e will<br />
provide access <strong>to</strong> ancillary information collected <strong>as</strong> part of<br />
a geochemical survey that can be incorporated in<strong>to</strong> a wide<br />
range of exploration and research activities and <strong>as</strong>sist in <strong>the</strong><br />
planning of detailed surveys and targeted studies.<br />
Acknowledgments<br />
The project along <strong>the</strong> Bulkley River valley is being funded<br />
by <strong>Geoscience</strong> <strong>BC</strong>. The author thanks B. Stiff and S. Brown<br />
at <strong>the</strong> Illinois State Geological Survey for <strong>the</strong>ir insightful<br />
information about datab<strong>as</strong>e structures. The author thanks<br />
B. Bauer and R. Kl<strong>as</strong>s for <strong>the</strong>ir thorough review of an earlier<br />
version of <strong>the</strong> manuscript.<br />
<strong>Geoscience</strong> <strong>BC</strong> Report 2012-1 57
References<br />
Brodaric, B. (2004): The design of GSC FieldLog: on<strong>to</strong>logy-b<strong>as</strong>ed<br />
software for computer aided geological field mapping;<br />
Computers and <strong>Geoscience</strong>s, v. 30, p. 5–20, URL [Oc<strong>to</strong>ber 2011].<br />
Cook, S.J. and Dunn, C.E. (2007): Final report on results of <strong>the</strong><br />
Cordilleran geochemistry project: a comparative <strong>as</strong>sessment<br />
of soil geochemical methods for detecting buried<br />
mineral deposits – 3Ts Au-Ag prospect, central British<br />
Columbia, <strong>Geoscience</strong> <strong>BC</strong>, Report 2007-7, 225 p., URL<br />
[Oc<strong>to</strong>ber 2011].<br />
Ferbey, T. (2011): Till geochemistry of <strong>the</strong> Colleymount map area<br />
(093L/01), west-central British Columbia; <strong>BC</strong> Ministry of<br />
Energy and Mines, Open File 2011-06 and <strong>Geoscience</strong> <strong>BC</strong>,<br />
Report 2011-9, 51 p., URL [Oc<strong>to</strong>ber 2011].<br />
Foerste, A.F. (2002): August F. Foerste’s unpublished field notes<br />
for <strong>the</strong> area of <strong>the</strong> Serpent Mound disturbance; Ohio Department<br />
of Natural Resources, Division of Geological Survey,<br />
Open-File Report, Paper 2002-01, 21 p. (transcribed by G.A.<br />
Schumacher with <strong>as</strong>sistance from M. Hackathorn), URL<br />
<br />
[Oc<strong>to</strong>ber 2011].<br />
Howes, D.E. and Kenk, E. (1997): Terrain cl<strong>as</strong>sification system<br />
for British Columbia (version 2); <strong>BC</strong> Ministry of Environment<br />
and Surveys and Resource Mapping Branch, MOE<br />
Manual 10, 102 p., URL [Oc<strong>to</strong>ber 2011].<br />
Jackaman, W. (2007): <strong>Geoscience</strong> <strong>BC</strong> MPB data reposi<strong>to</strong>ry (v1.0);<br />
<strong>Geoscience</strong> <strong>BC</strong>, Report 2007-9, 8 p., URL [Oc<strong>to</strong>ber 2011].<br />
Lett, R.E. (2008): British Columbia till geochemical survey data<br />
compilation; <strong>BC</strong> Ministry of Energy and Mines, GeoFile<br />
2008-13, 7 p., URL [Oc<strong>to</strong>ber 2011]<br />
Levson, V.M. (2002): Quaternary geology and till geochemistry of<br />
<strong>the</strong> Babine porphyry copper belt, British Columbia (NTS<br />
093L/9, 16; M/1, 2, 7 & 8); <strong>BC</strong> Ministry of Energy and<br />
Mines, Bulletin 110, 278 p., URL [Oc<strong>to</strong>ber 2011].<br />
Stiff, B.J. (2002): Developing a working datab<strong>as</strong>e for mapping and<br />
modeling in Illinois; in Digital Mapping Techniques ‘02–<br />
Workshop Proceedings, D.R. Soller (ed.), United States<br />
Geological Survey, Open-File Series 02-370, p. 21–28, URL<br />
[Oc<strong>to</strong>ber<br />
2011].<br />
Stumpf, A.J. (2011): Quaternary geology and till geochemistry of<br />
<strong>the</strong> Bulkley River valley, west-central British Columbia<br />
(part of NTS 093L); in <strong>Geoscience</strong> <strong>BC</strong> Summary of Activities<br />
2010, <strong>Geoscience</strong> <strong>BC</strong>, Report 2011-1, p. 57–64, URL<br />
[Oc<strong>to</strong>ber 2011].<br />
58 <strong>Geoscience</strong> <strong>BC</strong> Summary of Activities 2011
Heavy Mineral Analysis of Till Samples within <strong>the</strong> QUEST Project Area,<br />
Central British Columbia (NTS 093J)<br />
B.C. Ward, Department of Earth Sciences, Simon Fr<strong>as</strong>er University, Burnaby, <strong>BC</strong>, bcward@sfu.ca<br />
M.I. Leybourne, GNS Science, 1 Fairway Drive, Avalon, Lower Hutt, New Zealand<br />
D.A. Sacco, Department of Earth Sciences, Simon Fr<strong>as</strong>er University, Burnaby, <strong>BC</strong><br />
Ward, B.C., Leybourne, M.I. and Sacco, D.A. (2012): Heavy mineral analysis of till samples within <strong>the</strong> QUEST Project area, central British<br />
Columbia (NTS 093J); in <strong>Geoscience</strong> <strong>BC</strong> Summary of Activities 2011, <strong>Geoscience</strong> <strong>BC</strong>, Report 2012-1, p. 59–68.<br />
Introduction<br />
The McLeod Lake map area (NTS 093J), within<br />
<strong>Geoscience</strong> <strong>BC</strong>’s Quesnellia Exploration Strategy<br />
(QUEST) Project area, h<strong>as</strong> shown good potential for Cu<br />
and Au porphyry and volcanogenic m<strong>as</strong>sive sulphide<br />
(VMS) mineralization (Ward et al., 2011). Previously, mineral<br />
exploration activity h<strong>as</strong> been hindered in this area due<br />
<strong>to</strong> <strong>the</strong> thick cover of surficial deposits, <strong>the</strong>refore, regionalscale<br />
till sampling h<strong>as</strong> been carried out <strong>to</strong> target potential<br />
zones of mineralized bedrock. Detailed investigations of<br />
regional-scale till samples with elevated or anomalous values<br />
help identify potentially mineralized zones within covered<br />
bedrock units (e.g., Levson, 2001; McClenaghan et<br />
al., 2002; McClenaghan, 2005). The preferred sampling<br />
medium for till geochemical surveys is b<strong>as</strong>al till, <strong>as</strong> it is<br />
commonly considered a first derivative of bedrock<br />
(Dreimanis, 1989; Levson, 2001). In its <strong>entire</strong>ty, this Quaternary<br />
geology project is designed <strong>to</strong> provide both regional<br />
and detailed till geochemical surveys and <strong>the</strong> Quaternary<br />
framework necessary <strong>to</strong> interpret <strong>the</strong>se data.<br />
Geochemical data from this project provide new exploration<br />
targets and also provide geological context for companies<br />
<strong>to</strong> interpret <strong>the</strong>ir own geochemical and geological<br />
dat<strong>as</strong>ets. This report adds <strong>to</strong> previous <strong>Geoscience</strong> <strong>BC</strong> publications<br />
that have dealt with <strong>the</strong> Quaternary geology (Ward<br />
et al., 2009; Sacco et al., 2010) and analysis of <strong>the</strong> clay and<br />
silt+clay fractions of b<strong>as</strong>al till by inductively coupled<br />
pl<strong>as</strong>ma–m<strong>as</strong>s spectrometry (ICP-MS) following aquaregia<br />
digestion and induced neutron activation analysis<br />
(INAA; Ward et al., 2011). This paper discusses INAA<br />
results from <strong>the</strong> heavy mineral fraction of 136 samples from<br />
six 1:50 000 map are<strong>as</strong> in <strong>the</strong> QUEST Project area<br />
(Figure 1).<br />
Keywords: geochemistry, regional till geochemical survey, heavy<br />
minerals, Cu-Au porphyry, VMS<br />
This publication is also available, free of charge, <strong>as</strong> colour digital<br />
<strong>file</strong>s in Adobe Acrobat ® <strong>PDF</strong> format from <strong>the</strong> <strong>Geoscience</strong> <strong>BC</strong><br />
website: http://www.geosciencebc.com/s/DataRele<strong>as</strong>es.<strong>as</strong>p.<br />
Physiography, Bedrock and Quaternary<br />
Geology<br />
The study area occurs in <strong>the</strong> heart of <strong>the</strong> QUEST Project<br />
area, northwest of Prince George. The majority of this area<br />
lies in <strong>the</strong> relatively low relief area of <strong>the</strong> Interior Plateau<br />
(Ma<strong>the</strong>ws, 1986), including its subdivisions, <strong>the</strong> Fr<strong>as</strong>er B<strong>as</strong>in<br />
and Nechako Plateau. It is characterized by glacial lake<br />
deposits, drumlinized drift and glaciofluvial outw<strong>as</strong>h and<br />
esker deposits (Holland, 1976).<br />
The majority of <strong>the</strong> study area straddles four of <strong>the</strong> terranes<br />
that make up <strong>the</strong> Canadian Cordillera (Cache Creek, Slide<br />
Mountain, Quesnel, Kootenay) where<strong>as</strong> <strong>the</strong> most nor<strong>the</strong><strong>as</strong>tern<br />
corner of it extends in<strong>to</strong> <strong>the</strong> Rocky Mountain <strong>as</strong>semblage.<br />
The Quesnel terrane dominates <strong>the</strong> study area<br />
and is composed primarily of Late Tri<strong>as</strong>sic <strong>to</strong> Early Jur<strong>as</strong>sic<br />
arc volcanic rocks of <strong>the</strong> Witch Lake succession and<br />
volcanicl<strong>as</strong>tic rocks of <strong>the</strong> Cot<strong>to</strong>nwood River succession,<br />
both part of <strong>the</strong> Nicola Group (Logan et al., 2010). The<br />
Cache Creek terrane is composed of Pennsylvanian and<br />
Permian limes<strong>to</strong>ne in <strong>the</strong> southwestern portion of <strong>the</strong> study<br />
area, with b<strong>as</strong>alts occurring just <strong>to</strong> <strong>the</strong> south of <strong>the</strong> study<br />
area. A complex <strong>as</strong>semblage of intrusive and extrusive<br />
rocks of <strong>the</strong> Slide Mountain terrane occurs in <strong>the</strong> e<strong>as</strong>t. The<br />
Rocky Mountain <strong>as</strong>semblage in <strong>the</strong> nor<strong>the</strong><strong>as</strong>tern corner of<br />
<strong>the</strong> study area comprises Silurian <strong>to</strong> Devonian sands<strong>to</strong>ne<br />
and quartzite. Stratigraphically overlying <strong>the</strong>se terranes are<br />
a series of overlap <strong>as</strong>semblages ranging from Upper Cretaceous<br />
<strong>to</strong> Miocene sedimentary rocks and Cretaceous <strong>to</strong><br />
Pliocene volcanic rocks (Struik, 1994; Logan et al., 2010).<br />
See Figure 1 for a more comprehensive presentation of <strong>the</strong><br />
bedrock units of <strong>the</strong> study area.<br />
The study area w<strong>as</strong> repeatedly affected by <strong>the</strong> Cordilleran<br />
Ice Sheet over approximately <strong>the</strong> l<strong>as</strong>t two million years<br />
(Armstrong et al., 1965; Clague, 1989), <strong>the</strong> most recent being<br />
during <strong>the</strong> Fr<strong>as</strong>er glaciation. The major sources of regional<br />
ice that covered <strong>the</strong> study area advanced from accumulation<br />
centres in <strong>the</strong> Co<strong>as</strong>t, Skeena and Cariboo<br />
mountains (Tipper, 1971; Levson and Giles, 1997; Plouffe,<br />
1997, 2000). The dominant ice flow direction in <strong>the</strong> study<br />
area, and thus main sediment transport, w<strong>as</strong> nor<strong>the</strong><strong>as</strong>terly<br />
<strong>Geoscience</strong> <strong>BC</strong> Report 2012-1 59
60 <strong>Geoscience</strong> <strong>BC</strong> Summary of Activities 2011<br />
Figure 1. Major bedrock geological units of <strong>the</strong> study area, central British Columbia (modified from Struik, 1994 and Logan et al., 2010). Also shown are mineral occurrences for different commodity<br />
types (after <strong>BC</strong> Geological Survey, 2011) and <strong>the</strong> dominant ice-flow direction (light-coloured arrows; after Sacco et al., 2010).
with minor deviations <strong>to</strong> a more nor<strong>the</strong>rly direction in <strong>the</strong><br />
north and a more e<strong>as</strong>terly direction in <strong>the</strong> sou<strong>the</strong>rn portions<br />
of <strong>the</strong> study area. Little information exists on ice flow during<br />
<strong>the</strong> glacier’s advance in<strong>to</strong> <strong>the</strong> area, but it is likely that ice<br />
flowed e<strong>as</strong>tward from <strong>the</strong> Co<strong>as</strong>t Mountains and w<strong>as</strong> subsequently<br />
deflected <strong>to</strong> <strong>the</strong> nor<strong>the</strong><strong>as</strong>t by interaction with ice<br />
flowing north from sources in <strong>the</strong> Co<strong>as</strong>t and Cariboo<br />
mountains <strong>to</strong> <strong>the</strong> south (Plouffe, 1997, 2000).<br />
The regional Quaternary framework and bedrock geology<br />
are described in more detail in Sacco et al. (2010) and Ward<br />
et al. (2011).<br />
Field and Analytical Methods<br />
Field Sampling<br />
B<strong>as</strong>al till samples were collected at a <strong>to</strong>tal of 712 sites. The<br />
sampling regime included collecting three separate 800–<br />
900 g samples at each sample site for: 1) analysis of <strong>the</strong><br />
clay-sized (hereafter referred <strong>to</strong> <strong>as</strong> clay) fraction by aquaregia<br />
digestion followed by ICP-MS at Acme Analytical<br />
Labora<strong>to</strong>ries Ltd. (Vancouver); 2) analysis of <strong>the</strong> clay plus<br />
silt-sized (hereafter referred <strong>to</strong> <strong>as</strong> clay+silt) fraction by<br />
INAA at Activation Labora<strong>to</strong>ries Ltd. (Anc<strong>as</strong>ter, Ontario);<br />
and 3) archiving at <strong>the</strong> Geological Survey of Canada. In addition,<br />
at every 4–5 sites (136 samples in <strong>to</strong>tal), a 10–15 kg<br />
sample w<strong>as</strong> collected for heavy mineral separation and gold<br />
grain counts. The heavy mineral separations and counts<br />
were conducted at Overburden Drilling Management Limited<br />
(Nepean, Ontario). The 2 and
Figure 2. Proportional dot maps of Au contents in heavy mineral separates from till samples: a) Au grain counts, with data overlain on <strong>the</strong> bedrock geology map presented in Figure 1, and b) Au<br />
contents by instrumental neutron activation analysis (INAA), with data overlain on a gravity geophysical map (gravity highs in red; lows in blue) modified from Sanders Geophysical Limited<br />
(2008) with ice flow from Tipper (1971).<br />
62 <strong>Geoscience</strong> <strong>BC</strong> Summary of Activities 2011
Figure 3. Proportional dot maps of selected elements in heavy mineral separates from till samples: a) As contents by instrumental neutron activation analysis (INAA), with data overlain on <strong>the</strong><br />
bedrock geology map presented in Figure 1, and b) Sb contents by INAA, with data overlain on a gravity geophysical map (gravity highs in red; lows in blue) modified from Sanders Geophysical<br />
Limited (2008) with ice flow from Tipper (1971).<br />
<strong>Geoscience</strong> <strong>BC</strong> Report 2012-1 63
Figure 3 (continued). Proportional dot maps of selected elements in heavy mineral separates from till samples: c) cinnabar grain counts, with data overlain on <strong>the</strong> bedrock geology map presented<br />
in Figure 1, and d) Hg contents by instrumental neutron activation analysis (INAA), with data overlain on a gravity geophysical map (gravity highs in red; lows in blue) modified from<br />
Sanders Geophysical Limited (2008) with ice flow from Tipper (1971).<br />
64 <strong>Geoscience</strong> <strong>BC</strong> Summary of Activities 2011
analyzed for Hg by INAA (Figure 3d); unfortunately, because<br />
of detection limit issues, due <strong>to</strong> interference with<br />
o<strong>the</strong>r elements, only 14 samples have values above detection<br />
limit. These samples are on <strong>the</strong> western and e<strong>as</strong>tern<br />
sides of <strong>the</strong> study area and do mimic highs in <strong>the</strong> cinnabar<br />
grain counts. Also plotted are Sb contents <strong>as</strong> Sb is commonly<br />
<strong>as</strong>sociated with Hg (Figure 3b). Antimony is also a<br />
common pathfinder element of porphyry Cu-Au and VMS<br />
mineralization. The two highest values are <strong>to</strong> <strong>the</strong> sou<strong>the</strong><strong>as</strong>t<br />
and nor<strong>the</strong><strong>as</strong>t of Carp Lake, with intermediate values in <strong>the</strong><br />
northwest, <strong>the</strong> zone of potential porphyry Cu-Au–style<br />
mineralization.<br />
Ce, Th, Cr and Ta Contents<br />
The b<strong>as</strong>al till geochemical results presented by Ward et al.<br />
(2011) show that values for rare earth elements (REE), U,<br />
Th, K, Ca, Mg, Na, Ni and Cr have spatial relationships that<br />
are consistent with changes in <strong>the</strong> dominant underlying<br />
bedrock lithology. Thus, incompatible elements that are enriched<br />
in felsic rocks (i.e., REE, U, Th, K and Hf) are elevated<br />
in <strong>the</strong> nor<strong>the</strong>rn part of <strong>the</strong> study area coincident with<br />
<strong>the</strong> Wolverine metamorphic complex, which contains felsic<br />
rocks such <strong>as</strong> granitic pegmatite, granite, granodiorite<br />
and rhyolite (Struik, 1994). Ni and Cr contents are highest<br />
in <strong>the</strong> south-southwestern portion of <strong>the</strong> study area where<br />
mafic and volcanicl<strong>as</strong>tic rocks of <strong>the</strong> Quesnel terrane occur<br />
(Struik, 1994). The INAA determinations on <strong>the</strong> heavy<br />
mineral fraction presented here show a similar spatial distribution<br />
of elements. High Ce, Th and Ta contents in <strong>the</strong><br />
north <strong>to</strong> northwest suggest more felsic rocks, likely <strong>the</strong> granitic<br />
pegmatite, granite, granodiorite and rhyolite and/or<br />
more enriched mafic rocks; where<strong>as</strong> high Cr contents in <strong>the</strong><br />
south indicates more primitive mafic rocks (Figure 4a–d).<br />
There is <strong>the</strong> possibility that <strong>the</strong> Cr could be derived from<br />
ultramafic rocks <strong>to</strong> <strong>the</strong> southwest in <strong>the</strong> Cache Creek<br />
terrane (Struik, 1994; Logan et al., 2010). If <strong>the</strong> Cr contents<br />
were derived from <strong>the</strong>se ultramafic rocks, this would represent<br />
<strong>the</strong> longer distance of glacial transport <strong>as</strong>sociated with<br />
<strong>the</strong> thicker till in this area. The thinner till in <strong>the</strong> nor<strong>the</strong>rn<br />
portion of <strong>the</strong> study area is thought <strong>to</strong> have a more local<br />
signature, reflecting local bedrock with a shorter distance<br />
of glacial transport.<br />
Till Geochemical Exploration<br />
The INAA determinations on heavy mineral concentrates<br />
presented here add <strong>to</strong> <strong>the</strong> previously published data and begin<br />
<strong>to</strong> build a coherent s<strong>to</strong>ry on <strong>the</strong> potential for metallic<br />
mineralization in <strong>the</strong> study area. The spatial distribution of<br />
Au, As and Sb contents confirm <strong>the</strong> potential for epigenetic<br />
Au-Cu mineralization and <strong>to</strong> a lesser extent porphyry Cu-<br />
Au in <strong>the</strong> nor<strong>the</strong><strong>as</strong>tern and northwestern are<strong>as</strong> of <strong>the</strong> study<br />
area, respectively. With >30 samples having Au contents<br />
>400 ppb, <strong>the</strong>re is <strong>the</strong> potential for mineralized bedrock <strong>to</strong><br />
occur <strong>the</strong>re. Gold anomalies commonly coincide with<br />
anomalies in o<strong>the</strong>r pathfinder elements, such <strong>as</strong> As and Sb.<br />
Although only a limited number of values are above detection<br />
limit, <strong>the</strong> spatial distribution of Hg values from <strong>the</strong><br />
heavy mineral concentrate does mimic <strong>the</strong> distribution of<br />
cinnabar grains. Are<strong>as</strong> with elevated INAA values and<br />
grain counts may be <strong>as</strong>sociated with faults similar <strong>to</strong> <strong>the</strong><br />
Pinchi Lake fault.<br />
Elevated light REE and Th in <strong>the</strong> nor<strong>the</strong>rn part of <strong>the</strong> study<br />
area are coincident with, and located down-ice from, granite<br />
pegmatite, granite and granodiorite suggesting <strong>the</strong> possibility<br />
of REE mineralization being <strong>as</strong>sociated with felsic<br />
porphyry bodies in <strong>the</strong> area, especially in <strong>the</strong> zone of gravity<br />
lows in <strong>the</strong> northwestern portion of <strong>the</strong> study area. Previous<br />
studies by <strong>the</strong> authors on <strong>the</strong> clay+silt and clay fractions<br />
of tills in <strong>the</strong> study area and <strong>the</strong> presence of large<br />
numbers of pyrite/marc<strong>as</strong>ite grains in some of <strong>the</strong> heavy<br />
mineral concentrate samples suggest possible VMS mineralization<br />
(Ward et al., 2011). However, <strong>the</strong> inherent limitations<br />
of <strong>the</strong> INAA method (e.g., lack of Cu and Pb determinations<br />
and high detection limits for Zn, Cd and Ag) mean<br />
that INAA determinations presented here on heavy mineral<br />
concentrates do not add any insight in<strong>to</strong> <strong>the</strong> potential for<br />
VMS-style mineralization within <strong>the</strong> study area.<br />
Conclusions<br />
The INAA of <strong>the</strong>
Figure 4. Proportional dot maps of selected elements in heavy mineral separates from till samples: a) Ce contents by instrumental neutron activation analysis (INAA), with data overlain on <strong>the</strong><br />
bedrock geology map presented in Figure 1, and b) Th contents by INAA, with data overlain on a gravity geophysical map (gravity highs in red; lows in blue) modified from Sanders Geophysical<br />
Limited (2008) with ice flow from Tipper (1971).<br />
66 <strong>Geoscience</strong> <strong>BC</strong> Summary of Activities 2011
Figure 4 (continued). Proportional dot maps of selected elements in heavy mineral separates from till samples: c) Cr contents by instrumental neutron activation analysis (INAA), with data<br />
overlain on <strong>the</strong> bedrock geology map presented in Figure 1, and d) Ta contents by INAA, with data overlain on a gravity geophysical map (gravity highs in red; lows in blue) modified from<br />
Sanders Geophysical Limited (2008) with ice flow from Tipper (1971).<br />
<strong>Geoscience</strong> <strong>BC</strong> Report 2012-1 67
References<br />
Armstrong, J.E., Crandell, D.R., E<strong>as</strong>terbrook, D.J. and Noble, J.B.<br />
(1965): Late Pleis<strong>to</strong>cene stratigraphy and chronology in<br />
south-western British Columbia and north-western W<strong>as</strong>hing<strong>to</strong>n;<br />
Geological Society of America Bulletin, v. 72,<br />
p. 321–330.<br />
Averill, S.A. (2001): The application of heavy indica<strong>to</strong>r mineralogy<br />
in mineral exploration with emph<strong>as</strong>is on b<strong>as</strong>e metal indica<strong>to</strong>rs<br />
in glaciated metamorphic and plu<strong>to</strong>nic terrains;<br />
Geological Society Special Publications, v. 185, p. 69–81.<br />
<strong>BC</strong> Geological Survey (2011): MINFILE <strong>BC</strong> mineral deposits datab<strong>as</strong>e;<br />
<strong>BC</strong> Ministry of Energy and Mines, URL<br />
[September 2011].<br />
Clague, J.J. (1989): Chapter 1: Quaternary geology of <strong>the</strong> Canadian<br />
Cordillera; in Quaternary Geology of Canada and<br />
Greenland, R.J. Ful<strong>to</strong>n (ed.), Geology of Canada Series No.<br />
1., p. 17–96.<br />
Dreimanis, A. (1989): Tills: <strong>the</strong>ir genetic terminology and cl<strong>as</strong>sification;<br />
in Genetic Cl<strong>as</strong>sification of Glacigenic Deposits,<br />
R.P. Goldthwait and C.L. Matsch (ed.), A.A. Balkema, Rotterdam,<br />
p. 17–83.<br />
Holland, S.S. (1976): Landforms of British Columbia – a physiographic<br />
outline; <strong>BC</strong> Ministry of Energy and Mines, Bulletin<br />
48, 138 p.<br />
Levson, V.M. (2001): Regional till geochemical surveys in <strong>the</strong> Canadian<br />
Cordillera: sample media, methods and anomaly<br />
evaluation; in Drift Exploration in Glaciated Terrain,<br />
M.B. McClenaghan, P.T. Bobrowsky, G.E.M. Hall and<br />
S.J. Cook (ed.), The Geological Society, Special Publication<br />
no. 185, p. 45–68.<br />
Levson, V.M. and Giles, T.R. (1997): Quaternary geology and till<br />
geochemistry studies in <strong>the</strong> Nechako and Fr<strong>as</strong>er plateaus,<br />
central British Columbia; in Interior Plateau <strong>Geoscience</strong><br />
Project: Summary of Geological, Geochemical and Geophysical<br />
Studies, L.J. Diakow, P. Metcalfe and J. Newell<br />
(ed.), <strong>BC</strong> Ministry of Energy and Mines, Paper 1997-2,<br />
p. 121–145.<br />
Logan, J.M., Schiarizza, P., Struik, L.C., Barnett, C., Nelson, J.L.,<br />
Kowalczyk, P., Ferri, F., Mihalynuk, M.G., Thom<strong>as</strong>, M.D.,<br />
Gammon, P., Lett, R., Jackaman, W. and Ferbey, T. (2010):<br />
Bedrock geology of <strong>the</strong> QUEST map area, central British<br />
Columbia; <strong>Geoscience</strong> <strong>BC</strong>, Report 2010-5 and <strong>BC</strong> Ministry<br />
of Energy and Mines, <strong>Geoscience</strong> Map 2010-1 and Geological<br />
Survey of Canada, Open File 6476, URL [November 2010].<br />
Ma<strong>the</strong>ws, W.H. (1986): Physiographic map of <strong>the</strong> Canadian Cordillera;<br />
Geological Survey of Canada, “A” Series Map<br />
1710A, scale 1:5 000 000.<br />
McClenaghan, M.B. (2005): Indica<strong>to</strong>r mineral methods in mineral<br />
exploration; Geochemistry: Exploration, Environment,<br />
Analysis, v. 5, p. 233–245.<br />
McClenaghan, M.B., Ward, B.C., Kjarsgaard, I.M.,<br />
Kjarsgaard, B.A., Kerr, D.E. and Dredge, L.A. (2002): Indica<strong>to</strong>r<br />
mineral and till geochemical dispersal patterns <strong>as</strong>sociated<br />
with <strong>the</strong> Ranch Lake kimberlite, Lac de Gr<strong>as</strong> region,<br />
NWT, Canada; Geochemistry: Exploration, Environment,<br />
Analysis, v. 2, p. 299–320.<br />
Plouffe, A. (1997): Ice flow and late glacial lakes of <strong>the</strong> Fr<strong>as</strong>er glaciation,<br />
central British Columbia; inCurrent Research<br />
1997-A, Geological Survey of Canada, p. 133–143.<br />
Plouffe, A. (2000): Quaternary geology of <strong>the</strong> Fort Fr<strong>as</strong>er and<br />
Manson River map are<strong>as</strong>, central British Columbia; Geological<br />
Survey of Canada, Bulletin 554, 62 p.<br />
Sacco, D.A., Ward, B.C., Maynard, D., Geertsema, M. and<br />
Reichheld, S. (2010): Terrain mapping, glacial his<strong>to</strong>ry and<br />
drift prospecting in <strong>the</strong> northwest corner of McLeod Lake<br />
map area (part of NTS 093J), central British Columbia; in<br />
<strong>Geoscience</strong> <strong>BC</strong> Summary of Activities 2009, <strong>Geoscience</strong><br />
<strong>BC</strong>, Report 2010-1, p. 33–42, URL [November 2011].<br />
Sander Geophysics Limited (2008): Airborne gravity survey,<br />
Quesnellia Region, British Columbia; <strong>Geoscience</strong> <strong>BC</strong>, Report<br />
2008-08, 121 p., URL [November 2011].<br />
Struik, L.C. (1994): Geology of <strong>the</strong> Mcleod Lake map area (93J),<br />
British Columbia; Geological Survey of Canada, Open File<br />
2439, 18 p.<br />
Tipper, H.W. (1971): Glacial geomorphology and Pleis<strong>to</strong>cene his<strong>to</strong>ry<br />
of central British Columbia; Geological Survey of Canada,<br />
Bulletin 196, 89 p.<br />
Ward, B.C., Leybourne, M.I. and Sacco, D.N. (2011): Drift prospecting<br />
within <strong>the</strong> QUEST Project area, central British Columbia<br />
(NTS 093J): potential for porphyry copper-gold,<br />
volcanogenic m<strong>as</strong>sive sulphide mineralization and goldcopper<br />
veins; in <strong>Geoscience</strong> <strong>BC</strong> Summary of Activities<br />
2011, <strong>Geoscience</strong> <strong>BC</strong>, Report 2011-1, p. 73–96, URL<br />
[November 2011].<br />
Ward, B., Maynard, D., Geertsema, M. and Rabb, T. (2009): Iceflow<br />
his<strong>to</strong>ry, drift thickness and drift prospecting for a portion<br />
of <strong>the</strong> QUEST Project area, central British Columbia<br />
(NTS 093G, H [west half], J); in <strong>Geoscience</strong> <strong>BC</strong> Summary of<br />
Activities 2008, <strong>Geoscience</strong> <strong>BC</strong>, Report 2009-1, p. 25–32,<br />
URL [November<br />
2011].<br />
68 <strong>Geoscience</strong> <strong>BC</strong> Summary of Activities 2011
Chemical Variations of Pyroxene and Fe-Ti–Oxide Crystals in B<strong>as</strong>alts Hosting Cu-<br />
Au Porphyry Mineralization in <strong>the</strong> Quesnel Terrane, Interior British Columbia<br />
(NTS 092H, I, P, 093A, J, N)<br />
S. Vaca, Mineral Deposit Research Unit, University of British Columbia, Vancouver, <strong>BC</strong>, svaca@eos.ubc.ca<br />
T. Bissig, Mineral Deposit Research Unit, University of British Columbia, Vancouver, <strong>BC</strong><br />
M. Raudsepp, Department of Earth and Ocean Sciences, University of British Columbia, Vancouver, <strong>BC</strong><br />
C.J.R. Hart, Mineral Deposit Research Unit, University of British Columbia, Vancouver, <strong>BC</strong><br />
Vaca, S., Bissig, T., Raudsepp, M. and Hart, C.J.R. (2012): Chemical variations of pyroxene and Fe-Ti–oxide crystals in b<strong>as</strong>alts hosting<br />
Cu-Au porphyry mineralization in <strong>the</strong> Quesnel terrane, interior British Columbia (NTS 092H, I, P, 093A, J, N); in <strong>Geoscience</strong> <strong>BC</strong> Summary<br />
of Activities 2011, <strong>Geoscience</strong> <strong>BC</strong>, Report 2012-1, p. 69–78.<br />
Introduction<br />
The Late Tri<strong>as</strong>sic Quesnel terrane is mainly<br />
composed of rocks of <strong>the</strong> Nicola Group and its<br />
along-strike equivalent Takla Group, both of<br />
which are largely composed of alkalic and lesser<br />
calcalkalic b<strong>as</strong>alts, derivative volcanic products<br />
and <strong>as</strong>sociated arc-fringing sedimentary strata<br />
(Dawson, 1879; Pre<strong>to</strong>, 1979; Mortimer, 1987).<br />
Hereafter, <strong>the</strong>se two groups are referred <strong>to</strong> <strong>as</strong> <strong>the</strong><br />
Nicola Group. The Quesnel terrane in British<br />
Columbia is known <strong>to</strong> host several alkalic porphyry<br />
Cu-Au deposits, including (from north <strong>to</strong><br />
south) Lorraine, Mount Milligan, Mount Polley,<br />
Af<strong>to</strong>n/Ajax and Copper Mountain (Figure 1).<br />
Variation in <strong>the</strong> magnetic susceptibility values<br />
and Fe 2+ /Fe 3+ ratios in b<strong>as</strong>alts from different localities<br />
in central Quesnel terrane have been<br />
previously documented by Bissig et al. (2010)<br />
and Vaca et al. (2011). These authors showed<br />
that <strong>the</strong> volcanic arc can be subdivided on <strong>the</strong><br />
b<strong>as</strong>is of variation in oxidation state and magnetic<br />
susceptibility. Porphyry Cu-Au deposits<br />
broadly coeval with volcanism at Mount Polley<br />
are hosted in a relatively oxidized and alkaline<br />
part of <strong>the</strong> arc when compared <strong>to</strong> are<strong>as</strong> devoid of coeval<br />
porphyry style of mineralization. Although <strong>the</strong> le<strong>as</strong>t altered<br />
b<strong>as</strong>alts were studied, <strong>the</strong> magnetic susceptibility and Fe 3+<br />
content may be influenced by low temperature alteration<br />
processes. Thus, in this paper we present an alternate way<br />
<strong>to</strong> estimate oxidation state and alkalinity of magm<strong>as</strong> using<br />
<strong>the</strong> chemistry of effectively unaltered phenocrysts.<br />
Figure 1. Spatial distribution of Cu-Au porphyry deposits in <strong>the</strong> Quesnel<br />
terrane of interior British Columbia (<strong>the</strong> Lorraine deposit is located north of <strong>the</strong><br />
area covered by <strong>the</strong> figure).<br />
Clinopyroxene is <strong>the</strong> most common phenocryst in b<strong>as</strong>alts<br />
of <strong>the</strong> Quesnel terrane. Pyroxenes from different Nicola<br />
Group map units around <strong>the</strong> Mount Polley Cu-Au porphyry<br />
deposit (Logan and Bath, 2005; Logan et al., 2007) were selected<br />
for microanalytical geochemistry. Clinopyroxene<br />
compositions from <strong>the</strong>se are<strong>as</strong> were compared with those<br />
from o<strong>the</strong>r localities, along strike but still within <strong>the</strong> arc<br />
(Figure 1).<br />
Keywords: Nicola Group, alkalic porphyry, microprobe,<br />
pyroxene, b<strong>as</strong>alt<br />
This publication is also available, free of charge, <strong>as</strong> colour digital<br />
<strong>file</strong>s in Adobe Acrobat ® <strong>PDF</strong> format from <strong>the</strong> <strong>Geoscience</strong> <strong>BC</strong><br />
website: http://www.geosciencebc.com/s/DataRele<strong>as</strong>es.<strong>as</strong>p.<br />
Scanning electron microscopy (SEM) and electron microprobe<br />
(EMP) analyses were performed <strong>to</strong> obtain qualitative<br />
and quantitative analyses of <strong>the</strong> chemical variations within<br />
and between pyroxene crystals. In addition, <strong>the</strong> composi-<br />
<strong>Geoscience</strong> <strong>BC</strong> Report 2012-1 69
tion of <strong>the</strong> Fe-Ti–oxide inclusions within pyroxene w<strong>as</strong> determined.<br />
Pyroxene and Fe-Ti–oxide chemistry records <strong>the</strong> alkalinity<br />
and oxidation state of parent magma (Kushiro, 1960;<br />
LeB<strong>as</strong>, 1962; Taylor, 1964). High oxidation state is an important<br />
characteristic of igneous rocks related <strong>to</strong> porphyry<br />
Cu-Au mineralization (e.g., Seedorff et al., 2005; Chamberlain<br />
et al., 2007). Thus, studying chemical changes of<br />
minerals within b<strong>as</strong>alts will lead <strong>to</strong> a more complete understanding<br />
of <strong>the</strong> magmatic evolution of <strong>the</strong> arc. This might<br />
generate new ide<strong>as</strong> on <strong>the</strong> prospectivity for comagmatic<br />
Cu-Au porphyry mineralization in different arc segments.<br />
Samples<br />
Sampling w<strong>as</strong> conducted during <strong>the</strong> 2009 and 2010 summer<br />
field se<strong>as</strong>ons and w<strong>as</strong> focused on coherent volcanic<br />
rocks from different localities along <strong>the</strong> Quesnel terrane<br />
(Figure 1).<br />
The are<strong>as</strong> studied in this research include<br />
Mount Polley, where host volcanic rocks are interpreted<br />
<strong>to</strong> be broadly coeval with <strong>the</strong> mineralization (Bailey and<br />
Hodgson, 1979; Logan and Bath, 2005); three different<br />
map units of volcanic host rocks around this alkalic silica-undersaturated<br />
Cu-Au porphyry deposit were sampled<br />
(see Figure 2);<br />
Mount Milligan, where b<strong>as</strong>altic host rocks are cut by silica-saturated<br />
alkalic porphyry Cu-Au mineralization<br />
that is approximately 20 m.y. younger (Nelson and<br />
Bellefontaine, 1996);<br />
Copper Mountain, where silica-saturated alkalic Cu-Au<br />
porphyry deposits are interpreted <strong>to</strong> be coeval with <strong>the</strong><br />
volcanic host rocks, paleon<strong>to</strong>logical data of <strong>the</strong> south-<br />
Figure 2. Different map units at <strong>the</strong> Mount Polley area, showing <strong>the</strong> location of <strong>the</strong> samples used in this research (Modified<br />
from Logan et al., 2007).<br />
70 <strong>Geoscience</strong> <strong>BC</strong> Summary of Activities 2011
e<strong>as</strong>tern part of <strong>the</strong> Nicola Group is Late Norian,<br />
ca. 204 Ma and intrusive bodies in <strong>the</strong> Copper Mountain<br />
complex date <strong>to</strong> ca. 200–205 Ma (Carter et al., 1991;<br />
Mortensen et al., 1995);<br />
Woodjam prospect, which features silica-saturated porphyry<br />
Cu-Au-Mo mineralization; recent detailed mapping<br />
by Blackwell et al. (2010) revealed that a rock unit<br />
previously mapped <strong>as</strong> a plagiocl<strong>as</strong>e porphyry s<strong>to</strong>ck is<br />
actually part of <strong>the</strong> volcanic succession, presenting an<br />
age of ca. 204 Ma, while <strong>the</strong> age of <strong>the</strong> intrusion is<br />
ca. 196.84 Ma (Schiarizza unpublished zircon ages in<br />
Logan et al., 2011), thus, volcanic rocks here are approximately<br />
7 m.y. older than <strong>the</strong> fertile intrusions;<br />
LaclaHacheprospect,whereCu-Au mineralization is<br />
interpreted <strong>to</strong> be related <strong>to</strong> alkalic intrusions (Schiarizza<br />
et al., 2008), both host rock and mineralization ages are<br />
unknown; and<br />
exposures around Prince George, Bridge Lake and<br />
south of Merritt, that represent apparently barren arc segments<br />
(Figure 1).<br />
Analytical Procedures<br />
Magnetic susceptibility w<strong>as</strong> me<strong>as</strong>ured in <strong>the</strong> field using a<br />
KT-9 Kappameter handheld instrument. The values reported<br />
are <strong>the</strong> average of 10 readings over <strong>the</strong> outcrop. Polished<br />
thin sections were prepared from 17 rock samples<br />
from different locations in <strong>the</strong> study area, for petrography,<br />
SEM and EMP analyses. All analyses were conducted in<br />
<strong>the</strong> labora<strong>to</strong>ries at <strong>the</strong> Department of Earth and Ocean Sciences,<br />
University of British Columbia.<br />
Detailed petrographic observations were made using transmitted<br />
and reflected light microscopy. Polished thin sections<br />
were carbon coated in an Edwards Au<strong>to</strong> 306 carboncoater<br />
instrument. The SEM analyses were done with a Philips<br />
XL-30 scanning electron microscope/Bruker Quan -<br />
ta 200 energy-dispersion X-ray microanalysis system.<br />
Chemical compositions of pyroxene and Fe-Ti oxides were<br />
determined using a fully au<strong>to</strong>mated CAMECA SX-50<br />
electron microprobe. Pyroxene compositions were me<strong>as</strong>ured<br />
with <strong>the</strong> following operating conditions: excitation<br />
voltage, 15 kV; beam current, 20 nA; peak count-time, 20 s;<br />
background count-time, 10 s; spot diameter, 5 m. The Fe-<br />
Ti–oxide analyses were obtained using <strong>the</strong> same operating<br />
conditions <strong>as</strong> pyroxene. Standards for pyroxene and Fe-Ti–<br />
oxide analyses are indicated in Table 1.<br />
Data reduction for w<strong>as</strong> done using <strong>the</strong> ‘PAP’ (Z) method<br />
(Pouchou and Pichoir, 1985). The structural formul<strong>as</strong> of<br />
pyroxene were calculated on <strong>the</strong> b<strong>as</strong>is of 6 O; for Fe-Ti oxides,<br />
structural formul<strong>as</strong> were calculated on <strong>the</strong> b<strong>as</strong>is of<br />
32 O. The Fe 3+ content w<strong>as</strong> calculated using <strong>the</strong> method proposed<br />
by Droop (1987).<br />
Petrography<br />
Detailed petrographic study shows that all samples are b<strong>as</strong>alts,<br />
except for one sample collected from <strong>the</strong> Woodjam<br />
property, which is a b<strong>as</strong>altic andesite. The rocks are porphyritic,<br />
with a visual estimation of 30–60% phenocrysts<br />
per sample, ranging from 1 <strong>to</strong> 5 mm in diameter. Phenocrysts<br />
are mainly euhedral <strong>to</strong> subhedral clinopyroxene, tabular<br />
plagiocl<strong>as</strong>e and, in <strong>the</strong> most alkaline b<strong>as</strong>alts, euhedral<br />
<strong>to</strong> anhedral analcime is present. Mineral proportions vary<br />
according <strong>to</strong> sample location <strong>as</strong> demonstrated in Table 2.<br />
Groundm<strong>as</strong>s in all samples consists of fine-grained<br />
plagiocl<strong>as</strong>e, clinopyroxene, opaque minerals and products<br />
of volcanic gl<strong>as</strong>s devitrification.<br />
The rocks are weakly altered, with a chlorite-calcite-epidote<br />
<strong>as</strong>semblage, overprinting <strong>the</strong> fine-grained groundm<strong>as</strong>s;<br />
hematite is also locally present.<br />
Scanning Electron Microscopy and Electron<br />
Microprobe Analyses<br />
Clinopyroxene<br />
In all samples, clinopyroxene crystals are colourless <strong>to</strong> pale<br />
green in transmitted light, 4 mm, euhedral <strong>to</strong> subhedral,<br />
Table 1. Standards, analysis lines and crystals used for pyroxene and Fe-Ti–oxide analyses.<br />
Pyroxene<br />
albite, Na K , TAP<br />
kyanite, Al K , TAP<br />
diopside, Mg K , TAP<br />
diopside, Si K , TAP<br />
diopside, Ca K ,PET<br />
rutile, Ti K , PET<br />
syn<strong>the</strong>tic magnesiochromite, Cr K , LIF<br />
syn<strong>the</strong>tic rhodonite, Mn K , LIF<br />
syn<strong>the</strong>tic fayalite, Fe K , LIF<br />
syn<strong>the</strong>tic Ni 2 SiO 4 ,Ni K , LIF<br />
Fe-Ti oxides<br />
syn<strong>the</strong>tic spinel, Al K ,TAP<br />
syn<strong>the</strong>tic magnesiochromite, Mg K ,TAP<br />
diopside, Si K ,TAP<br />
diopside, Ca K , PET<br />
rutile,Ti K ,PET<br />
syn<strong>the</strong>tic magnesiochromite, Cr K ,LIF<br />
syn<strong>the</strong>tic rhodonite, Mn K ,LIF<br />
syn<strong>the</strong>tic fayalite, Fe K ,LIF<br />
syn<strong>the</strong>tic Ni 2 SiO 4 ,Ni K ,LIF<br />
vanadium metal, V K ,PET<br />
Abbreviations: LIF, lithium fluoride; PET, pentaerythri<strong>to</strong>l; TAP, thallium acid phthalate<br />
<strong>Geoscience</strong> <strong>BC</strong> Report 2012-1 71
Table 2. List of samples showing <strong>the</strong> amounts of <strong>the</strong> most important phenocryst ph<strong>as</strong>es and <strong>the</strong> occurrence of Fe-Ti oxides and hematite<br />
within <strong>the</strong> b<strong>as</strong>alts. Magnetic-susceptibility values indicate <strong>the</strong> presence and amount of magnetite. All of <strong>the</strong> samples have been affected by<br />
weak epidote-chlorite-calcite alteration.<br />
Sample ID<br />
UTM: NAD 83, Zone 10S<br />
Main phenocryst ph<strong>as</strong>es<br />
Location<br />
E<strong>as</strong>ting Northing Cpx (%) Plag (%) Anl (%)<br />
PSV002 588966 5830062 Mount Polley-LTNav 30 14 12 1 x 21.5<br />
PSV003 589059 5830056 Mount Polley-LTNav 30 15 1 41.9<br />
PSV007 589328 5825476 Mount Polley-LTNpt 10 50 1 2 70.1<br />
PSV009 588497 5820559 Mount Polley-LTNpv 25 35 1 2 70<br />
PSV016 597756 5826139 Mount Polley-LTNpv 25 4 1 23.7<br />
PSV017 597925 5822708 Mount Polley-LTNpv 30 3 7
Figure 4. Pyroxene quadrilateral compositions for b<strong>as</strong>alts of <strong>the</strong> Quesnel terrane. The circled field corresponds <strong>to</strong> pyroxene from core <strong>to</strong> rim<br />
of <strong>the</strong> Woodjam sample, and some spots from cores and interiors of pyroxene crystals from samples collected near Bridge Lake and Mount<br />
Polley. The pyroxene quadrilateral is that of Morimo<strong>to</strong> (1988).<br />
Fe, and includes <strong>the</strong> Woodjam sample and some spots from<br />
cores and interiors only (no rims) of <strong>the</strong> Bridge Lake sample<br />
and Mount Polley samples (PSV007, PSV016,<br />
PSV017, PSV026 and PSV039, refer <strong>to</strong> Figure 2).<br />
Chemical composition of pyroxene is characterized by a<br />
nearly constant Ca content of ~0.9 cations per formula unit<br />
(cpfu); <strong>the</strong> Mg# (100*Mg 2+ /(Mg 2+ +Fe 2+ ) ranges from<br />
76.27 <strong>to</strong> 98.12, showing an overlap among <strong>the</strong> different<br />
rock units (Figure 5). Most spot analyses from Copper Mountain,<br />
Lac la Hache north, South of Merritt and unit LTNav at<br />
Mount Polley fall above an empirically defined division<br />
line at Mg# of 85, where<strong>as</strong> pyroxene from Mount Milligan,<br />
Lac la Hache south, Bridge Lake, Prince George and unit<br />
LTNpt at Mount Polley fall mostly below this line. Analy-<br />
Figure 5. Chemical distribution b<strong>as</strong>ed on <strong>the</strong> content of SiO 2 and Mg# from electron microprobe (EMP) analyses of<br />
pyroxene crystals in b<strong>as</strong>alts of <strong>the</strong> Nicola Group. High Mg# is indicative of primitive melts. D<strong>as</strong>hed brown line outlines<br />
pyroxene analyses from Woodjam, with some core and interior analyses from Bridge Lake and Mount Polley.<br />
<strong>Geoscience</strong> <strong>BC</strong> Report 2012-1 73
ses from <strong>the</strong> unit LTNpv plot both above and below this reference<br />
line.<br />
Ano<strong>the</strong>r group of spots with high Mg# (85.56–98.12) and<br />
SiO 2 (51.03–54.05%) content (Figure 5, <strong>to</strong>p right, d<strong>as</strong>hed<br />
brown line) corresponds <strong>to</strong> core and interiors of pyroxene<br />
analyses from Woodjam and some from Bridge Lake and<br />
Mount Polley. This group matches with <strong>the</strong> group with<br />
lower Fe values in Figure 4. Pyroxene crystals contain sufficient<br />
Si and Al <strong>to</strong> fill <strong>the</strong> tetrahedral site (Al IV ), except for<br />
a few analyses from Bridge Lake and Mount Polley samples,<br />
which require addition of Fe 3+ (0.03–0.018 cpfu).<br />
This group also coincides with <strong>the</strong> analyses outlined in <strong>the</strong><br />
Figure 4 (<strong>to</strong>p left) and Figure 5 (<strong>to</strong>p right).<br />
Overall calculated Fe 3+ within clinopyroxene present values<br />
ranging from 0.002 <strong>to</strong> 0.19 cpfu and Al IV numbers between<br />
0.006 and 0.25 cpfu (Figure 6A); overlap among <strong>the</strong><br />
different localities is common, however, some trends in <strong>the</strong><br />
data can be recognized. Pyroxene from Copper Mountain,<br />
Bridge Lake, Lac la Hache north, units LTNav and LTNpv<br />
at Mount Polley and south of Merritt have a consistently<br />
Figure 6. Cation relationships for clinopyroxene crystals from samples of Nicola Group b<strong>as</strong>alts: A) direct relationship<br />
between Al IV and Fe 3+ in pyroxene composition from core <strong>to</strong> rim; B) negative correlation between (Si 4+ +Fe 2+ ) and (Al IV<br />
+Fe 3+ ) in pyroxene indicating higher oxygen fugacity (FO 2 ) with lower Si 4+ +Fe 2+ . D<strong>as</strong>hed brown line outlines pyroxene<br />
analyses from Woodjam, with some core and interior analyses from Bridge Lake and Mount Polley.<br />
74 <strong>Geoscience</strong> <strong>BC</strong> Summary of Activities 2011
higher calculated Fe 3+ (~0.10–0.19 cpfu) and Al IV (~0.13–<br />
0.25 cpfu) content, compared with Fe 3+ (0.002–0.13 cpfu)<br />
and Al IV (0.006–0.15 cpfu) from <strong>the</strong> Mount Milligan,<br />
Mount Polley unit LTNpt, Lac la Hache south, Prince<br />
George and Woodjam samples. Some analyses (core and<br />
interiors) of clinopyroxene from Bridge Lake and from all<br />
units at Mount Polley also belong <strong>to</strong> this latter group<br />
(Figure 6A, bot<strong>to</strong>m left).<br />
Woodjam. However, at Bridge Lake and Mount Polley <strong>the</strong><br />
chemistry varies from core <strong>to</strong> rim, indicating a pyroxene<br />
fractionation trend, where <strong>the</strong> cores are richer in Mg and Si<br />
and poorer in Fe, Ti and Al than <strong>the</strong> rims, which suggests a<br />
rapid change in <strong>the</strong> temperature-composition (T-X) param-<br />
The Al IV values incre<strong>as</strong>e directly proportional <strong>to</strong> Fe 3+ contents<br />
(Figure 6A), but (Si 4+ +Fe 2+ )and(Al IV +Fe 3+ ) show<br />
negative correlation (Figure 6B). These data suggest that<br />
clinopyroxene from samples obtained from Copper Mountain,<br />
Bridge Lake (rims), Lac la Hache north, LTNav and<br />
LTNpv units near Mount Polley and south of Merritt crystallized<br />
from a melt with higher relative oxygen fugacity<br />
than <strong>the</strong> o<strong>the</strong>rs.<br />
Fe-Ti–Oxide Minerals<br />
Primary Fe-Ti–oxide minerals are commonly present <strong>as</strong> inclusions<br />
within clinopyroxene in <strong>the</strong> study area. These oxides<br />
exhibit subsolidus exsolution features, and distinctive<br />
compositions and textures (Figure 7). Representative analyses<br />
of primary Fe-Ti oxides show variable Fe 3+ ,Tiand<br />
Fe 2+ contents (Figure 8). A few spot analyses in exsolution<br />
lamellae within crystals from <strong>the</strong> LTNpt unit at Mount<br />
Polley (Figure 7C), Lac la Hache south and Prince George<br />
are depleted in Fe 3+ and relatively enriched in Ti. The former<br />
plots within <strong>the</strong> ferropseudobrookite and ilmenite<br />
fields respectively; <strong>the</strong> latter plots within <strong>the</strong> ulvoespinel<br />
field (Figure 8).<br />
The remaining spot analyses from Lac la Hache south and<br />
Prince George samples show titanomagnetite compositions,<br />
while <strong>the</strong> remaining spots from <strong>the</strong> LTNpt unit span<br />
from titanomagnetite <strong>to</strong> maghemite (cation-deficient<br />
spinel) compositions (Figure 8). The Fe-Ti oxides from<br />
Mount Milligan plot <strong>as</strong> a relatively Fe 2+ -rich magnetite.<br />
The o<strong>the</strong>r crystals analyzed from samples of Mount Polley<br />
LTNav and LTNpv units, Bridge Lake, Lac la Hache north,<br />
Copper Mountain, south of Merritt and Woodjam tend <strong>to</strong><br />
incre<strong>as</strong>e <strong>the</strong> ferric iron content, falling in <strong>the</strong> titanomagnetite,<br />
magnetite and maghemite fields.<br />
Discussion and Conclusions<br />
The results presented above show some systematic differences<br />
among <strong>the</strong> b<strong>as</strong>alts studied, on <strong>the</strong> b<strong>as</strong>is of pyroxene<br />
and Fe-Ti–oxide chemistry. The EMPanalyses from core <strong>to</strong><br />
rim in clinopyroxene from <strong>the</strong> Woodjam area presents high<br />
Mg# and SiO 2 %, low Fe and Al cpfu values (Figures 5 and<br />
6A) relative <strong>to</strong> those from samples collected in <strong>the</strong> o<strong>the</strong>r are<strong>as</strong>.<br />
This denotes a relatively homogeneous, primitive and<br />
reduced magma chamber. Some spot analyses in <strong>the</strong> core<br />
and interiors of pyroxene crystals from <strong>the</strong> Bridge Lake and<br />
Mount Polley are<strong>as</strong> are similar in composition <strong>to</strong> those at<br />
Figure 7. Representative backscattered electron images of Fe-Ti–<br />
oxide minerals; electron microprobe (EMP) analysis spots are<br />
showninred:A) magnetite with lamellae of titanomagnetite,<br />
maghemite at <strong>the</strong> border of <strong>the</strong> grain (right side of <strong>the</strong> crystal); B)<br />
magnetite composition in <strong>the</strong> core (dark gray) and titanomagnetite<br />
composition at <strong>the</strong> border (light gray) of <strong>the</strong> crystal; C)<br />
Ferropseudobrookite lamellae (dark gray) within titanomagnetite<br />
grain (light gray).<br />
<strong>Geoscience</strong> <strong>BC</strong> Report 2012-1 75
eters during crystallization. Thus, <strong>the</strong> Bridge Lake sample<br />
and a few samples from Mount Polley suggest a transition<br />
from a primitive, relatively reduced and less alkaline<br />
magma, <strong>to</strong> a less primitive, relatively oxidized and more<br />
alkaline one.<br />
The Al and Fe 3+ contents in pyroxene are indica<strong>to</strong>rs of <strong>the</strong><br />
alkalinity and <strong>the</strong> oxygen fugacity of magma (Kushiro,<br />
1960; LeB<strong>as</strong>, 1962), respectively. Pyroxene from Copper<br />
Mountain, Bridge Lake, Lac la Hache north, LTNav and<br />
LTNpv units at Mount Polley and south of Merritt, is more<br />
alkaline, and crystallized at higher oxygen fugacity, than<br />
<strong>the</strong> pyroxene crystals around <strong>the</strong> Mount Milligan, unit<br />
LTNpt at Mount Polley, Lac la Hache south, Prince George<br />
and Woodjam are<strong>as</strong> (Figure 6A and B). This is consistent<br />
with <strong>the</strong> findings of Mortimer (1987), where pyroxenes<br />
from his alkalic type 1 b<strong>as</strong>alts plot in <strong>the</strong> diopside field and<br />
thus in <strong>the</strong> same area <strong>as</strong> most samples presented herein,<br />
where<strong>as</strong> calcalkalic and transitional tholeiitic lav<strong>as</strong> contain<br />
augitic clinopyroxene.<br />
Chemistry of Fe-Ti–oxide inclusions in pyroxene can be<br />
grouped in<strong>to</strong> two populations. The first one corresponds <strong>to</strong><br />
crystals relatively rich in Fe 3+ , such <strong>as</strong> magnetite and<br />
maghemite from LTNpv and LTNav units at Mount Polley,<br />
Bridge Lake, Lac la Hache north, Copper Mountain, south<br />
of Merritt and Woodjam (Figure 8). The second group corresponds<br />
<strong>to</strong> grains relatively rich in Ti and Fe 2+ , typically<br />
titanomagnetite, showing subsolidus exsolution lamellae<br />
of ferropseudobrookite, ilmenite and ulvoespinel, denoting<br />
relatively reduced conditions of formation. Samples from<br />
unit LTNpt at Mount Polley, Mount Milligan, Lac la Hache<br />
south and Prince George belong <strong>to</strong> this group (Figure 8).<br />
The results presented above are consistent with <strong>the</strong> oxidation<br />
states inferred from <strong>the</strong> pyroxene composition, with<br />
<strong>the</strong> exception of Fe-Ti oxides at Woodjam, which are Fe 3+<br />
rich, potentially due <strong>to</strong> a late alteration process <strong>as</strong> indicated<br />
by secondary hematite affecting <strong>the</strong> groundm<strong>as</strong>s of <strong>the</strong> rock<br />
(Table 2).<br />
This research shows that <strong>the</strong> oxidation state predicted from<br />
Fe-Ti–oxide chemistry is not proportional <strong>to</strong> <strong>the</strong> magnetic<br />
susceptibility of <strong>the</strong> rock (Table 2). The Fe-Ti–oxide minerals<br />
have variable magnetic susceptibility values (Hunt et<br />
al., 1995; Peters and Dekkers, 2003) because <strong>the</strong> magnetic<br />
susceptibility of <strong>the</strong> rock depends on <strong>the</strong> abundance <strong>as</strong> well<br />
<strong>as</strong> type of Fe-Ti minerals.<br />
Comparing <strong>the</strong> petrographic description of <strong>the</strong> collected<br />
samples with <strong>the</strong> chemical composition of pyroxene and<br />
Fe-Ti oxides, it can be concluded that pyroxene and<br />
pyroxene-analcime–bearing b<strong>as</strong>alts of <strong>the</strong> Quesnel terrane<br />
were produced from a more oxidized magma than<br />
pyroxene-plagiocl<strong>as</strong>e–rich b<strong>as</strong>alts.<br />
Considering <strong>the</strong> petrography and pyroxene plus Fe-Ti–oxide<br />
geochemistry, it can be implied that b<strong>as</strong>alts of Copper<br />
Figure 8. The Fe 3+ -Ti-Fe 2+ cpfu (cations per formula unit) contents of Fe-Ti–oxide minerals<br />
<strong>as</strong> inclusions in pyroxene crystals of <strong>the</strong> Nicola Group, British Columbia, plotted<br />
in FeO-Fe 2 O 3 -TiO 2 space after <strong>the</strong> method of Taylor (1964).<br />
76 <strong>Geoscience</strong> <strong>BC</strong> Summary of Activities 2011
Mountain, Lac la Hache north, units LTNav and LTNpv at<br />
Mount Polley, and south of Merritt represent similar<br />
magma-generating conditions that were likely oxidized<br />
and relatively alkaline. Such rocks are found in spatial and<br />
temporal proximity <strong>to</strong> porphyry mineralization at Mount<br />
Polley and Copper Mountain. Thus, <strong>the</strong> magmatic chambers<br />
source of <strong>the</strong> volcanic rocks around south of Merritt,<br />
and Lac la Hache north, may also have had <strong>the</strong> potential <strong>to</strong><br />
develop comagmatic porphyry-style mineralization.<br />
The Bridge Lake area might represent a transition between<br />
reduced and oxidized magma, while <strong>the</strong> unit LTNpt at<br />
Mount Polley, Lac la Hache south, Prince George and<br />
Woodjam may be <strong>the</strong> evidence of a reduced magma-generating<br />
environment. The sources of <strong>the</strong>se lav<strong>as</strong> had probably<br />
less potential <strong>to</strong> evolve in a fertile intrusion.<br />
This research is b<strong>as</strong>ed on <strong>the</strong> mineral chemistry of b<strong>as</strong>alt.<br />
To produce porphyry mineralization, a change in <strong>the</strong> tec<strong>to</strong>nic<br />
setting that results in intrusive ra<strong>the</strong>r than extrusive<br />
magmatism is necessary. However, our work suggests that<br />
indications for a favourable magma-generating environment<br />
are also recorded in <strong>the</strong> precursor volcanic rocks in<br />
prospective arc segments.<br />
Acknowledgments<br />
<strong>Geoscience</strong> <strong>BC</strong> is thanked for <strong>the</strong> economic support <strong>to</strong> this<br />
project. The authors also acknowledge E. Czech and J. Lai<br />
for <strong>the</strong>ir help in <strong>the</strong> SEM-EMP labora<strong>to</strong>ry during sample<br />
preparation and data acquisition. The peer review and comments<br />
provided by M. Mihalynuk helped <strong>to</strong> improve clarity<br />
of this paper.<br />
References<br />
Bailey, D.G. and Hodgson C, J. (1979): Transported altered wall<br />
rock in laharic brecci<strong>as</strong> at <strong>the</strong> Cariboo-Bell Cu-Au porphyry<br />
deposit, British Columbia; Economic Geology, v. 74,<br />
p. 125–12, URL [November 2011].<br />
Bissig, T., Vaca, S., Schiarizza, P. and Hart, C. (2010): Geochemical<br />
and physical variations in <strong>the</strong> Late Tri<strong>as</strong>sic Nicola Arc<br />
and metallogenic implications, central British Columbia<br />
(NTS 092P, 093A, N): preliminary results; in <strong>Geoscience</strong><br />
<strong>BC</strong> Summary of Activities 2009, <strong>Geoscience</strong> <strong>BC</strong>, Report<br />
2010-1, p. 49–52, URL <br />
[November 2011].<br />
Blackwell, J., Lesage, G., Skinner, T., Eckfeldt, M., Hamil<strong>to</strong>n, J.,<br />
Hertel, J., Laird, B., Madsen, J., Rainbow, A., Sherlock, R.<br />
and Sepp, M. (2010): Woodjam property mapping 2010 interpretation,<br />
geology of <strong>the</strong> Woodjam property core area;<br />
unpublished internal report, Gold Fields Canada Exploration.<br />
Carter, E.S., Orchard, M.J., Ross, C.A., Ross, J.R.P., Smith, P.L.<br />
and Tipper, H.W. (1991): Geology of <strong>the</strong> Cordillera Orogen<br />
in Canada, Part B, paleon<strong>to</strong>logical signatures of terranes;<br />
Chapter 2 in, H. Gabrielse and C.J. Yorath (ed.), Geological<br />
Survey of Canada, Geology of Canada, no. 4, p. 28–38 and<br />
The Geology of North America; Geological Society of<br />
America, v. G-2.<br />
Chamberlain, C.M., Jackson, M., Jago, C.P., P<strong>as</strong>s, H.E., Simpson,<br />
K.A., Cooke, D.R. and Tosdal, R.M. (2007): Toward an integrated<br />
model for alkalic porphyry copper deposits in British<br />
Columbia (NTS 093A, N; 104G); in <strong>Geoscience</strong> <strong>BC</strong> Summary<br />
of Activities 2006, <strong>Geoscience</strong> <strong>BC</strong>, Report 2007-1,<br />
p. 259–274, URL [November 2011].<br />
Dawson, G.M. 1879: Preliminary report on <strong>the</strong> physical and geological<br />
features of <strong>the</strong> sou<strong>the</strong>rn portion of <strong>the</strong> interior of British<br />
Columbia, 1877; Geological Survey of Canada, Progress<br />
Report, 1877–1878, p. 96B-101B.<br />
Droop, G.T.R. (1987) A general equation for estimating Fe 3+ concentrations<br />
in ferromagnesian silicates and oxides from<br />
microprobe analyses, using s<strong>to</strong>ichiometric criteria; Mineralogical<br />
Magazine, v. 51, p 431–435.<br />
Hunt, C.P., Moskowitz, B. M. and Banerjee, S. K. (1995): Magnetic<br />
properties of rocks and minerals; in Rock Physics and<br />
Ph<strong>as</strong>e Relations: A Handbook of Physical Constants, T.J<br />
Ahrens (ed.), AGU Reference Shelf 3, American Geophysical<br />
Union, p. 189–204.<br />
Kushiro, I. (1960): Si-Al relations in clinopyroxenes from igneous<br />
rocks; American Journal of Science, v. 258, p. 548–554.<br />
LeB<strong>as</strong>, M.J. (1962): The role of aluminum in igneous<br />
clinopyroxenes with relation <strong>to</strong> <strong>the</strong>ir parentage; American<br />
Journal of Science, v. 260, p. 267–288.<br />
Logan, J.M. and Bath, A.B. (2005): Geochemistry of Nicola<br />
Group b<strong>as</strong>alt from <strong>the</strong> central Quesnel trough at <strong>the</strong> latitude<br />
of Mount Polley (NTS 093A/5, 6, 11, 12), central British Columbia;<br />
in Geological Fieldwork, <strong>BC</strong> Ministry of Energy<br />
and Mines, Paper 2006-1, p. 83–98, URL [November<br />
2011].<br />
Logan, J.M., Bath, A., Mihalynuk, M.G. and Rees, C.J. (2007): Regional<br />
geology of <strong>the</strong> Mount Polley area, central British Columbia;<br />
<strong>BC</strong> Ministry of Energy and Mines, <strong>Geoscience</strong> Map<br />
2007-1, scale 1:50 000, URL [November<br />
2011].<br />
Logan, J.M., Mihalynuk, M.G., Friedman, R.M. and Cre<strong>as</strong>er, R.A.<br />
(2011): Age constraints of mineralization at <strong>the</strong> Brenda and<br />
Woodjam Cu-Mo±Au porphyry deposits - an Early Jur<strong>as</strong>sic<br />
calcalkaline event, south-central British Columbia; in Geological<br />
Fieldwork 2010, <strong>BC</strong> Ministry of Energy and Mines,<br />
Paper 2011-1, p. 129–144, URL [November<br />
2011].<br />
Morimo<strong>to</strong>, N., Fabries, J., Ferguson, A.K., Ginzburg, I.V., Ross,<br />
M.,Seifert,F.A.,Zussman,J.,Aoki,K.andGottardi,G.<br />
(1988): Nomenclature of pyroxenes; American Mineralogist,<br />
v. 173, p. 1123–1133, URL [November<br />
2011].<br />
Mortensen, J.K., Ghosh, D.K. and Ferri, F. (1995): U-Pb geochronology<br />
of intrusive rocks <strong>as</strong>sociated with copper-gold<br />
porphyry deposits in <strong>the</strong> Canadian Cordillera; in Porphyry<br />
Deposits of <strong>the</strong> Northwestern Cordillera of North America,<br />
T.G. Schroeter (ed.), Canadian Institute of Mining, Metallurgy<br />
and Petroleum, Special Volume 46, p. 142–158.<br />
<strong>Geoscience</strong> <strong>BC</strong> Report 2012-1 77
Mortimer, N. (1987): The Nicola Group: Late Tri<strong>as</strong>sic and Early<br />
Jur<strong>as</strong>sic subduction-related volcanism in British Columbia;<br />
Canadian Journal of Earth Sciences, v. 24, p. 2521–2536.<br />
Nelson, J.L. and Bellefontaine, K.A. (1996): The geology and<br />
mineral deposits of north-central Quesnellia; Tezzeron Lake<br />
<strong>to</strong> Discovery Creek, central British Columbia; <strong>BC</strong> Ministry<br />
of Energy and Mines, Bulletin 99, 100 p, URL<br />
[November 2011].<br />
Peters, C. and Dekkers, M.J. (2003): Selected room temperature<br />
magnetic parameters <strong>as</strong> a function of mineralogy, concentration<br />
and grain size; Physics and Chemistry of <strong>the</strong> Earth,<br />
v. 28, no. 16–19, p. 659–667.<br />
Pouchou, J.L. and Pichoir, F. (1985): “PAP” (Z) procedure for<br />
improved quantitative microanalysis; in Microbeam Analysis<br />
-1985, J.T. Armstrong (ed.), San Francisco Press, p. 104–<br />
106.<br />
Pre<strong>to</strong>, V.A. (1979): Geology of <strong>the</strong> Nicola Group between Merritt<br />
and Prince<strong>to</strong>n; <strong>BC</strong> Ministry of Energy and Mines, Bulletin<br />
69, 90 p., URL [November<br />
2011].<br />
Schiarizza, P., Bligh, J., Bluemel, B. and Tait, D. (2008): Geology<br />
of <strong>the</strong> Timothy Lake Area (NTS 092P/14); <strong>BC</strong> Ministry of<br />
Energy and Mines, Open File, 2008-5, 1:50 000 scale, URL<br />
[November<br />
2011].<br />
Seedorff, E., Dilles, J.H., Proffett, J.M., Jr., Einaudi, M.T.,<br />
Zurcher, L., Stav<strong>as</strong>t, W.J.A., Johnson, D. and Bar<strong>to</strong>n, M.D.<br />
(2005): Porphyry deposits: characteristics and origin of<br />
hypogene features; Economic Geology, 100th Anniversary<br />
Volume, p. 251–298.<br />
Taylor, R. W. (1964): Ph<strong>as</strong>e equilibriums in <strong>the</strong> system FeO-<br />
Fe 2O 3-TiO 2 at 1300°C; American Mineralogist, v. 49,<br />
no. 7–8, p. 1016–1030.<br />
Vaca, S., Bissig, T., Mitchinson, D.F., Barker, S. and Hart, C.J.R.<br />
(2011): Variability in <strong>the</strong> b<strong>as</strong>altic rocks hosting Cu-Au porphyry<br />
mineralization in <strong>the</strong> Quesnel terrane, south-central<br />
British Columbia (NTS 092, 093): geochemistry, stable iso<strong>to</strong>pes<br />
and physical properties; in <strong>Geoscience</strong> <strong>BC</strong> Summary<br />
of Activities 2010, <strong>Geoscience</strong> <strong>BC</strong>, Report 2011-1, p. 123–<br />
132, URL [November<br />
2011].<br />
78 <strong>Geoscience</strong> <strong>BC</strong> Summary of Activities 2011
Geological Mapping, Regional Data Compilation and Mineral Evaluation of <strong>the</strong><br />
Burrell Creek Map Area, Sou<strong>the</strong><strong>as</strong>tern British Columbia (NTS 082E/09)<br />
T. Höy, consultant, Sooke, <strong>BC</strong>, thoy@shaw.ca<br />
W. Jackaman, Noble Exploration Services Ltd., Sooke, <strong>BC</strong><br />
Höy, T. and Jackaman, W. (2012): Geological mapping, regional data compilation and mineral evaluation of <strong>the</strong> Burrell Creek map area,<br />
sou<strong>the</strong><strong>as</strong>tern British Columbia (NTS 082E/09); in <strong>Geoscience</strong> <strong>BC</strong> Summary of Activities 2011, <strong>Geoscience</strong> <strong>BC</strong>, Report 2012-1, p. 79–80.<br />
Project Summary<br />
The Burrell Creek project involves geological mapping and<br />
compilation of a large part of <strong>the</strong> area covered by <strong>the</strong><br />
1:50 000 scale Burrell Creek map sheet (NTS 082E/09), located<br />
in <strong>the</strong> Columbia Mountains of sou<strong>the</strong><strong>as</strong>tern British<br />
Columbia (Figure 1). The project is a northward extension<br />
of <strong>the</strong> Deer Park mapping project completed in 2009 (Höy,<br />
2010; Höy and Jackaman, 2010), which focused on <strong>the</strong> potential<br />
for Tertiary mineralization within <strong>the</strong> sou<strong>the</strong>rn<br />
Mon<strong>as</strong>hee Mountains along <strong>the</strong> nor<strong>the</strong>rn margins of <strong>the</strong><br />
Grand Forks gneiss complex (Pre<strong>to</strong>, 1970; Höy and<br />
Jackaman, 2005), and recognized and defined a variety of<br />
b<strong>as</strong>e-metal and precious-metal mineral deposits seemingly<br />
related <strong>to</strong> prominent north- and northwest-trending regional<br />
structures. The Burrell Creek project will extend this<br />
work in<strong>to</strong> an area that h<strong>as</strong> attracted considerable his<strong>to</strong>rical<br />
exploration, due in large part <strong>to</strong> development of <strong>the</strong> Franklin<br />
mining camp (Drysdale, 1915; Keep and Russell, 1989),<br />
but that h<strong>as</strong> seen little university- or government-led research<br />
since a regional (1:250 000 scale) mapping project<br />
by Little in <strong>the</strong> 1950s (Little, 1957) and a regional<br />
(1:250 000 scale) compilation map done in <strong>the</strong> late 1980s<br />
(Tempelman-Kluit, 1989).<br />
Keywords: geology, regional compilations, Grand Forks gneiss<br />
complex, Tertiary extensional faulting, mineral deposit evaluation,<br />
Franklin mining camp<br />
This publication is also available, free of charge, <strong>as</strong> colour digital<br />
<strong>file</strong>s in Adobe Acrobat ® <strong>PDF</strong> format from <strong>the</strong> <strong>Geoscience</strong> <strong>BC</strong><br />
website: http://www.geosciencebc.com/s/DataRele<strong>as</strong>es.<strong>as</strong>p.<br />
The Burrell Creek map sheet is located along <strong>the</strong> e<strong>as</strong>tern<br />
edge of <strong>the</strong> Pentic<strong>to</strong>n map sheet (NTS 082E), 60 km northwest<br />
of <strong>the</strong> Rossland Gold mining camp and approximately<br />
50 km nor<strong>the</strong><strong>as</strong>t of <strong>the</strong> Greenwood camp. The Franklin<br />
mining camp in <strong>the</strong> sou<strong>the</strong>rn part of <strong>the</strong> Burrell Creek map<br />
sheet includes numerous deposits and p<strong>as</strong>t producers related<br />
<strong>to</strong> an alkalic, mafic <strong>to</strong> ultramafic complex. Styles of<br />
mineralization include platinum-palladium-copper mineralization,<br />
contact-metamorphic skarns and precious- and<br />
b<strong>as</strong>e-metal quartz veins. A few o<strong>the</strong>r mineral occurrences,<br />
of largely unknown character and age, are scattered<br />
throughout <strong>the</strong> rest of <strong>the</strong> map area. Recent exploration activity,<br />
largely concentrated in <strong>the</strong> immediate vicinity of <strong>the</strong><br />
Franklin mining camp and in <strong>the</strong> Deer Park map area immediately<br />
<strong>to</strong> <strong>the</strong> south, and <strong>the</strong> results of <strong>the</strong> <strong>Geoscience</strong><br />
<strong>BC</strong> 2009 mapping project have highlighted <strong>the</strong> Tertiary<br />
mineral potential in <strong>the</strong> sou<strong>the</strong>rn Columbia Mountains.<br />
The Burrell Creek project will include approximately<br />
40 days of geological mapping, which will concentrate on<br />
are<strong>as</strong> of higher mineral potential or mineral occurrences <strong>as</strong><br />
well <strong>as</strong> on <strong>the</strong> evaluation and upgrading of <strong>the</strong> mineral occurrence<br />
datab<strong>as</strong>e (MINFILE; <strong>BC</strong> Geological Survey,<br />
2011). It will also include compilation in digital format of<br />
all regional geological, geophysical and geochemical data<br />
collected under <strong>the</strong> National Geochemical Reconnaissance<br />
(NGR) Program and <strong>the</strong> <strong>BC</strong> Regional Geochemical Survey<br />
(RGS) Program, which information will be combined with<br />
mineral occurrence and geology datab<strong>as</strong>es <strong>to</strong> produce several<br />
1:20 000 and 1:50 000 scale geological maps suitable<br />
for directing and focusing mineral exploration. An important<br />
focus of <strong>the</strong> project is mapping and evaluation of Tertiary<br />
intrusive activity and faulting and <strong>the</strong>ir relationships<br />
<strong>to</strong> mineralization. Höy and Jackaman (2010) have shown<br />
that several styles of mineralization in <strong>the</strong> adjacent Deer<br />
Park map area, including b<strong>as</strong>e- and precious-metal veins<br />
and porphyry molybdenite, are in part controlled by Tertiary<br />
extensional tec<strong>to</strong>nics; <strong>the</strong>se models will be fur<strong>the</strong>r developed<br />
and evaluated in <strong>the</strong> Burrell Creek map area, again<br />
with <strong>the</strong> goal of defining exploration targets and regional<br />
controls <strong>to</strong> mineralizing trends.<br />
Geological mapping of <strong>the</strong> sou<strong>the</strong>rn part of <strong>the</strong> Burrell<br />
Creek map area began in late 2011 and will be completed<br />
during <strong>the</strong> 2012 field se<strong>as</strong>on. Data, including integrated<br />
geological maps, poster displays and articles for <strong>the</strong><br />
<strong>Geoscience</strong> <strong>BC</strong> Summary of Activities series, will be rele<strong>as</strong>ed<br />
on completion of <strong>the</strong> project in <strong>the</strong> winter of 2012–<br />
2013.<br />
References<br />
<strong>BC</strong> Geological Survey (2011): MINFILE <strong>BC</strong> mineral deposits datab<strong>as</strong>e;<br />
<strong>BC</strong> Ministry of Energy and Mines, URL [Oc<strong>to</strong>ber 2011].<br />
<strong>Geoscience</strong> <strong>BC</strong> Report 2012-1 79
Figure 1. Location of Burrell Creek map area, sou<strong>the</strong><strong>as</strong>tern British Columbia.<br />
Drysdale, C.W. (1915): Geology of Franklin Mining Camp, British<br />
Columbia; Geological Survey of Canada, Memoir<br />
no. 56, 246 p.<br />
Höy, T. (2010): Geology of <strong>the</strong> Deer Park map area, sou<strong>the</strong><strong>as</strong>tern<br />
British Columbia (NTS 082E/08); in <strong>Geoscience</strong> <strong>BC</strong> Summary<br />
of Activities 2009, <strong>Geoscience</strong> <strong>BC</strong>, Report 2010-1,<br />
p. 127–140.<br />
Höy, T. and Jackaman, W. (2005): Geology of <strong>the</strong> Grand Forks<br />
map sheet; <strong>BC</strong> Ministry of Energy and Mines, <strong>Geoscience</strong><br />
Map 2005-2, scale 1:50 000.<br />
Höy, T. and Jackaman, W. (2010): Geology of <strong>the</strong> Deer Park map<br />
sheet (NTS 82E/08); <strong>Geoscience</strong> <strong>BC</strong> Report 2010-7-1, scale<br />
1:50 000.<br />
Keep, M. and Russell, J.K. (1989): The geology of <strong>the</strong> Averill<br />
plu<strong>to</strong>nic complex, Grand Forks, British Columbia<br />
(82E/9W); in Geological Fieldwork 1988, <strong>BC</strong> Ministry of<br />
Energy and Mines, Paper 1989-1, p. 27–31.<br />
Little, H.W. (1957): Kettle River, British Columbia; Geological<br />
Survey of Canada, Map 6-1957.<br />
Pre<strong>to</strong>, V.A. (1970): Structure and petrology of <strong>the</strong> Grand Forks<br />
Group, <strong>BC</strong>; Geological Survey of Canada, Paper 69-22,<br />
80 p.<br />
Tempelman-Kluit, D. J. (1989): Geology, Pentic<strong>to</strong>n, British Columbia;<br />
Geological Survey of Canada, Map 1736A.<br />
80 <strong>Geoscience</strong> <strong>BC</strong> Summary of Activities 2011
Hydrological Modelling and Decision-Support Tool Development for<br />
Water Allocation, Nor<strong>the</strong><strong>as</strong>tern British Columbia<br />
A. Chapman, <strong>BC</strong> Oil and G<strong>as</strong> Commission, Vic<strong>to</strong>ria, <strong>BC</strong>, Allan.Chapman@<strong>BC</strong>OGC.ca<br />
B. Kerr, Foundry Spatial Ltd., Vic<strong>to</strong>ria, <strong>BC</strong><br />
D. Wilford, <strong>BC</strong> Ministry of Forests, Lands and Natural Resource Operations, Smi<strong>the</strong>rs, <strong>BC</strong><br />
Chapman, A., Kerr, B. and Wilford, D. (2012): Hydrological modelling and decision-support <strong>to</strong>ol development for water allocation, nor<strong>the</strong><strong>as</strong>tern<br />
British Columbia; in <strong>Geoscience</strong> <strong>BC</strong> Summary of Activities 2011, <strong>Geoscience</strong> <strong>BC</strong>, Report 2012-1, p. 81–86.<br />
Introduction<br />
In nor<strong>the</strong><strong>as</strong>tern British Columbia, unconventional g<strong>as</strong> development<br />
requires large quantities of water, with <strong>the</strong> largest<br />
<strong>volume</strong>s of water used for hydraulic fracturing for well<br />
stimulation and completion. The management of water for<br />
industrial uses is <strong>the</strong> responsibility of <strong>the</strong> <strong>BC</strong> Oil and G<strong>as</strong><br />
Commission (OGC), through short-term water use approvals,<br />
and <strong>the</strong> <strong>BC</strong> Ministry of Forests, Lands and Natural Resource<br />
Operations (FLNRO), through long-term water licenses.<br />
For much of nor<strong>the</strong><strong>as</strong>tern <strong>BC</strong>, <strong>the</strong>re is a dearth of<br />
hydrometric me<strong>as</strong>urements <strong>to</strong> directly support decisionmaking<br />
under <strong>the</strong> Water Act. As a result, <strong>the</strong>re is a strong<br />
need for hydrological modelling <strong>to</strong> provide quantified estimates<br />
of monthly, se<strong>as</strong>onal and annual runoff thus allowing<br />
estimations of water availability for water use approvals. A<br />
hydrological modelling pilot project (Chapman and Kerr,<br />
2011), utilizing available gridded climate data and land<br />
cover/vegetation data, and encomp<strong>as</strong>sing <strong>the</strong> Horn River<br />
B<strong>as</strong>in and Liard B<strong>as</strong>in g<strong>as</strong> play are<strong>as</strong>, concluded that <strong>the</strong>re<br />
is utility in pursuing a monthly water balance modelling approach.<br />
Following <strong>the</strong> pilot project, <strong>the</strong> OGC, in partnership<br />
with <strong>Geoscience</strong> <strong>BC</strong> and FLNRO, is now extending<br />
and fine-tuning <strong>the</strong> hydrological modelling <strong>to</strong> all of nor<strong>the</strong><strong>as</strong>tern<br />
<strong>BC</strong>. This paper summarizes <strong>the</strong> current status of <strong>the</strong><br />
modelling project <strong>as</strong> of November 2011. The project is<br />
anticipated <strong>to</strong> be completed in early 2012.<br />
Objectives<br />
The project will complete overview hydrological modelling<br />
for nor<strong>the</strong><strong>as</strong>tern <strong>BC</strong>, and will produce a decision-support<br />
<strong>to</strong>ol (in Arc Server format) <strong>to</strong> be used by <strong>the</strong> OGC and<br />
FLNRO for water use approvals and water licenses under<br />
<strong>the</strong> Water Act. The modelling information and decisionsupport<br />
<strong>to</strong>ol will be available <strong>to</strong> industry, First Nations and<br />
o<strong>the</strong>rs, and will be valuable in helping communicate and<br />
Keywords: hydrological modelling, hydrology, water allocation,<br />
nor<strong>the</strong><strong>as</strong>tern British Columbia<br />
This publication is also available, free of charge, <strong>as</strong> colour digital<br />
<strong>file</strong>s in Adobe Acrobat ® <strong>PDF</strong> format from <strong>the</strong> <strong>Geoscience</strong> <strong>BC</strong><br />
website: http://www.geosciencebc.com/s/DataRele<strong>as</strong>es.<strong>as</strong>p.<br />
understand <strong>the</strong> water resources of nor<strong>the</strong><strong>as</strong>tern <strong>BC</strong>. The<br />
model will provide estimates of monthly and annual natural<br />
runoff, and will provide guidance on hydrological thresholds<br />
necessary for <strong>the</strong> maintenance of environmental flows.<br />
Study Area<br />
This study within nor<strong>the</strong><strong>as</strong>tern <strong>BC</strong> includes <strong>the</strong> unconventional<br />
g<strong>as</strong> play are<strong>as</strong> of <strong>the</strong> Montney Trend, Liard B<strong>as</strong>in,<br />
Horn River B<strong>as</strong>in and <strong>the</strong> Cordova Embayment, from south<br />
of Dawson Creek <strong>to</strong> <strong>the</strong> Yukon and Northwest Terri<strong>to</strong>ries<br />
boundaries in <strong>the</strong> north, and e<strong>as</strong>t of <strong>the</strong> Rocky Mountains <strong>to</strong><br />
<strong>the</strong> Alberta border (Figure 1). Adjacent are<strong>as</strong> of Alberta,<br />
<strong>the</strong> Yukon and NWT have been incorporated <strong>to</strong> facilitate<br />
<strong>the</strong> hydrological modelling in <strong>BC</strong>. The <strong>to</strong>tal area in <strong>BC</strong> under<br />
study is approximately 175 500 km 2 . The climate varies<br />
from cold continental in <strong>the</strong> south <strong>to</strong> cold subarctic in <strong>the</strong><br />
north, characterized by sustained cold winters and warm<br />
summers. Average monthly temperatures for November <strong>to</strong><br />
March are below freezing. There are few climate stations<br />
with long-term records, however, Fort Nelson h<strong>as</strong> a me<strong>as</strong>ured<br />
30-year Normal precipitation of 451 mm, while Fort<br />
St. John h<strong>as</strong> a Normal precipitation of 465 mm. Precipitation<br />
amounts incre<strong>as</strong>e <strong>to</strong> <strong>the</strong> west of <strong>the</strong> study area, in <strong>the</strong><br />
higher elevation terrain of <strong>the</strong> Rocky Mountain foothills.<br />
The streamflow regime is typically nival (snowmelt dominated),<br />
with a sustained cold winter period characterized by<br />
low rates of streamflow and competent river ice. This is followed<br />
by a spring freshet from approximately mid-April <strong>to</strong><br />
late June, characterized by high rates of streamflow <strong>as</strong> <strong>the</strong><br />
winter’s accumulated snow melts. After <strong>the</strong> spring freshet<br />
period, river levels generally recede slowly through <strong>the</strong><br />
summer and autumn until <strong>the</strong> winter freeze-up. Frontal or<br />
convective s<strong>to</strong>rm systems bring varying amounts of rain<br />
from late spring <strong>to</strong> autumn, often resulting in incre<strong>as</strong>es in<br />
river levels and discharge, and occ<strong>as</strong>ionally producing<br />
flooding. The timing of <strong>the</strong> annual peak flow usually coincides<br />
with <strong>the</strong> timing of <strong>the</strong> annual freshet snowmelt runoff,<br />
except for small river b<strong>as</strong>ins, which, on occ<strong>as</strong>ion, can experience<br />
<strong>the</strong>ir largest peak flows from summer frontal or<br />
convective rain s<strong>to</strong>rms.<br />
<strong>Geoscience</strong> <strong>BC</strong> Report 2012-1 81
Figure 1. Modelling study area in nor<strong>the</strong><strong>as</strong>tern British Columbia, showing natural g<strong>as</strong> play are<strong>as</strong> and hydrometric stations used in <strong>the</strong><br />
model calibration.<br />
82 <strong>Geoscience</strong> <strong>BC</strong> Summary of Activities 2011
Data<br />
The water balance model takes a conservation of m<strong>as</strong>s approach<br />
and follows on a concept originally applied by o<strong>the</strong>r<br />
researchers (Solomon, 1968; Moore et al., in press). Key inputs<br />
<strong>to</strong> <strong>the</strong> application for nor<strong>the</strong><strong>as</strong>tern <strong>BC</strong> are<br />
monthly and annual precipitation and temperature grids<br />
from <strong>the</strong> ClimateWNA program (Wang et al., in press),<br />
which are derived from <strong>the</strong> PRISM methodology (Daly<br />
et al., 2008),<br />
gridded evapotranspiration data produced by <strong>the</strong> Consultative<br />
Group on International Agricultural Research<br />
(CGIAR),<br />
land cover and vegetation mapping from Natural Resources<br />
Canada and <strong>the</strong> Province of British Columbia,<br />
and<br />
hydrometric data from <strong>the</strong> Water Survey of Canada<br />
(WSC).<br />
An interim product resulting from <strong>the</strong> model development<br />
is a gridded dat<strong>as</strong>et representing actual evapotranspiration<br />
(AET), incorporating both climate and vegetative controls.<br />
Actual evapotranspiration data produced by CGIAR accounts<br />
for water availability using a modified Hargreaves<br />
approach and takes climate inputs from <strong>the</strong> WorldClim datab<strong>as</strong>e,<br />
a 1 km gridded climate surface representing <strong>the</strong> time<br />
period 1950–2000 (Hijmans et al., 2005; Trabucco and<br />
Zomer, 2010). Within <strong>the</strong> CGIAR data, evapotranspiration<br />
is adjusted according <strong>to</strong> soil moisture content fac<strong>to</strong>rs and<br />
<strong>as</strong>sumes agronomic land cover. The authors have transformed<br />
this estimate of evapotranspiration by incorporating<br />
a vegetation fac<strong>to</strong>r for nor<strong>the</strong><strong>as</strong>tern <strong>BC</strong>. For this procedure,<br />
a vec<strong>to</strong>r coverage of vegetation and land cover w<strong>as</strong><br />
converted <strong>to</strong> r<strong>as</strong>ter values numerically equivalent <strong>to</strong> <strong>the</strong> ratio<br />
of <strong>the</strong> actual evapotranspiration for <strong>the</strong> land cover or<br />
vegetation type <strong>to</strong> that of <strong>the</strong> estimated agronomic evapotranspiration<br />
rate in <strong>the</strong> region. The evapotranspiration values<br />
used for each land-cover type were determined from<br />
several sources (Chapman, 1988; Spittlehouse, 1989; Liu<br />
et al., 2001; Barr et al., 2007) and were adjusted within <strong>the</strong><br />
model.<br />
Model Calibration<br />
Estimates of monthly and annual runoff, <strong>the</strong> ultimate end<br />
product of <strong>the</strong> modelling component of <strong>the</strong> project, were<br />
not produced by running a defined routine through a piece<br />
of software. Instead, routines and components of o<strong>the</strong>r<br />
modelling projects (Solomon et al., 1968; Hock, 2003;<br />
McCabe and Markstron, 2007; Moore et al., in press) were<br />
evaluated, tested and incorporated by closely moni<strong>to</strong>ring<br />
regional data inputs and results. These were evaluated<br />
against prior knowledge of <strong>the</strong> study region, using <strong>the</strong> simple<br />
continuity equation: Q = P-ET, where Q = annual runoff<br />
(mm), P = annual precipitation (mm) and ET = annual<br />
evapotranspiration (mm). Explora<strong>to</strong>ry spatial data analysis<br />
w<strong>as</strong> a large component of this work, and <strong>as</strong> such, <strong>the</strong> end result<br />
will be a product that represents <strong>the</strong> hydrology of<br />
nor<strong>the</strong><strong>as</strong>tern <strong>BC</strong> <strong>as</strong> effectively <strong>as</strong> possible given available<br />
data.<br />
The results of <strong>the</strong> annual runoff modelling were calibrated<br />
against hydrometric data collected by <strong>the</strong> WSC. Fifty-three<br />
hydrometric stations were selected for calibration (Table<br />
1). Not included were gauges on very large drainages<br />
(Peace River, Liard River), lake outlet stations or stations<br />
on drainages with man-made controls. The size of drainage<br />
area ranges from 38 <strong>to</strong> over 43 200 km 2 . The stations are located<br />
in <strong>BC</strong>, western Alberta and <strong>the</strong> sou<strong>the</strong>rn Northwest<br />
Terri<strong>to</strong>ries and in several c<strong>as</strong>es <strong>the</strong> watersheds cross provincial/terri<strong>to</strong>rial<br />
borders. Although <strong>the</strong> objective of this<br />
work w<strong>as</strong> only <strong>to</strong> create estimates for ungauged drainages<br />
in <strong>BC</strong>, <strong>the</strong>se transborder stations and stations wholly located<br />
in adjacent jurisdictions provided critical representation<br />
of portions of <strong>BC</strong> that are ungauged.<br />
A GIS w<strong>as</strong> used <strong>to</strong> generate statistics for each watershed<br />
used in <strong>the</strong> calibration through a simple overlay operation.<br />
Once precipitation and climate-adjusted evapotranspiration<br />
for each of <strong>the</strong> gauged watersheds were calculated,<br />
<strong>the</strong>se values were collated in<strong>to</strong> a spreadsheet for fur<strong>the</strong>r<br />
analysis and incorporation of <strong>the</strong> vegetation component of<br />
evapotranspiration. The percentage of each type of vegetative<br />
cover w<strong>as</strong> determined for each watershed through a<br />
GIS overlay and added <strong>to</strong> <strong>the</strong> calculation.<br />
Significant variability, <strong>as</strong> well <strong>as</strong> error, exists in <strong>the</strong> natural<br />
processes represented by all components of <strong>the</strong> model and<br />
also in <strong>the</strong> hydrometric data <strong>to</strong> which model results are<br />
compared. Preliminary results for <strong>the</strong> annual runoff modelling<br />
indicate a mean error of 5.5%, with 75% of <strong>the</strong> calibration<br />
b<strong>as</strong>ins having estimates within ±20% of <strong>the</strong> me<strong>as</strong>ured<br />
mean annual runoff. Unlike Moore et al. (in press) who<br />
used a water balance modelling approach <strong>to</strong> estimate<br />
monthly runoff, <strong>the</strong> authors used a statistical model b<strong>as</strong>ed<br />
on a multivariate regression technique <strong>to</strong> distribute <strong>the</strong><br />
modelled annual runoff <strong>to</strong> individual months over <strong>the</strong> year.<br />
Monthly runoff (<strong>as</strong> a percentage of annual runoff) is estimated<br />
<strong>as</strong> a function of grid cell elevation, UTM northing,<br />
UTM e<strong>as</strong>ting, monthly mean temperature and monthly<br />
mean precipitation. Adjusted R2 values range from 0.50 <strong>to</strong><br />
0.76, with <strong>the</strong> lowest values for July, August and September,<br />
and <strong>the</strong> highest values for Oc<strong>to</strong>ber <strong>to</strong> June. In general,<br />
<strong>the</strong> monthly runoff modelling is quite good, with hydrograph<br />
fits that are visually accurate (Figure 2), and with re<strong>as</strong>onable<br />
statistics (median N<strong>as</strong>h-Sutcliffe efficiency = 0.94,<br />
with 65% of <strong>the</strong> calibration b<strong>as</strong>ins having N<strong>as</strong>h-Sutcliffe<br />
efficiency statistics of >0.90).<br />
Summary<br />
The hydrology modelling approach outlined in this paper is<br />
yielding consistent and reliable estimates of annual and<br />
<strong>Geoscience</strong> <strong>BC</strong> Report 2012-1 83
Table 1. Water Survey of Canada hydrometric stations used for model calibration.<br />
Watershed Name<br />
Drainage area<br />
(km 2 ) Years of record<br />
Annual mean runoff<br />
me<strong>as</strong>ured (mm)<br />
07FA001 Halfway River near Farrell Creek (lower station) 9351 23 256<br />
07FA003 Halfway River above Graham River 3764 19 298<br />
07FA005 Graham River above Colt Creek 2139 26 388<br />
07FA006 Halfway River near Farrell Creek 9296 25 253<br />
07FB001 Pine River at E<strong>as</strong>t Pine 11906 48 503<br />
07FB002 Murray River near <strong>the</strong> mouth 5558 32 474<br />
07FB003 Sukunka River near <strong>the</strong> mouth 2591 32 667<br />
07FB004 Dickebusch Creek near <strong>the</strong> mouth 85 31 220<br />
07FB005 Quality Creek near <strong>the</strong> mouth 38 24 165<br />
07FB006 Murray River above Wolverine River 2383 32 756<br />
07FB007 Sukunka River above Chamberlain Creek 928 9 818<br />
07FB008 Moberly River near Fort St. John 1522 29 239<br />
07FB009 Flatbed Creek at kilometre 110 Heritage Highway 479 27 270<br />
07FC001 Beat<strong>to</strong>n River near Fort St. John 16059 48 106<br />
07FC002 St. John Creek near Montney 212 13 87<br />
07FC003 Blueberry River below Aitken Creek 1775 45 95<br />
07FD001 Kiskatinaw River near Farming<strong>to</strong>n 3601 54 91<br />
07FD004 Alces River at 22nd B<strong>as</strong>e Line 313 25 59<br />
07FD007 Pouce Coupe River below Henderson Creek 2856 36 73<br />
07FD009 Clear River near Bear Canyon 2876 39 56<br />
07FD011 Hines Creek above Gerry Lake 373 36 42<br />
07FD013 Eureka River near Worsley 755 35 32<br />
07GC002 Pin<strong>to</strong> Creek near Grande Prairie 494 24 106<br />
07GD001 Beaverlodge River near Beaverlodge 1621 42 46<br />
07GD002 Beavertail Creek near Hy<strong>the</strong> 678 27 40<br />
07GD003 Redwillow River near Beaverlodge 1605 11 94<br />
07GD004 Redwillow River near Rio Grande 1240 17 142<br />
07JF004 Boyer River near Paddle Prairie 140 29 19<br />
07OA001 Sousa Creek near High Level 820 40 62<br />
07OB004 Steen River near Steen River 2598 36 73<br />
07OB006 Lu<strong>to</strong>se Creek near Steen River 292 33 68<br />
07OC001 Chinchaga River near High Level 10370 41 89<br />
10BE004 Toad River above Nonda Creek 2549 48 537<br />
10BE007 Trout River at kilometre 783.7 Al<strong>as</strong>ka Highway 1191 39 434<br />
10BE009 Teeter Creek near <strong>the</strong> mouth 210 30 177<br />
10BE010 Toad River near <strong>the</strong> mouth 6890 13 490<br />
10BE011 Grayling River near <strong>the</strong> mouth 1760 13 297<br />
10CA001 Font<strong>as</strong> River near <strong>the</strong> mouth 7439 17 132<br />
10CB001 Sikanni Chief River near Fort Nelson 2181 65 374<br />
10CC001 Fort Nelson River at Fort Nelson 43200 19 244<br />
10CC002 Fort Nelson River above Muskwa River 22560 27 193<br />
10CD001 Muskwa River near Fort Nelson 20250 65 332<br />
10CD003 R<strong>as</strong>pberry Creek near <strong>the</strong> mouth 275 30 135<br />
10CD004 Bougie Creek at kilometre 368 Al<strong>as</strong>ka Highway 334 28 251<br />
10CD005 Adsett Creek at kilometre 386.0 Al<strong>as</strong>ka Highway 109 26 252<br />
10CD006 Prophet River above Cheves Creek 7277 8 324<br />
10ED003 Birch River at Highway No. 7 563 36 156<br />
10ED004 Rabbit Creek below Highway No. 7 122 6 161<br />
10ED006 Rabbit Creek at Highway No. 7 110 7 162<br />
10ED007 Blacks<strong>to</strong>ne River at Highway No. 7 1381 19 243<br />
10ED009 Scotty Creek at Highway No. 7 137 15 159<br />
10FA002 Trout River at Highway No. 1 9111 41 141<br />
10FB005 Jean-Marie River at Highway No. 1 1351 38 122<br />
84 <strong>Geoscience</strong> <strong>BC</strong> Summary of Activities 2011
<strong>Geoscience</strong> <strong>BC</strong> Report 2012-1 85<br />
Figure 2. Examples of monthly hydrographs for four river b<strong>as</strong>ins in nor<strong>the</strong><strong>as</strong>tern British Columbia.
monthly runoff for rivers in nor<strong>the</strong><strong>as</strong>tern <strong>BC</strong>. At <strong>the</strong> time<br />
this paper w<strong>as</strong> prepared, <strong>the</strong> modelling w<strong>as</strong> not complete,<br />
and fur<strong>the</strong>r enhancements are being tested. It is anticipated<br />
that <strong>the</strong> modelling will be completed by <strong>the</strong> end of 2011,<br />
with <strong>the</strong> development of a decision-support <strong>to</strong>ol in early<br />
2012.<br />
Acknowledgments<br />
This project w<strong>as</strong> funded by <strong>Geoscience</strong> <strong>BC</strong>, <strong>the</strong> <strong>BC</strong> Ministry<br />
of Forests, Lands and Natural Resource Operations and<br />
<strong>the</strong> <strong>BC</strong> Oil and G<strong>as</strong> Commission. The authors offer thanks<br />
<strong>to</strong> C.D. Anglin, N. Crisp and H. Madill for <strong>the</strong>ir support.<br />
References<br />
Barr, A.G., Black, T.A., Hogg, E.G., Griffis, T.J., Morgenstern, K.,<br />
Kljun, N., Theede, A. and Nesic, Z. (2007): Climatic controls<br />
on <strong>the</strong> carbon and water balances of a boreal <strong>as</strong>pen forest,<br />
1994–2003; Global Climate Biology, v. 13, p. 561–576.<br />
Chapman, A.R. (1988): Some hydrological and hydrochemical<br />
characteristics of boreal forest watersheds in <strong>the</strong> subarctic of<br />
west-central Canada; M.Sc. <strong>the</strong>sis, Trent University, 234 p.<br />
Chapman, A. and Kerr, B. (2011): Development of a hydrology decision<br />
support <strong>to</strong>ol; Unconventional G<strong>as</strong> Technical Forum,<br />
Vic<strong>to</strong>ria, April 7, 2011, (slide presentation), URL [November 2011].<br />
Daly, C., Halbleib, M., Smith, J.I., Gibson, W.P., Doggett, M.K.,<br />
Taylor, G.H., Curtis, J. and P<strong>as</strong>teris, P.P. (2008): Physiographically<br />
sensitive mapping of clima<strong>to</strong>logical temperature<br />
and precipitation across <strong>the</strong> conterminous United<br />
States; International Journal of Clima<strong>to</strong>logy, v. 28, p. 2031–<br />
2064.<br />
Hijmans, R.J., Cameron, S.E., Parra, J.L., Jones, P.G. and Jarvis, A.<br />
(2005): Very high resolution interpolated climate surfaces<br />
for global land are<strong>as</strong>; International Journal of Clima<strong>to</strong>logy,<br />
v. 25, p. 1965–1978.<br />
Hock, R. (2003): Temperature index melt modeling in mountain<br />
are<strong>as</strong>; Journal of Hydrology, v. 182, p. 104–115.<br />
Liu, J., Chen, J.M. and Cihlar, J. (2003): Mapping evapotranspiration<br />
b<strong>as</strong>ed on remote sensing: an application <strong>to</strong> Canada’s<br />
landm<strong>as</strong>s; Water Resources Research, v. 39, p. 1189–1200.<br />
McCabe, G.J. and Markstron, S.L. (2007): A monthly water balance<br />
model driven by a graphical user interface; United<br />
States Geological Survey, Open-File Report 2007-1088, 6 p.<br />
Moore, R.D., Trubilowicz, J. and Buttle, J. (in press): Prediction of<br />
streamflow regime and annual runoff for ungauged b<strong>as</strong>ins<br />
using a distributed water balance model; Journal of <strong>the</strong><br />
American Water Resources Association.<br />
Solomon, S.I., Denouvilliez, J.P., Chart, E.J., Wooley, J.A. and<br />
Cadou, C. (1968): The use of a square grid system for computer<br />
estimation of precipitation, temperature and runoff;<br />
Water Resources Research, v. 4, p. 919–929.<br />
Spittlehouse, D.L. (1989): Estimating evapotranspiration from<br />
land surfaces in British Columbia; in Estimation of Aerial<br />
Evapotranspiration, International Association of Hydrological<br />
Sciences, Publication no. 177, p. 245–253.<br />
Trabucco, A. and Zomer, R.J. (2010): Global high-resolution soilwater<br />
balance geospatial datab<strong>as</strong>e; Consultative Group on<br />
International Agricultural Research – Consortium for Spatial<br />
Information, URL <br />
[November 2011].<br />
Wang, T., Hamann, A., Spittlehouse, D. and Murdock, T. (in<br />
press): ClimateWNA - high-resolution spatial climate data<br />
for western North America; Journal of Applied Meteorology<br />
and Clima<strong>to</strong>logy.<br />
86 <strong>Geoscience</strong> <strong>BC</strong> Summary of Activities 2011
Geological Controls on Matrix Permeability of <strong>the</strong> Doig-Montney Hybrid Shale-<br />
G<strong>as</strong>–Tight-G<strong>as</strong> Reservoir, Nor<strong>the</strong><strong>as</strong>tern British Columbia (NTS 093P)<br />
G.R.L. Chalmers, University of British Columbia, Vancouver, <strong>BC</strong>, gchalmer@eos.ubc.ca<br />
R.M. Bustin, University of British Columbia, Vancouver, <strong>BC</strong><br />
A.A.M. Bustin, University of British Columbia, Vancouver, <strong>BC</strong><br />
Chalmers, G.R.L., Bustin, R.M. and Bustin, A.A.M. (2012): Geological controls on matrix permeability of <strong>the</strong> Doig-Montney hybrid<br />
shale-g<strong>as</strong>–tight-g<strong>as</strong> reservoir, nor<strong>the</strong><strong>as</strong>tern British Columbia (NTS 093P); in <strong>Geoscience</strong> <strong>BC</strong> Summary of Activities 2011, <strong>Geoscience</strong><br />
<strong>BC</strong>, Report 2012-1, p. 87–96.<br />
Introduction<br />
Exploration and development of <strong>the</strong> hybrid shaleg<strong>as</strong>–tight-g<strong>as</strong><br />
play of <strong>the</strong> Lower Tri<strong>as</strong>sic Montney<br />
Formation in nor<strong>the</strong><strong>as</strong>tern British Columbia in recent<br />
yearsh<strong>as</strong>led<strong>to</strong>attentionbeingfocusedon<strong>the</strong>overlying<br />
Doig Formation, with <strong>the</strong> objective <strong>to</strong> coproduce<br />
<strong>the</strong> Doig and Montney plays. The Doig Formation<br />
h<strong>as</strong> proven production from <strong>the</strong> Doig sands<strong>to</strong>ne<br />
tight-g<strong>as</strong> play within <strong>the</strong> Groundbirch-field area<br />
(Walsh et al., 2006) and, currently, positive tests are<br />
reported from <strong>the</strong> Doig phosphate zone shale-g<strong>as</strong><br />
play (Proust, 2010). The majority of production is <strong>as</strong>sociated<br />
with <strong>the</strong> middle Doig Formation and, <strong>to</strong> a<br />
lesser extent, with <strong>the</strong> upper Doig Formation within<br />
<strong>the</strong> Groundbirch area (D. Ross, personal communication).<br />
As very large g<strong>as</strong>-in-place estimates are<br />
common for shale-g<strong>as</strong> plays (i.e., 250 tcf for <strong>the</strong><br />
Montney Formation; Adams, 2010), a better understanding<br />
of <strong>the</strong> geological controls on matrix permeability<br />
is needed. Fluid flow and <strong>the</strong> production rates<br />
of a shale-g<strong>as</strong> play are influenced by <strong>the</strong> matrix permeability<br />
of <strong>the</strong> reservoir and <strong>the</strong> length of <strong>the</strong> flow path,<br />
and hence, by <strong>the</strong> size of matrix blocks. Sedimen<strong>to</strong>logy h<strong>as</strong><br />
a large impact on <strong>the</strong> mineralogy, <strong>to</strong>tal organic carbon<br />
(TOC) content, fabric and texture of shale. The combination<br />
of <strong>the</strong>se characteristics governs <strong>the</strong> pore-size distribution<br />
and <strong>the</strong> matrix permeability of <strong>the</strong> reservoir, which<br />
directly affects <strong>the</strong> productivity of <strong>the</strong> shale-g<strong>as</strong> play and<br />
development strategies.<br />
As part of this study <strong>to</strong> quantify and interpret <strong>the</strong> reservoir<br />
characteristics of g<strong>as</strong>-shale units in nor<strong>the</strong><strong>as</strong>tern <strong>BC</strong>, a detailed<br />
study of <strong>the</strong> Montney–Doig interval in <strong>the</strong> productive<br />
Groundbirch area, south of Fort St. John, will be conducted.<br />
This preliminary report describes <strong>the</strong> results of<br />
Keywords: pulse-decay permeability, mineralogy, <strong>to</strong>tal organic<br />
carbon content, porosity and pore-size distribution<br />
This publication is also available, free of charge, <strong>as</strong> colour digital<br />
<strong>file</strong>s in Adobe Acrobat ® <strong>PDF</strong> format from <strong>the</strong> <strong>Geoscience</strong> <strong>BC</strong><br />
website: http://www.geosciencebc.com/s/DataRele<strong>as</strong>es.<strong>as</strong>p.<br />
Figure 1. Index map showing <strong>the</strong> location of <strong>the</strong> 11-7-78-20W6 well sampled<br />
for this project (yellow diamond) and area cities and <strong>to</strong>wns (red circles).<br />
high-resolution stratigraphic analyses of <strong>the</strong> mineralogy<br />
and pore system of strata in <strong>the</strong> 11-7-78-20W6 well (Figure<br />
1). The objectives of this study are <strong>to</strong><br />
determine <strong>the</strong> influence sedimen<strong>to</strong>logy h<strong>as</strong> on <strong>the</strong> TOCcontent<br />
distribution, <strong>the</strong> mineralogy, <strong>the</strong> porosity and<br />
<strong>the</strong> pore-size distribution;<br />
resolve <strong>the</strong> influence mineralogy h<strong>as</strong> on <strong>the</strong> porosity and<br />
<strong>the</strong> pore-size distribution; and<br />
identify <strong>the</strong> controls on matrix permeability.<br />
Geological Background<br />
The Daiber Group within <strong>the</strong> Peace River plains area of<br />
nor<strong>the</strong><strong>as</strong>tern <strong>BC</strong> consists of <strong>the</strong> Lower Tri<strong>as</strong>sic Montney<br />
and <strong>the</strong> Middle Tri<strong>as</strong>sic Doig formations (Figure 2). The<br />
Montney and Doig formations were deposited along a p<strong>as</strong>sive<br />
continental margin and consist of a westward-thickening,<br />
silicicl<strong>as</strong>tic, prograding wedge (Edwards et al., 1994;<br />
Davies, 1997; Walsh et al., 2006; Dixon, 2009a, b); <strong>the</strong>y<br />
represent <strong>the</strong> first and second of three transgressive-regres-<br />
<strong>Geoscience</strong> <strong>BC</strong> Report 2012-1 87
sive (T-R) cycles, respectively, that deposited <strong>the</strong> Tri<strong>as</strong>sic<br />
strata in nor<strong>the</strong><strong>as</strong>tern <strong>BC</strong> (Edwards et al., 1994). The<br />
depositional setting for <strong>the</strong> Montney and Doig formations<br />
is described <strong>as</strong> an open-shelf marine environment (Edwards<br />
et al., 1994). Paleogeographic reconstruction for Tri<strong>as</strong>sic<br />
sedimentation interprets a paleoshoreline that prograded<br />
during sea-level regressions <strong>to</strong> just e<strong>as</strong>t of Fort St.<br />
John and <strong>the</strong> <strong>BC</strong>-Alberta border (Kent, 1994). Throughout<br />
that period, shallow shelf mud covered <strong>the</strong> study area and<br />
deeper marine mud w<strong>as</strong> deposited <strong>to</strong> <strong>the</strong> west of <strong>the</strong> study<br />
area.<br />
In this study, <strong>the</strong> Montney and Doig formations are subdivided<br />
in<strong>to</strong> units A <strong>to</strong> D (Figure 2) <strong>to</strong> simplify descriptions<br />
and comparison. The Montney Formation consists of variable<br />
amounts of interbedded shale, silts<strong>to</strong>ne and sands<strong>to</strong>ne.<br />
Dixon (2000) subdivided <strong>the</strong> Montney Formation within<br />
<strong>BC</strong> in<strong>to</strong> <strong>the</strong> lower silts<strong>to</strong>ne-sands<strong>to</strong>ne and <strong>the</strong> upper shale<br />
members b<strong>as</strong>ed on lithostratigraphy. The two members are<br />
separated by a b<strong>as</strong>in-wide unconformity resulting from tec<strong>to</strong>nic<br />
uplift of <strong>the</strong> b<strong>as</strong>in margin (Dixon, 2009b) and are interpreted<br />
<strong>as</strong> <strong>the</strong> result of two higher-order T-R couplets<br />
(Uttings et al., 2005). The upper shale member of <strong>the</strong><br />
Montney Formation (unit A in this study) is absent within<br />
Alberta and progressively becomes thicker (up <strong>to</strong> 159 m) <strong>to</strong><br />
<strong>the</strong> west, <strong>to</strong>wards <strong>the</strong> foothills of <strong>BC</strong> (Dixon, 2000).<br />
Overlying <strong>the</strong> Montney Formation is <strong>the</strong> second T-R cycle,<br />
which deposited <strong>the</strong> Doig (units B <strong>to</strong> D of this study), Halfway<br />
(unit E) and Charlie Lake formations (Figure 2). The<br />
Doig Formation is informally subdivided by Davies (1997)<br />
in<strong>to</strong> three distinct lithological units: <strong>the</strong> lowermost phosphate<br />
zone (unit B); middle silts<strong>to</strong>ne (unit C); and <strong>the</strong> upper<br />
regressive, coarsening-upward sequence (unit D). Thickness<br />
of <strong>the</strong> Doig Formation varies from 790 m, southwest of<br />
Fort St. John, <strong>to</strong> 80 m, <strong>to</strong>ward <strong>the</strong> nor<strong>the</strong><strong>as</strong>t, at <strong>the</strong> <strong>BC</strong>-Alberta<br />
border. Unit B is a highly radioactive unit, which consists<br />
of phosphatic nodules and granules within argillaceous<br />
silts<strong>to</strong>ne, interbedded with calcareous silts<strong>to</strong>ne and<br />
dark-grey shale (Riediger et al., 1990). The Doig Formation<br />
w<strong>as</strong> deposited in a distal- <strong>to</strong> mid-shelf setting during a<br />
marine transgression. The middle Doig (unit C) is a medium<br />
<strong>to</strong> dark-grey argillaceous silts<strong>to</strong>ne and shale unit deposited<br />
in a distal-shelf setting, which locally contains a<br />
shoreface sands<strong>to</strong>ne up <strong>to</strong> 25 m thick (Evoy, 1998). This<br />
sands<strong>to</strong>ne unit, interpreted <strong>as</strong> deltaic <strong>to</strong> shoreface sands<strong>to</strong>ne,<br />
is part of <strong>the</strong> highstand-systems tract that deposited<br />
unit C (Harris and Bustin, 2000); highstand-systems tracts<br />
contain aggradational <strong>to</strong> progradational par<strong>as</strong>equence sets,<br />
which are bounded by a downlap surface and a sequence<br />
boundary. Unit D contains silts<strong>to</strong>ne and fine sands<strong>to</strong>ne, and<br />
<strong>the</strong> boundary with <strong>the</strong> overlying unit E lies between a muddier<br />
Doig sands<strong>to</strong>ne and an overlying cleaner Halfway<br />
sands<strong>to</strong>ne (Figure 2; Evoy, 1998). Unit D is interpreted <strong>as</strong><br />
having been deposited in a proximal-shelf <strong>to</strong> lowershoreface<br />
environment. The Doig Formation is overlain by<br />
<strong>the</strong> prograding beach-barrier sands<strong>to</strong>ne of unit E (Figure<br />
2).<br />
Methods<br />
To evaluate <strong>the</strong> reservoir characteristics of <strong>the</strong> Montney<br />
and Doig formations, sidewall cores and core plugs were<br />
collected from <strong>the</strong> 11-7-78-20W6 well. Samples were analyzed<br />
<strong>to</strong> determine <strong>the</strong> TOC content, T max ,organicgeochemistry,<br />
mineralogy, porosity, pore-size distribution<br />
(PSD) and permeability. The TOC content, organic geochemistry<br />
and T max values were collected using a Rock<br />
Eval II apparatus with a TOC module.<br />
A normal-focus cobalt X-ray tube w<strong>as</strong> used on a Siemens<br />
D5000 diffrac<strong>to</strong>meter generated at 40 kV and 40 mA for X-<br />
ray diffraction analysis. Crushed samples (
20–30 mesh). To me<strong>as</strong>ure <strong>the</strong> pore-size distribution, cylindrical<br />
pore geometry is <strong>as</strong>sumed and <strong>the</strong> pore radius is calculated<br />
from <strong>the</strong> applied pressure using <strong>the</strong> W<strong>as</strong>hburn<br />
equation (W<strong>as</strong>hburn, 1921). The porosimetry-derived porosity<br />
is <strong>the</strong> ratio between <strong>the</strong> <strong>to</strong>tal intrusion <strong>volume</strong> of <strong>the</strong><br />
sample and <strong>the</strong> bulk <strong>volume</strong> of <strong>the</strong> sample. As a requirement<br />
of <strong>the</strong> analytical procedure of deg<strong>as</strong>sing and evacuating<br />
samples prior <strong>to</strong> analysis, <strong>the</strong> latter were oven dried at<br />
110°C, which results in <strong>the</strong> water saturation being zero (S w<br />
= 0). The pore-size detection limit of this analysis is 3 nm<br />
(approximate boundary between mesopore and micropore<br />
1 ), with <strong>the</strong> pore size being calculated from <strong>the</strong> W<strong>as</strong>hburn<br />
equation. Therefore <strong>the</strong> porosimetry-derived porosity<br />
results do not consider water saturation or <strong>the</strong><br />
microporosity of <strong>the</strong> sample.<br />
Permeability w<strong>as</strong> determined by a pulse-decay permeameter<br />
using helium on core plugs and sidewall cores 2.5 cm in<br />
diameter and length. Permeability w<strong>as</strong> me<strong>as</strong>ured with an<br />
effective stress of 22.8 MPa (3300 psi, in situ reservoir<br />
pressure).<br />
Results<br />
Mineralogy<br />
The Doig and Montney formations are dominated by carbonate<br />
(calcite and dolomite), quartz and feldspar (albite<br />
and microcline) with minor quantities of illite, pyrite and<br />
apatite (Figure 3; Bustin et al., 2011, Figure 6), although<br />
illite content can be locally important. In <strong>the</strong> c<strong>as</strong>e of well<br />
11-7-78-20W6, <strong>the</strong> quartz content ranges between 13 and<br />
74%, with an average of 31%, and incre<strong>as</strong>es from unit B <strong>to</strong><br />
<strong>the</strong> b<strong>as</strong>e of unit E (Figure 3). Carbonate content averages<br />
23% and ranges between 2 and 51%, where<strong>as</strong> that of dolo-<br />
1 Micropores (50 nm) are defined by <strong>the</strong> physical g<strong>as</strong>-adsorption<br />
characteristics of microporous and mesoporous media.<br />
Figure 3. Mineralogical trends for <strong>the</strong> 11-7-78-20W6 well in nor<strong>the</strong><strong>as</strong>tern British Columbia. Carbonate includes calcite and ankerite, although<br />
calcite dominates (i.e., ankerite averages 1.4%, and ranges between 0 and 7.2%). GR represents <strong>the</strong> geophysical gamma-log pro<strong>file</strong><br />
me<strong>as</strong>ured in American Petroleum Institute units (GAPI). Sample locations are shown on <strong>the</strong> left side of <strong>the</strong> diagram.<br />
<strong>Geoscience</strong> <strong>BC</strong> Report 2012-1 89
mite averages 17% and varies between 4 and 34%. The<br />
feldspar content averages 15% and ranges between 0 and<br />
24%. The b<strong>as</strong>al portion of unit B is carbonate- and/or dolomite-rich,<br />
which content decre<strong>as</strong>es from <strong>the</strong> upper portion<br />
of unit C <strong>to</strong>ward unit E, mirroring <strong>the</strong> quartz trends (Figure<br />
3). The average illite content is 9% and ranges between<br />
0 and 20%; higher illite contents are found within <strong>the</strong> upper<br />
portion of unit B and <strong>the</strong> lower (finer-grained) portions of<br />
units C and D. Pyrite averages 1.8% and varies between 1<br />
and 5%. The Pearson product-moment correlation shows<br />
that <strong>the</strong> strongest relationships occur between <strong>to</strong>tal carbonate<br />
(calcite, ankerite and dolomite) and quartz (r = -0.71),<br />
illite and pyrite (r = 0.74), and between quartz+feldspar and<br />
carbonate (calcite+ankerite, r = -0.62).<br />
Porosity<br />
Porosity w<strong>as</strong> determined by helium pycnometry and mercury<br />
porosimetry, with <strong>the</strong> former me<strong>as</strong>uring pore sizes<br />
greater than <strong>the</strong> kinetic diameter of helium (0.26 nm) and<br />
<strong>the</strong> latter restricted <strong>to</strong> me<strong>as</strong>uring pore sizes greater than<br />
3 nm. Although <strong>the</strong> 3 nm boundary is derived from <strong>the</strong> W<strong>as</strong>hburn<br />
equation and <strong>the</strong> <strong>as</strong>sumption that all pores are cylindrical<br />
may not be correct, <strong>the</strong> relative difference between<br />
<strong>the</strong> two methods does indicate that pores present within<br />
some samples are undetectable using porosimetry. Therefore,<br />
any differences seen in <strong>the</strong> results obtained from <strong>the</strong>se<br />
two methods (i.e., pycnometry-derived porosity and<br />
porosimetry-derived porosity) are considered an indication<br />
that <strong>the</strong>re are pores within <strong>the</strong> size range of 0.26 <strong>to</strong> 3 nm<br />
(microporosity and fine mesoporosity). Pycnometry-derived<br />
porosity for <strong>the</strong> 11-7-78-20W6 well varies between<br />
1.6 and 6.7%, with an average of 4.2%, and porosimetryderived<br />
porosity varies between 1.9% and 6.5%, with an<br />
average of 3% (Figure 4). The two porosity pro<strong>file</strong>s show a<br />
large difference within unit B and within unit D (Figure 4),<br />
indicating an incre<strong>as</strong>e in <strong>the</strong> fine meso- and microporosity<br />
(i.e., 0.26–3 nm) within <strong>the</strong>se intervals. Above average porosity<br />
occurs within <strong>the</strong> coarser sections of <strong>the</strong> Doig Formation—at<br />
<strong>the</strong> b<strong>as</strong>e of unit B, and at <strong>the</strong> <strong>to</strong>p of units C and D.<br />
Unit E and finer-grained intervals of units B, C and D have<br />
below-average porosity (Figure 4). Positive Pearson product-moment<br />
correlation coefficients exist between porosity<br />
and quartz content (r = 0.58), <strong>as</strong> well <strong>as</strong> between porosity<br />
and quartz+feldspar content (r = 0.59). Negative correlation<br />
coefficients exist between porosity and carbonate content<br />
(r = -0.71), and between porosity and <strong>to</strong>tal carbonate<br />
content (r = -0.55).<br />
Pore-Size Distribution<br />
Pore-size distribution (PSD) is illustrated by pore <strong>volume</strong><br />
and by pore area for well 11-7-78-20W6 (Figures 5, 6).<br />
Unit B samples contain a high <strong>volume</strong> of pores within <strong>the</strong><br />
10 000–100 000 nm macropore size range and within <strong>the</strong> 3–<br />
50 nm mesopore size range. Variations in <strong>the</strong> proportion of<br />
Figure 4. Pycnometry- and porosimetry-derived porosity pro<strong>file</strong>s<br />
of <strong>the</strong> 11-7-78-20W6 well. The dotted line represents <strong>the</strong> average<br />
porosimetry-derived porosity and <strong>the</strong> d<strong>as</strong>hed line represents <strong>the</strong><br />
average pycnometry-derived porosity. Samples are oven dried <strong>to</strong><br />
compare between methods <strong>as</strong> moist samples cannot be used for<br />
porosimetry (i.e., S w = 0). GR represents <strong>the</strong> geophysical gammalog<br />
pro<strong>file</strong> me<strong>as</strong>ured in American Petroleum Institute units (GAPI).<br />
Sample locations are shown on <strong>the</strong> left side of <strong>the</strong> diagram.<br />
macro- and mesopores exist between samples; those from<br />
units C, D and E (Figure 5a, b) have smaller proportions of<br />
mesopores compared <strong>to</strong> those from unit B (Figure 5c, d).<br />
Silts<strong>to</strong>ne and very fine sands<strong>to</strong>ne samples (e.g., sample 11-<br />
7-33; Figure 5c) from unit B also contain lower proportions<br />
of mesopores compared <strong>to</strong> finer-grained samples (e.g.,<br />
sample 11-7-27; Figure 5c). Macropores, particularly in <strong>the</strong><br />
10 000–100 000 nm size fraction, do not significantly contribute<br />
<strong>to</strong> <strong>the</strong> pore area in comparison <strong>to</strong> mesopores and fine<br />
macropores (Figure 6).<br />
Organic Geochemistry<br />
The TOC content for <strong>the</strong> 11-7-78-20W6 well varies from<br />
0.5 <strong>to</strong> over 7 wt %, with an average content of 3.2% (Figure<br />
7). Samples from unit E and <strong>the</strong> <strong>to</strong>p of unit D yielded<br />
TOC values below <strong>the</strong> detection limit of <strong>the</strong> Rock Eval<br />
apparatus (
Figure 5. Pore-size distribution (PSD) for <strong>the</strong> 11-7-78-20W6 well, expressed using <strong>the</strong> incremental pore <strong>volume</strong> (mL/g). The d<strong>as</strong>hed line represents <strong>the</strong> boundary between micro-<br />
and mesopores (2 nm) and <strong>the</strong> solid line demarcates <strong>the</strong> boundary between meso- and macropores (50 nm). Helium pulse-decay permeability (in mD) is also shown for<br />
some samples. Coarser-grained samples from units C, D and E show less mesopore <strong>volume</strong>s (Figure 5a, b) compared <strong>to</strong> samples from unit B (Figure 5c, d). Samples were<br />
crushed <strong>to</strong> a sieve size of 20–30 mesh. Sample locations can be found on Figure 4.<br />
<strong>Geoscience</strong> <strong>BC</strong> Report 2012-1 91
Figure 6. Pore-size distribution (PSD) for <strong>the</strong> 11-7-78-20W6 well, expressed using <strong>the</strong> incremental pore area (m 2 /g). The d<strong>as</strong>hed line represents <strong>the</strong> boundary between microand<br />
mesopores (2 nm) and <strong>the</strong> solid line represents <strong>the</strong> boundary between meso- and macropores (50 nm). Helium pulse-decay permeability (in mD) is also shown for some<br />
samples. Greater pore area is found in <strong>the</strong> finer-grained unit B samples (Figure 6c, d) compared <strong>to</strong> <strong>the</strong> coarser-grained units C <strong>to</strong> E samples (Figure 6a, b). Samples were<br />
crushed <strong>to</strong> a sieve size of 20–30 mesh. Sample locations can be found on Figure 4.<br />
92 <strong>Geoscience</strong> <strong>BC</strong> Summary of Activities 2011
Figure 7. Total organic content (TOC) pro<strong>file</strong> for <strong>the</strong> 11-7-78-20W well.<br />
TOC-content values were below <strong>the</strong> detection limit of <strong>the</strong> Rock Eval apparatus<br />
for samples collected within <strong>the</strong> Halfway Formation (unit E) and lower<br />
Doig member (unit D) and are <strong>the</strong>refore not included. The d<strong>as</strong>hed line represents<br />
<strong>the</strong> average TOC content of 3.2 wt %. GR represents <strong>the</strong> geophysical<br />
gamma-log pro<strong>file</strong> me<strong>as</strong>ured in American Petroleum Institute units<br />
(GAPI). Sample locations are shown on <strong>the</strong> left side of <strong>the</strong> diagram.<br />
Figure 8. Downhole permeability trend for <strong>the</strong> 11-7-78-20W6 well, including <strong>the</strong> matrix<br />
permeability (solid line) and fracture permeabilities (d<strong>as</strong>hed lines). The low frequency alternation<br />
within units C and D compared <strong>to</strong> unit B may be an artefact of <strong>the</strong>ir lower sampling<br />
resolution. GR represents <strong>the</strong> geophysical gamma-log pro<strong>file</strong> me<strong>as</strong>ured in American<br />
Petroleum Institute units (GAPI). Sample locations are shown on <strong>the</strong> left side of <strong>the</strong><br />
diagram.<br />
<strong>Geoscience</strong> <strong>BC</strong> Report 2012-1 93
lation exists between TOC and pyrite (r = 0.68) where<strong>as</strong> a<br />
negative trend exists between quartz and TOC content (r = -<br />
0.56).<br />
The hydrogen index (HI) for <strong>the</strong> 11-7-78-20W6 well averages<br />
20 mg HC/g TOC, and ranges between 1 and 76 mg<br />
HC/g TOC. The oxygen index (OI) averages 34 mg CO 2 /g<br />
TOC, and ranges between 5 and 172 mg CO 2 /g TOC. The<br />
average T max value is 457°C, and ranges between 443 and<br />
478°C, placing <strong>the</strong> reservoirs within <strong>the</strong> g<strong>as</strong> window.<br />
Pulse-Decay Permeability<br />
The matrix permeability ranges between 10 -4 and 10 -7 mD<br />
(Figure 8); it also varies by two orders of magnitude between<br />
samples 11-7-16 and 11-7-19 (Figure 8), in part due<br />
<strong>to</strong> <strong>the</strong> difference in <strong>the</strong>ir PSD (see discussion for details).<br />
The higher matrix permeabilities in <strong>the</strong> 11-7-78-20W6 well<br />
are located in <strong>the</strong> <strong>to</strong>p of unit C and scattered throughout unit<br />
B (solid line, Figure 8). The high alternation of permeability<br />
values within unit B may be due <strong>to</strong> <strong>the</strong> lithological<br />
and/or mineralogical changes and <strong>the</strong> lack of similar trends<br />
within units C, D and E could be an artefact of <strong>the</strong>ir lower<br />
sampling resolution compared <strong>to</strong> unit B. Samples that contain<br />
fractures (d<strong>as</strong>hed lines, Figure 8) exhibit<br />
permeabilities that are four <strong>to</strong> five orders of magnitude<br />
greater than <strong>the</strong> lower permeabilities.<br />
Discussion<br />
Controls on Mineralogy<br />
Unit B is carbonate and/or clay-rich and quartz-poor with<br />
units C and D being quartz-rich and carbonate and/or claypoor<br />
(well 11-7-78-20W6; Figure 3). The Montney Formation<br />
(unit A) is carbonate-poor and quartz-rich compared <strong>to</strong><br />
<strong>the</strong> Doig phosphate zone (unit B). The contr<strong>as</strong>ting mineralogical<br />
character of <strong>the</strong> quartz-rich units C and D and carbonate-rich<br />
unit B in well 11-7-78-20W6 indicates a<br />
change in <strong>the</strong> sedimentary environment, accommodation<br />
space and/or tec<strong>to</strong>nic activity within <strong>the</strong> study area <strong>as</strong> <strong>the</strong><br />
depositional conditions shifted from carbonate deposition<br />
<strong>to</strong> cl<strong>as</strong>tic deposition. A greater influx of cl<strong>as</strong>tic rocks in <strong>the</strong><br />
upper Doig Formation is ei<strong>the</strong>r due <strong>to</strong> incre<strong>as</strong>ing tec<strong>to</strong>nic<br />
activity or <strong>to</strong> a reduction in accommodation space (shoreline<br />
progradation) <strong>as</strong> a sea-level regression progressed.<br />
Clay deposition occurred when quartz and feldspar influx<br />
w<strong>as</strong> low and pyrite deposition, high. The higher pyrite content<br />
(i.e., greater than 4%) indicates that <strong>the</strong> depositional<br />
conditions were dysoxic 2 <strong>to</strong> anoxic during periods of clay<br />
deposition. A negative relationship between quartz+feldspar<br />
and <strong>to</strong>tal carbonate contents indicates that during periods<br />
of quartz- and feldspar-rich detritus influx, carbonate<br />
2 having a very low oxygen content (i.e., between anoxic and<br />
hypoxic)<br />
and dolomite deposition w<strong>as</strong> low, where<strong>as</strong> when influx of<br />
quartz and feldspar diminished, carbonate production relatively<br />
incre<strong>as</strong>ed. Carbonate and clay sedimentation does<br />
not occur simultaneously (i.e., during low influx of quartz<br />
and feldspar), <strong>as</strong> indicated by <strong>the</strong> strong negative correlation<br />
between illite and carbonate. The deposition of <strong>the</strong><br />
quartz, feldspar and clay minerals may be a result of<br />
turbiditic events, with fining-upward sequences ending in<br />
clay deposition; it <strong>the</strong>refore appears that carbonate deposition<br />
w<strong>as</strong> restricted <strong>to</strong> <strong>the</strong> quiescent, non-turbiditic periods.<br />
Controls on Porosity and Pore-Size<br />
Distribution<br />
An incre<strong>as</strong>e in <strong>the</strong> difference between <strong>the</strong> pycnometry- and<br />
porosimetry-derived porosity occurs within unit B, indicating<br />
an incre<strong>as</strong>e in <strong>the</strong> fine meso- and microporosity (
euxinic during <strong>the</strong> deposition of unit B. A large variation in<br />
<strong>the</strong> TOC content can occur between closely-spaced samples<br />
(i.e., 20 cm for samples 11-7-31 <strong>to</strong> -35), which may be<br />
an indication that changes were occurring in <strong>the</strong> depositional<br />
environment or that turbiditic or s<strong>to</strong>rm events affected<br />
<strong>the</strong> preservation and accumulation of <strong>the</strong> organic matter.<br />
Low HI and OI values indicate that ei<strong>the</strong>r <strong>the</strong> kerogen h<strong>as</strong><br />
experienced a high degree of hydrocarbon generation or<br />
that it originally came from oxidized plant material. The<br />
Montney and Doig formations are <strong>the</strong>rmally mature <strong>to</strong><br />
overmature (Riediger et al., 1990).<br />
Controls on Matrix Permeability<br />
The PSD, which controls <strong>the</strong> matrix permeability of <strong>the</strong><br />
Doig and Montney reservoirs, w<strong>as</strong> compared between samples<br />
that differed in matrix permeability by two orders of<br />
magnitude (Figure 5d, samples 11-7-16 and 11-7-19). Sample<br />
11-7-16, which is characterized by a higher permeability,<br />
h<strong>as</strong> a greater proportion of pores at <strong>the</strong> mesopore–<br />
macropore boundary compared with sample 11-7-19,<br />
which contains a greater <strong>volume</strong> of pores at <strong>the</strong> micropore–<br />
mesopore boundary. Both high- and low-permeability samples<br />
have bimodal pore-size distribution. The degree of<br />
separation between <strong>the</strong> two populations of pore sizes of <strong>the</strong><br />
low-permeability samples (e.g., sample 11-7-19) is four orders<br />
of magnitude greater than that of <strong>the</strong> higher permeability<br />
samples (e.g., sample 11-7-16), whose degree of separation<br />
of only three orders of magnitude suggests a greater<br />
degree of communication within <strong>the</strong> matrix. The contr<strong>as</strong>ting<br />
PSD are due <strong>to</strong> <strong>the</strong> differences between <strong>the</strong> mineralogy<br />
and TOC contents. The difference between <strong>the</strong> high (10 -4<br />
mD) and low (
Future Work<br />
Data is currently being collected and interpreted from three<br />
more wells within <strong>the</strong> Groundbirch area. Inorganic petrology<br />
is <strong>to</strong> be conducted <strong>to</strong> examine <strong>the</strong> relationships between<br />
fabric, mineralogy, porosity and permeability. Organic petrology<br />
will also be performed <strong>to</strong> gain an understanding of<br />
<strong>the</strong> controls on organic sedimentation (i.e., terrestrial- versus<br />
marine-sourced organic materials).<br />
Acknowledgments<br />
The authors would like <strong>to</strong> thank <strong>Geoscience</strong> <strong>BC</strong> for its financial<br />
support of this ongoing research. They would also<br />
like <strong>to</strong> thank D. Ross who reviewed an earlier version of<br />
this manuscript.<br />
References<br />
Adams, C. (2010): Shale g<strong>as</strong> activity in British Columbia: Exploration<br />
and Development of <strong>BC</strong>’s shale g<strong>as</strong> are<strong>as</strong> (abstract);<br />
<strong>BC</strong> Ministry of Energy and Mines, 4 th Annual Unconventional<br />
G<strong>as</strong> Technical Forum, April 8–9, 2010, Vic<strong>to</strong>ria, <strong>BC</strong>,<br />
URL [Oc<strong>to</strong>ber, 2011].<br />
Bustin, R.M., Chalmers, G., Bustin, A.A.M. (2011): Quantification<br />
of <strong>the</strong> g<strong>as</strong>-in-place and flow characteristics of tight g<strong>as</strong>charged<br />
rocks and g<strong>as</strong>-shale potential in British Columbia;<br />
in <strong>Geoscience</strong> <strong>BC</strong> Summary of Activities 2010, <strong>Geoscience</strong><br />
<strong>BC</strong>, Report 2011-1, p. 201–208, URL [Oc<strong>to</strong>ber, 2011].<br />
Chalmers, G.R.L. and Bustin, R.M. (2008): Lower Cretaceous g<strong>as</strong><br />
shales in nor<strong>the</strong><strong>as</strong>tern British Columbia, Part I: geological<br />
controls on methane sorption capacity; Bulletin of Canadian<br />
Petroleum Geology, v. 56, p. 1–21.<br />
Davies, G.R. (1997): The Tri<strong>as</strong>sic of <strong>the</strong> western Canadian sedimentary<br />
b<strong>as</strong>in: Tec<strong>to</strong>nic and stratigraphic framework, palaeography,<br />
palaeoclimate and biota; Bulletin of Canadian Petroleum<br />
Geology, v. 45, p. 434–460.<br />
Dixon, J. (2000): Regional lithostratigraphic units in <strong>the</strong> Tri<strong>as</strong>sic<br />
Montney Formation of western Canada; Bulletin of Canadian<br />
Petroleum Geology, v. 48, p. 80–83.<br />
Dixon, J. (2009a): The Lower Tri<strong>as</strong>sic Shale member of <strong>the</strong><br />
Montney Formation in <strong>the</strong> subsurface of nor<strong>the</strong><strong>as</strong>t British<br />
Columbia; Geological Survey of Canada, Open File 6274,<br />
9p.<br />
Dixon, J. (2009b): Tri<strong>as</strong>sic stratigraphy in <strong>the</strong> subsurface of <strong>the</strong><br />
plains area of Dawson Creek (93P) and Charlie Lake map are<strong>as</strong><br />
(94A), nor<strong>the</strong><strong>as</strong>t British Columbia; Geological Survey<br />
of Canada, Bulletin 595, 78 p.<br />
Edwards, D.E., Barclay, J.E., Gibson, D.W., Kvill, G.E. and Hal<strong>to</strong>n,<br />
E. (1994): Tri<strong>as</strong>sic Strata of <strong>the</strong> Western Canada Sedimentary<br />
B<strong>as</strong>in; in Geological Atl<strong>as</strong> of <strong>the</strong> Western Canada<br />
Sedimentary B<strong>as</strong>in, G.D. Mossop and I. Shetsen (comp.),<br />
Canadian Society of Petroleum Geologists and Alberta Research<br />
Council, Special Report 4, URL <br />
[August, 2011].<br />
Evoy, R.W. (1998): Reservoir sedimen<strong>to</strong>logy of <strong>the</strong> Doig Formation,<br />
Buick Creek Field, Nor<strong>the</strong><strong>as</strong>tern British Columbia; in<br />
Oil and G<strong>as</strong> Pools of <strong>the</strong> Western Canada Sedimentary B<strong>as</strong>in,<br />
J.R. Hogg (ed.), Canadian Society of Petroleum Geologists,<br />
Canada, Special Publication S-51, p. 127–135.<br />
Harris, R.G. and Bustin, R.M. (2000): Diagenesis, reservoir quality<br />
and production trends of Doig Formation sand bodies in<br />
<strong>the</strong> Peace River of western Canada; Bulletin of Canadian Petroleum<br />
Geology, v. 48, no. 4, p. 339–359.<br />
International Union of Pure and Applied Chemistry, (1997): Compendium<br />
of Chemical Terminology (2 nd edition); A.D.<br />
McNaugh<strong>to</strong>n and A. Wilkinson (comp.), Blackwell Scientific<br />
Publications, Oxford, doi: 10.1351/goldbook.M03906,<br />
URL [November<br />
2011].<br />
Kent, D.M. (1994): Paleogeographic evolution of <strong>the</strong> cra<strong>to</strong>nic<br />
platform – Cambrian <strong>to</strong> Tri<strong>as</strong>sic; in Geological Atl<strong>as</strong> of <strong>the</strong><br />
Western Canada Sedimentary B<strong>as</strong>in, G.D. Mossop and I.<br />
Shetsen (comp.), Canadian Society of Petroleum Geologists<br />
and Alberta Research Council, Special Report 4, URL<br />
[August 4, 2010].<br />
Proust, J. (2010): Canada Energy Partners announces successful<br />
horizontal Montney test; Canada Energy Partners, press rele<strong>as</strong>e,<br />
July 6, 2010, URL <br />
[Oc<strong>to</strong>ber 2011].<br />
Riediger, C.L., Brooks, P.W., Fowler, M.G. and Snowdon, L.R.<br />
(1990): Lower and Middle Tri<strong>as</strong>sic source rocks, <strong>the</strong>rmal<br />
maturation, and oil-source rock correlations in <strong>the</strong> Peace<br />
River embayment area, Alberta and British Columbia; Bulletin<br />
of Canadian Petroleum Geology, v. 38A, p. 218–235.<br />
Utting, J., MacNaugh<strong>to</strong>n, R.B., Zonneveld, J.P. and Fall<strong>as</strong>, K.M.<br />
(2005): Palynostratigraphy, lithostratigraphy and <strong>the</strong>rmal<br />
maturity of <strong>the</strong> Lower Tri<strong>as</strong>sic Toad and Grayling, and<br />
Montney formations of western Canada, and comparisons<br />
with coeval rocks of <strong>the</strong> Sverdrup b<strong>as</strong>in, Nunavut; Bulletin<br />
of Canadian Petroleum Geology, v. 53, p. 5–24.<br />
Walsh, W., Adams, C., Kerr, B. and Korol, J. (2006): Regional<br />
“shale g<strong>as</strong>” potential of <strong>the</strong> Tri<strong>as</strong>sic Doig and Montney formations,<br />
nor<strong>the</strong><strong>as</strong>tern British Columbia; <strong>BC</strong> Ministry of Energy<br />
and Mines, Petroleum Geology Open File 2006-2.<br />
W<strong>as</strong>hburn, E.W. (1921): Note on a method of determining <strong>the</strong> distribution<br />
of pore sizes in a porous material; Proceeding of<br />
<strong>the</strong> National Academy of Sciences of <strong>the</strong> United States of<br />
America, v. 7, p. 115–116.<br />
96 <strong>Geoscience</strong> <strong>BC</strong> Summary of Activities 2011
Biostratigraphy and Sedimentary Provenance of Lower and Middle Tri<strong>as</strong>sic<br />
Natural G<strong>as</strong>–Bearing Rocks in Nor<strong>the</strong><strong>as</strong>tern British Columbia<br />
(parts of NTS 093P, 094A, B, K): Progress Report<br />
M.L. Golding, University of British Columbia, Vancouver, <strong>BC</strong>, mgolding@eos.ubc.ca<br />
J.K. Mortensen, University of British Columbia, Vancouver, <strong>BC</strong><br />
J-P. Zonneveld, University of Alberta, Edmon<strong>to</strong>n, AB<br />
M.J. Orchard, Geological Survey of Canada Pacific, Natural Resources Canada, Vancouver, <strong>BC</strong><br />
Golding, M.L., Mortensen, J.K., Zonneveld, J-P. and Orchard, M.J. (2012): Biostratigraphy and sedimentary provenance of Lower and<br />
Middle Tri<strong>as</strong>sic natural g<strong>as</strong>–bearing rocks in nor<strong>the</strong><strong>as</strong>tern British Columbia (parts of NTS 093P, 094A, B, K): progress report; in<br />
<strong>Geoscience</strong> <strong>BC</strong> Summary of Activities 2011, <strong>Geoscience</strong> <strong>BC</strong>, Report 2012-1, p. 97–114.<br />
Introduction<br />
The Tri<strong>as</strong>sic natural g<strong>as</strong>–bearing rocks of <strong>the</strong> Western Canada<br />
Sedimentary B<strong>as</strong>in (WCSB) in British Columbia have<br />
been <strong>the</strong> subject of a multiyear interdisciplinary study designed<br />
<strong>to</strong> improve <strong>the</strong> biostratigraphic correlation of <strong>the</strong><br />
g<strong>as</strong>-producing formations and <strong>to</strong> <strong>as</strong>sess changes in sediment<br />
distribution patterns within this biostratigraphic<br />
framework. Initially, <strong>the</strong> focus of <strong>the</strong> work w<strong>as</strong> on surface<br />
outcrop equivalents <strong>to</strong> <strong>the</strong> subsurface g<strong>as</strong>-producing formations,<br />
but it h<strong>as</strong> since extended <strong>to</strong> encomp<strong>as</strong>s subsurface<br />
sections <strong>as</strong> well. Biostratigraphic correlation h<strong>as</strong> been conducted<br />
through <strong>the</strong> identification of conodonts, and <strong>to</strong> a<br />
lesser extent, ammonoids and bivalves. Changes in sediment<br />
transport, including <strong>the</strong> sediment source and direction<br />
of input, have been formulated by <strong>the</strong> dating of detrital zircons,<br />
which gives an age for <strong>the</strong> pro<strong>to</strong>liths from which <strong>the</strong><br />
sediment w<strong>as</strong> derived. Although <strong>the</strong> majority of sediment<br />
entering <strong>the</strong> WCSB during <strong>the</strong> Tri<strong>as</strong>sic came from <strong>the</strong><br />
North American cra<strong>to</strong>n <strong>to</strong> <strong>the</strong> e<strong>as</strong>t, it is becoming more apparent<br />
that at le<strong>as</strong>t some of <strong>the</strong> sediment w<strong>as</strong> derived from<br />
rocks <strong>to</strong> <strong>the</strong> north and west, and that this began <strong>to</strong> occur during<br />
<strong>the</strong> Tri<strong>as</strong>sic. This h<strong>as</strong> implications not only for <strong>the</strong><br />
source of sediment and <strong>the</strong>refore for <strong>the</strong> transport pathways<br />
of that sediment in<strong>to</strong> <strong>the</strong> b<strong>as</strong>in, but also for <strong>the</strong> timing of terrane<br />
accretion along <strong>the</strong> western margin of ancestral North<br />
America. Evidence from detrital zircon analyses in <strong>the</strong> Yukon<br />
(Beranek, 2009) and in this study points <strong>to</strong>wards Permo-<br />
Tri<strong>as</strong>sic accretion of <strong>the</strong> Yukon-Tanana terrane, <strong>as</strong> first suggested<br />
by Nelson et al. (2006). This is much earlier than <strong>the</strong><br />
Jur<strong>as</strong>sic age that h<strong>as</strong> previously been accepted for this event<br />
(e.g., Monger and Price, 2002).<br />
Keywords: Tri<strong>as</strong>sic, Western Canada Sedimentary B<strong>as</strong>in, correlation,<br />
conodont, detrital zircon, sedimentary provenance, Doig<br />
phosphate zone, Willis<strong>to</strong>n Lake, Al<strong>as</strong>ka Highway<br />
This publication is also available, free of charge, <strong>as</strong> colour digital<br />
<strong>file</strong>s in Adobe Acrobat ® <strong>PDF</strong> format from <strong>the</strong> <strong>Geoscience</strong> <strong>BC</strong><br />
website: http://www.geosciencebc.com/s/DataRele<strong>as</strong>es.<strong>as</strong>p.<br />
Previous progress reports on this study have described <strong>the</strong><br />
sampling and analysis of samples from surface localities at<br />
South Halfway and Willis<strong>to</strong>n Lake (both in <strong>the</strong> Halfway<br />
River map area, NTS 094B), and subsurface samples from<br />
an oil well in <strong>the</strong> Dawson Creek map area (NTS 093P; Figure<br />
1; Golding et al., 2010, 2011). These sections encomp<strong>as</strong>s<br />
an age range from <strong>the</strong> Smithian up <strong>to</strong> <strong>the</strong> Rhaetian.<br />
This report presents <strong>the</strong> results from those analyses, and describes<br />
a new round of fieldwork that w<strong>as</strong> designed <strong>to</strong> build<br />
upon <strong>the</strong> results from previous field se<strong>as</strong>ons. As such, outcrop<br />
w<strong>as</strong> examined on <strong>the</strong> Al<strong>as</strong>ka Highway in <strong>the</strong> summer<br />
of 2011, and six new subsurface cores were examined (Figure<br />
1). The sections on <strong>the</strong> Al<strong>as</strong>ka Highway cover an interval<br />
from <strong>the</strong> Anisian <strong>to</strong> Ladinian, which h<strong>as</strong> previously<br />
been poorly covered by <strong>the</strong> sampling of this study. This<br />
time period w<strong>as</strong> one of anomalous sediment thickness in<br />
<strong>the</strong> WCSB (Gibson, 1975) and also includes an unusual,<br />
highly phosphatic interval that is equivalent <strong>to</strong> <strong>the</strong> Doig<br />
phosphate zone in <strong>the</strong> subsurface. Additionally, <strong>the</strong>se sections<br />
extend <strong>the</strong> area of study <strong>to</strong> <strong>the</strong> north. The extra<br />
subsurface sections cover an interval from <strong>the</strong> Spathian <strong>to</strong><br />
<strong>the</strong> Anisian, and are <strong>the</strong>refore of a similar age <strong>to</strong> that from<br />
<strong>the</strong> previously studied borehole. They contain rocks belonging<br />
<strong>to</strong> <strong>the</strong> Doig phosphate zone, part of <strong>the</strong> Doig Formation<br />
that shows promise for producing natural g<strong>as</strong><br />
(Walsh et al., 2006). Study of <strong>the</strong>se cores will allow concepts<br />
derived from surface outcrop studies <strong>to</strong> be tested in<br />
<strong>the</strong> subsurface.<br />
This interdisciplinary study h<strong>as</strong> involved collaboration between<br />
<strong>the</strong> University of British Columbia, <strong>the</strong> University of<br />
Alberta, <strong>the</strong> Geological Survey of Canada, <strong>the</strong> <strong>BC</strong> Ministry<br />
of Energy and Mines, <strong>Geoscience</strong> <strong>BC</strong> and <strong>the</strong> petroleum<br />
industry.<br />
Geological Setting<br />
Tri<strong>as</strong>sic rocks of nor<strong>the</strong><strong>as</strong>tern <strong>BC</strong> were deposited in <strong>the</strong><br />
WCSB, along <strong>the</strong> western margin of <strong>the</strong> North American<br />
<strong>Geoscience</strong> <strong>BC</strong> Report 2012-1 97
Figure 1. Location of map are<strong>as</strong> (NTS 093P, 094A, B, K), <strong>as</strong> well <strong>as</strong> <strong>the</strong> sampling localities: 1, Al<strong>as</strong>ka Highway; 2, South Halfway;<br />
3, Willis<strong>to</strong>n Lake; 4, Petro-Canada Kobes d-048-A/094-B-09; 5, Talisman Altares c-085-I/094-B-01; 6, Talisman Altares<br />
16-17-083-25W6; 7, Rocor Moni<strong>as</strong> 08-22-82-20W6; 8, Arc Dawson 07-13-79-15W6; and 9, Murphy Swan d-54-B/93-P-9. Red<br />
stars indicate outcrop localities, blue stars indicate subsurface wells.<br />
continent. The WCSB at this time w<strong>as</strong> at a latitude of<br />
around 30°N and <strong>the</strong> environment w<strong>as</strong> arid (Davies, 1997).<br />
Sediment w<strong>as</strong> deposited on <strong>the</strong> continental shelf, and consists<br />
primarily of a mixture of cl<strong>as</strong>tic and carbonate sediments.<br />
Windblown sediments are thought <strong>to</strong> have been a<br />
major constituent of <strong>the</strong> sediment deposited at this time<br />
(Davies, 1997), and s<strong>to</strong>rm reworking h<strong>as</strong> been shown <strong>to</strong><br />
have an important role in <strong>the</strong> distribution of sediment<br />
(Zonneveld et al., 1997). Although sediments were mainly<br />
deposited below normal wave b<strong>as</strong>e, some of <strong>the</strong> rocks show<br />
evidence of subaerial deposition (Zonneveld, 2010). Paleocurrent<br />
data is sparse for this time period, but that which is<br />
available indicates transport from <strong>the</strong> e<strong>as</strong>t, nor<strong>the</strong><strong>as</strong>t and<br />
north (Pelletier, 1965).<br />
Lithology varies from e<strong>as</strong>t <strong>to</strong> west, and from north <strong>to</strong> south<br />
along <strong>the</strong> belt of preserved Tri<strong>as</strong>sic rocks, <strong>as</strong> shown in Figure<br />
2. In this study, rocks from <strong>the</strong> Toad, Liard, Baldonnel,<br />
Pardonet, Montney and Doig formations have been observed<br />
and sampled.<br />
The oldest observed unit in <strong>the</strong> study area is <strong>the</strong> Toad Formation.<br />
This is exposed in surface outcrop, and consists of<br />
argillaceous <strong>to</strong> calcareous silts<strong>to</strong>ne, silty shale, silty limes<strong>to</strong>ne<br />
and dolos<strong>to</strong>ne, <strong>as</strong> well <strong>as</strong> very fine grained sands<strong>to</strong>ne<br />
(Thompson, 1989). It spans <strong>the</strong> Smithian <strong>to</strong> <strong>the</strong> Ladinian,<br />
and it is equivalent <strong>to</strong> <strong>the</strong> Montney and lower Doig formations<br />
in <strong>the</strong> subsurface (Zonneveld, 2010). Above <strong>the</strong> Toad<br />
Formation lies <strong>the</strong> Liard Formation, which consists of fine<br />
<strong>to</strong> coarse sands<strong>to</strong>ne, calcareous and dolomitic silts<strong>to</strong>ne and<br />
sandy <strong>to</strong> silty dolos<strong>to</strong>ne and limes<strong>to</strong>ne (Thompson, 1989).<br />
It ranges in age from <strong>the</strong> Ladinian <strong>to</strong> <strong>the</strong> Carnian, and is <strong>the</strong><br />
surface equivalent of <strong>the</strong> upper Doig and Halfway formations<br />
(Zonneveld, 2010).<br />
98 <strong>Geoscience</strong> <strong>BC</strong> Summary of Activities 2011
Figure 2. Tri<strong>as</strong>sic formations in British Columbia and <strong>the</strong>ir correlations with those in <strong>the</strong> subsurface and<br />
in sou<strong>the</strong>rn Alberta. Modified from Ferri (2009). Abbreviations: Fm, Formation; Gp, Group; Mbr, Member;<br />
Mtn, Mountain.<br />
The Baldonnel Formation, overlying <strong>the</strong> Liard Formation,<br />
is characterized by a sequence of limes<strong>to</strong>ne, dolos<strong>to</strong>ne and<br />
silts<strong>to</strong>ne (Zonneveld, 2010). This unit is named after its<br />
subsurface equivalent. The age of this formation is<br />
diachronous and ranges from upper Carnian <strong>to</strong> lower<br />
Norian in <strong>the</strong> e<strong>as</strong>t, and from lower Carnian <strong>to</strong> upper Carnian<br />
in <strong>the</strong> west (Zonneveld, 2010). The Baldonnel Formation is<br />
typically succeeded by <strong>the</strong> Pardonet Formation, which consists<br />
of limes<strong>to</strong>ne, dolos<strong>to</strong>ne, calcareous silt and shale<br />
(Zonneveld, 2010). This unit can be traced in<strong>to</strong> <strong>the</strong><br />
subsurface, and it is Norian <strong>to</strong> Rhaetian in age (Zonneveld,<br />
2010).<br />
In <strong>the</strong> subsurface, shale and silts<strong>to</strong>ne of <strong>the</strong> Montney Formation<br />
is overlain by <strong>the</strong> Doig Formation, with <strong>the</strong> boundary<br />
marked by a distinctive Glossifungites surface (indicative<br />
of a firmground surface). The b<strong>as</strong>al part of <strong>the</strong> formation<br />
consists of a phosphatic pebble lag, which gives way <strong>to</strong><br />
shale, silts<strong>to</strong>ne, sands<strong>to</strong>ne and occ<strong>as</strong>ional carbonate<br />
(Zonneveld, 2010). Deposition of this formation may extend<br />
<strong>as</strong> far back <strong>as</strong> <strong>the</strong> Spathian in age (Zonneveld, 2010)<br />
with its upper boundary in <strong>the</strong> Ladinian (Hunt and<br />
Ratcliffe, 1959). This makes it <strong>the</strong> subsurface equivalent of<br />
<strong>the</strong> upper part of <strong>the</strong> Toad Formation and <strong>the</strong> lower part of<br />
<strong>the</strong> Liard Formation.<br />
Willis<strong>to</strong>n Lake Study Area (NTS 094B)<br />
Willis<strong>to</strong>n Lake is located in <strong>the</strong> Halfway River map area<br />
(NTS 094B; Figure 1). In 2010, six sections were examined<br />
and sampled for conodont and detrital zircon geochronology<br />
(Golding et al., 2011; Tables 1, 2). From west <strong>to</strong> e<strong>as</strong>t,<br />
<strong>the</strong> sections are: Ursula Creek; Ne-parle-p<strong>as</strong> Point; Black<br />
Bear Ridge; Glacier Spur; E<strong>as</strong>t Carbon Creek and Beattie<br />
Ledge (Figure 3). These sections have been described and<br />
illustrated by Zonneveld (2010), and <strong>the</strong>y range in age from<br />
Smithian <strong>to</strong> Rhaetian.<br />
Results To Date<br />
Ursula Creek<br />
The Ursula Creek section contains shale and silts<strong>to</strong>ne belonging<br />
<strong>to</strong> <strong>the</strong> Toad Formation. The sampled interval is<br />
Smithian <strong>to</strong> Ladinian. Four samples were collected for detrital<br />
zircon analysis, however, all were barren.<br />
Ne-parle-p<strong>as</strong> Point<br />
The Ne-parle-p<strong>as</strong> Point section contains shale, silts<strong>to</strong>ne and<br />
sands<strong>to</strong>ne of <strong>the</strong> Pardonet Formation. The sampled interval<br />
is Rhaetian. Three samples were collected for detrital zircon<br />
analysis, however, all were barren.<br />
Black Bear Ridge<br />
The Black Bear Ridge section contains silts<strong>to</strong>ne and sands<strong>to</strong>ne<br />
belonging <strong>to</strong> <strong>the</strong> Pardonet Formation. The sampled<br />
<strong>Geoscience</strong> <strong>BC</strong> Report 2012-1 99
Table 1. Detrital zircon samples collected from outcrop sites in <strong>the</strong> study area, nor<strong>the</strong><strong>as</strong>tern British Columbia,<br />
in 2010 and 2011.<br />
Outcrop sample<br />
Locality Distance from b<strong>as</strong>e Formation Analysis<br />
number<br />
of section (m)<br />
MG-10-UC01 Ursula Creek 78.9 Toad complete<br />
MG-10-UC02 Ursula Creek 85.2 Toad complete<br />
MG-10-UC03 Ursula Creek 124.9 Toad complete<br />
MG-10-UC04 Ursula Creek 129.55 Toad complete<br />
MG-10-NPP01 Ne-parle-p<strong>as</strong> Point 41.2 Pardonet complete<br />
MG-10-NPP02 Ne-parle-p<strong>as</strong> Point 41.5 Pardonet complete<br />
MG-10-NPP03 Ne-parle-p<strong>as</strong> Point 51 Pardonet complete<br />
MG-10-BBR01 Black Bear Ridge 242 Pardonet in progress<br />
MG-10-GS01 Glacier Spur 122.6 Liard complete<br />
MG-10-GS02 Glacier Spur 149 Liard complete<br />
MG-10-GS03 Glacier Spur 255 Liard complete<br />
MG-10-GS04 Glacier Spur 293.8 Liard complete<br />
MG-10-GS05 Glacier Spur 304 Liard complete<br />
MG-10-ECC01 E<strong>as</strong>t Carbon Creek 76 Baldonnel complete<br />
MG-11-MP386-Z1 Mile Post 386 10.25 Toad in progress<br />
MG-11-MP386-Z2 Mile Post 386 17.5 Toad in progress<br />
MG-11-NTP-Z1 North Tetsa Phosphate 2.6 Toad in progress<br />
MG-11-NTP-Z2 North Tetsa Phosphate 2.7 Toad in progress<br />
MG-11-NTP-Z3 North Tetsa Phosphate 2.8 Toad in progress<br />
MG-11-NTP-Z4 North Tetsa Phosphate 10.6 Toad in progress<br />
MG-11-NTP-Z5 North Tetsa Phosphate 11.85 Toad in progress<br />
MG-11-OS-Z1a Oyster Springs 3.3 Liard in progress<br />
MG-11-YB-Z1 Yellow Bluffs 1.7 Toad/Liard in progress<br />
MG-11-YB-Z2 Yellow Bluffs 3 Toad/Liard in progress<br />
MG-11-YB-Z3 Yellow Bluffs 3.75 Toad/Liard in progress<br />
MG-11-YB-Z4 Yellow Bluffs 10 Toad/Liard in progress<br />
MG-11-YB-Z5 Yellow Bluffs 13 Toad/Liard in progress<br />
MG-11-MP375W-Z1 Mile Post 375 West n/a Toad in progress<br />
interval is Rhaetian in age. Four samples were collected for<br />
conodonts, however, <strong>the</strong>y contain only unidentifiable fragments.<br />
One sample w<strong>as</strong> collected for detrital zircon analysis,<br />
and this contains Norian euhedral zircons. Work is ongoing<br />
<strong>to</strong> confirm <strong>the</strong> reliability of this result.<br />
Glacier Spur<br />
The Glacier Spur section contains sands<strong>to</strong>nes and carbonate<br />
rocks of <strong>the</strong> Liard Formation, which span <strong>the</strong> Ladinian–<br />
Carnian boundary. Six samples were collected for conodonts,<br />
and all were productive. They contain a relatively<br />
abundant fauna, including representatives of Budurovignathus<br />
mungoensis, Paragondolella inclinata,<br />
Metapolygnathus polygnathiformis and Neogondolella<br />
liardensis. Paragondolella willis<strong>to</strong>nensis w<strong>as</strong> recovered<br />
for <strong>the</strong> first time from this section. These conodonts are indicative<br />
of <strong>the</strong> upper Ladinian and lower Carnian, which is<br />
in line with previous estimates for <strong>the</strong> age of this section.<br />
Five samples were collected for detrital zircon analysis,<br />
and all were productive. The lowest four samples are dominated<br />
by zircons of Proterozoic age, but also contain zircons<br />
of lower Paleozoic age. The highest sample is lacking<br />
<strong>the</strong> lower Paleozoic population.<br />
E<strong>as</strong>t Carbon Creek<br />
The E<strong>as</strong>t Carbon Creek section consists of silts<strong>to</strong>ne, sands<strong>to</strong>ne<br />
and carbonate belonging <strong>to</strong> <strong>the</strong> Baldonnel Formation.<br />
The sampled interval is Carnian. One sample w<strong>as</strong> collected<br />
for detrital zircon analysis, and it contains zircons of Proterozoic<br />
and lower Paleozoic age.<br />
Beattie Ledge<br />
The Beattie Ledge section consists of sands<strong>to</strong>ne and carbonate<br />
belonging <strong>to</strong> <strong>the</strong> Liard Formation and is Ladinian.<br />
Two samples were collected for conodonts, and although<br />
nei<strong>the</strong>r contain conodonts, <strong>the</strong>y do contain an abundant<br />
icthyolith fauna. Work is ongoing <strong>to</strong> identify <strong>the</strong>se elements<br />
and <strong>to</strong> determine <strong>the</strong>ir stratigraphic significance.<br />
Discussion<br />
The presence and spectra of detrital zircons of Proterozoic<br />
age is consistent with derivation from <strong>the</strong> North American<br />
100 <strong>Geoscience</strong> <strong>BC</strong> Summary of Activities 2011
Table 2. Conodont samples collected from outcrop sites in <strong>the</strong> study area, nor<strong>the</strong><strong>as</strong>tern British Columbia, in 2010 and<br />
2011.<br />
Outcrop sample<br />
Locality<br />
Distance from b<strong>as</strong>e of Formation Analysis<br />
number<br />
section (m)<br />
MG-10-BBR02 Black Bear Ridge 242.8 Pardonet complete<br />
MG-10-BBR03 Black Bear Ridge 242.8 Pardonet complete<br />
MG-10-BBR04 Black Bear Ridge 243.8 Pardonet complete<br />
MG-10-BBR05 Black Bear Ridge 244.05 Pardonet complete<br />
MG-10-GS06A Glacier Spur 129 Liard complete<br />
MG-10-GS06B Glacier Spur 235 Liard complete<br />
MG-10-GS07 Glacier Spur 312.3 Liard complete<br />
MG-10-GS08 Glacier Spur 312.7 Liard complete<br />
MG-10-GS09 Glacier Spur 313 Liard complete<br />
MG-10-GS10 Glacier Spur 319.3 Liard complete<br />
MG-10-BL36 Beattie Ledge 36 Liard complete<br />
MG-10-BL48.5 Beattie Ledge 48.5 Liard complete<br />
MG-11-MP386-C1 Mile Post 386 3.5 Toad in progress<br />
MG-11-MP386-C2 Mile Post 386 8 Toad in progress<br />
MG-11-MP386-C3 Mile Post 386 12 Toad in progress<br />
MG-11-MP386-C4 Mile Post 386 14.1 Toad in progress<br />
MG-11-MP386-C5 Mile Post 386 17.5 Toad in progress<br />
MG-11-NTPW-C1 North Tetsa Phosphate West n/a Toad in progress<br />
MG-11-NTPW-C2 North Tetsa Phosphate West n/a Toad in progress<br />
MG-11-NTP-C0 North Tetsa Phosphate -0.3 Toad in progress<br />
MG-11-NTP-C1 North Tetsa Phosphate 0.45 Toad in progress<br />
MG-11-NTP-C2 North Tetsa Phosphate 2.6 Toad in progress<br />
MG-11-NTP-C3 North Tetsa Phosphate 2.7 Toad in progress<br />
MG-11-NTP-C4 North Tetsa Phosphate 2.8 Toad in progress<br />
MG-11-NTP-C5 North Tetsa Phosphate 3.18 Toad in progress<br />
MG-11-NTP-C6 North Tetsa Phosphate 3.4 Toad in progress<br />
MG-11-NTP-C7 North Tetsa Phosphate 4.3 Toad in progress<br />
MG-11-NTP-C8 North Tetsa Phosphate 5.6 Toad in progress<br />
MG-11-NTP-C9 North Tetsa Phosphate 7.55 Toad in progress<br />
MG-11-NTP-C10 North Tetsa Phosphate 9.55 Toad in progress<br />
MG-11-NTP-C11 North Tetsa Phosphate 10.6 Toad in progress<br />
MG-11-NTP-C12 North Tetsa Phosphate 11.35 Toad in progress<br />
MG-11-NTP-C13 North Tetsa Phosphate n/a Toad in progress<br />
MG-11-OS-C1a Oyster Springs 3.3 Liard in progress<br />
MG-11-OS-C4 Oyster Springs 17.9 Liard in progress<br />
MG-11-YB-C1 Yellow Bluffs 1.7 Toad/Liard in progress<br />
MG-11-YB-C2 Yellow Bluffs 1.7 Toad/Liard in progress<br />
MG-11-YB-C3 Yellow Bluffs 3 Toad/Liard in progress<br />
MG-11-YB-C4 Yellow Bluffs 3 Toad/Liard in progress<br />
MG-11-YB-C5 Yellow Bluffs 3.75 Toad/Liard in progress<br />
MG-11-YB-C6 Yellow Bluffs 3.75 Toad/Liard in progress<br />
MG-11-YB-C7 Yellow Bluffs n/a Toad/Liard in progress<br />
MG-11-YB-C8 Yellow Bluffs 10 Toad/Liard in progress<br />
MG-11-YB-C9 Yellow Bluffs 10 Toad/Liard in progress<br />
MG-11-YB-C10 Yellow Bluffs 8 Toad/Liard in progress<br />
MG-11-YB-C11 Yellow Bluffs 13 Toad/Liard in progress<br />
MG-11-YB-C12 Yellow Bluffs 13 Toad/Liard in progress<br />
MG-11-YB-Cfloat Yellow Bluffs n/a Toad/Liard in progress<br />
MG-11-SL-C1 Sanitary Landfill n/a Toad in progress<br />
MG-11-SL-C2 Sanitary Landfill n/a Toad in progress<br />
MG-11-MP375W-C1 Mile Post 375 West n/a Toad in progress<br />
MG-11-MP375W-C2 Mile Post 375 West n/a Toad in progress<br />
MG-11-MP375W-C3 Mile Post 375 West n/a Toad in progress<br />
MG-11-MP375W-C4 Mile Post 375 West n/a Toad in progress<br />
<strong>Geoscience</strong> <strong>BC</strong> Report 2012-1 101
Figure 3. Location of Willis<strong>to</strong>n Lake sections: 1, Ursula Creek; 2, Ne-parle-p<strong>as</strong> Point; 3, Black Bear<br />
Ridge; 4, Glacier Spur; 5, E<strong>as</strong>t Carbon Creek; 6, Beattie Ledge. Modified from Zonneveld et al.<br />
(2001).<br />
cra<strong>to</strong>n, and zircons of this age are present in all of <strong>the</strong> productive<br />
samples from Willis<strong>to</strong>n Lake. The detrital zircons<br />
of lower Paleozoic age (Ordovician–Devonian) imply initial<br />
derivation from <strong>the</strong> Innuitian/Ellesmerian Orogen <strong>to</strong><br />
<strong>the</strong> north, likely by longshore drift. However, with <strong>the</strong><br />
available data it is impossible <strong>to</strong> tell if <strong>the</strong>se zircons were<br />
sourced directly from <strong>the</strong> orogen during <strong>the</strong> Tri<strong>as</strong>sic, or if<br />
<strong>the</strong>y had been previously incorporated in<strong>to</strong> older sediments<br />
near Willis<strong>to</strong>n Lake, before being reworked by more local<br />
systems during <strong>the</strong> Tri<strong>as</strong>sic. The zircons of Norian age from<br />
Black Bear Ridge could imply that pericra<strong>to</strong>nic terranes<br />
with Tri<strong>as</strong>sic igneous rocks were in close proximity <strong>to</strong> <strong>the</strong><br />
North American continent during <strong>the</strong> Rhaetian, and <strong>the</strong>y<br />
were shedding some of this material in<strong>to</strong> <strong>the</strong> WCSB. However,<br />
<strong>the</strong> euhedral nature of <strong>the</strong>se zircons may suggest that<br />
<strong>the</strong>y are primary, and represent deposition from contemporaneous<br />
volcanic activity during <strong>the</strong> Norian. This signal<br />
will be sought in o<strong>the</strong>r time equivalent sections on<br />
Willis<strong>to</strong>n Lake and elsewhere in nor<strong>the</strong><strong>as</strong>tern <strong>BC</strong>. The absence<br />
of Mississippian and Permian detrital zircons is notable,<br />
<strong>as</strong> zircons of this age were identified in <strong>the</strong> Tri<strong>as</strong>sic of<br />
<strong>the</strong> Yukon by Beranek (2009), and interpreted <strong>as</strong> evidence<br />
for <strong>the</strong> Late Permian <strong>to</strong> Early Tri<strong>as</strong>sic accretion of <strong>the</strong> Yukon-Tanana<br />
terrane with North America. This conclusion is<br />
nei<strong>the</strong>r supported nor disproved by <strong>the</strong> data collected so far<br />
from <strong>BC</strong>.<br />
Subsurface Correlation (NTS 093P)<br />
In order <strong>to</strong> correlate <strong>the</strong> observations made at Willis<strong>to</strong>n<br />
Lake with equivalents in <strong>the</strong> subsurface, samples were collected<br />
from one subsurface core, taken from <strong>the</strong> Murphy<br />
Swan d-54-B/93-P-9 well. This is located <strong>to</strong> <strong>the</strong> sou<strong>the</strong><strong>as</strong>t<br />
of <strong>the</strong> sections on Willis<strong>to</strong>n Lake and at South Halfway<br />
(Golding et al., 2011), in <strong>the</strong> Dawson Creek map area (NTS<br />
093P; Figure 1, locality 9).<br />
The Murphy Swan d-54-B/93-P-9 well intercepts <strong>the</strong> Montney<br />
and Doig formations, and eight core samples were processed<br />
for conodont and subsequent detrital zircon analysis<br />
(Tables 3, 4). These samples were processed for conodonts,<br />
and were productive, with <strong>the</strong> exception of material from<br />
2556.90 m. The conodonts have not been identified <strong>to</strong> species<br />
level, but many appear <strong>to</strong> belong <strong>to</strong> <strong>the</strong> Neogondolella<br />
constricta group and are probably Anisian. Two of <strong>the</strong> samples<br />
(from 2551.80 and 2553.80 m) also produced enough<br />
detrital zircon <strong>to</strong> be dated, and <strong>as</strong> of November 2011 <strong>the</strong>y<br />
were in <strong>the</strong> process of being analyzed.<br />
These samples are slightly older than those that provided<br />
datable zircons from Willis<strong>to</strong>n Lake and South Halfway<br />
(Golding et al., 2011), and <strong>the</strong>refore may provide a test for<br />
<strong>the</strong> tec<strong>to</strong>nic model suggested above. However, <strong>the</strong>se are <strong>the</strong><br />
most e<strong>as</strong>terly of <strong>the</strong> samples studied so far, and may display<br />
102 <strong>Geoscience</strong> <strong>BC</strong> Summary of Activities 2011
Table 3. Detrital zircon samples collected from subsurface wells in <strong>the</strong> study area, nor<strong>the</strong><strong>as</strong>tern<br />
British Columbia, in 2010 and 2011.<br />
a detrital zircon signature dominated by <strong>the</strong> more proximal<br />
North American continent.<br />
Al<strong>as</strong>ka Highway Study Area (NTS 094K)<br />
Seven sections were examined on <strong>the</strong> Al<strong>as</strong>ka Highway during<br />
<strong>the</strong> summer of 2011 and sampled for detrital zircons and<br />
conodonts (Tables 1, 2). All sections are roadcuts on <strong>the</strong><br />
Highway near <strong>to</strong> where it crosses <strong>the</strong> Tetsa River, and are<br />
situated in <strong>the</strong> Tuchodi Lakes map area (NTS 094K; Figure<br />
4). From west <strong>to</strong> e<strong>as</strong>t, <strong>the</strong> sections are: Mile Post 386, North<br />
Tetsa Phosphate West, North Tetsa Phosphate, Oyster<br />
Springs, Yellow Bluffs, Sanitary Landfill and Mile Post<br />
375 West. Of <strong>the</strong>se sections, Mile Post 386, North Tetsa<br />
Phosphate, Yellow Bluffs and Mile Post 375 West have<br />
been studied before, although detailed logs were not available.<br />
Mile Post 375 West is <strong>the</strong> only one of <strong>the</strong>se sections <strong>to</strong><br />
have been mentioned in press (McLearn, 1946; Tozer,<br />
1967). The North Tetsa Phosphate West, Oyster Springs<br />
and Sanitary Landfill sections are new. These sections span<br />
most of <strong>the</strong> Middle Tri<strong>as</strong>sic, from <strong>the</strong> Mulleri Zone (b<strong>as</strong>e<br />
Anisian) <strong>to</strong> <strong>the</strong> Meginae Zone (upper Ladinian).<br />
Sampling<br />
Mile Post 386<br />
The Mile Post 386 section is located at mile post 386 on <strong>the</strong><br />
Al<strong>as</strong>ka Highway, with its b<strong>as</strong>e at Zone 10, 410890E,<br />
<strong>Geoscience</strong> <strong>BC</strong> Report 2012-1 103
Table 4. Conodont samples collected from subsurface wells in <strong>the</strong> study area, nor<strong>the</strong><strong>as</strong>tern British<br />
Columbia, in 2010 and 2011.<br />
6503721N (NAD 83). It consists of 17.75 m of silts<strong>to</strong>ne and<br />
sands<strong>to</strong>ne belonging <strong>to</strong> <strong>the</strong> Toad Formation. Five conodont<br />
samples were collected (Table 2) and two detrital zircon<br />
samples were collected (Table 1). M. Balini (University of<br />
Milan) w<strong>as</strong> present in <strong>the</strong> summer of 2011 and collected<br />
ammonoids from horizons at 8.0, 12.0 and 14.0 m above <strong>the</strong><br />
b<strong>as</strong>e of <strong>the</strong> section, <strong>as</strong> well <strong>as</strong> from isolated outcrop 0.45 m<br />
above <strong>the</strong> <strong>to</strong>p of <strong>the</strong> section. Previous unpublished ammonoid<br />
collections indicate that this section encomp<strong>as</strong>ses <strong>the</strong><br />
Meginae Zone of <strong>the</strong> Ladinian.<br />
North Tetsa Phosphate West<br />
The North Tetsa Phosphate West section is located <strong>to</strong> <strong>the</strong><br />
west of <strong>the</strong> North Tetsa Phosphate section and it consists of<br />
silts<strong>to</strong>ne and sands<strong>to</strong>ne belonging <strong>to</strong> <strong>the</strong> Toad Formation.<br />
Two conodont samples were collected, one from in situ, <strong>the</strong><br />
o<strong>the</strong>r from talus. The in situ collection w<strong>as</strong> also <strong>as</strong>sociated<br />
with ammonoids that were collected by M. Balini. The age<br />
of this section is uncertain.<br />
North Tetsa Phosphate<br />
The b<strong>as</strong>e of <strong>the</strong> North Tetsa Phosphate section is located at<br />
Zone 10, 416937E, 6503965N. It consists of 17.85 m of<br />
silts<strong>to</strong>ne and sands<strong>to</strong>ne belonging <strong>to</strong> <strong>the</strong> Toad Formation.<br />
This section contains a high proportion of phosphate, and is<br />
thought <strong>to</strong> be equivalent at le<strong>as</strong>t in part <strong>to</strong> <strong>the</strong> Doig phosphate<br />
zone that can be identified in <strong>the</strong> subsurface. Twelve<br />
conodont samples were collected from <strong>the</strong> section (Table<br />
2). Ano<strong>the</strong>r sample w<strong>as</strong> collected from 0.3 m below <strong>the</strong><br />
b<strong>as</strong>e of <strong>the</strong> me<strong>as</strong>ured section, and a final sample w<strong>as</strong> collected<br />
from isolated outcrop above <strong>the</strong> <strong>to</strong>p of <strong>the</strong> section.<br />
Five detrital zircon samples were also collected (Table 1).<br />
M. Balini collected ammonoids from horizons at 2.7, 3.18,<br />
5.5, 17.2 and 17.5 m above <strong>the</strong> b<strong>as</strong>e of <strong>the</strong> section, <strong>as</strong> well <strong>as</strong><br />
from one bed 0.3 m below <strong>the</strong> b<strong>as</strong>e of <strong>the</strong> section. Eight<br />
samples were collected from throughout <strong>the</strong> section for <strong>to</strong>tal<br />
organic carbon (TOC) analysis. Previous unpublished<br />
fossil collections indicate that this section is probably early<br />
Anisian in age.<br />
104 <strong>Geoscience</strong> <strong>BC</strong> Summary of Activities 2011
Figure 4. Location of Al<strong>as</strong>ka Highway sections: 1, Mile Post 386; 2, North Tetsa Phosphate West; 3, North Tetsa Phosphate; 4, Oyster<br />
Springs; 5, Yellow Bluffs; 6, Sanitary Landfill; 7, Mile Post 375 West. Inset map modified from Zonneveld et al. (2001).<br />
Oyster Springs<br />
The b<strong>as</strong>e of <strong>the</strong> Oyster Springs section is located at Zone<br />
10, 425012E, 6502735N and it consists of 18.53 m of<br />
silts<strong>to</strong>ne, sands<strong>to</strong>ne and carbonate belonging <strong>to</strong> <strong>the</strong> Liard<br />
Formation. Two conodont samples were collected (Table 2)<br />
and one detrital zircon sample w<strong>as</strong> collected (Table 1). As<br />
this section h<strong>as</strong> not been studied previously, its age is<br />
uncertain.<br />
Yellow Bluffs<br />
The b<strong>as</strong>e of <strong>the</strong> Yellow Bluffs section is located at Zone 10,<br />
426835E, 6502265N and it consists of 92.5 m of silts<strong>to</strong>ne<br />
and sands<strong>to</strong>ne belonging <strong>to</strong> both <strong>the</strong> Toad and Liard formations.<br />
Eleven conodont samples were collected from <strong>the</strong><br />
section (Table 2). A fur<strong>the</strong>r two samples were collected<br />
from talus. Five detrital zircon samples were collected (Table<br />
1). In <strong>the</strong> summer of 2011, M. Balini collected ammonoids<br />
from horizons at 1.7, 8.0 and 10.0 m above <strong>the</strong> b<strong>as</strong>e of<br />
<strong>the</strong> section. Previous unpublished fossil collections indicate<br />
that this section encomp<strong>as</strong>ses <strong>the</strong> Deleeni through<br />
Chischa zones of <strong>the</strong> Ansian.<br />
Sanitary Landfill<br />
The Sanitary Landfill section is located <strong>to</strong> <strong>the</strong> e<strong>as</strong>t of Yellow<br />
Bluffs near <strong>to</strong> an abandoned sanitary landfill. It consists<br />
of silts<strong>to</strong>ne and sands<strong>to</strong>ne belonging <strong>to</strong> <strong>the</strong> Toad Formation.<br />
Two conodont samples were collected, one from in<br />
situ and <strong>the</strong> o<strong>the</strong>r from talus (Table 2). The in situ collection<br />
w<strong>as</strong> <strong>as</strong>sociated with ammonoids that were collected by M.<br />
Balini in <strong>the</strong> summer of 2011. The age of <strong>the</strong> section is<br />
uncertain.<br />
Mile Post 375 West<br />
The Mile Post 375 West section is located at mile post 375<br />
on <strong>the</strong> Al<strong>as</strong>ka Highway and is part of <strong>the</strong> Toad Formation. It<br />
w<strong>as</strong> mentioned in Tozer (1967) and is <strong>the</strong> type section for<br />
<strong>the</strong> Caurus, Minor and Deleeni ammonoid zones. Four<br />
conodont samples were collected, one from Bed 1 of Tozer<br />
(1967), one from just above, one from Bed 2, and one from<br />
Bed 4 (Table 2). Bed 3 could not be located. One detrital zircon<br />
sample w<strong>as</strong> collected from between <strong>the</strong> second and<br />
third conodont samples (Table 1). M. Balini also collected<br />
ammonoids from Bed 4. Previous fossil collections indicate<br />
that this section encomp<strong>as</strong>ses <strong>the</strong> Caurus, Hagei,<br />
Hayesi, Minor and Deleeni Zones of <strong>the</strong> lower, middle and<br />
upper Anisian.<br />
Subsurface Studies (NTS 093P, 094A, B)<br />
In order <strong>to</strong> improve <strong>the</strong> correlation between surface and<br />
subsurface, five cores from wells drilled in nor<strong>the</strong><strong>as</strong>tern <strong>BC</strong><br />
were logged and sampled for conodont analysis (Table 4).<br />
Detrital zircon samples were also collected in order <strong>to</strong> <strong>as</strong>certain<br />
whe<strong>the</strong>r <strong>the</strong> results from <strong>the</strong> surface sections can be<br />
replicated from <strong>the</strong> subsurface far<strong>the</strong>r <strong>to</strong> <strong>the</strong> e<strong>as</strong>t (Table 3).<br />
The cores were selected for <strong>the</strong>ir geographic coverage and<br />
also because <strong>the</strong>y all covered <strong>the</strong> interval of <strong>the</strong> Doig phosphate<br />
zone. This part of <strong>the</strong> Doig Formation is poorly dated<br />
but economically important <strong>as</strong> a source rock. It is thought <strong>to</strong><br />
be anywhere from Spathian <strong>to</strong> Anisian (Zonneveld, 2010),<br />
and <strong>the</strong>refore covers <strong>the</strong> interval in which Beranek (2009)<br />
discovered evidence for sediment being derived from<br />
pericra<strong>to</strong>nic terranes <strong>to</strong> <strong>the</strong> west. Recognizing such a signal<br />
in <strong>the</strong> subsurface of <strong>BC</strong> would have implications for understanding<br />
<strong>the</strong> Doig Formation and would alter <strong>the</strong> current<br />
understanding of sediment input in<strong>to</strong> <strong>the</strong> WCSB at this<br />
time. The samples collected span <strong>the</strong> same interval (<strong>the</strong> boundary<br />
between <strong>the</strong> Montney and Doig formations) <strong>as</strong> those processed<br />
from <strong>the</strong> Murphy Swan well (see above).The processing<br />
of <strong>the</strong>se samples is currently underway. Well<br />
locations are shown on Figure 1.<br />
Sampling Methodology<br />
Talisman Altares 16-17-083-25W6 Well<br />
From <strong>the</strong> Talisman Altares 16-17-083-25W6 well, 34.00 m<br />
of core were logged, from 2267.00 <strong>to</strong> 2233.00 m below <strong>the</strong><br />
surface (Figure 5). Six conodont samples were collected<br />
(Table 4) and 11 samples were collected for detrital zircon<br />
analysis (Table 3). The conodont sample from 2258.30 <strong>to</strong><br />
2257.43 m comes from <strong>the</strong> Montney Formation, all of <strong>the</strong><br />
o<strong>the</strong>r samples come from <strong>the</strong> Doig Formation. This well is<br />
located in <strong>the</strong> Charlie Lake map area (NTS 094A).<br />
<strong>Geoscience</strong> <strong>BC</strong> Report 2012-1 105
Talisman Altares c-085-I/094-B-01 Well<br />
From <strong>the</strong> Talisman Altares c-085-I/094-B-01 well, 85.00 m<br />
of core were logged, from 2375.00 <strong>to</strong> 2290.00 m below <strong>the</strong><br />
surface (Figure 6). Five conodont samples (Table 4) and<br />
five detrital zircon samples were collected (Table 3). All of<br />
<strong>the</strong>se samples come from <strong>the</strong> Doig Formation. This well is<br />
located in <strong>the</strong> Halfway River map area (NTS 094B).<br />
Arc Dawson 07-13-79-15W6 Well<br />
From <strong>the</strong> Arc Dawson 07-13-79-15W6 well, 5.00 m of core<br />
were logged, from 2059.00 <strong>to</strong> 2054.00 m below <strong>the</strong> surface<br />
(Figure 7). Two conodont samples (Table 4) and two detrital<br />
zircon samples were collected (Table 3). The zircon<br />
sample from 2056.35 <strong>to</strong> 2055.68 m is from <strong>the</strong> Montney<br />
Formation, all of <strong>the</strong> o<strong>the</strong>rs come from <strong>the</strong> Doig Formation.<br />
This well is located in <strong>the</strong> Dawson Creek map area (NTS<br />
093P).<br />
Rocor Moni<strong>as</strong> 08-22-82-20W6 Well<br />
From <strong>the</strong> Rocor Moni<strong>as</strong> 08-22-82-20W6 well, 10.60 m of<br />
core were logged, from 1781.00 <strong>to</strong> 1770.40 m below <strong>the</strong><br />
surface (Figure 8). Two conodont samples (Table 4) and<br />
four detrital zircon samples were collected (Table 3). All<br />
<strong>the</strong> samples are from <strong>the</strong> Doig Formation. This well is located<br />
in <strong>the</strong> Charlie Lake map area (NTS 094A).<br />
Petro-Canada Kobes d-048-A/094-B-09 Well<br />
From <strong>the</strong> Petro-Canada Kobes d-048-A/094-B-09 well,<br />
9.80 m of core were logged, from 1970.00 <strong>to</strong> 1960.20 m below<br />
<strong>the</strong> surface (Figure 9). Six samples were collected, with<br />
each one <strong>to</strong> be processed for both conodonts and detrital<br />
zircons (Tables 3, 4). The two samples, at 1968.25 and<br />
1967.85 m, are from <strong>the</strong> Montney Formation, all of <strong>the</strong> o<strong>the</strong>rs<br />
come from <strong>the</strong> Doig Formation. This well is located in<br />
<strong>the</strong> Halfway River map area (NTS 094B).<br />
Conclusions and Future Work<br />
Detrital zircon ages collected from <strong>the</strong> Ladinian–Carnian<br />
boundary at Glacier Spur on Willis<strong>to</strong>n Lake indicate derivation<br />
of at le<strong>as</strong>t some of <strong>the</strong> sediment from <strong>the</strong> Ellesmerian/Innuitian<br />
Orogen <strong>to</strong> <strong>the</strong> north, supporting <strong>the</strong> hypo<strong>the</strong>sis<br />
of Ross et al. (1997) and Beranek (2009). None of<br />
<strong>the</strong> sections have produced any Mississippian or Permian<br />
zircons, such <strong>as</strong> those found by Beranek (2009) in <strong>the</strong> Yukon,<br />
and so <strong>as</strong> yet <strong>the</strong> hypo<strong>the</strong>sis of early pericra<strong>to</strong>nic<br />
terrane accretion cannot be confirmed in <strong>BC</strong>. However, <strong>the</strong><br />
Late Tri<strong>as</strong>sic dates from zircon recovered from Rhaetian<br />
rocks at Black Bear Ridge indicate <strong>the</strong> possibility of a<br />
nearby Tri<strong>as</strong>sic igneous rock source, or perhaps even primary<br />
volcanism in <strong>the</strong> region of <strong>BC</strong> during <strong>the</strong> latest Tri<strong>as</strong>sic.<br />
This is significant <strong>as</strong> <strong>the</strong>re is no evidence for Tri<strong>as</strong>sic<br />
volcanism on <strong>the</strong> cra<strong>to</strong>n, and so would imply a source from<br />
a pericra<strong>to</strong>nic terrane <strong>to</strong> <strong>the</strong> west, possibly <strong>the</strong> Yukon-<br />
Tanana terrane. The absence of a western detrital zircon<br />
signature in particular sections may <strong>the</strong>refore be due <strong>to</strong> <strong>the</strong><br />
architecture of <strong>the</strong> WCSB, with <strong>the</strong>se zircons not being<br />
transported <strong>to</strong> some parts of <strong>the</strong> b<strong>as</strong>in.<br />
All of this indicates a more complex pattern of sedimentation<br />
in <strong>the</strong> WCSB during <strong>the</strong> Tri<strong>as</strong>sic than h<strong>as</strong> previously<br />
been <strong>as</strong>sumed, it is not just a simple c<strong>as</strong>e of sediment being<br />
deposited from <strong>the</strong> e<strong>as</strong>t <strong>to</strong> <strong>the</strong> west. This h<strong>as</strong> implications<br />
both for sedimen<strong>to</strong>logical analysis of <strong>the</strong> natural g<strong>as</strong>–<br />
bearing Montney and Doig formations, <strong>as</strong> well <strong>as</strong> for <strong>the</strong><br />
tracing of facies within <strong>the</strong> b<strong>as</strong>in.<br />
Conodonts have already proved <strong>the</strong>ir worth in correlating<br />
beds within <strong>the</strong> Tri<strong>as</strong>sic (see Orchard and Tozer, 1997), and<br />
this study should contribute <strong>to</strong> a fur<strong>the</strong>r refinement of <strong>the</strong><br />
biostratigraphic scheme and enhanced correlation across<br />
<strong>the</strong> b<strong>as</strong>in, improving <strong>the</strong> understanding of <strong>the</strong> timing of<br />
geological events during this period in <strong>BC</strong>.<br />
The remainder of this study will focus on trying <strong>to</strong> find <strong>the</strong><br />
Mississippian–Permian detrital zircon signal found in <strong>the</strong><br />
Yukon. Work will be concentrated in <strong>the</strong> north of <strong>the</strong> province,<br />
<strong>to</strong> avoid <strong>the</strong> possible effects of entrainment by <strong>the</strong><br />
Peace River embayment. This study will also try <strong>to</strong> confirm<br />
<strong>the</strong> Late Tri<strong>as</strong>sic detrital zircon signal found at Black Bear<br />
Ridge by examining and sampling o<strong>the</strong>r Rhaetian and<br />
Norian sections throughout <strong>the</strong> foothills. Analysis of whole<br />
rock geochemistry may help <strong>to</strong> determine <strong>the</strong> origin of <strong>the</strong><br />
Late Tri<strong>as</strong>sic zircons; are <strong>the</strong>y primary zircons from volcanic<br />
<strong>as</strong>h or are <strong>the</strong>y reworked from older igneous intrusions<br />
on pericra<strong>to</strong>nic terranes The final goal of this study will be<br />
<strong>to</strong> improve <strong>the</strong> correlation of events between <strong>the</strong> surface<br />
and subsurface and fur<strong>the</strong>r demonstrate <strong>the</strong> utility of this<br />
work in natural g<strong>as</strong> exploration.<br />
This study provides <strong>the</strong> opportunity <strong>to</strong> understand <strong>the</strong> distribution<br />
of sedimentary facies in <strong>the</strong> WCSB in a way that is<br />
not possible simply by looking at subsurface core samples.<br />
Correlation between outcrop and <strong>the</strong> subsurface using<br />
biostratigraphy allows <strong>the</strong>se facies <strong>to</strong> be traced in<strong>to</strong> <strong>the</strong><br />
subsurface where <strong>the</strong> equivalent formations contain important<br />
natural g<strong>as</strong> reserves. Understanding <strong>the</strong> distribution of<br />
sedimentary facies is important for <strong>the</strong> economic extraction<br />
of natural g<strong>as</strong>. The detrital zircon part of this study allows<br />
<strong>the</strong> provenance of <strong>the</strong> natural g<strong>as</strong>–bearing sediments <strong>to</strong> be<br />
determined. This in turn indicates <strong>the</strong> direction of transport<br />
of <strong>the</strong>se sediments, which exerts an important control on<br />
<strong>the</strong> architecture of <strong>the</strong> sediments deposited in <strong>the</strong> b<strong>as</strong>in. Understanding<br />
<strong>the</strong> direction of transport and <strong>the</strong>refore <strong>the</strong> architecture<br />
of <strong>the</strong> b<strong>as</strong>in will also aid <strong>the</strong> extraction of natural<br />
g<strong>as</strong>. Finally, refinements that are being made <strong>to</strong> <strong>the</strong> biostratigraphic<br />
framework will allow more precise correlation of<br />
units both within <strong>the</strong> subsurface and from <strong>the</strong> subsurface <strong>to</strong><br />
outcrop, which will in turn enable fine-scale mapping of facies<br />
across <strong>the</strong> b<strong>as</strong>in and will also aid in finding more natural<br />
g<strong>as</strong> reservoirs of similar age <strong>to</strong> those already known.<br />
106 <strong>Geoscience</strong> <strong>BC</strong> Summary of Activities 2011
Figure 5. Sedimentary log of core from <strong>the</strong> Talisman Altares 16-17-083-25W6 well, showing location of sampled<br />
intervals. Vertical depths are shown in metres below surface. Abbreviations: cs, coarse-grained sand;<br />
fs, fine-grained sand; ms, medium-grained sand; sed, sedimentary; vcs, very coarse grained sand; vfs, very<br />
fine grained sand.<br />
<strong>Geoscience</strong> <strong>BC</strong> Report 2012-1 107
108 <strong>Geoscience</strong> <strong>BC</strong> Summary of Activities 2011
<strong>Geoscience</strong> <strong>BC</strong> Report 2012-1 109<br />
Figure 6. Sedimentary log of core from <strong>the</strong> Talisman Altares c-085-I/094-B-01 well, showing location of sampled intervals. Vertical depths are shown in metres below surface. See Figure 5 for<br />
<strong>the</strong> key <strong>to</strong> symbols. Abbreviations: cs, coarse-grained sand; fs, fine-grained sand; ms, medium-grained sand; sed, sedimentary; vcs, very coarse grained sand; vfs, very fine grained sand.
Acknowledgments<br />
Funding for this project w<strong>as</strong> provided by <strong>Geoscience</strong> <strong>BC</strong>.<br />
Core material w<strong>as</strong> supplied by Murphy Oil Corporation.<br />
The staff at <strong>the</strong> <strong>BC</strong> Ministry of Energy and Mines core facility<br />
in Charlie Lake are thanked for <strong>the</strong>ir help and patience.<br />
F. Ferri provided a helpful review of <strong>the</strong> manuscript.<br />
References<br />
Beranek, L. (2009): Provenance, paleotec<strong>to</strong>nic setting, and<br />
depositional framework of North American Tri<strong>as</strong>sic strata in<br />
Yukon: <strong>the</strong> sedimentary record of pericra<strong>to</strong>nic terrane accretion<br />
in <strong>the</strong> nor<strong>the</strong>rn Canadian Cordillera; Ph.D. <strong>the</strong>sis, University<br />
of British Columbia, 338 p.<br />
Davies, G.R. (1997): The Tri<strong>as</strong>sic of <strong>the</strong> Western Canada Sedimentary<br />
B<strong>as</strong>in: tec<strong>to</strong>nic and stratigraphic framework,<br />
paleogeography, paleoclimate and biota; in Tri<strong>as</strong>sic of <strong>the</strong><br />
Western Canada Sedimentary B<strong>as</strong>in, T.F. Moslow and<br />
J. Wittenberg (ed.), Bulletin of Canadian Petroleum Geology,<br />
v. 45, p. 434–460.<br />
Ferri, F. (2009): Geology of <strong>the</strong> Jones Peak area (NTS 94B/02 and<br />
07), Halfway River map sheet (94B); in <strong>Geoscience</strong> Reports<br />
2009, <strong>BC</strong> Ministry of Energy and Mines, p. 5–24.<br />
Gibson, D.W. (1975): Tri<strong>as</strong>sic rocks of <strong>the</strong> Rocky Mountain Foothills<br />
and Front Ranges of nor<strong>the</strong><strong>as</strong>tern British Columbia and<br />
west-central Alberta; Geological Survey of Canada, Bulletin<br />
247, 37 p.<br />
Golding, M.L., Ferri, F., Mortensen, J.K., Zonneveld, J-P. and Orchard,<br />
M.J. (2010): Biostratigraphic and sedimen<strong>to</strong>logical<br />
studies of natural g<strong>as</strong>–bearing Tri<strong>as</strong>sic strata in <strong>the</strong> Halfway<br />
River map area (NTS 094B), nor<strong>the</strong><strong>as</strong>tern British Columbia:<br />
progress report; in <strong>Geoscience</strong> <strong>BC</strong> Summary of Activities<br />
2009, <strong>Geoscience</strong> <strong>BC</strong>, Report 2010-1, p. 249–258, URL<br />
[November 2011].<br />
Golding, M.L., Zonneveld, J-P., Orchard, M.J., Ferri, F. and<br />
Mortensen, J.K. (2011): Stratigraphic correlation and sedimentary<br />
provenance of Tri<strong>as</strong>sic natural g<strong>as</strong>–bearing rocks in<br />
nor<strong>the</strong><strong>as</strong>tern British Columbia (NTS 094B): correlation of<br />
outcrop <strong>to</strong> <strong>the</strong> subsurface; in <strong>Geoscience</strong> <strong>BC</strong> Summary of<br />
Activities 2010, <strong>Geoscience</strong> <strong>BC</strong>, Report 2011-1, p. 229–<br />
238, URL [November<br />
2011].<br />
Hunt, A.D. and Ratcliffe, J.D. (1959): Tri<strong>as</strong>sic stratigraphy, Peace<br />
River area, Alberta and British Columbia, Canada; American<br />
Association of Petroleum Geologists, Bulletin 43, p.<br />
563–589.<br />
McLearn, F.H. (1946): A Middle Tri<strong>as</strong>sic (Anisian) fauna in Halfway,<br />
Sikanni Chief and Tetsa valleys, nor<strong>the</strong><strong>as</strong>tern British<br />
Columbia; Geological Survey of Canada, Paper 46-1, 23 p.<br />
Figure 7. Sedimentary log of core from <strong>the</strong> Arc Dawson 07-13-79-15W6 well, showing location of sampled<br />
intervals. Vertical depths are shown in metres below surface. See Figure 5 for <strong>the</strong> key <strong>to</strong> symbols.<br />
Abbreviations: cs, coarse-grained sand; fs, fine-grained sand; ms, medium-grained sand; sed, sedimentary;<br />
vcs, very coarse grained sand; vfs, very fine grained sand.<br />
110 <strong>Geoscience</strong> <strong>BC</strong> Summary of Activities 2011
Figure 8. Sedimentary log of core from <strong>the</strong> Rocor Moni<strong>as</strong> 08-22-82-20W6 well, showing location of sampled<br />
intervals. Vertical depths are shown in metres below surface. See Figure 5 for <strong>the</strong> key <strong>to</strong> symbols. Abbreviations:<br />
cs, coarse-grained sand; fs, fine-grained sand; ms, medium-grained sand; sed, sedimentary; vcs,<br />
very coarse grained sand; vfs, very fine grained sand.<br />
<strong>Geoscience</strong> <strong>BC</strong> Report 2012-1 111
Figure 9. Sedimentary log of core from <strong>the</strong> Petro-Canada Kobes d-048-A/094-B-09 well, showing location of sampled<br />
intervals. Vertical depths are shown in metres below surface. See Figure 5 for <strong>the</strong> key <strong>to</strong> symbols. Abbreviations:<br />
cs, coarse-grained sand; fs, fine-grained sand; ms, medium-grained sand; sed, sedimentary; vcs, very<br />
coarse grained sand; vfs, very fine grained sand.<br />
112 <strong>Geoscience</strong> <strong>BC</strong> Summary of Activities 2011
Monger, J.W.H. and Price, R.A. (2002): The Canadian Cordillera:<br />
geology and tec<strong>to</strong>nic evolution; Canadian Society of Exploration<br />
Geophysicists Recorder, February, p. 17–36, URL <<br />
https://www.geology.ucdavis.edu/~shlemonc/html/trips/sk<br />
eena_river/documents/journals/Monger(2002).pdf> [November<br />
2011].<br />
Nelson, J.L., Colpron, M., Piercey, S.J., Dusel-Bacon, C., Murphy,<br />
D.C. and Roots, C.F. (2006): Paleozoic tec<strong>to</strong>nic and metallogenic<br />
evolution of <strong>the</strong> pericra<strong>to</strong>nic terranes in Yukon,<br />
nor<strong>the</strong>rn British Columbia and e<strong>as</strong>tern Al<strong>as</strong>ka; in Paleozoic<br />
Evolution and Metallogeny of Pericra<strong>to</strong>nic Terranes at <strong>the</strong><br />
Ancient Pacific Margin of North America, Canadian and<br />
Al<strong>as</strong>kan Cordillera, M. Colpron and J.L. Nelson (ed.), Geological<br />
Association of Canada, Special Paper 45, p. 323–<br />
360.<br />
Orchard, M.J. and Tozer, E.T. (1997): Tri<strong>as</strong>sic conodont<br />
biochronology, its calibration with <strong>the</strong> ammonoid standard,<br />
and a biostratigraphic summary for <strong>the</strong> Western Canada<br />
Sedimentary B<strong>as</strong>in; in Tri<strong>as</strong>sic of <strong>the</strong> Western Canada Sedimentary<br />
B<strong>as</strong>in, T.F. Moslow and J. Wittenberg (ed.), Bulletin<br />
of Canadian Petroleum Geology, v. 45, p. 675–692.<br />
Pelletier, B.R. (1965): Paleocurrents in <strong>the</strong> Tri<strong>as</strong>sic of nor<strong>the</strong><strong>as</strong>tern<br />
British Columbia; in Primary Sedimentary Structures and<br />
<strong>the</strong>ir Hydrodynamic Interpretation, G.V. Middle<strong>to</strong>n (ed.),<br />
SEPM (Society for Sedimentary Geology), Special Publication<br />
12, p. 233–245.<br />
Ross, G.M., Gehrels, G.E. and Patchett, P.J. (1997): Provenance of<br />
Tri<strong>as</strong>sic strata in <strong>the</strong> Cordilleran miogeocline, western Canada;<br />
Bulletin of Canadian Petroleum Geology, v. 45, p. 461–<br />
473.<br />
Thompson, R.I. (1989): Stratigraphy, tec<strong>to</strong>nic evolution and structural<br />
analysis of <strong>the</strong> Halfway River map area (94B), nor<strong>the</strong>rn<br />
Rocky Mountains, British Columbia; Geological Survey of<br />
Canada, Memoir 425, 119 p.<br />
Tozer, E.T. (1967): A standard for Tri<strong>as</strong>sic time; Geological Survey<br />
of Canada, Bulletin 156, 141 p.<br />
Walsh, W., Adams, C., Kerr, B. and Korol, J. (2006): Regional<br />
“shale g<strong>as</strong>” potential of <strong>the</strong> Tri<strong>as</strong>sic Doig and Montney formations,<br />
nor<strong>the</strong><strong>as</strong>tern British Columbia; <strong>BC</strong> Ministry of Energy<br />
and Mines, Resource Development and <strong>Geoscience</strong><br />
Branch, Petroleum Geology Open File 2006-02, 20 p., URL<br />
[November 2011].<br />
Zonneveld, J-P. (2010): The Tri<strong>as</strong>sic of nor<strong>the</strong><strong>as</strong>tern British Columbia:<br />
sedimentary characteristics and stratigraphic architecture<br />
of conventional and unconventional reservoir<br />
successions; Geological Association of Canada–<br />
Mineralogical Association Joint Annual Meeting<br />
(GeoCanada 2010), Willis<strong>to</strong>n Lake Field Trip Guidebook,<br />
158 p.<br />
Zonneveld, J-P., Gingr<strong>as</strong>, M.K. and Pember<strong>to</strong>n, S.G. (2001): Trace<br />
fossil <strong>as</strong>semblages in a Middle Tri<strong>as</strong>sic mixed silicicl<strong>as</strong>ticcarbonate<br />
marginal marine depositional system, British Columbia;<br />
Palaeogeography, Palaeoclima<strong>to</strong>logy, Palaeoecology,<br />
v. 166, p. 249–276.<br />
Zonneveld, J-P., Moslow, T.F. and Henderson, C.M. (1997):<br />
Lithofacies <strong>as</strong>sociations and depositional environments in a<br />
mixed silicicl<strong>as</strong>tic-carbonate depositional system, upper<br />
Liard Formation, Tri<strong>as</strong>sic, nor<strong>the</strong><strong>as</strong>tern British Columbia;<br />
Bulletin of Canadian Petroleum Geology, v. 45, p. 553–575.<br />
<strong>Geoscience</strong> <strong>BC</strong> Report 2012-1 113
114 <strong>Geoscience</strong> <strong>BC</strong> Summary of Activities 2011
Chronostratigraphic and Tec<strong>to</strong>nostratigraphic Summary of <strong>the</strong> Late Paleozoic and<br />
Early Tri<strong>as</strong>sic Succession in E<strong>as</strong>t-Central British Columbia (NTS 093I, O, P)<br />
C.M. Henderson, University of Calgary, Calgary, AB, cmhender@ucalgary.ca<br />
K.D. Zubin-Stathopoulos, University of Calgary, Calgary, AB<br />
G.J. Dean, Chesapeake Energy Corporation, Oklahoma City, OK<br />
Henderson, C.M., Zubin-Stathopoulos, K.D. and Dean, G.J. (2012): Chronostratigraphic and tec<strong>to</strong>nostratigraphic summary of <strong>the</strong> Late Paleozoic<br />
and Early Tri<strong>as</strong>sic succession in e<strong>as</strong>t-central British Columbia (NTS 093I, O, P); in <strong>Geoscience</strong> <strong>BC</strong> Summary of Activities 2011,<br />
<strong>Geoscience</strong> <strong>BC</strong>, Report 2012-1, p. 115–124.<br />
Introduction<br />
The northwest margin of Pangea during <strong>the</strong> late Paleozoic<br />
h<strong>as</strong> been his<strong>to</strong>rically depicted <strong>as</strong> a relatively p<strong>as</strong>sive margin<br />
(Barclay et al., 1990), but <strong>the</strong>re is incre<strong>as</strong>ing evidence for<br />
active compressive tec<strong>to</strong>nics. The latest Devonian Antler<br />
orogeny is recognized in <strong>the</strong> Roberts Mountain allochthon<br />
in central Nevada (Dickinson, 2006), and evidence for this<br />
event is present within <strong>the</strong> pericra<strong>to</strong>nic Kootenay terrane in<br />
sou<strong>the</strong>rn British Columbia (Richards, 1989; Dickinson,<br />
2004). The Sonoma orogeny is recorded in <strong>the</strong> western<br />
United States by latest Permian <strong>to</strong> earliest Tri<strong>as</strong>sic thrusting<br />
of <strong>the</strong> Havallah B<strong>as</strong>in succession over <strong>the</strong> Antler Belt<br />
(Brueckner and Snyder, 1985; Dickenson, 2006). Several<br />
additional deformation events are recognized between <strong>the</strong><br />
Antler and Sonoman events in <strong>the</strong> western United States<br />
during <strong>the</strong> Mississippian <strong>to</strong> Permian (Trexler et al., 2003,<br />
2004). Critical <strong>to</strong> our understanding of <strong>the</strong> evolution of <strong>the</strong><br />
Cordilleran margin in Canada and <strong>the</strong> United States is<br />
whe<strong>the</strong>r <strong>the</strong>se collision and <strong>as</strong>sembly events affected <strong>the</strong><br />
North American margin or occurred in <strong>the</strong> Panthal<strong>as</strong>sic<br />
Ocean, <strong>as</strong> in <strong>the</strong> SAYBIA model of Johns<strong>to</strong>n (2008) and<br />
RUBIA model of Hildebrand (2009). S. Johns<strong>to</strong>n (2008)<br />
argued that <strong>the</strong> best evidence for a ribbon continent forming<br />
well away from <strong>the</strong> North American margin is <strong>the</strong> fact that<br />
<strong>the</strong>re w<strong>as</strong> no evidence of loading causing isostatic flexure<br />
of <strong>the</strong> lithosphere within <strong>the</strong> ‘Rocky Mountain Platform’<br />
(i.e., <strong>the</strong> Front Ranges of <strong>the</strong> Canadian Rockies). Root<br />
(2001), however, proposed that a Middle Devonian (upper<br />
Eifelian) event mapped in sou<strong>the</strong><strong>as</strong>tern <strong>BC</strong> resulted in <strong>the</strong><br />
development of a peripheral bulge in <strong>the</strong> Front Ranges<br />
where Fr<strong>as</strong>nian strata unconformably overlie Middle Cambrian<br />
units. He suggested that this w<strong>as</strong> an early manifestation<br />
of <strong>the</strong> Antler event, but admitted that one problem with<br />
his interpretation w<strong>as</strong> <strong>the</strong> lack of evidence for activity on<br />
Keywords: Pennsylvanian, Permian, Lower Tri<strong>as</strong>sic, conodont<br />
biostratigraphy, tec<strong>to</strong>nostratigraphic framework<br />
This publication is also available, free of charge, <strong>as</strong> colour digital<br />
<strong>file</strong>s in Adobe Acrobat ® <strong>PDF</strong> format from <strong>the</strong> <strong>Geoscience</strong> <strong>BC</strong><br />
website: http://www.geosciencebc.com/s/DataRele<strong>as</strong>es.<strong>as</strong>p.<br />
this bulge during <strong>the</strong> Antler orogeny in latest Devonian <strong>to</strong><br />
Early Carboniferous. However, D. Johns<strong>to</strong>n et al. (2010),<br />
using a detailed isopach map b<strong>as</strong>ed on both surface sections<br />
and subsurface wells, and supported by high-resolution<br />
conodont biostratigraphy, showed that <strong>the</strong> lack of Early<br />
Tournaisian strata of <strong>the</strong> upper Exshaw and middle Bakken<br />
formations in southwestern Alberta may indicate slight<br />
e<strong>as</strong>tward migration of this same peripheral bulge. In addition,<br />
research during <strong>the</strong> p<strong>as</strong>t ten years on <strong>the</strong> North American<br />
cra<strong>to</strong>n of west-central Alberta and e<strong>as</strong>t-central British<br />
Columbia (<strong>BC</strong>) h<strong>as</strong> shown evidence for structural inversion<br />
of block faults during <strong>the</strong> Late Paleozoic and earliest<br />
Tri<strong>as</strong>sic (Kendall, 1999; Panek, 2000; Fossenier, 2002;<br />
Henderson et al., 2002; Dunn, 2003; Henderson et al.,<br />
2010; Zubin-Stathopoulos et al., 2011) that significantly affects<br />
<strong>the</strong> paleogeography of <strong>the</strong> margin and <strong>the</strong> potential for<br />
hydrocarbon resources.<br />
This paper builds on <strong>the</strong> initial stratigraphic framework of<br />
Bamber and Macqueen (1979), and represents a summary<br />
of three years of research in e<strong>as</strong>t-central <strong>BC</strong> that includes<br />
o<strong>the</strong>r evidence in support of tec<strong>to</strong>nic controls on <strong>the</strong><br />
cra<strong>to</strong>nic platform succession during <strong>the</strong> Pennsylvanian and<br />
Permian. These effects, which are sometimes subtle, are<br />
now recognized because we re-examined, using high-resolution<br />
biostratigraphy, <strong>the</strong> timing of widespread unconformities<br />
that correlate all <strong>the</strong> way <strong>to</strong> Nevada. The complexity<br />
of <strong>the</strong> tec<strong>to</strong>nostratigraphic framework means that<br />
this research summary is really only a beginning.<br />
Study Area and Methods<br />
Field sites for this study are located in <strong>the</strong> Sukunka-Kakwa<br />
area within NTS are<strong>as</strong> 093P, I and O (Figure 1), and have<br />
been described previously by Henderson et al. (2010) and<br />
Zubin-Stathopoulos et al. (2011). The outcrops are located<br />
sou<strong>the</strong><strong>as</strong>t of Chetwynd, <strong>BC</strong> and are part of a sou<strong>the</strong><strong>as</strong>ttrending<br />
outcrop belt that represents <strong>the</strong> westernmost extent<br />
of <strong>the</strong> Western Canada Sedimentary B<strong>as</strong>in. Outcrops<br />
were accessed by helicopter due <strong>to</strong> <strong>the</strong> remote nature of <strong>the</strong><br />
sites. The approach w<strong>as</strong> <strong>to</strong> combine high-resolution cono-<br />
<strong>Geoscience</strong> <strong>BC</strong> Report 2012-1 115
Figure 1. Study area showing studied sections and Mississippian <strong>to</strong> Tri<strong>as</strong>sic geology (not palinsp<strong>as</strong>tically res<strong>to</strong>red). Schematic stratigraphic<br />
summary columns show that <strong>the</strong> overall preserved succession more or less parallels <strong>the</strong> individual thrust sheets, with <strong>the</strong> most complete succession<br />
in <strong>the</strong> westernmost sheet that includes <strong>the</strong> Mountain Creek and Lean-<strong>to</strong> Creek locations, which are <strong>the</strong> only locations in <strong>the</strong> region preserving<br />
Artinskian <strong>to</strong> Kungurian strata. Note missing Early Permian strata at Watson Peak, Mount Palsson, Mount Crum and Mount Cornock, defining a<br />
sou<strong>the</strong><strong>as</strong>t-trending western paleohigh. Modified from Zubin-Stathopoulos et al. (2011).<br />
116 <strong>Geoscience</strong> <strong>BC</strong> Summary of Activities 2011
dont biostratigraphy with detailed section me<strong>as</strong>urement<br />
and some mapping.<br />
Evidence for Pennsylvanian–Permian<br />
Tec<strong>to</strong>nics<br />
This section summarizes <strong>the</strong> evidence for several tec<strong>to</strong>nic<br />
events and highlights some of <strong>the</strong> implications each h<strong>as</strong> in<br />
terms of diagenesis, fracture distribution and unit preservation.<br />
The primary line of evidence is identification and duration<br />
of unconformities within <strong>the</strong> Pennsylvanian–Permian<br />
of <strong>the</strong> study area, <strong>as</strong> determined by detailed conodont<br />
biostratigraphy (Fossenier, 2002; Dunn, 2003; Zubin-<br />
Stathopoulos, 2011). The biozonation scheme for <strong>the</strong> area<br />
w<strong>as</strong> previously provided in Zubin-Stathopoulos et al.<br />
(2011). Comparisons are made <strong>to</strong> tec<strong>to</strong>nostratigraphic<br />
events documented in <strong>the</strong> southwestern United States.<br />
C4/C5 Moscovian Event<br />
The lower Belloy Carbonate Member (Halbertsma, 1959;<br />
type section in <strong>the</strong> 12-14-78-1W6 well) w<strong>as</strong> later referred<br />
<strong>to</strong> <strong>as</strong> <strong>the</strong> Ksituan Member of <strong>the</strong> Belloy Formation<br />
(Henderson et al., 1994), and a paper is in preparation <strong>to</strong><br />
name this unit <strong>as</strong> a new formation (see Zubin-Stathopoulos,<br />
2011). It is a distinct unit that is separated from <strong>the</strong> rest of<br />
<strong>the</strong> Belloy Formation by an <strong>entire</strong> stratigraphic sequence<br />
(Figure 2). It is contemporaneous with a post–Taylor Flat<br />
extensional event in which a peritidal <strong>to</strong> open-marine carbonate<br />
succession is widely distributed from west-central<br />
Alberta <strong>to</strong> e<strong>as</strong>t-central <strong>BC</strong> (Porter, 2007). The peritidal succession<br />
in Alberta is generally dolomitized and represents<br />
an important hydrocarbon-bearing unit in a relatively simple<br />
stratigraphic-fault play (see Progress Field in Dunn,<br />
2003). In <strong>BC</strong>, <strong>the</strong> unit is variably dolomitized and represents<br />
a very important g<strong>as</strong> play in a thrust structural play,<br />
but <strong>the</strong>re are many complications (see ‘Hydrocarbon Implications’).<br />
This event and overlying strata resulted in <strong>the</strong> Ely<br />
B<strong>as</strong>in in Nevada (Trexler et al., 2004).<br />
C6 K<strong>as</strong>imovian and P1 Asselian Events<br />
The C6 event is one of <strong>the</strong> more prominent in Nevada that<br />
resulted in a major angular unconformity, which is especially<br />
well displayed at Carlin Canyon (Trexler et al., 2004)<br />
in <strong>the</strong> northwestern part of <strong>the</strong> Dry Mountain Trough (Figure<br />
3). The C6 and P1 unconformities in Nevada truncate<br />
structures of two distinct events, including thrust faults and<br />
overturned folds in <strong>the</strong> C6 event and more open folds and<br />
high-angle normal faults just before <strong>the</strong> P1 unconformity<br />
(Trexler et al., 2004). We have not resolved such intense<br />
compression structures in e<strong>as</strong>t-central <strong>BC</strong> because <strong>the</strong> record<br />
is mostly in <strong>the</strong> subsurface and some units have been<br />
eroded. However, considerable local evidence points <strong>to</strong> this<br />
being an important tec<strong>to</strong>nostratigraphic event in <strong>the</strong> region.<br />
In Alberta, <strong>the</strong> Ksituan Formation w<strong>as</strong> subaerially exposed<br />
and accompanied by dolomitization and karst development<br />
(Porter, 2007). This could be attributed simply <strong>to</strong> a<br />
lowstand of sea level, but <strong>the</strong> development of highs and<br />
b<strong>as</strong>ins <strong>to</strong> <strong>the</strong> west suggests that it w<strong>as</strong> more complex.<br />
Zubin-Stathopoulos et al. (2011) provided evidence that a<br />
western paleohigh and e<strong>as</strong>tern interior sea developed during<br />
this event (Figure 2). Local uplift removed much of <strong>the</strong><br />
previous record of Moscovian carbonate rocks (Figure 2)<br />
and some of <strong>the</strong>se cl<strong>as</strong>ts are found within <strong>the</strong> Asselian <strong>to</strong><br />
lower Sakmarian Belcourt Formation. These structures<br />
were large enough <strong>to</strong> affect carbonate sedimentation that<br />
included warm-water <strong>as</strong>sociations in <strong>the</strong> shallow interior<br />
sea (Belcourt Formation), cool-water <strong>as</strong>sociations west of<br />
<strong>the</strong> paleohigh in <strong>the</strong> newly defined Mountain Creek Formation<br />
(see paper in preparation in Zubin-Stathopoulos 2011)<br />
and a thick carbonate muds<strong>to</strong>ne unit in well C-52-K<br />
(Figure 2).<br />
P2 Artinskian Event<br />
The P2 event is a major unconformity at <strong>the</strong> regional scale<br />
in Nevada that involved <strong>the</strong> development of <strong>the</strong> Dry Mountain<br />
Trough, but <strong>the</strong> deformation geometry is less clear<br />
(Trexler et al., 2004). This event may also correlate with <strong>the</strong><br />
Melvillian Disturbance (Beauchamp, 1995) in <strong>the</strong><br />
Sverdrup B<strong>as</strong>in of <strong>the</strong> Canadian Arctic. In e<strong>as</strong>t-central <strong>BC</strong>,<br />
rocks overlying <strong>the</strong> P2 unconformity are missing except for<br />
thin units of <strong>the</strong> Kindle Formation at Mountain Creek and<br />
Lean-<strong>to</strong> Creek in westernmost exposures. At <strong>the</strong> same time,<br />
<strong>to</strong> <strong>the</strong> e<strong>as</strong>t in <strong>the</strong> subsurface of west-central Alberta, a new<br />
b<strong>as</strong>in developed in which Belloy Formation silicicl<strong>as</strong>tic<br />
rocks and minor biocl<strong>as</strong>tic carbonate were deposited (Figures<br />
2, 3). Presumably, a broad high developed that restricted<br />
<strong>the</strong>se Artinskian-age deposits <strong>to</strong> <strong>the</strong> Peace River<br />
B<strong>as</strong>in (Figure 3). Sandy carbonate rocks of this age are also<br />
present in <strong>the</strong> Telford B<strong>as</strong>in (Figure 3) <strong>to</strong> <strong>the</strong> south<br />
(MacRae and McGugan, 1977). This broad high in e<strong>as</strong>tcentral<br />
<strong>BC</strong> appears <strong>to</strong> have resulted from <strong>the</strong> amalgamation<br />
of <strong>the</strong> Sukunka Uplift and <strong>the</strong> Beat<strong>to</strong>n High, which were<br />
separate structures before <strong>the</strong> Artinskian (Henderson et al.,<br />
1994); it also encomp<strong>as</strong>ses <strong>the</strong> western paleohigh and interior<br />
sea generated by <strong>the</strong> C6-P1 event (Figure 2). Such an<br />
extensive structure may be interpreted <strong>as</strong> a peripheral bulge<br />
(Figure 3) and <strong>the</strong> Peace River B<strong>as</strong>in <strong>as</strong> a back-bulge b<strong>as</strong>in<br />
(see ‘Tec<strong>to</strong>nostratigraphic Implications’). Dunn (2003)<br />
mapped Artinskian and Kungurian lithofacies that included<br />
braid delt<strong>as</strong> and what w<strong>as</strong> interpreted <strong>as</strong> a barrier island<br />
with root traces paralleling <strong>the</strong> Alberta-<strong>BC</strong> border. With <strong>the</strong><br />
interpretation of <strong>the</strong> peripheral bulge, <strong>the</strong>se units can now<br />
be interpreted <strong>as</strong> a beach on <strong>the</strong> western margin of <strong>the</strong> Peace<br />
River B<strong>as</strong>in, with an adjacent braid delta indicating sediment<br />
sources from <strong>the</strong> south and west. The remainder of <strong>the</strong><br />
marginal-marine facies in <strong>the</strong> Peace River B<strong>as</strong>in (Figure 3)<br />
includes carbonate-rich subtidal <strong>to</strong> supratidal biocl<strong>as</strong>tic<br />
sands<strong>to</strong>ne, with ‘early’vadose cement locally forming beach<br />
rock.<br />
<strong>Geoscience</strong> <strong>BC</strong> Report 2012-1 117
Figure 2. Chronostratigraphic diagram showing temporal and spatial distribution of major units in e<strong>as</strong>t-central British Columbia <strong>to</strong> west-central Alberta. The<br />
C6 event resulted in a western paleohigh that caused erosion of <strong>the</strong> underlying Moscovian succession and local deposition of Moscovian-age cl<strong>as</strong>ts within<br />
Early Permian sediments. The Beat<strong>to</strong>n-Sukunka peripheral bulge is interpreted <strong>to</strong> have formed during P2 deformation, which also potentially drove warm<br />
dolomitizing fluids in<strong>to</strong> <strong>the</strong> underlying succession. Abbreviations: Tourn, Tournaisian; Serpukh, Serpukhovian; B<strong>as</strong>hkir, B<strong>as</strong>hkirian; Moscov, Moscovian;<br />
K<strong>as</strong>imov, K<strong>as</strong>imovian; Gzhel, Gzhelian; Sakmar, Sakmarian; Artinsk, Artinskian; Kung, Kungurian; Capitan, Capitanian; Wuchia, Wuchiapingian; Chang,<br />
Changhsingian; Olenek, Olenekian. Modified from Zubin-Stathopoulos (2011). Locations of Alberta wells: 16-19-77-10W6 (55.6922N, 119.5292W; UTM<br />
Zone 11, 341025E, 6174721N); 12-14-78-1W6 (55.7614N, 118.0491W; UTM Zone 11, 434168E, 6180024N); 11-17-83-17W5 (56.1974N, 116.6534W;<br />
UTM Zone 11, 521504E, 6228001N).<br />
118 <strong>Geoscience</strong> <strong>BC</strong> Summary of Activities 2011
Figure 3. Schematic paleogeography of <strong>the</strong> western United States <strong>to</strong> nor<strong>the</strong><strong>as</strong>tern British Columbia<br />
(<strong>BC</strong>) for <strong>the</strong> early Artinskian (modified from Zubin-Stathopoulos et al., 2011). Dotted line in Beat<strong>to</strong>n<br />
High area represents former position of late Asselian interior seaway. D<strong>as</strong>hed line in nor<strong>the</strong><strong>as</strong>tern <strong>BC</strong><br />
represents sou<strong>the</strong>rnmost position of younger dextral Tintina strike-slip fault. The geotec<strong>to</strong>nic his<strong>to</strong>ry<br />
for <strong>the</strong> succession south of this position is markedly different from that <strong>to</strong> <strong>the</strong> north. The Yukon-Tanana<br />
terrane (see several papers in Colpron and Nelson [2006], including Nelson et al. [2006]) may represent<br />
<strong>the</strong> western margin of <strong>the</strong> Slide Mountain Ocean that w<strong>as</strong> later transported along strike-slip faults,<br />
including possible transfer of strike-slip motion <strong>to</strong> Permian westerly facing subduction-zone boundaries.<br />
The Lower Permian Sugar Limes<strong>to</strong>ne (Orchard and Struik, 1985) w<strong>as</strong> deposited on <strong>the</strong> e<strong>as</strong>tern<br />
margin of <strong>the</strong> Slide Mountain Ocean. The axis of <strong>the</strong> Devonian Peace River Arch and Carboniferous <strong>to</strong><br />
Tri<strong>as</strong>sic Peace River B<strong>as</strong>in is perpendicular <strong>to</strong> this position <strong>as</strong> well. Position of tec<strong>to</strong>nic elements is, in<br />
part, b<strong>as</strong>ed on Gabrielse et al. (1991), Henderson et al. (1993), Wardlaw et al. (1995) and Nelson et al.<br />
(2006). Peace River B<strong>as</strong>in lithofacies from Dunn (2003). Tec<strong>to</strong>nic nomenclature b<strong>as</strong>ed on Snyder et<br />
al. (2002). Abbreviation: CC, Carlin Canyon.<br />
<strong>Geoscience</strong> <strong>BC</strong> Report 2012-1 119
P3 Kungurian Event<br />
This is a relatively minor event in both Nevada and e<strong>as</strong>tcentral<br />
<strong>BC</strong>, and may be attributed <strong>to</strong> a relative lowstand of<br />
sea level, <strong>as</strong> is characteristic of <strong>the</strong> Kungurian globally, or<br />
<strong>to</strong> reduced rates of subsidence and filling of <strong>the</strong> b<strong>as</strong>in created<br />
by <strong>the</strong> P2 event. Artinskian and Kungurian inner-ramp<br />
facies of <strong>the</strong> Kindle Formation in e<strong>as</strong>t-central <strong>BC</strong> (Figure 3)<br />
and <strong>the</strong> Johns<strong>to</strong>n Canyon Formation in southwestern Alberta<br />
have cool-water <strong>as</strong>sociations and typically are quite<br />
phosphatic.<br />
P4 Roadian Event<br />
This is a major event that represents <strong>the</strong> formation of <strong>the</strong><br />
Phosphoria B<strong>as</strong>in, centred in nor<strong>the</strong><strong>as</strong>tern Nevada and<br />
sou<strong>the</strong>rn Idaho, and <strong>the</strong> development of an important intra-<br />
Permian unconformity in sou<strong>the</strong><strong>as</strong>tern <strong>to</strong> e<strong>as</strong>t-central <strong>BC</strong>,<br />
which is overlain by a persistent thin-shelf deposit referred<br />
<strong>to</strong> <strong>as</strong> <strong>the</strong> Ranger Canyon and Fant<strong>as</strong>que formations. The<br />
Phosphoria B<strong>as</strong>in is widespread and overlaps many Early<br />
Permian tec<strong>to</strong>nic b<strong>as</strong>ins. The Ranger Canyon Formation is<br />
also widespread (McGugan, 1965) and, in at le<strong>as</strong>t one locality<br />
(Crossing Creek in sou<strong>the</strong><strong>as</strong>tern <strong>BC</strong>), overlies <strong>the</strong><br />
Artinskian <strong>to</strong> Lower Kungurian Johns<strong>to</strong>n Canyon Formation<br />
<strong>as</strong> an angular unconformity (McGugan and Rapson,<br />
1962), with a phosphatic conglomerate at <strong>the</strong> b<strong>as</strong>e.<br />
McGugan (1965) suggested that such widespread but relatively<br />
thin deposits are more likely <strong>to</strong> be controlled by<br />
eustacy than by tec<strong>to</strong>nics. The latest Kungurian <strong>to</strong> Early<br />
Roadian represents a global sea-level rise and may indicate<br />
a time of tec<strong>to</strong>nic quiescence on <strong>the</strong> margin (see<br />
‘Tec<strong>to</strong>nostratigraphic Implications’).<br />
P5 Capitanian Event<br />
This event w<strong>as</strong> a major lowstand of sea level that resulted in<br />
subaerial exposure of most of <strong>the</strong> margin. There is<br />
biostratigraphic evidence that <strong>the</strong> Fant<strong>as</strong>que Formation at<br />
Peck Creek and Ursula Creek in nor<strong>the</strong><strong>as</strong>tern <strong>BC</strong> includes<br />
continuous deposition through <strong>the</strong> Late Permian (Figure 2)<br />
in<strong>to</strong> <strong>the</strong> Early Tri<strong>as</strong>sic (Henderson, 2011). These sites were<br />
located on <strong>the</strong> down-faulted e<strong>as</strong>tern margin of <strong>the</strong> Ishbel<br />
Trough.<br />
P6 Late Changhsingian Event<br />
This event is recognized <strong>as</strong> a combination of probable<br />
eustatic rise and tec<strong>to</strong>nic-b<strong>as</strong>in reorganization, including<br />
inversion of various structural elements, and requires fur<strong>the</strong>r<br />
mapping. It coincides in timing with <strong>the</strong> Sonoman<br />
orogeny, which is better unders<strong>to</strong>od in <strong>the</strong> western United<br />
States, where <strong>the</strong> Havallah sequence is thrust upon coeval<br />
successions on <strong>the</strong> North American cra<strong>to</strong>n (Brueckner and<br />
Snyder, 1985). The Mount Crum section (Figure 1) w<strong>as</strong><br />
high during <strong>the</strong> Early Induan (Griesbachian), suggesting<br />
that collapse of <strong>the</strong> Beat<strong>to</strong>n High north of this locality created<br />
a site for earliest Tri<strong>as</strong>sic deposition and <strong>the</strong> important<br />
shale-g<strong>as</strong> fairway of <strong>the</strong> Montney Formation north of about<br />
55.5°N. Zonneveld et al. (2010) also suggested an earliest<br />
Tri<strong>as</strong>sic sub-b<strong>as</strong>in in <strong>the</strong> Ring-Border <strong>to</strong> Kahntah River<br />
fields, at about 58°N on <strong>the</strong> <strong>BC</strong>-Alberta border.<br />
Tr1 Late Induan Event<br />
This event is also <strong>as</strong>sociated with inversion of various<br />
structural elements (Kendall, 1999; Panek, 2000) and requires<br />
fur<strong>the</strong>r mapping. The fact that turbidite successions,<br />
which may be driven by tec<strong>to</strong>nically controlled slope steepening,<br />
are diachronous (Late Induan through Olenekian)<br />
across <strong>the</strong> region (Kendall, 1999; Orchard and Zonneveld,<br />
2009; Henderson, 2011) points <strong>to</strong> <strong>the</strong> need for detailed<br />
mapping and biostratigraphic analysis.<br />
Discussion and Conclusion<br />
Tec<strong>to</strong>nostratigraphic Implications<br />
Nelson et al. (2006) and Colpron and Nelson (2011) summarized<br />
a model in which <strong>the</strong> Slide Mountain Ocean w<strong>as</strong><br />
<strong>the</strong> locus for back-arc seafloor spreading from mid-Carboniferous<br />
<strong>to</strong> Middle Permian, followed by a reversal in<br />
which <strong>the</strong> North American continent advanced upon <strong>the</strong><br />
frontal arc with <strong>the</strong> back-arc b<strong>as</strong>in closure attributed <strong>to</strong> <strong>the</strong><br />
Late Permian–Early Tri<strong>as</strong>sic Sonoman orogeny. It is possible<br />
that such ‘accordion tec<strong>to</strong>nics’had ano<strong>the</strong>r beat <strong>to</strong> it, <strong>as</strong><br />
evidence continues <strong>to</strong> emerge supporting episodic thinskinned<br />
deformation affecting <strong>the</strong> North American margin<br />
between <strong>the</strong> Antler and Sonoman orogenies. This requires<br />
an active orogenic belt <strong>to</strong> <strong>the</strong> west that affects <strong>the</strong> North<br />
American (northwestern Pangea) margin from <strong>the</strong> latitude<br />
of at le<strong>as</strong>t nor<strong>the</strong>rn Nevada <strong>to</strong> e<strong>as</strong>t-central <strong>BC</strong>. If <strong>the</strong> broad<br />
structure affected by <strong>the</strong> P2 event is a peripheral bulge, <strong>as</strong><br />
interpreted herein, <strong>the</strong>n <strong>the</strong>re must have been active uplift<br />
<strong>to</strong> <strong>the</strong> west that provided sufficient load <strong>to</strong> cause isostatic<br />
flexure of undisputed North American margin rocks in<br />
e<strong>as</strong>t-central <strong>BC</strong>. It is interesting that imbricate thrusts<br />
mapped within <strong>the</strong> Antler Formation of <strong>the</strong> Slide Mountain<br />
terrane near Wells in central <strong>BC</strong> involve rocks no younger<br />
than Early Permian (Struik and Orchard, 1985). This event<br />
may <strong>the</strong>n have been followed by renewal of back-arc<br />
spreading, with <strong>the</strong> Slide Mountain Ocean growing <strong>to</strong> a significant<br />
extent during <strong>the</strong> early Middle Permian when <strong>the</strong><br />
thin, widespread Fant<strong>as</strong>que Formation w<strong>as</strong> deposited<br />
across e<strong>as</strong>t-central <strong>BC</strong> <strong>as</strong> an overlap succession, much like<br />
<strong>the</strong> coeval Phosphoria B<strong>as</strong>in <strong>to</strong> <strong>the</strong> south. Using mean<br />
global seafloor-spreading rates of 40–70 km/m.y. (Se<strong>to</strong>n et<br />
al., 2009) for comparison only (Slide Mountain Ocean rates<br />
are unknown) would create an ocean at le<strong>as</strong>t 600–1050 km<br />
wide during <strong>the</strong> Artinskian and Kungurian, and 1200–<br />
2100 km wide if spreading also continued through <strong>the</strong> Middle<br />
Permian. A second closure of this ocean during latest<br />
Permian would <strong>the</strong>n have resulted in <strong>the</strong> obduction of Slide<br />
Mountain Ocean rocks on<strong>to</strong> <strong>the</strong> Kootenay terrane, resulting<br />
in <strong>the</strong> Sonoman orogeny.<br />
120 <strong>Geoscience</strong> <strong>BC</strong> Summary of Activities 2011
These interpretations must be reconciled with <strong>the</strong> suggestions,<br />
b<strong>as</strong>ed on faunal similarities, by Bel<strong>as</strong>ky et al. (2002)<br />
that <strong>the</strong> Stikine, Quesnel and Klamath arc terranes must<br />
have been 2000–3000 km away from <strong>the</strong>ir latitudinal<br />
equivalents on <strong>the</strong> North American cra<strong>to</strong>n during <strong>the</strong> Early<br />
Permian. The driving force for <strong>the</strong>se tec<strong>to</strong>nic events remains<br />
equivocal, but a new dimension h<strong>as</strong> been added <strong>to</strong><br />
<strong>the</strong> discussion. This new dimension is <strong>the</strong> fact that successions<br />
on undisputed North America (<strong>the</strong> Rocky Mountain<br />
Platform of Johns<strong>to</strong>n, 2008) are affected by isostatic flexure<br />
in both extensional and compressional settings at different<br />
times. This means that <strong>the</strong> Ishbel Trough w<strong>as</strong> a foreland<br />
b<strong>as</strong>in at various times during <strong>the</strong> Late Paleozoic and at le<strong>as</strong>t<br />
semi-isolated from open Panthal<strong>as</strong>sic Ocean. This would<br />
seem <strong>to</strong> negatively affect one line of evidence for a <strong>single</strong><br />
SAYBIAcollision during <strong>the</strong> Late Cretaceous, but <strong>the</strong> presence<br />
of phosphate-rich facies on <strong>the</strong> e<strong>as</strong>tern margin of an<br />
isolated, narrow Ishbel Trough remains a problem.<br />
Clearly <strong>the</strong> region from central <strong>BC</strong> <strong>to</strong> west-central Alberta<br />
is critical <strong>to</strong> resolve events <strong>as</strong>sociated with <strong>the</strong> evolution of<br />
<strong>the</strong> North American Cordillera during <strong>the</strong> Late Paleozoic<br />
and Early Mesozoic, so we initiated a restudy of <strong>the</strong><br />
Barkerville terrane, including <strong>the</strong> Sugar Limes<strong>to</strong>ne, during<br />
<strong>the</strong> summer of 2011. Fur<strong>the</strong>rmore, incre<strong>as</strong>ed resolution of<br />
Cordilleran evolution will lead <strong>to</strong> a better understanding of<br />
<strong>the</strong> events that affected reservoir quality and natural g<strong>as</strong><br />
resources in e<strong>as</strong>t-central <strong>BC</strong>.<br />
Hydrocarbon Implications<br />
The results of this study provide evidence for active tec<strong>to</strong>nics<br />
creating paleogeographic highs that confine some<br />
depositional units and result in <strong>the</strong> erosion of o<strong>the</strong>rs. Overall,<br />
<strong>the</strong> Late Paleozoic and earliest Tri<strong>as</strong>sic stratigraphy in<br />
e<strong>as</strong>t-central <strong>BC</strong> is punctuated by numerous unconformities.<br />
Two of <strong>the</strong> most important tec<strong>to</strong>nic events (C6 and P2) in<br />
<strong>the</strong> region may have significant hydrocarbon implications.<br />
The most important conventional-g<strong>as</strong> reservoirs in <strong>the</strong> region<br />
are Moscovian carbonate units, but preservation is<br />
strongly affected by <strong>the</strong> C6 event (Figure 2). The P2 event<br />
is interpreted <strong>to</strong> have formed a peripheral bulge in <strong>the</strong> region,<br />
suggesting compressive tec<strong>to</strong>nics <strong>to</strong> <strong>the</strong> west that may<br />
have also driven warm dolomitizing fluids in<strong>to</strong> <strong>the</strong> underlying<br />
sequences (Figure 2). Wamsteeker (2007) indicated<br />
that Moscovian shelf carbonate rocks were subjected <strong>to</strong><br />
three major diagenetic events: eogenetic processes, hydro<strong>the</strong>rmal<br />
dolomitization by about 150C fluids enriched in<br />
18 O relative <strong>to</strong> Pennsylvanian seawater, and calcite veins in<br />
Laramide fractures. Moscovian carbonate rocks may have<br />
dolomitized preferentially along pre-existing faults and<br />
fractures in <strong>the</strong> region, indicating that <strong>the</strong> best porosities in<br />
<strong>the</strong> area would be more predictable if paleostructures in <strong>the</strong><br />
region were better known. The warm fluids may also account<br />
for <strong>the</strong> <strong>the</strong>rmal-maturity anomaly (Ing and<br />
Henderson, 2009) in <strong>the</strong> region in which Pennsylvanian<br />
rocks have higher-than-expected CAI (Colour Alteration<br />
Index from Conodonts) values compared <strong>to</strong> values in <strong>the</strong><br />
overlying Permian (especially of Artinskian and younger).<br />
Finally, <strong>the</strong>re is likely a strong inheritance between <strong>the</strong> position<br />
of Pennsylvanian and Permian faults and <strong>the</strong> breakout<br />
of Late Cretaceous thrust faults that created <strong>the</strong> anticlinal<br />
structural traps (Dunn, 2003). Therefore, successful<br />
exploitation of <strong>the</strong>se resources must consider <strong>the</strong> overall<br />
complicated tec<strong>to</strong>nic his<strong>to</strong>ry of <strong>the</strong> region that affected<br />
fracture distribution (Dean, 2010), <strong>as</strong> well <strong>as</strong> deposition,<br />
diagenesis, preservation and final-stage trap location. Finally,<br />
if <strong>the</strong> Sonoman orogeny turns out <strong>to</strong> be a significant<br />
event <strong>to</strong> <strong>the</strong> west in this region, <strong>the</strong>n <strong>the</strong>re is a high<br />
probability that westerly derived sedimentation may also<br />
affect distribution of reservoir characteristics in <strong>the</strong><br />
Montney Formation shale-g<strong>as</strong> play, <strong>as</strong> well <strong>as</strong> younger<br />
Tri<strong>as</strong>sic units.<br />
Acknowledgments<br />
The authors thank B. Beauchamp (University of Calgary)<br />
for reviewing <strong>the</strong> paper. <strong>Geoscience</strong> <strong>BC</strong> and Talisman Energy<br />
supplied financial support that made research in this<br />
remote area and <strong>the</strong> training of highly qualified personnel<br />
possible. This project w<strong>as</strong> also financially supported by a<br />
Natural Sciences and Engineering Research Council of<br />
Canada Discovery Grant held by C.M. Henderson.<br />
References<br />
Bamber, E.W. and Macqueen, R.W. (1979): Upper Carboniferous<br />
and Permian stratigraphy of <strong>the</strong> Monkman P<strong>as</strong>s and sou<strong>the</strong>rn<br />
Pine P<strong>as</strong>s are<strong>as</strong>, nor<strong>the</strong><strong>as</strong>tern British Columbia; Geological<br />
Survey of Canada, Bulletin 301, 26 p.<br />
Barclay, J.E., Krause, F.F., Campbell, R.I. and Utting, J. (1990):<br />
Dynamic c<strong>as</strong>ting and growth faulting: Dawson Creek<br />
graben complex, Carboniferous–Permian Peace River<br />
Embayment, western Canada; Bulletin of Canadian Petroleum<br />
Geology, v. 38A, p. 115–145.<br />
Beauchamp, B. (1995): Permian his<strong>to</strong>ry of Arctic North America;<br />
in The Permian of Nor<strong>the</strong>rn Pangea, Volume 2: Sedimentary<br />
B<strong>as</strong>ins and Economic Resources, P.A. Scholle, T.M. Peryt<br />
and D.S. Ulmer-Scholle (ed.), Springer-Verlag, New York,<br />
p. 3–22.<br />
Bel<strong>as</strong>ky, P., Stevens, C.H. and Hanger, R.A. (2002): Early Permian<br />
location of western North American terranes b<strong>as</strong>ed on<br />
brachiopod, fusulinid and coral biogeography; Palaeogeography,<br />
Palaeoclima<strong>to</strong>logy, Palaeoecology, v. 179, p. 245–<br />
266.<br />
Brueckner, H.K. and Synder, W.S. (1985): Structure of <strong>the</strong><br />
Havallah sequence, Golconda allochthon, Nevada: evidence<br />
for prolonged evolution in an accretionary prism; Geological<br />
Society of American Bulletin, v. 96, p. 113–1130.<br />
Colpron, M. and Nelson, J.L. (2006): Paleozoic evolution and<br />
metallogeny of pericra<strong>to</strong>nic terranes at <strong>the</strong> ancient Pacific<br />
margin of North America; Geological Association of Canada,<br />
Special Paper 45, 528 p.<br />
Colpron, M. And Nelson, J.L. (2011): Chapter 31 – A Palaeozoic<br />
NW P<strong>as</strong>sage and Timanian, Caledonian and Uralian connections<br />
of some exotic terranes in <strong>the</strong> North American Cordil-<br />
<strong>Geoscience</strong> <strong>BC</strong> Report 2012-1 121
lera; Geological Society, London, Memoirs 2011, v. 35, p.<br />
463–484. doi:10.1144/M35.31<br />
Dean, G.J. (2010): Multi-scale fracturing related <strong>to</strong> deformation<br />
and structural inheritance within <strong>the</strong> Middle Pennsylvanian<br />
<strong>to</strong> Middle Permian Belloy Formation and related units, e<strong>as</strong>tcentral<br />
British Columbia; M.Sc. <strong>the</strong>sis, University of Calgary,<br />
Calgary, Alberta, 209 p.<br />
Dickinson, W.R. (2004): Evolution of <strong>the</strong> North American Cordillera;<br />
Annual Review of Earth and Planetary Sciences, v. 32,<br />
p. 13–45.<br />
Dickinson, W.R. (2006): Geotec<strong>to</strong>nic evolution of <strong>the</strong> Great B<strong>as</strong>in;<br />
Geosphere, v. 2, no. 7, p. 353–368.<br />
Dunn, L. (2003): Sequence biostratigraphy and depositional environmental<br />
modeling of <strong>the</strong> Pennsylvanian–Permian Belloy<br />
Formation, northwest Alberta and nor<strong>the</strong><strong>as</strong>t British Columbia;<br />
Ph.D. <strong>the</strong>sis, University of Calgary, Calgary, Alberta,<br />
212 p.<br />
Fossenier, K. (2002): Stratigraphic framework of <strong>the</strong> Pennsylvanian<br />
<strong>to</strong> Permian Belloy Formation, nor<strong>the</strong><strong>as</strong>tern British Columbia:<br />
a multidisciplinary approach; M.Sc. <strong>the</strong>sis,<br />
University of Calgary, Calgary, Alberta, 292 p.<br />
Gabrielse, H., Monger, J.W.H., Wheeler, J.O. and Yorath, C.J.<br />
(1991): Part A. Morphogeological belts, tec<strong>to</strong>nic <strong>as</strong>semblages,<br />
and terranes; in Chapter 2 of Geology of <strong>the</strong><br />
Cordilleran Orogen in Canada, H. Gabrielse and C.J. Yorath<br />
(ed.); Geological Survey of Canada, Geology of Canada,<br />
no. 4. p. 15–28.<br />
Halbertsma, H.L. (1959): Nomenclature of Upper Carboniferous<br />
and Permian strata in <strong>the</strong> subsurface of <strong>the</strong> Peace River area;<br />
Journal of Alberta Society Petroleum Geologists, v. 7, p.<br />
109–118.<br />
Henderson, C.M. (2011): Biostratigraphic correlation and shale<br />
fabric of Lower Tri<strong>as</strong>sic strata, e<strong>as</strong>t-central British Columbia<br />
(NTS 093I, O, P); in <strong>Geoscience</strong> <strong>BC</strong> Summary of Activities<br />
2010, <strong>Geoscience</strong> <strong>BC</strong>, Report 2011-1, p. 223–228, URL<br />
[November 2011].<br />
Henderson, C.M., Bamber, E.W., Richards, B.C., Higgins, A.C.<br />
and McGugan, A. (1993): Permian; in Sedimentary Cover of<br />
<strong>the</strong> North American Cra<strong>to</strong>n, D.F. S<strong>to</strong>tt and J.D. Aitken (ed.),<br />
Geological Survey of Canada, Geology of Canada, no. 6, p.<br />
271–293 (also Geological Society of America, Geology of<br />
North America, v. D-1).<br />
Henderson, C.M., Dunn, L., Fossenier, K. and Moore, D. (2002):<br />
Sequence biostratigraphy and paleogeography of <strong>the</strong> Pennsylvanian–Permian<br />
Belloy Formation and outcrop equivalents<br />
in western Canada; Canadian Society of Petroleum<br />
Geologists, Memoir 19, p. 934–947.<br />
Henderson, C.M., Richards, B.C. and Barclay, J.E. (1994): Permian<br />
strata of <strong>the</strong> Western Canada Sedimentary B<strong>as</strong>in; in Geological<br />
Atl<strong>as</strong> of <strong>the</strong> Western Canada Sedimentary B<strong>as</strong>in,<br />
G.D. Mossop and I. Shetsen (comp.), Canadian Society of<br />
Petroleum Geologists and Alberta Research Council, p.<br />
251–258.<br />
Henderson, C.M., Zubin-Stathopoulos, K., Dean, G., Spratt, D.<br />
and Chau, Y.P. (2010): Tec<strong>to</strong>nic his<strong>to</strong>ry, biostratigraphy and<br />
fracture analysis of upper Paleozoic and lowest Tri<strong>as</strong>sic<br />
strata of e<strong>as</strong>t-central British Columbia; in <strong>Geoscience</strong> <strong>BC</strong><br />
Summary of Activities 2009, <strong>Geoscience</strong> <strong>BC</strong>, Report 2010-<br />
1, p. 259–270, URL <br />
[November 2011].<br />
Hildebrand, R.S. (2009): Did west subduction cause Cretaceous–<br />
Tertiary orogeny in <strong>the</strong> North American Cordillera; Geological<br />
Society of America, Special Paper 457, 71 p.<br />
Ing, J. and Henderson, C.M. (2009): Thermal maturity within <strong>the</strong><br />
Western Canada Sedimentary B<strong>as</strong>in, west-central Alberta <strong>to</strong><br />
nor<strong>the</strong><strong>as</strong>tern British Columbia and its tec<strong>to</strong>nic implications<br />
for Pennsylvanian and Permian strata; in International Commission<br />
on Stratigraphy (ICOS) 2009 Abstracts, C.M.<br />
Henderson and C. MacLean (ed.), Permophiles (Newsletter<br />
of <strong>the</strong> Subcommission on Permian Stratigraphy), no. 53,<br />
supplement 1 (ISSN 1684-5927), p. 21–22.<br />
Johns<strong>to</strong>n, D.I., Henderson, C.M. and Schmidt, M.J. (2010): Upper<br />
Devonian <strong>to</strong> Lower Mississippian conodont biostratigraphy<br />
of uppermost Wabamun Group and Palliser Formation <strong>to</strong><br />
lowermost Banff and Lodgepole formations, sou<strong>the</strong>rn Alberta<br />
and sou<strong>the</strong><strong>as</strong>tern British Columbia, Canada: implications<br />
for correlations and sequence stratigraphy; Bulletin of<br />
Canadian Petroleum Geology, v. 58, no. 4, p. 295–341.<br />
Johns<strong>to</strong>n, S.T. (2008): The Cordilleran ribbon continent of North<br />
America; Annual Review of Earth and Planetary Science,<br />
v. 36, p. 495–530.<br />
Kendall, D.R. (1999): Sedimen<strong>to</strong>logy and stratigraphy of <strong>the</strong><br />
Lower Tri<strong>as</strong>sic Montney Formation, Peace River B<strong>as</strong>in,<br />
subsurface of north-western Alberta; M.Sc. <strong>the</strong>sis, Department<br />
of <strong>Geoscience</strong>, University of Calgary, Calgary, Alberta,<br />
386 p.<br />
MacRae, J. and McGugan, A. (1977): Permian stratigraphy and<br />
sedimen<strong>to</strong>logy, southwestern Alberta and sou<strong>the</strong><strong>as</strong>tern British<br />
Columbia; Bulletin of Canadian Petroleum Geology,<br />
v. 25, p. 752–766.<br />
McGugan, A. (1965): Occurrence and persistence of thin shelf deposits<br />
of uniform lithology; Geological Society of America<br />
Bulletin, v. 76, p. 125–130.<br />
McGugan, A. and Rapson, J.E. (1962): Permo-Carboniferous stratigraphy,<br />
Crowsnest area, Alberta and British Columbia;<br />
Journal of Alberta Society of Petroleum Geologists, v. 10, p.<br />
352–368.<br />
Nelson, J.L., Colpron, M., Piercey, S.J., Dusel-Bacon, C., Murphy,<br />
D.C. and Roots, C.F. (2006): Paleozoic tec<strong>to</strong>nic and metallogenic<br />
evolution of <strong>the</strong> pericra<strong>to</strong>nic terranes in Yukon,<br />
nor<strong>the</strong>rn British Columbia and e<strong>as</strong>tern Al<strong>as</strong>ka; in Paleozoic<br />
Evolution and Metallogeny of Pericra<strong>to</strong>nic Terranes at <strong>the</strong><br />
Ancient Pacific Margin of North America, Geological Association<br />
of Canada, Special Paper 45, p. 323–360.<br />
Orchard, M.J. and Struik, L.C. (1985): Conodonts and stratigraphy<br />
of upper Paleozoic limes<strong>to</strong>nes in Cariboo gold belt, e<strong>as</strong>tcentral<br />
British Columbia; Canadian Journal of Earth Sciences,<br />
v. 22, p. 538–552.<br />
Orchard, M.J. and Zonneveld, J.P. (2009): The Lower Tri<strong>as</strong>sic Sulphur<br />
Mountain Formation in <strong>the</strong> Wapiti Lake area:<br />
lithostratigraphy, conodont biostratigraphy, and a new<br />
biozonation for <strong>the</strong> lower Olenekian (Smithian); Canadian<br />
Journal of Earth Sciences, v. 46, p. 757–790.<br />
Panek, R. (2000): The sedimen<strong>to</strong>logy and stratigraphy of <strong>the</strong><br />
Lower Tri<strong>as</strong>sic Montney Formation in <strong>the</strong> subsurface of <strong>the</strong><br />
Peace River area, northwestern Alberta; M.Sc. <strong>the</strong>sis, University<br />
of Calgary, Calgary, Alberta, 275 p.<br />
Porter, I. (2007): Sequence biostratigraphy: Ksituan Member of<br />
<strong>the</strong> Belloy Formation in <strong>the</strong> Alberta Peace River B<strong>as</strong>in;<br />
B.Sc. <strong>the</strong>sis, University of Calgary, Calgary, Alberta, 106 p.<br />
Richards, B.C. (1989): Upper K<strong>as</strong>k<strong>as</strong>kia Sequence: Uppermost<br />
Devonian and Lower Carboniferous; in Western Canada<br />
122 <strong>Geoscience</strong> <strong>BC</strong> Summary of Activities 2011
Sedimentary B<strong>as</strong>in—A C<strong>as</strong>e His<strong>to</strong>ry, B.D. Ricketts (ed.),<br />
Canadian Society of Petroleum Geologists, Special Publication<br />
30, p. 165–201.<br />
Root, K.G. (2001): Devonian Antler fold and thrust belt and foreland<br />
b<strong>as</strong>in development in <strong>the</strong> sou<strong>the</strong>rn Canadian Cordillera:<br />
implications for <strong>the</strong> Western Canada Sedimentary<br />
B<strong>as</strong>in; Bulletin of Canadian Petroleum Geology, v. 49, p. 7–<br />
36.<br />
Se<strong>to</strong>n, M., Gaina, C., Muller, R.D. and Heine, C. (2009): Mid-Cretaceous<br />
seafloor spreading pulse: fact or fiction; Geology,<br />
v. 37, p. 687–690.<br />
Snyder,W.S.,Trexler,J.H.,Jr.,Davydov,V.I.,C<strong>as</strong>hman,P.,<br />
Schiappa, T.A. and Sweet, D. (2002): Upper Paleozoic tec<strong>to</strong>nostratigraphic<br />
framework for <strong>the</strong> western margin of<br />
North America; in Proceedings of ‘Late Paleozoic Tec<strong>to</strong>nics<br />
and Hydrocarbon Systems of Western North America—The<br />
Greater Ancestral Rocky Mountains’, American Association<br />
of Petroleum Geologists, Hedberg Conference, Vail,<br />
Colorado, AAPG Search and Discovery Article 90012, 4 p.<br />
Struik, L.C. and Orchard, M.J. (1985): Late Paleozoic conodonts<br />
from ribbon chert delineate imbricate thrusts within <strong>the</strong> Antler<br />
Formation of <strong>the</strong> Slide Mountain terrane, central British<br />
Columbia; Geology, v. 13, p. 794–798.<br />
Trexler, J.H., C<strong>as</strong>hman, P.H., Cole, J.C., Snyder, W.S., Tosdal,<br />
R.M. and Davydov, V.I. (2003): Widespread effects of middle<br />
Mississippian deformation in <strong>the</strong> Great B<strong>as</strong>in of western<br />
North America; Geological Society of America Bulletin,<br />
v. 115, p. 1278–1288.<br />
Trexler,J.H.,C<strong>as</strong>hman,P.H.,Snyder,W.S.andDavydov,V.I.<br />
(2004): Late Paleozoic tec<strong>to</strong>nism in Nevada: timing, kinematics,<br />
and tec<strong>to</strong>nic significance; Geological Society of<br />
America Bulletin, v. 116, p. 525–538.<br />
Wamsteeker, M.L. (2007): Diagenetic and geochemical characterization<br />
of <strong>the</strong> Ksituan Member of <strong>the</strong> Belloy Formation,<br />
e<strong>as</strong>t-central British Columbia foothills; B.Sc. <strong>the</strong>sis, University<br />
of Calgary, Calgary, Alberta, 78 p.<br />
Wardlaw, B.R., Snyder, W.S., Spinosa, C. and Gallegos, D.M.<br />
(1995): Permian of <strong>the</strong> western United States; in The Permian<br />
of Nor<strong>the</strong>rn Pangea, Volume 2: Sedimentary B<strong>as</strong>ins and<br />
Economic Resources, P.A. Scholle, T.M. Peryt and D.S.<br />
Ulmer-Scholle (ed.), Springer-Verlag, New York, p. 23–40.<br />
Zonneveld, J.P., MacNaugh<strong>to</strong>n, R.B., Utting, J., Beatty, T.W.,<br />
Pember<strong>to</strong>n, S.G. and Henderson, C.M. (2010): Sedimen<strong>to</strong>logy<br />
and ichnology of <strong>the</strong> Lower Tri<strong>as</strong>sic Montney Formation<br />
in <strong>the</strong> Pedigree–Ring/Border–Kahntah River area,<br />
northwestern Alberta and nor<strong>the</strong><strong>as</strong>tern British Columbia;<br />
Bulletin of Canadian Petroleum Geology, v. 58, no. 2, p.<br />
115–140.<br />
Zubin-Stathopoulos, K.D. (2011): Tec<strong>to</strong>nic evolution,<br />
paleogeography and paleoclimate of Pennsylvanian–Permian<br />
strata in e<strong>as</strong>t-central British Columbia: implications<br />
from conodont biostratigraphy and carbonate sedimen<strong>to</strong>logy;<br />
M.Sc. <strong>the</strong>sis, Department of <strong>Geoscience</strong>, University<br />
of Calgary, Calgary, Alberta, 164 p.<br />
Zubin-Stathopoulos, K.D., Dean, G.J., Beauchamp, B., Spratt,<br />
D.A. and Henderson, C.M. (2011): Tec<strong>to</strong>nic evolution and<br />
paleogeography of Pennsylvanian–Permian strata in e<strong>as</strong>tcentral<br />
British Columbia (NTS 093I, O, P): implications<br />
from stratigraphy, fracture analysis and sedimen<strong>to</strong>logy;<br />
<strong>Geoscience</strong> <strong>BC</strong> Summary of Activities 2010, <strong>Geoscience</strong><br />
<strong>BC</strong> Report 2011-1, p. 209–222.<br />
<strong>Geoscience</strong> <strong>BC</strong> Report 2012-1 123
124 <strong>Geoscience</strong> <strong>BC</strong> Summary of Activities 2011
Rock Physical-Property Me<strong>as</strong>urements for <strong>the</strong> Nechako B<strong>as</strong>in Oil and G<strong>as</strong> Region,<br />
Central British Columbia (Parts of NTS 093B, C, E, F, G, K, L)<br />
A. Kushnir, Centre for Experimental Studies of <strong>the</strong> Lithosphere, Department of Earth and Ocean Sciences,<br />
University of British Columbia, Vancouver, <strong>BC</strong> V6T 1Z4<br />
G. Andrews, Earth Research Institute, University of California Santa Barbara, Santa Barbara, CA 93106<br />
J.K. Russell, Volcanology and Petrology Labora<strong>to</strong>ry, Department of Earth and Ocean Sciences, University of<br />
British Columbia, Vancouver, <strong>BC</strong> V6T 1Z4<br />
R.J. Enkin, Natural Resources Canada, Geological Survey of Canada–Pacific, 9860 West Saanich Road, Sidney,<br />
<strong>BC</strong> V8L 4B2<br />
L.A. Kennedy, Centre for Experimental Studies of <strong>the</strong> Lithosphere, Department of Earth and Ocean Sciences,<br />
University of British Columbia, Vancouver, <strong>BC</strong> V6T 1Z4<br />
M.J. Heap, Labora<strong>to</strong>ire de géophysique expérimentale, Institut de physique du globe de Str<strong>as</strong>bourg (UMR 7516<br />
CNRS, Université de Str<strong>as</strong>bourg/EOST), 5 rue René Descartes, 67084 Str<strong>as</strong>bourg CEDEX, France<br />
S. Quane, Quest University Canada, 3200 University Boulevard, Squamish, <strong>BC</strong> V8B O8N<br />
Kushnir, A., Andrews, G., Russell, J.K., Enkin, R.J., Kennedy, L.A., Heap, M.J. and Quane, S. (2012): Rock physical-property me<strong>as</strong>urements<br />
for <strong>the</strong> Nechako B<strong>as</strong>in oil and g<strong>as</strong> region, central British Columbia (parts of NTS 093B, C, E, F, G, K, L); in <strong>Geoscience</strong> <strong>BC</strong> Summary<br />
of Activities 2011, <strong>Geoscience</strong> <strong>BC</strong>, Report 2012-1, p. 125–150.<br />
Abstract<br />
Keywords: Nechako B<strong>as</strong>in, rock properties, physical properties,<br />
geophysical properties<br />
This publication is also available, free of charge, <strong>as</strong> colour digital<br />
<strong>file</strong>s in Adobe Acrobat ® <strong>PDF</strong> format from <strong>the</strong> <strong>Geoscience</strong> <strong>BC</strong><br />
website: http://www.geosciencebc.com/s/DataRele<strong>as</strong>es.<strong>as</strong>p.<br />
The Mesozoic hydrocarbon-prospective Nechako (sedimentary)<br />
B<strong>as</strong>in in central British Columbia is buried by a<br />
variably thick and variably extensive, lithologically diverse<br />
<strong>as</strong>semblage of Cenozoic volcanic and sedimentary<br />
rocks. To <strong>as</strong>sist in <strong>the</strong> interpretation of geophysical surveys,<br />
physical and geophysical properties (density, porosity,<br />
magnetic susceptibility and remanence, electrical resistivity<br />
and chargeability, and seismic velocity) have been<br />
me<strong>as</strong>ured on a sample suite covering <strong>the</strong> eleven stratigraphic<br />
units within, and stratigraphically above, <strong>the</strong><br />
Nechako B<strong>as</strong>in. The eleven b<strong>as</strong>ic stratigraphic units are<br />
grouped in<strong>to</strong> six major lithostratigraphic packages (combined<br />
on <strong>the</strong> b<strong>as</strong>is of age, geography and lithology) for <strong>the</strong><br />
purposes of comparing physical and geophysical properties.<br />
Each lithostratigraphic package is distinguishable on<br />
<strong>the</strong> b<strong>as</strong>is of one or more physical or geophysical properties;<br />
for example, potential Cretaceous reservoir rocks (e.g.,<br />
Jack<strong>as</strong>s Mountain Group) have relatively high porosities<br />
(=17%), low resistivities and low seismic velocities. Generally,<br />
volcanic rocks are e<strong>as</strong>ily distinguished from sedimentary<br />
rocks, and <strong>the</strong> crystalline b<strong>as</strong>ement is<br />
distinguished from both. This dat<strong>as</strong>et is available for incorporation<br />
in<strong>to</strong> ongoing and future geophysical surveys of <strong>the</strong><br />
Nechako B<strong>as</strong>in, and can be used retrospectively <strong>to</strong> <strong>as</strong>sess<br />
previous interpretations. Such integrated dat<strong>as</strong>ets are necessary<br />
<strong>to</strong> provide a comprehensive geological and geophysical<br />
interpretation.<br />
Introduction<br />
The Mesozoic Nechako B<strong>as</strong>in in south-central British Columbia<br />
(<strong>BC</strong>; Figure 1) h<strong>as</strong> underexplored potential for oil<br />
and g<strong>as</strong> deposits hosted in Cretaceous strata (Hannigan et<br />
al., 1994; Hayes, 2002). First-order geological interpretations<br />
of <strong>the</strong> subsurface are hampered by <strong>the</strong> b<strong>as</strong>in’s structural<br />
complexity, which results from extensive polyph<strong>as</strong>e<br />
deformation and partial burial beneath significant extents<br />
and variable thicknesses of Cenozoic volcanic, volcanicl<strong>as</strong>tic<br />
and sedimentary rocks (Riddell, 2006, 2011).<br />
The lack of continuity in outcrop and stratigraphy h<strong>as</strong> hindered<br />
reconstructions of <strong>the</strong> b<strong>as</strong>in and efforts <strong>to</strong> identify potential<br />
hydrocarbon traps. In an effort <strong>to</strong> address this, geophysical<br />
surveys were conducted in <strong>the</strong> mid-2000s across<br />
portions of <strong>the</strong> Interior Plateau (e.g., Kim, 2010; Hayward<br />
and Calvert, 2011; Idowu et al., 2011; Spratt and Craven,<br />
2011). Interpretation of <strong>the</strong>se new data, coupled with a re<strong>as</strong>sessment<br />
of existing geophysical dat<strong>as</strong>ets (e.g., Hayward<br />
and Calvert, 2009), is made difficult by a lack of rock physical-property<br />
data for <strong>the</strong> corresponding rocks within <strong>the</strong> Nechako<br />
B<strong>as</strong>in and a fragmentary understanding of even <strong>the</strong><br />
near-surface geology (e.g., Dohaney et al., 2010; Andrews<br />
et al., 2011). Establishing <strong>the</strong> extent of buried Cenozoic<br />
<strong>Geoscience</strong> <strong>BC</strong> Report 2012-1 125
Figure 1. Geology of <strong>the</strong> Nechako B<strong>as</strong>in, showing <strong>the</strong> 81 sample sites and <strong>the</strong> 167 samples collected. Geology adapted from Riddell (2006)<br />
and prepared by F. Ma of <strong>Geoscience</strong> <strong>BC</strong>.<br />
126 <strong>Geoscience</strong> <strong>BC</strong> Summary of Activities 2011
volcanic rocks and distinguishing <strong>the</strong>m from buried and deformed<br />
Mesozoic successions are particularly challenging.<br />
<strong>Geoscience</strong> <strong>BC</strong> funded an investigation of <strong>the</strong> rock physical<br />
properties of <strong>the</strong> Nechako B<strong>as</strong>in and overlying units.<br />
We <strong>as</strong>sembled a representative suite of 167 samples from<br />
existing collections and from a focused field campaign <strong>to</strong><br />
extend <strong>the</strong> sample diversity. Samples were prepared at <strong>the</strong><br />
University of British Columbia and subjected <strong>to</strong> a comprehensive<br />
suite of experiments <strong>to</strong> me<strong>as</strong>ure bulk density, connected<br />
porosity, magnetic susceptibility, magnetic remanence,<br />
Koenigsberger ratio, electrical resistivity, chargeability<br />
and ultr<strong>as</strong>onic velocity. All me<strong>as</strong>urements were performed<br />
at 1) <strong>the</strong> Centre for Experimental Study of <strong>the</strong><br />
Lithosphere (CESL) at <strong>the</strong> University of British Columbia<br />
(U<strong>BC</strong>); 2) <strong>the</strong> Paleomagnetism and Petrophysics Labora<strong>to</strong>ry<br />
at Geological Survey of Canada–Pacific, Sidney<br />
(GSC-P); and 3) <strong>the</strong> Labora<strong>to</strong>ire de Géophysique<br />
Expérimentale at l’Université de Str<strong>as</strong>bourg, France<br />
(EOST). Experimental results are presented <strong>as</strong> a comprehensive<br />
series of tables and crossplots that emph<strong>as</strong>ize parameters<br />
that can be used <strong>to</strong> distinguish between <strong>the</strong> various<br />
units.<br />
This report summarizes <strong>the</strong> results of <strong>the</strong> first comprehensive,<br />
multiparameter rock-property study of <strong>the</strong> Nechako<br />
B<strong>as</strong>in and overlying units. The dat<strong>as</strong>et discussed herein is<br />
available in Andrews et al. (2011). It is also expected that<br />
<strong>the</strong> <strong>as</strong>sociated electronic datab<strong>as</strong>e will, in turn, be integrated<br />
in<strong>to</strong> o<strong>the</strong>r provincial and national rock-property datab<strong>as</strong>es<br />
(e.g., Salisbury and Iuliucci, 2001; Mira <strong>Geoscience</strong>,<br />
2008; Parsons et al., 2009). These data are<br />
intended for use in ongoing and future geophysical experiments,<br />
and will enable better differentiation between units;<br />
<strong>Geoscience</strong> <strong>BC</strong> Report 2012-1 127
this will, in turn, allow better understanding of <strong>the</strong> structure,<br />
tec<strong>to</strong>nic evolution and hydrocarbon potential of <strong>the</strong><br />
Nechako B<strong>as</strong>in.<br />
Geology of <strong>the</strong> Nechako B<strong>as</strong>in<br />
The Nechako B<strong>as</strong>in is an area of approximately 75 000 km 2<br />
bounded <strong>to</strong> <strong>the</strong> south and west by <strong>the</strong> Co<strong>as</strong>t Mountains, <strong>to</strong><br />
<strong>the</strong> north by <strong>the</strong> Skeena Arch, and <strong>to</strong> <strong>the</strong> e<strong>as</strong>t by <strong>the</strong> Bonaparte<br />
Plateau and Cariboo Mountains (Figure 1; Hayes,<br />
2002; Riddell, 2006). It underlies much of <strong>the</strong> present-day<br />
Fr<strong>as</strong>er River B<strong>as</strong>in, including important tributaries such <strong>as</strong><br />
<strong>the</strong> Chilcotin, Chilko and T<strong>as</strong>eko rivers. The Nechako B<strong>as</strong>in<br />
is interpreted <strong>to</strong> have developed <strong>as</strong> a foreland b<strong>as</strong>in during<br />
<strong>the</strong> Late Jur<strong>as</strong>sic <strong>to</strong> mid-Cretaceous on b<strong>as</strong>ement comprising<br />
integral parts of <strong>the</strong> Intermontane Superterrane,<br />
namely <strong>the</strong> Cache Creek and Stikine terranes. Stikine terrane<br />
b<strong>as</strong>ement is present at <strong>the</strong> surface in <strong>the</strong> west and north<br />
of <strong>the</strong> b<strong>as</strong>in (Riddell, 2006), where it is represented by <strong>the</strong><br />
Early–Middle Jur<strong>as</strong>sic Hazel<strong>to</strong>n volcanic arc (Hazel<strong>to</strong>n<br />
Group). Oceanic rocks of <strong>the</strong> Cache Creek terrane rocks<br />
outcrop in <strong>the</strong> e<strong>as</strong>t and nor<strong>the</strong><strong>as</strong>t. There is no inferred<br />
hydrocarbon resource in <strong>the</strong> b<strong>as</strong>ement.<br />
The Nechako B<strong>as</strong>in w<strong>as</strong> filled with cl<strong>as</strong>tic sedimentary<br />
rocks from <strong>the</strong> Middle Jur<strong>as</strong>sic (Ladner Group) <strong>to</strong> <strong>the</strong> Early<br />
Cretaceous (Relay Mountain Group). Cl<strong>as</strong>tic marine sedimentation<br />
continued through <strong>the</strong> Cretaceous (Hauterivian–<br />
Cenomanian Jack<strong>as</strong>s Mountain Group, Albian Taylor<br />
Creek and Skeena groups, and Albian–Cenomanian<br />
Silverquick Formation) and w<strong>as</strong> interspersed with deposition<br />
of volcanic and volcanicl<strong>as</strong>tic rocks of <strong>the</strong> Albian–<br />
San<strong>to</strong>nian Spences Bridge and K<strong>as</strong>alka groups, and <strong>the</strong><br />
Turonian–Campanian Powell Creek Formation and informally<br />
named T<strong>as</strong>eko River strata. Numerous Mesozoic and<br />
Cenozoic plu<strong>to</strong>ns intruded <strong>the</strong> b<strong>as</strong>in. All appreciable hydrocarbon<br />
potential is within <strong>the</strong> Cretaceous succession.<br />
Figure 2 provides a generalized and schematic stratigraphic<br />
summary of <strong>the</strong> b<strong>as</strong>in.<br />
The Nechako B<strong>as</strong>in is buried beneath 0–4000 m of Eocene,<br />
Miocene and Pliocene volcanic, volcanicl<strong>as</strong>tic and sedimentary<br />
rocks belonging mainly <strong>to</strong> <strong>the</strong> Endako, Ootsa Lake<br />
and Chilcotin groups (Riddell, 2006; Andrews and Russell,<br />
2007, 2008; Andrews et al., 2011; Bordet and Hart, 2011).<br />
A diverse range of mafic and felsic volcanic and volcanicl<strong>as</strong>tic<br />
rocks occur, including <strong>as</strong>h-flow tuff that is indicative<br />
of caldera-forming eruptions. The Pliocene–Holocene<br />
Anahim volcanic belt trends e<strong>as</strong>t across <strong>the</strong> centre of <strong>the</strong> ba-<br />
Figure 2. Schematic representation of stratigraphic relationships between map<br />
units sampled within <strong>the</strong> Nechako B<strong>as</strong>in. Number of samples collected from each<br />
stratigraphic unit is given on left.<br />
128 <strong>Geoscience</strong> <strong>BC</strong> Summary of Activities 2011
sin. The b<strong>as</strong>in and overlying Cenozoic rocks are buried beneath<br />
a 1–100 m thick veneer of glacial sediments, including<br />
till and glaciolacustrine and glaciofluvial successions<br />
(e.g., Andrews et al., 2011). There is no inferred hydrocarbon<br />
resource in <strong>the</strong> Cenozoic succession.<br />
The structural geology of <strong>the</strong> Nechako B<strong>as</strong>in is poorly unders<strong>to</strong>od,<br />
so <strong>the</strong> architecture of potential hydrocarbon traps<br />
h<strong>as</strong> not been established. Preliminary geological and geophysical<br />
surveys have identified sub-b<strong>as</strong>ins (e.g., Hayward<br />
and Calvert, 2009), high- and low-angle faults, folds and<br />
unconformities (e.g., Mihalynuk et al., 2009); however, a<br />
lack of stratigraphic control due <strong>to</strong> <strong>the</strong> paucity of boreholes<br />
in <strong>the</strong> b<strong>as</strong>in makes lateral correlation and section-balancing<br />
impossible. A dedicated rock-property suite from <strong>the</strong><br />
known Nechako B<strong>as</strong>in stratigraphy will allow for improved<br />
geophysical imaging of <strong>the</strong> subsurface geology.<br />
Sample Suite<br />
During <strong>the</strong> 1980s, seismic-reflection and gravity surveys<br />
were completed in <strong>the</strong> Nechako B<strong>as</strong>in and additional exploration<br />
wells were drilled; new vibroseis seismic-reflection<br />
and magne<strong>to</strong>telluric dat<strong>as</strong>ets were collected in 2008<br />
(Calvert et al., 2009; Craven and Spratt, 2011). There is a<br />
pressing need for better constraints on a range of physical<br />
and geophysical rock properties from <strong>the</strong> diverse suite of<br />
volcanic and sedimentary rocks in <strong>the</strong> b<strong>as</strong>in. For example,<br />
magne<strong>to</strong>telluric studies have highlighted <strong>the</strong> need for good<br />
resolution in electrical-resistivity data <strong>to</strong> differentiate <strong>the</strong><br />
widespread Cretaceous and Eocene sequences (e.g., Craven<br />
and Spratt, 2011). Similarly, seismic inversions (e.g.,<br />
Hayward and Calvert, 2009) suggest nonintuitive variations<br />
in compressional-wave velocities for individual formations,<br />
specifically overlap in inferred seismic velocities<br />
between <strong>the</strong> Eocene and Jur<strong>as</strong>sic–Cretaceous successions.<br />
Quantitative, experimental physical-properties data from<br />
this sample suite will aid <strong>the</strong> interpretations of <strong>the</strong>se surveys<br />
and help <strong>to</strong> distinguish <strong>the</strong> prospective, non-hydrocarbon<br />
Eocene b<strong>as</strong>inal sequence from <strong>the</strong> Jur<strong>as</strong>sic–Cretaceous<br />
b<strong>as</strong>inal sequence.<br />
The U<strong>BC</strong> experimental program identified and sampled<br />
stratigraphic groups that are most important <strong>to</strong> <strong>the</strong> interpretation<br />
of seismic dat<strong>as</strong>ets and <strong>the</strong> delineation of exploration<br />
targets within <strong>the</strong> Nechako B<strong>as</strong>in (Figure 2, Table 1).<br />
The Chilcotin Group (CB, Table 1) comprises Mioceneage<br />
b<strong>as</strong>altic lav<strong>as</strong>. The Chilcotin is areally extensive and<br />
comprises thin (1000 m) and, in part, cover <strong>the</strong> Jur<strong>as</strong>sic<br />
and Cretaceous rocks that form <strong>the</strong> Nechako B<strong>as</strong>in.<br />
These stratigraphic units blanket, obscure and complicate<br />
<strong>the</strong> interpretation of structure and stratigraphy of <strong>the</strong> Jur<strong>as</strong>sic<br />
source rocks and Cretaceous reservoir rocks. Specific<br />
lithostratigraphic packages studied include <strong>the</strong> Endako and<br />
Ootsa Lake groups (e.g., Bordet and Hart, 2011). The<br />
Endako Group comprises coherent, mafic lav<strong>as</strong>, which<br />
need <strong>to</strong> be distinguished from Chilcotin Group rocks. The<br />
Ootsa Lake Group includes both volcanicl<strong>as</strong>tic and coherent<br />
facies. The volcanicl<strong>as</strong>tic succession comprises a series<br />
Table 1. Description of sample suite in terms of stratigraphic group and lithological type.<br />
Group name<br />
No. of<br />
samples (N)<br />
Lithological types<br />
Stratigraphic<br />
package<br />
Chilcotin 57 Vesicular b<strong>as</strong>altic lava; b<strong>as</strong>altic breccia CB<br />
Endako 11 Vesicular b<strong>as</strong>altic lava; amygdaloidal b<strong>as</strong>alt EVS<br />
lava; b<strong>as</strong>alt breccia; andesite; gabbro<br />
Ootsa Lake (coherent) 11 Intermediate and felsic lava; rhyolitic welded EVS<br />
tuff; b<strong>as</strong>altic lava; microgranite<br />
Ootsa Lake (noncoherent) 9 Sands<strong>to</strong>ne; conglomerate; volcanic breccia EVS<br />
K<strong>as</strong>alka / Powell Creek / T<strong>as</strong>eko 8 Andesite; lapilli tuff; breccia; conglomerate KVS<br />
River<br />
Jack<strong>as</strong>s Mountain 17 Arkose conglomerate; black shale; dacite<br />
KVS<br />
intrusions; sands<strong>to</strong>ne<br />
Taylor Creek and Skeena 10 Sands<strong>to</strong>ne; chert-pebble conglomerate;<br />
KVS<br />
silts<strong>to</strong>ne<br />
Spences Bridge 10 Dacite lava; conglomerate; sands<strong>to</strong>ne; andesitic KVS<br />
tuff<br />
Relay Mountain 7 Sands<strong>to</strong>ne; conglomerate JS<br />
Ladner 11 Calcareous shale; shale; sands<strong>to</strong>ne JS<br />
Hazel<strong>to</strong>n 10 Felsic lava; volcanic breccia; muds<strong>to</strong>ne;<br />
JVS<br />
sands<strong>to</strong>ne; granite; conglomerate; shale<br />
Mesozoic Plu<strong>to</strong>nic 6 Granodiorite, diorite, orthogneiss MB P<br />
<strong>Geoscience</strong> <strong>BC</strong> Report 2012-1 129
of felsic volcanicl<strong>as</strong>tic rocks and <strong>as</strong>sociated bedded sedimentary<br />
rocks, and are difficult <strong>to</strong> discriminate geophysically<br />
from older Cretaceous volcanicl<strong>as</strong>tic and sedimentary<br />
successions. Coherent facies are defined by<br />
intermediate <strong>to</strong> felsic lav<strong>as</strong> and lava domes, which need <strong>to</strong><br />
be discriminated from Endako Group lav<strong>as</strong>.<br />
The Cretaceous volcanicl<strong>as</strong>tic and sedimentary rocks<br />
(KVS, Table 1) are <strong>the</strong> potential hydrocarbon reservoir<br />
rocks within <strong>the</strong> Nechako B<strong>as</strong>in. They are strongly bedded,<br />
weakly deformed and of exceptionally variable thickness.<br />
The lateral continuity of stratigraphy h<strong>as</strong> not yet been fully<br />
resolved (Ferri and Riddell, 2006), so it w<strong>as</strong> necessary <strong>to</strong><br />
sample several units in multiple locations. Despite this procedure,<br />
we acknowledge that <strong>the</strong>re may be facies variations<br />
of <strong>the</strong>se units that remain unsampled. We have characterized<br />
<strong>the</strong> geophysical properties of <strong>the</strong> following lithostratigraphic<br />
packages within this broad time grouping:<br />
<br />
<br />
<br />
<br />
Jack<strong>as</strong>s Mountain Group: coarse-grained cl<strong>as</strong>tic sedimentary<br />
rocks inferred <strong>to</strong> be <strong>the</strong> most likely surface correlative<br />
of <strong>the</strong> subsurface Skeena <strong>as</strong>semblage, which<br />
h<strong>as</strong> been identified <strong>as</strong> <strong>the</strong> most significant potential reservoir<br />
in <strong>the</strong> Nechako B<strong>as</strong>in (MacLaurin et al., 2011);<br />
best exposed and studied along <strong>the</strong> sou<strong>the</strong>rn margin of<br />
<strong>the</strong> Nechako B<strong>as</strong>in near T<strong>as</strong>eko Lake<br />
Taylor Creek Group and Skeena Group: cl<strong>as</strong>tic sedimentary<br />
rocks and minor volcanic rocks exposed along,<br />
and encountered in <strong>the</strong> subsurface of, <strong>the</strong> Nazko River<br />
area<br />
Spences Bridge Group: intermediate lav<strong>as</strong> and tuffs,<br />
and minor sedimentary rocks exposed in <strong>the</strong> sou<strong>the</strong>rn<br />
Nechako B<strong>as</strong>in<br />
K<strong>as</strong>alka Group, Powell Creek Group and ‘T<strong>as</strong>eko River<br />
strata’: intermediate lav<strong>as</strong> and tuffs, and <strong>as</strong>sociated<br />
cl<strong>as</strong>tic sedimentary rocks (including conglomerate and<br />
sands<strong>to</strong>ne in <strong>the</strong> ‘T<strong>as</strong>eko River strata’) found in many<br />
are<strong>as</strong> throughout <strong>the</strong> b<strong>as</strong>in; likely a very extensive<br />
sequence<br />
The Middle–Late Jur<strong>as</strong>sic sedimentary rocks (JS, Table<br />
1) are <strong>the</strong> most probable source rocks for hydrocarbon<br />
reserves hosted by <strong>the</strong> Nechako B<strong>as</strong>in. This lithostratigraphic<br />
package is expected <strong>to</strong> form <strong>the</strong> lowermost parts of<br />
<strong>the</strong> b<strong>as</strong>inal sequence. Our sampling includes 1) <strong>the</strong> Ladner<br />
Group, comprising fine- <strong>to</strong> coarse-grained calcareous<br />
cl<strong>as</strong>tic rocks and carbonates exposed around Chilko Lake<br />
in <strong>the</strong> sou<strong>the</strong>rn part of <strong>the</strong> b<strong>as</strong>in; and 2) <strong>the</strong> Relay Mountain<br />
Group, best exposed in <strong>the</strong> Nemaiah Valley and Chilko<br />
Lake are<strong>as</strong> in <strong>the</strong> sou<strong>the</strong>rn part of <strong>the</strong> b<strong>as</strong>in and comprising<br />
fine- <strong>to</strong> coarse-grained cl<strong>as</strong>tic and carbonaceous rocks that<br />
underlie <strong>the</strong> Jack<strong>as</strong>s Mountain Group.<br />
The Lower–Middle Jur<strong>as</strong>sic volcanic and sedimentary<br />
rocks (JVS, Table 1) are a package of intermediate <strong>to</strong> felsic<br />
lav<strong>as</strong> and tuffs, and minor cl<strong>as</strong>tic and carbonate sedimentary<br />
rocks (e.g., Puntzi Lake and west of Nechako).<br />
The l<strong>as</strong>t package of samples is <strong>the</strong> Mesozoic b<strong>as</strong>ement<br />
rocks (MB p , Table 1). The Nechako B<strong>as</strong>in is underlain by<br />
Permian, Tri<strong>as</strong>sic and Jur<strong>as</strong>sic rocks of <strong>the</strong> Cache Creek<br />
and Stikine terranes, and intrusions of Jur<strong>as</strong>sic–Eocene<br />
age. These rocks tend <strong>to</strong> be more homogeneous in character<br />
and more e<strong>as</strong>ily differentiated from <strong>the</strong> overlying Cretaceous<br />
and Eocene stratigraphy. The more abundant of <strong>the</strong>se<br />
stratigraphic units include 1) Jur<strong>as</strong>sic–Cretaceous intrusive<br />
rocks (e.g., T<strong>as</strong>eko River); and 2) <strong>the</strong> mid-Tri<strong>as</strong>sic Cache<br />
Creek Group, comprising limes<strong>to</strong>ne, chert, cl<strong>as</strong>tic sediments,<br />
metamorphic rocks and b<strong>as</strong>alt (e.g., Blackwater<br />
River, Hanceville).<br />
Methodology<br />
Alarge suite of rock samples w<strong>as</strong> collected from formations<br />
representing <strong>the</strong> key Mesozoic and Tertiary rock types/<br />
stratigraphic units within <strong>the</strong> Nechako B<strong>as</strong>in. From this<br />
collection, 167 samples were chosen for experimental work<br />
<strong>to</strong> be performed at CESL (U<strong>BC</strong>), GSC-P and EOST. The<br />
Nechako sample suite comprises rocks of various types,<br />
sampled from 12 distinct stratigraphic units distributed<br />
across <strong>the</strong> Nechako B<strong>as</strong>in. Each of <strong>the</strong> 167 samples w<strong>as</strong><br />
drilled <strong>to</strong> obtain a cylindrical rock core me<strong>as</strong>uring 25 mm in<br />
diameter by ~50 mm in length. The ends of each core were<br />
ground and polished at right angles <strong>to</strong> <strong>the</strong> cylinder side <strong>to</strong><br />
create a smooth (~0.02 mm precision) end surface. The polished<br />
ends are critical for <strong>the</strong> experimental me<strong>as</strong>urement of<br />
seismic velocity because <strong>the</strong>y provide perfect sample geometry<br />
and ensure that <strong>the</strong>re is good contact between <strong>the</strong><br />
end caps of <strong>the</strong> seismic-velocity transducer and <strong>the</strong> sample.<br />
All sample preparation (e.g., cleaning, trimming, coring,<br />
drying) w<strong>as</strong> carried out at CESL, with some modification at<br />
EOST. Different sets of geophysical properties were me<strong>as</strong>ured<br />
on <strong>the</strong> same sample cores by JKR’s team at CESL and<br />
EOST, and by RJE’s team at GSC-P. The following properties<br />
were me<strong>as</strong>ured for each sample core: bulk density<br />
(EOST), porosity (EOST), magnetic susceptibility (CESL<br />
and GSC-P), remanent magnetization (GSC-P), electrical<br />
resistivity (GSC-P), induced-polarization chargeability<br />
(GSC-P), and seismic-wave velocities (EOST and CESL).<br />
These data are given in Tables 2 and 3.<br />
Density and Porosity<br />
Dry bulk density ( d ), wet bulk density ( w ) and framework<br />
density ( f ) were me<strong>as</strong>ured for all samples. Bulk density is<br />
<strong>the</strong> density of <strong>the</strong> <strong>entire</strong> sample (i.e., rock plus pore space).<br />
The pore space includes connected and isolated pores. Bulk<br />
densities are calculated from <strong>the</strong> geometry and m<strong>as</strong>s (dry or<br />
wet) of <strong>the</strong> sample core. The framework density is <strong>the</strong> den-<br />
130 <strong>Geoscience</strong> <strong>BC</strong> Summary of Activities 2011
sity of <strong>the</strong> rock itself (i.e., excluding pore space) and is me<strong>as</strong>ured<br />
using <strong>the</strong> hydrostatic weighing method, <strong>as</strong> derived<br />
from Archimedes’ Buoyancy Law. Using this method, <strong>the</strong><br />
framework density actually me<strong>as</strong>ures <strong>the</strong> density of <strong>the</strong><br />
rock and its isolated porosity, if <strong>the</strong>re is any present. In <strong>the</strong><br />
Nechako B<strong>as</strong>in sample suite, isolated porosity is <strong>as</strong>sumed<br />
<strong>to</strong> be negligible.<br />
All sample cores were dried at 40°C under a vacuum for<br />
24 hours. After <strong>the</strong> dry m<strong>as</strong>s (m d ) of each core w<strong>as</strong> me<strong>as</strong>ured,<br />
all samples were vacuum saturated with agitated,<br />
deionized, distilled water for a minimum of 15 hours <strong>to</strong> allow<br />
<strong>the</strong> water <strong>to</strong> fill all connected pore space within <strong>the</strong><br />
sample. The m<strong>as</strong>s of <strong>the</strong> water-saturated sample w<strong>as</strong> <strong>the</strong>n<br />
weighedinair(m w ) and while it w<strong>as</strong> fully submerged in water<br />
(m b ). Wet bulk density ( w ) w<strong>as</strong> calculated for each water-saturated<br />
sample <strong>to</strong> estimate <strong>the</strong> density of <strong>the</strong> rock plus<br />
its water-saturated pore space and any residual isolated<br />
pore space. These values are required for determination of<br />
wet seismic velocity.<br />
The density of <strong>the</strong> rock framework (plus any remaining isolated<br />
pores) w<strong>as</strong> <strong>the</strong>n computed using <strong>the</strong> relationship<br />
, (1)<br />
where ( H2O ) is <strong>the</strong> density of <strong>the</strong> water under ambient lab<br />
conditions. Values of d and f are sufficient <strong>to</strong> estimate porosity<br />
(%) using<br />
. (2)<br />
Magnetic Susceptibility<br />
Magnetic susceptibility (k) is primarily a result of <strong>the</strong> presence<br />
of magnetic minerals in rocks, magnetite being <strong>the</strong><br />
most ubiqui<strong>to</strong>us of <strong>the</strong>se minerals (Telford et al., 1976).<br />
There is substantial variability in k within and between rock<br />
types (Telford et al., 1976). For instance, igneous rocks<br />
have <strong>the</strong> highest average k values (0–200 10 3 SI), where<strong>as</strong><br />
metamorphic rocks range between 0 and 70 10 3 SI, and sedimentary<br />
rocks between 0 and 20 10 3 SI (Telford et al., 1976).<br />
Magnetic susceptibility w<strong>as</strong> me<strong>as</strong>ured on hand samples in<br />
<strong>the</strong> lab using a GF Instruments model SM-20 pocket magnetic-susceptibility<br />
meter, with a sensitivity of 10 –6 SI <strong>volume</strong><br />
units. The me<strong>as</strong>urement coil h<strong>as</strong> a 5 cm diameter, and<br />
~90% of <strong>the</strong> me<strong>as</strong>ured response comes from <strong>the</strong> <strong>to</strong>p 2 cm of<br />
<strong>the</strong> sample. We investigated <strong>the</strong> effect of small sample size<br />
on <strong>the</strong> me<strong>as</strong>urements and found that samples more than<br />
3 cm thick allow accurate magnetic-susceptibility determinations.<br />
Generally, three me<strong>as</strong>urements were taken on different<br />
surfaces of <strong>the</strong> sample and <strong>the</strong> average is reported.<br />
The standard deviation of <strong>the</strong> three me<strong>as</strong>urements is typically<br />
10% due <strong>to</strong> spatial variations in magnetite concentration.<br />
Susceptibility me<strong>as</strong>urements on cores were me<strong>as</strong>ured<br />
with a Sapphire Instruments model SI2B susceptibility meter,<br />
accurate <strong>to</strong> 10 –7 SI. These me<strong>as</strong>urements were used in<br />
preference <strong>to</strong> <strong>the</strong> SM-20 me<strong>as</strong>urements.<br />
Magnetic Remanence and Koenigsberger Ratio<br />
Natural remanent magnetization (NRM), if present, is a significant<br />
contribu<strong>to</strong>r <strong>to</strong> <strong>the</strong> overall magnetization of rocks<br />
(Telford et al., 1976). Magnetization is strongly dependent<br />
on <strong>the</strong> existing magnetic field and <strong>the</strong> mineralogical content<br />
of rocks, <strong>as</strong> well <strong>as</strong> <strong>the</strong> impact of emplacement conditions<br />
(Telford et al., 1976). Most relevant <strong>to</strong> <strong>the</strong> Nechako<br />
B<strong>as</strong>in is <strong>the</strong>rmoremanent NRM due <strong>to</strong> <strong>the</strong> emplacement of<br />
hot volcanic rocks.<br />
Magnetic remanence w<strong>as</strong> me<strong>as</strong>ured using an Agico Inc.<br />
model JR5-Aspinner magne<strong>to</strong>meter (sensitivity 10 –5 A/m).<br />
The full vec<strong>to</strong>r w<strong>as</strong> me<strong>as</strong>ured, but only <strong>the</strong> <strong>to</strong>tal vec<strong>to</strong>r<br />
magnitude of <strong>the</strong> remanence is reported in <strong>the</strong> datab<strong>as</strong>e.<br />
The Koenigsberger ratio (K N ) compares <strong>the</strong> relative<br />
strength of <strong>the</strong> natural remanent magnetization (NRM) <strong>to</strong><br />
<strong>the</strong> induced magnetism in <strong>the</strong> geomagnetic field and is<br />
calculated <strong>as</strong><br />
K N = NRM / (H 0 0), (3)<br />
where 0 is <strong>the</strong> magnetic susceptibility and <strong>the</strong> geomagnetic<br />
field strength (H 0 ) is approximated <strong>as</strong> a constant<br />
40 A/m (or 0 H 0 =50T = 50000 ). For K N >1, magneticanomaly<br />
interpretation will be incorrect if magnetic<br />
remanence is not taken in<strong>to</strong> consideration.<br />
Electrical Resistivity and Chargeability<br />
Complex electrical-impedance frequency spectra were<br />
me<strong>as</strong>ured using a Solartron Analytical model 1260 impedance<br />
spectrum analyzer, b<strong>as</strong>ed on <strong>the</strong> method of Katsube<br />
(2001). Sample cylinders were vacuum impregnated in distilled<br />
water and allowed <strong>to</strong> soak for at le<strong>as</strong>t 24 hours, <strong>to</strong> allow<br />
original groundwater solutes precipitated in <strong>the</strong> sample<br />
porosity <strong>to</strong> dissolve and approximate original groundwater<br />
conductivity. The impedance w<strong>as</strong> me<strong>as</strong>ured with five frequencies<br />
per decade from 1 MHz <strong>to</strong> 0.03 Hz. The scalar resistance<br />
w<strong>as</strong> picked <strong>as</strong> <strong>the</strong> real impedance at <strong>the</strong> frequency<br />
that displays minimum imaginary impedance, typically<br />
around 1000 Hz. Resistivity (in ohm·m, or ·m) is <strong>the</strong> scalar<br />
resistance multiplied by <strong>the</strong> sample geometric fac<strong>to</strong>r<br />
(i.e., <strong>the</strong> cross-sectional area divided by <strong>the</strong> length). Conductivity<br />
(Mho/m) is <strong>the</strong> reciprocal of <strong>the</strong> resistivity.<br />
Induced-polarization chargeability w<strong>as</strong> calculated after<br />
converting <strong>the</strong> frequency-domain impedance spectrum <strong>to</strong><br />
<strong>the</strong> time-domain response <strong>to</strong> a step function, V(t).Using<strong>the</strong><br />
Newmont Standard (Sumner, 1976), <strong>the</strong> chargeability (m T )<br />
is<br />
. (4)<br />
<strong>Geoscience</strong> <strong>BC</strong> Report 2012-1 131
Table 2. Physical and geophysical properties of Nechako B<strong>as</strong>in sample suite, organized by stratigraphic groups (Table 1)<br />
and summarized <strong>as</strong> maximum, minimum and average values.<br />
Dry average V P (km/s) 3<br />
Wet average V P (km/s) 3<br />
Dry average V S (km/s) 3<br />
Wet average V S (km/s) 3<br />
Dry bulk density (g/cc) 3<br />
Wet bulk density (g/cc) 3<br />
Wet framework density<br />
(g/cc) 3<br />
Dry Poisson's ratio<br />
Wet Poisson's ratio<br />
Dry Young's modulus (GPa)<br />
Wet Young's modulus (GPa)<br />
Dry V P /V S<br />
Wet V P /V S<br />
Porosity (%) 3<br />
Magnetic susceptibility (SI) 1,2<br />
Resistivity (ohm-m) 1<br />
Koenigsberger ratio (K N ) 1<br />
Natural remanent<br />
magnetization (NRM; A/m) 1<br />
Chargeability (ms) 3<br />
Group name:<br />
Chilcotin 1,2<br />
Endako<br />
Ootsa Lake<br />
(coherent)<br />
Ootsa Lake<br />
(noncoherent)<br />
K<strong>as</strong>alka /<br />
Powell Creek /<br />
T<strong>as</strong>eko River<br />
Jack<strong>as</strong>s<br />
Mountain<br />
Max. 5.99 5.82 5.72 5.19 5.66 6.17<br />
Min. 4.24 3.31 3.25 2.25 4.23 3.25<br />
Avg. 5.25 4.93 4.40 3.44 4.73 5.24<br />
Max. n/a 6.63 5.81 5.52 5.91 6.49<br />
Min. n/a 3.88 4.16 3.62 4.78 4.82<br />
Avg. n/a 5.53 4.98 4.40 5.36 5.82<br />
Max. n/a 3.44 3.25 2.43 2.96 3.33<br />
Min. n/a 1.59 2.08 1.04 1.97 1.99<br />
Avg. n/a 2.64 2.60 1.49 2.56 2.79<br />
Max. n/a 4.10 3.40 2.67 3.07 3.65<br />
Min. n/a 1.77 1.77 1.50 2.15 1.67<br />
Avg. n/a 2.81 2.54 1.98 2.67 2.83<br />
Max. 2.99 2.89 2.68 2.65 2.87 2.80<br />
Min. 2.49 1.98 2.23 1.87 2.41 2.54<br />
Avg. 2.72 2.53 2.43 2.13 2.64 2.70<br />
Max. n/a 2.90 2.69 2.67 2.89 2.80<br />
Min. n/a 2.25 2.35 2.16 2.49 2.60<br />
Avg. n/a 2.61 2.49 2.31 2.69 2.72<br />
Max. 3.02 3.02 2.75 2.75 2.91 2.82<br />
Min. 2.56 2.47 2.45 2.47 2.64 2.67<br />
Avg. 2.87 2.78 2.59 2.66 2.78 2.75<br />
Max. n/a 0.36 0.29 0.41 0.40 0.38<br />
Min. n/a 0.22 0.08 0.36 0.12 0.20<br />
Avg. n/a 0.30 0.22 0.38 0.27 0.29<br />
Max. n/a 0.45 0.39 0.45 0.38 0.45<br />
Min. n/a 0.04 0.23 0.18 0.26 0.23<br />
Avg. n/a 0.30 0.32 0.35 0.33 0.33<br />
Max. n/a 84.36 64.82 42.45 52.01 78.45<br />
Min. n/a 13.44 22.67 5.49 28.62 24.18<br />
Avg. n/a 48.54 41.53 15.29 43.94 56.62<br />
Max. n/a 94.08 69.94 51.17 71.57 93.62<br />
Min. n/a 19.31 20.83 13.87 31.63 21.23<br />
Avg. n/a 55.45 43.68 25.82 52.12 59.94<br />
Max. n/a 2.13 1.83 2.53 2.43 2.24<br />
Min. n/a 1.67 1.48 2.14 1.52 1.63<br />
Avg. n/a 1.89 1.69 2.32 1.88 1.89<br />
Max. n/a 3.20 2.40 3.30 2.27 3.28<br />
Min. n/a 1.44 1.68 1.60 1.75 1.68<br />
Avg. n/a 2.07 2.00 2.31 2.03 2.15<br />
Max. 16.55 26.74 14.06 29.44 8.42 6.06<br />
Min. 0.15 0.75 0.32 1.60 1.18 0.27<br />
Avg. 5.57 8.25 5.68 18.76 4.63 1.72<br />
Max. 0.11 0.05 0.04 0.03 0.04 0.01<br />
Min. b.d. b.d. 0.01 b.d. b.d. b.d.<br />
Avg. 0.01 0.01 0.01 0.01 0.01 b.d.<br />
Max. 95646 17560 23035 9941 20796 29011<br />
Min. 127 49 82 37 139 116<br />
Avg. 4541 6135 5098 1518 4886 5101<br />
Max. 80.90 34.90 6.95 23.35 25.28 30.38<br />
Min. 0.09 0.01 0.09 0.04 0.06 0.08<br />
Avg. 13.03 10.24 2.28 8.23 5.37 3.77<br />
Max. 48.00 24.80 2.66 27.70 11.70 15.10<br />
Min. b.d. b.d. 0.04 b.d. b.d. b.d.<br />
Avg. 3.17 3.47 0.78 5.37 3.06 1.04<br />
Max. n/a 18.70 15.10 11.90 45.20 19.10<br />
Min. n/a 0.01 0.03 0.02 0.36 0.28<br />
Avg. n/a 5.76 3.36 3.85 7.89 4.48<br />
1 Me<strong>as</strong>urements conducted at Centre for Experimental Study of <strong>the</strong> Lithosphere at University of British Columbia (CESL-U<strong>BC</strong>) under supervision of<br />
J.K. Russell.<br />
2 Me<strong>as</strong>urements conducted at Geological Survey of Canada Pacific, Sidney (GSC-P) under supervision of R.J. Enkin.<br />
3 Me<strong>as</strong>urements conducted at Labora<strong>to</strong>ire de G ophysique Exp rimentale at l Universit de Str<strong>as</strong>bourg, France (EOST) under supervision of M.J.<br />
Heap. All seismic velocity me<strong>as</strong>urements (except Chilcotin b<strong>as</strong>alt samples) made under atmospheric pressure with nominal stress of 1 MPa<br />
applied <strong>to</strong> ends of sample. Compressional wave (P-wave) me<strong>as</strong>urements made on samples using a frequency of 700 kHz; shear wave (S-wave)<br />
me<strong>as</strong>urements made using a frequency of 300 kHz.<br />
Abbreviations: b.d., below detection; n/a, not me<strong>as</strong>ured; VP, P-wave velocity; VS, S-wave velocity.<br />
132 <strong>Geoscience</strong> <strong>BC</strong> Summary of Activities 2011
Table 2 (continued)<br />
Group name:<br />
Taylor<br />
Creek and<br />
Skeena<br />
Spences<br />
Bridge<br />
Relay<br />
Mountain<br />
Ladner<br />
Hazel<strong>to</strong>n<br />
Mesozoic<br />
plu<strong>to</strong>nic<br />
Dry average V P (km/s) 3<br />
Wet average V P (km/s) 3<br />
Dry average V S (km/s) 3<br />
Wet average V S (km/s) 3<br />
Dry bulk density (g/cc) 3<br />
Wet bulk density (g/cc) 3<br />
Wet framework density<br />
(g/cc) 3<br />
Dry Poisson's ratio<br />
Wet Poisson's ratio<br />
Dry Young's modulus (GPa)<br />
Wet Young's modulus (GPa)<br />
Dry V P /V S<br />
Wet V P /V S<br />
Porosity (%) 3<br />
Magnetic susceptibility (SI) 1,2<br />
Resistivity (ohm-m) 1<br />
Koenigsberger ratio (K N ) 1<br />
Natural remanent<br />
magnetization (NRM; A/m) 1<br />
Chargeability (ms) 3<br />
Max. 4.79 5.81 5.61 5.85 5.96 5.46<br />
Min. 1.65 3.42 4.20 5.22 2.57 3.44<br />
Avg. 3.40 5.12 5.17 5.65 4.33 4.31<br />
Max. 5.27 6.15 5.78 6.21 6.50 6.07<br />
Min. 3.02 4.39 5.16 5.47 3.40 4.33<br />
Avg. 4.16 5.57 5.60 5.86 5.21 5.45<br />
Max. 3.22 3.47 3.11 3.39 4.04 3.15<br />
Min. 1.04 1.89 2.45 3.20 1.51 2.00<br />
Avg. 2.16 2.84 2.88 3.32 2.39 2.61<br />
Max. 3.11 3.56 3.52 3.39 3.66 3.33<br />
Min. 1.47 1.99 2.07 3.03 1.66 2.18<br />
Avg. 2.28 2.80 2.83 3.24 2.59 2.73<br />
Max. 2.63 2.87 2.80 2.77 2.75 2.78<br />
Min. 2.05 2.30 2.51 2.19 1.91 2.33<br />
Avg. 2.34 2.63 2.68 2.60 2.45 2.65<br />
Max. 2.65 2.87 2.81 2.77 2.76 2.79<br />
Min. 2.21 2.45 2.54 2.20 2.21 2.45<br />
Avg. 2.45 2.68 2.70 2.61 2.54 2.68<br />
Max. 2.73 2.99 2.82 2.80 2.78 2.82<br />
Min. 2.65 2.66 2.72 2.74 2.62 2.65<br />
Avg. 2.68 2.81 2.77 2.76 2.71 2.74<br />
Max. 0.29 0.35 0.35 0.27 0.37 0.25<br />
Min. 0.09 0.20 0.20 0.14 0.07 0.14<br />
Avg. 0.15 0.27 0.26 0.23 0.24 0.21<br />
Max. 0.42 0.44 0.42 0.30 0.42 0.37<br />
Min. 0.03 0.17 0.18 0.25 0.06 0.28<br />
Avg. 0.23 0.31 0.31 0.28 0.32 0.33<br />
Max. 54.42 78.59 66.15 76.53 96.54 69.20<br />
Min. 5.21 23.85 37.49 62.64 11.52 26.32<br />
Avg. 28.66 55.50 56.99 70.23 38.38 45.42<br />
Max. 57.48 85.20 78.46 81.94 78.79 79.58<br />
Min. 15.24 30.47 33.12 51.70 17.62 31.00<br />
Avg. 32.90 55.93 57.82 70.50 47.53 54.60<br />
Max. 1.85 2.08 2.06 1.78 2.21 1.73<br />
Min. 1.49 1.63 1.63 1.54 1.33 1.55<br />
Avg. 1.58 1.81 1.80 1.71 1.84 1.66<br />
Max. 2.76 3.02 2.76 1.86 2.64 2.20<br />
Min. 1.43 1.59 1.60 1.74 1.46 1.82<br />
Avg. 1.90 2.05 2.05 1.81 2.07 2.01<br />
Max. 17.07 16.21 3.49 1.60 30.06 11.97<br />
Min. 2.54 0.60 0.35 0.19 0.43 1.00<br />
Avg. 11.37 5.11 1.87 0.81 8.48 3.41<br />
Max. b.d. 0.01 b.d. b.d. 0.04 0.01<br />
Min. b.d. b.d. b.d. b.d. b.d. b.d.<br />
Avg. b.d. b.d. b.d. b.d. 0.01 0.01<br />
Max. 3650 3433 19199 49883 12338 10771<br />
Min. 208 428 460 1586 46 152<br />
Avg. 1190 1635 5348 8617 3864 4402<br />
Max. 1.37 23.43 0.16 24.90 45.35 5.90<br />
Min. 0.13 0.68 0.04 0.02 0.05 0.69<br />
Avg. 0.66 9.19 0.09 2.56 7.78 3.64<br />
Max. 0.02 4.77 0.02 1.03 4.56 2.52<br />
Min. b.d. 0.14 b.d. b.d. b.d. 0.03<br />
Avg. b.d. 1.21 b.d. 0.10 1.38 0.98<br />
Max. 19.60 11.80 5.46 55.60 16.80 23.40<br />
Min. 0.07 1.15 0.30 0.47 0.89 3.30<br />
Avg. 4.62 5.59 1.73 7.22 4.85 14.73<br />
<strong>Geoscience</strong> <strong>BC</strong> Report 2012-1 133
Table 3. Physical and geophysical properties of Nechako B<strong>as</strong>in sample suite, organized by packages on <strong>the</strong><br />
b<strong>as</strong>is of lithostratigraphy and summarized <strong>as</strong> maximum, minimum and average values.<br />
Dry average V P (km/s)<br />
Wet average V P (km/s)<br />
Dry average V S (km/s)<br />
Wet average V S (km/s)<br />
Dry bulk density (g/cc)<br />
Wet bulk density (g/cc)<br />
Wet framework density<br />
(g/cc)<br />
Dry Poisson's ratio<br />
Wet Poisson's ratio<br />
Dry Young's modulus (GPa)<br />
Wet Young's modulus (GPa)<br />
Dry V P /V S<br />
Wet V P /V S<br />
Porosity (%)<br />
Magnetic susceptibility (SI)<br />
Resistivity (ohm-m)<br />
Koenigsberger ratio (K N )<br />
Natural remanent<br />
magnetization (NRM; A/m)<br />
Chargeability (ms)<br />
Package name:<br />
Group name:<br />
No of samples:<br />
Miocene<br />
Chilcotin<br />
(CB)<br />
Abbreviations: b.d., below detection; n/a, not me<strong>as</strong>ured<br />
Eocene Volcanic and<br />
Sedimentary<br />
(EVS)<br />
Cretaceous Volcanic and<br />
Sedimentary<br />
(KVS)<br />
K<strong>as</strong>alka / Powell Creek /<br />
T<strong>as</strong>eko River, Jack<strong>as</strong>s<br />
Endako, Ootsa Lake Mountain, Taylor Creek<br />
and Skeena, Spences<br />
Bridge<br />
57 31 45<br />
Max. 5.99 5.82 6.17<br />
Min. 4.24 2.25 1.65<br />
Avg. 5.25 4.40 4.67<br />
Max. n/a 6.63 6.49<br />
Min. n/a 3.62 3.02<br />
Avg. n/a 5.08 5.27<br />
Max. n/a 3.44 3.47<br />
Min. n/a 1.04 1.04<br />
Avg. n/a 2.37 2.61<br />
Max. n/a 4.10 3.65<br />
Min. n/a 1.50 1.47<br />
Avg. n/a 2.52 2.66<br />
Max. 2.99 2.89 2.87<br />
Min. 2.49 1.87 2.05<br />
Avg. 2.72 2.41 2.59<br />
Max. n/a 2.90 2.89<br />
Min. n/a 2.16 2.21<br />
Avg. n/a 2.50 2.64<br />
Max. 3.02 3.02 2.99<br />
Min. 2.56 2.45 2.64<br />
Avg. 2.87 2.69 2.76<br />
Max. n/a 0.41 0.40<br />
Min. n/a 0.08 0.09<br />
Avg. n/a 0.29 0.25<br />
Max. n/a 0.45 0.45<br />
Min. n/a 0.04 0.03<br />
Avg. n/a 0.32 0.30<br />
Max. n/a 84.36 78.59<br />
Min. n/a 5.49 5.21<br />
Avg. n/a 38.56 47.22<br />
Max. n/a 94.08 93.62<br />
Min. n/a 13.87 15.24<br />
Avg. n/a 44.51 50.86<br />
Max. n/a 2.53 2.43<br />
Min. n/a 1.48 1.49<br />
Avg. n/a 1.91 1.79<br />
Max. n/a 3.30 3.28<br />
Min. n/a 1.44 1.43<br />
Avg. n/a 2.10 2.04<br />
Max. 16.55 29.44 17.07<br />
Min. 0.15 0.32 0.27<br />
Avg. 5.57 9.64 5.57<br />
Max. 0.11 0.05 0.04<br />
Min. b.d. b.d. b.d.<br />
Avg. 0.01 0.01 b.d.<br />
Max. 95646 23035 29011<br />
Min. 127 37 116<br />
Avg. 4541 4445 3521<br />
Max. 80.9 34.9 30.4<br />
Min. 0.1 b.d. 0.1<br />
Avg. 13.0 6.8 4.1<br />
Max. 48.0 27.7 15.1<br />
Min. b.d. b.d. b.d.<br />
Avg. 3.17 3.05 1.22<br />
Max. n/a 18.7 45.2<br />
Min. n/a 0.0 0.1<br />
Avg. n/a 4.4 5.4<br />
134 <strong>Geoscience</strong> <strong>BC</strong> Summary of Activities 2011
Table 3 (continued)<br />
Package name:<br />
Middle Late Jur<strong>as</strong>sic<br />
Sedimentary<br />
(JS)<br />
Lower Middle Jur<strong>as</strong>sic<br />
Volcanic and<br />
Sedimentary (JVS)<br />
Mesozoic B<strong>as</strong>ement<br />
(MB p )<br />
Group name:<br />
Relay Mountain, Ladner<br />
Hazel<strong>to</strong>n<br />
Dry average V P (km/s)<br />
Wet average V P (km/s)<br />
Dry average V S (km/s)<br />
Wet average V S (km/s)<br />
Dry bulk density (g/cc)<br />
Wet bulk density (g/cc)<br />
Wet framework density<br />
(g/cc)<br />
Dry Poisson's ratio<br />
Wet Poisson's ratio<br />
Dry Young's modulus (GPa)<br />
Wet Young's modulus (GPa)<br />
Dry V P /V S<br />
Wet V P /V S<br />
Porosity (%)<br />
Magnetic susceptibility (SI)<br />
Resistivity (ohm-m)<br />
Koenigsberger ratio (K N )<br />
Natural remanent<br />
magnetization (NRM; A/m)<br />
Chargeability (ms)<br />
No of samples:<br />
18 10 6<br />
Max. 5.85 5.96 5.46<br />
Min. 4.20 2.57 3.44<br />
Avg. 5.38 4.33 4.31<br />
Max. 6.21 6.50 6.07<br />
Min. 5.16 3.40 4.33<br />
Avg. 5.72 5.21 5.45<br />
Max. 3.39 4.04 3.15<br />
Min. 2.45 1.51 2.00<br />
Avg. 3.08 2.39 2.61<br />
Max. 3.52 3.66 3.33<br />
Min. 2.07 1.66 2.18<br />
Avg. 3.01 2.59 2.73<br />
Max. 2.80 2.75 2.78<br />
Min. 2.19 1.91 2.33<br />
Avg. 2.65 2.45 2.65<br />
Max. 2.81 2.76 2.79<br />
Min. 2.20 2.21 2.45<br />
Avg. 2.66 2.54 2.68<br />
Max. 2.82 2.78 2.82<br />
Min. 2.72 2.62 2.65<br />
Avg. 2.76 2.71 2.74<br />
Max. 0.35 0.37 0.25<br />
Min. 0.14 0.07 0.14<br />
Avg. 0.25 0.24 0.21<br />
Max. 0.42 0.42 0.37<br />
Min. 0.18 0.06 0.28<br />
Avg. 0.30 0.32 0.33<br />
Max. 76.53 96.54 69.20<br />
Min. 37.49 11.52 26.32<br />
Avg. 62.88 38.38 45.42<br />
Max. 81.94 78.79 79.58<br />
Min. 33.12 17.62 31.00<br />
Avg. 63.46 47.53 54.60<br />
Max. 2.06 2.21 1.73<br />
Min. 1.54 1.33 1.55<br />
Avg. 1.76 1.84 1.66<br />
Max. 2.76 2.64 2.20<br />
Min. 1.60 1.46 1.82<br />
Avg. 1.94 2.07 2.01<br />
Max. 3.49 30.06 11.97<br />
Min. 0.19 0.43 1.00<br />
Avg. 1.40 8.48 3.41<br />
Max. b.d. 0.04 0.01<br />
Min. b.d. b.d. b.d.<br />
Avg. b.d. 0.01 0.01<br />
Max. 49883 12338 10771<br />
Min. 460 46 152<br />
Avg. 7271 3864 4402<br />
Max. 24.9 45.4 5.9<br />
Min. b.d. 0.1 0.7<br />
Avg. 1.5 7.8 3.6<br />
Max. 1.0 4.6 2.5<br />
Min. b.d. b.d. b.d.<br />
Avg. 0.06 1.38 0.98<br />
Max. 55.6 16.8 23.4<br />
Min. 0.3 0.9 3.3<br />
Avg. 5.0 4.9 14.7<br />
<strong>Geoscience</strong> <strong>BC</strong> Report 2012-1 135
The main parameters affecting chargeability in labora<strong>to</strong>ry<br />
experiments are mineralogy, grain size and <strong>the</strong> presence of<br />
pore-filling ionic fluids (Telford et al., 1976). Chargeability<br />
is incre<strong>as</strong>ed by large surface-<strong>to</strong>-<strong>volume</strong> ratios between<br />
grains (Telford et al., 1976). Values of chargeability for<br />
common rock types vary over 3–4 orders of magnitude: 10–<br />
20 ms for carbonate rocks versus 2000–3000 ms for sulphide<br />
minerals (Telford et al., 1976). Of particular interest<br />
<strong>to</strong> <strong>the</strong> Nechako B<strong>as</strong>in dat<strong>as</strong>et are <strong>the</strong> average ranges of<br />
chargeability cited for volcanic tuff (300–800 ms), dense<br />
volcanic rocks (100–500 ms), sedimentary rocks (100–<br />
500 ms) and igneous rocks (10–50 ms; Telford et al., 1976).<br />
Seismic Wave Velocities<br />
Two fundamental body-wave types travel through material:<br />
compressional (P) waves and shear (S) waves. For P waves,<br />
material moves parallel <strong>to</strong> <strong>the</strong> direction of propagation; for<br />
S waves, material moves in a plane perpendicular <strong>to</strong> <strong>the</strong> direction<br />
of wave propagation. For energy <strong>to</strong> travel through a<br />
given el<strong>as</strong>tic material, <strong>the</strong>re must be a resulting res<strong>to</strong>ring<br />
force that resists deformation (Telford et al., 1976). For instance,<br />
when a material experiences strain, that strain must<br />
be accommodated by a change in shape of <strong>the</strong> material. Because<br />
fluids cannot sustain a shear force, S waves do not<br />
propagate through fluids. The P-wave arrivals are always<br />
precursory <strong>to</strong> S-wave arrivals and are <strong>the</strong>refore e<strong>as</strong>iest <strong>to</strong><br />
identify. Knowledge of <strong>the</strong> velocities of P and S waves (i.e.,<br />
V P and V S , respectively) p<strong>as</strong>sing through geological materials<br />
can be used <strong>to</strong> identify subsurface rock types. Thus, our<br />
me<strong>as</strong>urements of values of V P and V S for this diverse suite<br />
of samples, under dry and wet conditions, will facilitate interpretation<br />
of seismic sections for which subsurface<br />
velocity structures have been derived via inversion.<br />
The values of ultr<strong>as</strong>onic P-wave velocities (V P )aremost<br />
important <strong>to</strong> <strong>the</strong> ongoing seismic surveys, since inversions<br />
of <strong>the</strong> seismic-survey data are b<strong>as</strong>ed mainly on V P .Valuesof<br />
S-wave velocities (V S ) are more difficult <strong>to</strong> carry out inversions<br />
for, but <strong>the</strong>y are useful for refining interpretations of<br />
seismic pro<strong>file</strong>s. The distribution of pore fluids and porefluid<br />
pressures in <strong>the</strong> subsurface of <strong>the</strong> Nechako B<strong>as</strong>in are<br />
unknown but are unlikely <strong>to</strong> be negligible. Fur<strong>the</strong>rmore,<br />
pore-fluid pressure exerts a significant influence on seismic<br />
reflection. On this b<strong>as</strong>is, we elected <strong>to</strong> make both ‘Dry’<br />
and ‘Wet’ (i.e., water-saturated) ultr<strong>as</strong>onic me<strong>as</strong>urements<br />
of V P and V S for each sample core.<br />
The P- and S-wave arrival times for sample cores were<br />
me<strong>as</strong>ured using a bench-<strong>to</strong>p apparatus at EOST. Me<strong>as</strong>urements<br />
were made using an Agilent Technologies model<br />
DSO5012A digital-s<strong>to</strong>rage oscilloscope, an Agilent Technologies<br />
model 33210A 10 MHz function/waveform genera<strong>to</strong>r,<br />
and two broadband PZT piezoelectric transducer<br />
crystals (100 kHz <strong>to</strong> 1 MHz frequency), one located at each<br />
end of <strong>the</strong> sample. Me<strong>as</strong>urements were made under a stress<br />
of approximately 1 MPa <strong>to</strong> ensure good contact between<br />
<strong>the</strong> instrument’s end caps and <strong>the</strong> polished ends of <strong>the</strong> sample<br />
core. The P-wave me<strong>as</strong>urements were b<strong>as</strong>ed on a transmitted<br />
frequency of 700 kHz; S-wave me<strong>as</strong>urements used a<br />
frequency of 300 kHz. The P-wave arrivals were chosen <strong>as</strong><br />
<strong>the</strong> first clearly identified signal following <strong>the</strong> triggering<br />
pulse from <strong>the</strong> function genera<strong>to</strong>r. The S-arrival is characterized<br />
by a distinct change in <strong>the</strong> ultr<strong>as</strong>onic response of <strong>the</strong><br />
sample with time. The onsets of <strong>the</strong> S-wave arrivals were<br />
determined by identifying <strong>the</strong> first significant change in<br />
signal amplitude or <strong>the</strong> first distinct inflection point in <strong>the</strong><br />
slope of <strong>the</strong> signal following <strong>the</strong> P-wave arrival.<br />
Derivative (Computed) Properties<br />
The me<strong>as</strong>ured values of V P and V S for cores of rock samples<br />
allow <strong>the</strong> calculation of derivative properties, namely several<br />
el<strong>as</strong>tic (dynamic) properties (Table 2). In this section,<br />
we review <strong>the</strong> calculation of Poisson’s ratio and Young’s<br />
modulus (Tables 2 and 3).<br />
El<strong>as</strong>tic compression and extension are described by<br />
Hooke’s Law,<br />
=E• , (5)<br />
where is <strong>the</strong> normal stress and is <strong>the</strong> elongation or normal<br />
strain. Young’s modulus (E) is <strong>the</strong> me<strong>as</strong>ure of stiffness<br />
and is traditionally taken <strong>as</strong> <strong>the</strong> ratio between <strong>the</strong> tensile<br />
stress and tensile strain. Here, we define E <strong>as</strong> <strong>the</strong> ratio of<br />
uniaxial stress <strong>to</strong> uniaxial strain. Young’s modulus calculated<br />
from ultr<strong>as</strong>onic velocities is an indirect and nondestructive<br />
way of determining <strong>the</strong> stiffness of rock samples.<br />
For most rocks, E h<strong>as</strong> values between 10 and 200 GPa<br />
(Telford et al., 1976).<br />
Poisson’s ratio is <strong>the</strong> ratio between <strong>the</strong> shortening and expansion<br />
of a material under uniaxial compression. Most<br />
rocks have Poisson’s ratios between 0.05 (for very hard,<br />
rigid rock) <strong>to</strong> 0.45 (for soft, poorly consolidated material;<br />
Telford et al., 1976).<br />
Using ultr<strong>as</strong>onic me<strong>as</strong>urements of P- and S-wave velocities,<br />
<strong>the</strong> dynamic el<strong>as</strong>tic moduli can be computed for Poisson’s<br />
ratio ( d )<strong>as</strong><br />
and for Young modulus (E d )<strong>as</strong><br />
(6)<br />
, (7)<br />
where is <strong>the</strong> bulk density of <strong>the</strong> sample (g/cc).<br />
Results<br />
We describe in this section <strong>the</strong> experimental results obtained<br />
for each of <strong>the</strong> six lithostratigraphic packages (Ta-<br />
136 <strong>Geoscience</strong> <strong>BC</strong> Summary of Activities 2011
les 1 and 3). The range of values me<strong>as</strong>ured for <strong>the</strong> various<br />
properties across all lithostratigraphic packages is extreme<br />
(Table 3):<br />
porosity: 0.15–30.06%<br />
density: 2.45–3.02 g/cc<br />
chargeability: 0.0–55.6 ms<br />
NRM: 1.0–48.0<br />
resistivity: 46–95646 m<br />
magnetic susceptibility: 0.01–0.11 SI<br />
dry V P : 1.65–6.17 km/s<br />
dry V S : 1.04–4.04 km/s<br />
wet V P : 3.02–6.63 km/s<br />
wet V S : 1.47–4.10 km/s<br />
Variation within lithostratigraphic packages is substantially<br />
less and reflects <strong>the</strong> physical and lithological variations<br />
within each package. Some packages comprise a narrow<br />
range of rock types (e.g., Miocene Chilcotin b<strong>as</strong>alts<br />
[CB]) and can show a correspondingly narrow range of<br />
physical and geophysical properties (Table 3). O<strong>the</strong>r<br />
lithostratigraphic packages comprise a diverse range of<br />
rock types (e.g., Eocene volcanic and sedimentary rocks<br />
[EVS]) and show a correspondingly wide range of properties.<br />
Ultimately, this extensive and high-quality dat<strong>as</strong>et is<br />
intended for <strong>Geoscience</strong> <strong>BC</strong>’s digital datab<strong>as</strong>e and promises<br />
<strong>to</strong> facilitate geophysical interpretations of <strong>the</strong> geology<br />
in <strong>the</strong> Nechako B<strong>as</strong>in region of central <strong>BC</strong>. Data from each<br />
of <strong>the</strong> six lithostratigraphic packages have been plotted on<br />
Figure 3. Density and porosity ranges for <strong>the</strong> <strong>entire</strong> suite of samples collected within <strong>the</strong> Nechako B<strong>as</strong>in:<br />
a) me<strong>as</strong>ured values of dry bulk density plotted versus porosity, ranging from 0% <strong>to</strong> 30%, confirming<br />
<strong>the</strong> expected negative correlation; <strong>the</strong> broad trend described by <strong>the</strong> dat<strong>as</strong>et lies between model<br />
density–porosity lines for samples having framework density ( f ) values of 2.2 and 3 g/cc; b) me<strong>as</strong>ured<br />
values of bulk density and framework density, which varies from ~2.4 <strong>to</strong> 3.1 g/cc and represents<br />
<strong>the</strong> skeletal density plus any isolated pore space (
multiparameter diagrams (Table 3) <strong>to</strong> characterize <strong>the</strong><br />
within-package variations in physical properties.<br />
As part of our physical-property characterization of <strong>the</strong><br />
samples, we me<strong>as</strong>ured bulk and framework densities and<br />
porosity. Many geophysical properties are, <strong>the</strong>mselves, dependent<br />
on or sensitive <strong>to</strong> <strong>the</strong>se physical properties. The<br />
suite of 167 samples h<strong>as</strong> a porosity range of 0–30 vol. %<br />
(Figure 3a); <strong>the</strong> porosity is <strong>as</strong>sumed <strong>to</strong> be fully connected.<br />
On <strong>the</strong> b<strong>as</strong>is of <strong>the</strong> different methods used <strong>to</strong> me<strong>as</strong>ure density,<br />
we saw no evidence for a substantial fraction of isolated<br />
porosity. Bulk density (rock plus pore space) ranges<br />
from ~1.8 <strong>to</strong> 3.0 g/cc, where<strong>as</strong> <strong>the</strong> corresponding framework<br />
density varies between ~2.4 and 3.0 g/cc. The relationship<br />
between bulk and framework density and porosity<br />
is illustrated in Figure 3b. At zero porosity, bulk and framework<br />
density are equivalent. The con<strong>to</strong>urs in Figure 3b illustrate<br />
<strong>the</strong> effect of porosity in reducing <strong>the</strong> bulk density of<br />
samples relative <strong>to</strong> <strong>the</strong>ir framework density.<br />
The magnetic properties of <strong>the</strong> six lithostratigraphic packages<br />
are shown in Figure 4 (Table 3; Figure 4a–f). The K N<br />
values for <strong>the</strong> <strong>entire</strong> suite vary over four orders of magnitude,<br />
from 10 –2 <strong>to</strong> 10 2 . Magnetic susceptibility varies over<br />
three orders of magnitude, from 10 –4 <strong>to</strong> 10 –1 ms. High values<br />
of K N indicate rocks that have preserved <strong>the</strong> magnitude<br />
and direction of <strong>the</strong> global magnetic field at <strong>the</strong> time of emplacement.<br />
For samples having high values of K N (>1), <strong>the</strong><br />
me<strong>as</strong>ured values of magnetic susceptibility need <strong>to</strong> be corrected<br />
in order <strong>to</strong> use <strong>the</strong> data <strong>to</strong> identify and interpret magnetic<br />
anomalies. Within <strong>the</strong> Nechako B<strong>as</strong>in, K N is a relatively<br />
good indica<strong>to</strong>r of volcanic rocks emplaced at<br />
elevated temperature (exhibiting <strong>the</strong>rmoremanent NRM),<br />
where<strong>as</strong> sedimentary rocks have low K N values. In most<br />
rocks, variations in k mainly reflect modal variations in<br />
magnetic minerals (particularly magnetite; Telford et al.,<br />
1976). However, given <strong>the</strong> large variability of k within rock<br />
types and <strong>the</strong> significant overlap in k values across rock<br />
types, k is, by itself, a poor discrimina<strong>to</strong>r of lithostratigraphic<br />
packages. The Chilcotin b<strong>as</strong>alts are characterized<br />
by high K N values (~1–100), and <strong>the</strong>ir k values vary over<br />
three orders of magnitude. The EVS package h<strong>as</strong> very similarrangesofK<br />
N and k, although fewer samples were me<strong>as</strong>ured.<br />
The KVS rocks show a greater range in K N and have<br />
a lower mean value, while showing an identical variation in<br />
k. The wide range of K N values for <strong>the</strong> KVS package indicates<br />
a broad range of rock types incorporated in<strong>to</strong> this<br />
package. The JS samples are distinguished by low values of<br />
K N and restricted and low values of k. This reflects <strong>the</strong> fact<br />
that <strong>the</strong>y are dominantly sedimentary in provenance. Con-<br />
Figure 4. Relationship between K N (Koenigsberger ratio) and magnetic susceptibility for <strong>the</strong> lithostratigraphic packages listed in Table 1:<br />
a) Chilcotin Group b<strong>as</strong>altic lav<strong>as</strong> (CB), b) Eocene volcanic and sedimentary rocks (EVS), c) Cretaceous volcanicl<strong>as</strong>tic and sedimentary<br />
rocks (KVS), d) Middle–Late Jur<strong>as</strong>sic sedimentary rocks (JS), e) Lower–Middle Jur<strong>as</strong>sic volcanic and sedimentary rocks (JVS), and f) Mesozoic<br />
b<strong>as</strong>ement rocks (MB p ). The d<strong>as</strong>hed lines at K N = 1 indicate <strong>the</strong> threshold above which <strong>the</strong> magnetic-anomaly interpretation needs <strong>to</strong><br />
be corrected for remanent magnetization (NRM; see text); <strong>the</strong> data presented are not corrected for NRM. For example, nearly all CB b<strong>as</strong>alts<br />
have K N values >1 and require corrections <strong>to</strong> <strong>the</strong> experimentally me<strong>as</strong>ured values of magnetic susceptibility. Conversely, JS samples are<br />
largely unaffected by NRM.<br />
138 <strong>Geoscience</strong> <strong>BC</strong> Summary of Activities 2011
versely <strong>the</strong> small numbers of samples within <strong>the</strong> JVS package<br />
suggest wide-ranging K N and k properties similar <strong>to</strong><br />
those observed in <strong>the</strong> EVS and KVS packages. The b<strong>as</strong>ement<br />
rocks (MB p ) have intermediate <strong>to</strong> low K N and a range<br />
of k values. These properties are largely a reflection of <strong>the</strong><br />
variable modal mineralogy of <strong>the</strong> plu<strong>to</strong>nic rocks collected<br />
<strong>to</strong> represent <strong>the</strong> b<strong>as</strong>ement <strong>to</strong> <strong>the</strong> Nechako B<strong>as</strong>in.<br />
The resistivity values for each lithological package are<br />
plotted <strong>as</strong> a function of sample porosity (Figure 5). Figure<br />
5a demonstrates clearly that <strong>the</strong> range of resistivities in<br />
CB (127–95 646 m) is controlled by mineralogical composition<br />
and h<strong>as</strong> very little dependence, if any, on sample<br />
porosity. The CB rocks are relatively lithologically homogeneous<br />
but vary widely in porosity (~0–17%) due <strong>to</strong> <strong>the</strong>ir<br />
varying vesicularity. This wide range of porosity h<strong>as</strong> no apparent<br />
effect on <strong>the</strong> resistivity of <strong>the</strong> CB sample package.<br />
Conversely, <strong>the</strong> variation in sample resistivity of two orders<br />
of magnitude seen in <strong>the</strong>se b<strong>as</strong>alts is likely a reflection of<br />
variations in crystallinity, grain size and bulk mineralogy.<br />
The EVS sample package (Figure 5b) clearly shows a decre<strong>as</strong>e<br />
in resistivity by three orders of magnitude (from approximately<br />
10 4 <strong>to</strong> 10 1 m) <strong>as</strong> a function of porosity. This<br />
sample package is more lithologically varied and, although<br />
<strong>the</strong>re is some variation in resistivity at constant porosity, <strong>the</strong><br />
emergent trend demonstrates that mineralogy and bulk<br />
composition are likely secondary contribu<strong>to</strong>rs <strong>to</strong> resistivity.<br />
The resistivity of <strong>the</strong> KVS sample package decre<strong>as</strong>es more<br />
than two orders of magnitude (from 10 4 <strong>to</strong> 10 2 m) with<br />
porosity (Figure 5c), a variation that is less pronounced than<br />
in <strong>the</strong> EVS package . This may suggest that both composition<br />
and porosity control resistivity in this lithostratigraphic<br />
package. The JS package shows a resistivity range<br />
of two orders of magnitude (from 10 4 –10 2 m) over a<br />
change of less than 5% in porosity (Figure 5d). The tight<br />
clustering of data suggests that JS rocks can be discriminated<br />
from o<strong>the</strong>r package s on <strong>the</strong> b<strong>as</strong>is of me<strong>as</strong>ured porosity<br />
and resistivity. Resistivity of <strong>the</strong> JVS sample package<br />
decre<strong>as</strong>es with incre<strong>as</strong>ing porosity (Figure 5e). As this<br />
package is lithologically uniform, it is expected that most<br />
variation in resistivity (10 4 –10 2 m) is porosity controlled.<br />
L<strong>as</strong>tly, <strong>the</strong> relatively homogeneous lithology and<br />
generally low porosity of <strong>the</strong> b<strong>as</strong>ement rocks (MB p ) results<br />
in a tight clustering of data (Figure 5f) similar <strong>to</strong> that observed<br />
for <strong>the</strong> JS rocks. In every c<strong>as</strong>e where porosity variation<br />
is large, save for <strong>the</strong> CB package, resistivity decre<strong>as</strong>es<br />
with incre<strong>as</strong>ing porosity.<br />
The ranges of values for resistivity and chargeability are organized<br />
by lithostratigraphic package (with <strong>the</strong> exception<br />
Figure 5. Experimentally me<strong>as</strong>ured values of resistivity (Table 2) plotted against <strong>to</strong>tal porosity of each sample for <strong>the</strong> lithostratigraphic<br />
packages listed in Table 1: a) Chilcotin Group b<strong>as</strong>altic lav<strong>as</strong> (CB), b) Eocene volcanic and sedimentary rocks (EVS), c) Cretaceous<br />
volcanicl<strong>as</strong>tic and sedimentary rocks (KVS), d) Middle–Late Jur<strong>as</strong>sic sedimentary rocks (JS), e) Lower–Middle Jur<strong>as</strong>sic volcanic and sedimentary<br />
rocks (JVS), and f) Mesozoic b<strong>as</strong>ement rocks (MB p ). Resistivity commonly decre<strong>as</strong>es with porosity (cf. parts b–f). Samples of CB<br />
show two orders of magnitude variation in resistivity that does not correlate with porosity, <strong>the</strong> implication being that resistivity in <strong>the</strong>se b<strong>as</strong>alts<br />
is controlled by variations in crystallinity, grain size or bulk mineralogy.<br />
<strong>Geoscience</strong> <strong>BC</strong> Report 2012-1 139
Figure 6. Experimentally me<strong>as</strong>ured values of resistivity and chargeability (Table 2) plotted<br />
for all lithostratigraphic packages listed in Table 1: a) Eocene volcanic and sedimentary<br />
rocks (EVS), b) Cretaceous volcanicl<strong>as</strong>tic and sedimentary rocks (KVS), c) Middle–<br />
Late Jur<strong>as</strong>sic sedimentary rocks (JS), d) Lower–Middle Jur<strong>as</strong>sic volcanic and sedimentary<br />
rocks (JVS), and e) Mesozoic b<strong>as</strong>ement rocks (MB p ).<br />
140 <strong>Geoscience</strong> <strong>BC</strong> Summary of Activities 2011
of CB) in Figure 6a–e. The resistivity range of EVS (Figure<br />
6a) is less than three orders of magnitude, and chargeability<br />
varies by <strong>as</strong> much <strong>as</strong> four orders of magnitude. This<br />
broad range of values is largely controlled by lithology, although<br />
enhanced by <strong>the</strong> wide range of porosity in <strong>the</strong> EVS<br />
sample package. Resistivity me<strong>as</strong>urements were conducted<br />
under distilled water–saturated conditions. Such conditions<br />
are expected <strong>to</strong> dissolve any late-stage groundwaterderived<br />
mineral precipitates lining <strong>the</strong> pore spaces, <strong>the</strong>reby<br />
creating ionic pore fluids and a more conductive sample.<br />
However, <strong>as</strong> shown in Figure 5, resistivity decre<strong>as</strong>es with<br />
incre<strong>as</strong>ing preserved porosity, suggesting a paucity of such<br />
mineral precipitates in <strong>the</strong>se pore spaces. Likewise, KVS<br />
(Figure 6b) also demonstrates a broad range of resistivities<br />
and chargeabilities, testament <strong>to</strong> <strong>the</strong> broad range in lithology<br />
and variation in porosity of <strong>the</strong> sample package. The JS<br />
sample package (Figure 6c) ranges in resistivity and<br />
chargeability across two and a half orders of magnitude.<br />
The resistivity range of JVS (Figure 6d) is approximately<br />
2.5 orders of magnitude, where<strong>as</strong> <strong>the</strong> chargeability range of<br />
this package is slightly greater than one order of magnitude.<br />
The tighter range of chargeability values for both JS and<br />
JVS is controlled predominantly by lithology. Lithological<br />
variation within each package is limited, suggesting that<br />
any scatter in resistivity is due <strong>to</strong> porosity. The porosity of<br />
<strong>the</strong> JS package rocks is negligible compared <strong>to</strong> that of <strong>the</strong><br />
JVS package, suggesting that <strong>the</strong> narrower range of<br />
resistivities within <strong>the</strong> JS package is lithologically controlled.<br />
Figure 6e shows <strong>the</strong> ranges in resistivity (approximately<br />
two orders of magnitude) and chargeability (approximately<br />
one order of magnitude) for <strong>the</strong> MB p rocks.<br />
This package contains lithologically similar rocks<br />
(plu<strong>to</strong>nic rocks) of relatively low porosity, ensuring that <strong>the</strong><br />
range in me<strong>as</strong>ured electrical properties is small.<br />
The seismic properties of <strong>the</strong> Nechako B<strong>as</strong>in sample suite<br />
are possibly <strong>the</strong> most useful for package discrimination.<br />
Figure 7 displays <strong>the</strong> P-wave velocity (V P ) of <strong>the</strong> Chilcotin<br />
b<strong>as</strong>alts (CB) <strong>as</strong> a function of sample density under various<br />
confining pressures. D<strong>as</strong>hed lines indicate <strong>the</strong> corresponding<br />
porosities for all samples. It is clear that V P incre<strong>as</strong>es<br />
with decre<strong>as</strong>ing porosity and incre<strong>as</strong>ing confining pressure;<br />
V P is <strong>the</strong>refore highest for stronger, low-porosity<br />
rocks. With incre<strong>as</strong>ing confining pressure, V P incre<strong>as</strong>es <strong>as</strong><br />
pore space is closed and <strong>the</strong> rock becomes more coherent.<br />
Figure 8a–e shows <strong>the</strong> dry and wet V P and V S values for <strong>the</strong><br />
EVS, KVS, JS, JVS, and MB p lithological packages. Dry<br />
samples have lower V P /V S values (1.5-2) than water saturated<br />
samples (1.75-3). D<strong>as</strong>hed lines indicate V P /V S ratios<br />
of 1, 1.5, 2 and 3. Wet V P /V S ratios for all packages (1.75–3)<br />
are consistently higher than <strong>the</strong> same ratios calculated for<br />
dry samples (1.5–2; O’Connell and Budiansky, 1974). Figure<br />
8a (EVS), 8b (KVS) and 8d (JVS) shows <strong>the</strong> most variation<br />
in V P /V S ratios (1.5–3 for EVS and KVS), testament <strong>to</strong><br />
<strong>the</strong> variable lithology in each package (which includes both<br />
volcanic and sedimentary rocks of varying porosity). Ratios<br />
for <strong>the</strong> JS (Figure 8c) and MB p (Figure 8e) packages are<br />
relatively well constrained between 1.5 and 2. Ratios of<br />
V P :V S have been demonstrated <strong>to</strong> be strong indica<strong>to</strong>rs of<br />
variations in fluid-saturation conditions within rocks<br />
Figure 7. Plot of compressional-wave (P-wave) velocity (V P ) versus bulk density for core samples of Chilcotin<br />
b<strong>as</strong>alts. Both V P and density are me<strong>as</strong>ured on dry, <strong>as</strong> opposed <strong>to</strong> water-saturated, sample cores. Values<br />
of V P are me<strong>as</strong>ured under load pressures of 10, 50 and 100 MPa. D<strong>as</strong>hed lines denote model values of<br />
density for samples having <strong>to</strong>tal porosities () of 0%, 10% and 20%, and <strong>as</strong>suming a skeletal density of<br />
2.9 g/cc. Values of V P incre<strong>as</strong>e with incre<strong>as</strong>ing confining pressure (i.e., load) and decre<strong>as</strong>e with decre<strong>as</strong>ing<br />
porosity (incre<strong>as</strong>ing density).<br />
<strong>Geoscience</strong> <strong>BC</strong> Report 2012-1 141
Figure 8. Plots of compressional-wave velocity (V P ) versus shear-wave velocity (V S ) me<strong>as</strong>ured on dried (black symbols) and water-saturated<br />
(yellow symbols) cores taken from all samples (Table 2) except <strong>the</strong> CB package . Diagram is con<strong>to</strong>ured for ratios of V P /V S of 1, 1.5, 2<br />
and 3.<br />
142 <strong>Geoscience</strong> <strong>BC</strong> Summary of Activities 2011
(O’Connell and Budiansky, 1974). On this b<strong>as</strong>is, fur<strong>the</strong>r investigation<br />
of seismic velocities within <strong>the</strong> Nechako B<strong>as</strong>in<br />
could elucidate both density of crack distributions within<br />
<strong>the</strong> underlying stratigraphy and, more importantly, <strong>the</strong> degree<br />
of fluid saturation of <strong>the</strong>se cracks. The latter (e.g., fluid<br />
distribution) relates directly <strong>to</strong> our capacity <strong>to</strong> <strong>as</strong>sess <strong>the</strong><br />
hydrocarbon potential of <strong>the</strong> b<strong>as</strong>in.<br />
Figures 9–13 show <strong>the</strong> dependence of both dry and wet ultr<strong>as</strong>onic<br />
velocities on bulk density and porosity, and <strong>the</strong> dependence<br />
of dry and wet el<strong>as</strong>tic moduli on porosity. For all<br />
figures, (a) plots wet and dry P-wave velocities <strong>as</strong> a function<br />
of density; (b) plots wet and dry S-wave velocities <strong>as</strong> a<br />
function of density; (c) plots wet and dry P-wave velocities<br />
<strong>as</strong> a function of porosity; (d) plots wet and dry P-wave velocities<br />
<strong>as</strong> a function of porosity; (e) plots wet and dry<br />
Young’s modulus <strong>as</strong> a function of porosity; and (f) plots wet<br />
and dry Poisson’s ratio <strong>as</strong> a function of porosity. All dry ultr<strong>as</strong>onic<br />
velocities are plotted against dry bulk densities;<br />
likewise, all wet ultr<strong>as</strong>onic velocities are plotted <strong>as</strong> functions<br />
of <strong>the</strong>ir wet bulk densities. Each figure deals with a<br />
different package of rocks.<br />
The same relationships are observed in all plots (Figures 9–<br />
13), although those packages with both larger sample suites<br />
and greater heterogeneity in bulk density and porosity display<br />
<strong>the</strong>se relationships more clearly. Figures 9a–13a and<br />
9b–13b exhibit incre<strong>as</strong>ing ultr<strong>as</strong>onic velocity with incre<strong>as</strong>ing<br />
sample bulk density. Conversely, although perhaps intuitively,<br />
<strong>the</strong>se same ultr<strong>as</strong>onic velocities decre<strong>as</strong>e with<br />
incre<strong>as</strong>ing porosity (Figures 9c–13c and 9d–13d). The presence<br />
of dry void space or water-saturated void space affects<br />
both P- and S-wave velocities considerably for all rocks<br />
(O’Connell and Budiansky, 1976). Most samples exhibit<br />
higher ultr<strong>as</strong>onic velocities when saturated in water, and<br />
this becomes more pronounced with incre<strong>as</strong>ing porosity.<br />
El<strong>as</strong>tic moduli are frequency dependent (Walsh, 1965;<br />
O’Connell and Budiansky, 1976) and sensitive <strong>to</strong> sample<br />
saturation, which incre<strong>as</strong>es seismic velocity. Figures 9e–<br />
13e show that <strong>the</strong> Young’s modulus of all rocks decre<strong>as</strong>es<br />
with porosity, reflecting decre<strong>as</strong>ing stiffness (Walsh,<br />
1965). Poisson’s ratio is <strong>the</strong> ratio between transverse strain<br />
<strong>to</strong> longitudinal strain and can be estimated from <strong>the</strong> velocities<br />
of compressional (longitudinal) and shear (transverse)<br />
Figure 9. Dependence of dry and wet ultr<strong>as</strong>onic velocities on bulk density and porosity, and dependence of dry and wet el<strong>as</strong>tic moduli on<br />
porosity for Eocene volcanic and sedimentary rocks (EVS; Table 3): a) V P <strong>as</strong> a function of bulk density; b) V S <strong>as</strong> a function of bulk density;<br />
c) V P <strong>as</strong> a function of connected porosity; d) V S <strong>as</strong> a function of connected porosity; e) dynamic Young’s modulus (E d ) <strong>as</strong> a function of connected<br />
porosity; f) Poisson’s ratio (), calculated from me<strong>as</strong>ured values of V P and V S , <strong>as</strong> a function of connected porosity. In parts (a) and<br />
(b), dry ultr<strong>as</strong>onic velocities are plotted against dry bulk densities, and wet ultr<strong>as</strong>onic velocities against wet bulk densities. Values of V P and<br />
V S incre<strong>as</strong>e with bulk density and decre<strong>as</strong>e with porosity. Young’s Modulus decre<strong>as</strong>es with incre<strong>as</strong>ing porosity due <strong>to</strong> <strong>the</strong> inherent weakness<br />
of porous rock. V P and V S and moduli are consistently larger for water-saturated samples than for dry samples.<br />
<strong>Geoscience</strong> <strong>BC</strong> Report 2012-1 143
waves. Figures 9f–13f show that <strong>the</strong>re appears <strong>to</strong> be little<br />
relationship between <strong>the</strong> calculated Poisson’s ratios and<br />
porosities of <strong>the</strong> six Nechako B<strong>as</strong>in packages.<br />
Geophysical Discrimination within <strong>the</strong><br />
Nechako B<strong>as</strong>in<br />
In this section, we develop a decision table (Table 4) <strong>to</strong> facilitate<br />
geophysical discrimination of lithostratigraphic<br />
units in <strong>the</strong> subsurface <strong>to</strong> <strong>the</strong> Nechako B<strong>as</strong>in. We highlight<br />
<strong>the</strong> most reliable indices for discrimination between <strong>the</strong> six<br />
major lithostratigraphic packages described in Table 1.<br />
Each cell in Table 4 contains physical properties appropriate<br />
for distinguishing between <strong>the</strong> units of <strong>the</strong> intersecting<br />
column and row. This is not an exhaustive set of discrimina<strong>to</strong>rs.<br />
In part, <strong>the</strong> decision table reflects, and is limited by,<br />
<strong>the</strong> fact that we have packaged <strong>the</strong> rocks on <strong>the</strong> b<strong>as</strong>is of age,<br />
geography and lithology.<br />
The Miocene Chilcotin b<strong>as</strong>alts (CB) are one of <strong>the</strong> most distinctive<br />
lithostratigraphic packages underlying <strong>the</strong> Nechako<br />
B<strong>as</strong>in. These rocks have higher dry V p values (4.2–<br />
6.0 km/s) than <strong>the</strong> range of values observed for <strong>the</strong> Eocene<br />
volcanic and sedimentary (EVS) package (2.2–5.8 km/s).<br />
The V p values for CB rocks (4.2–6.0 km/s) overlap those<br />
me<strong>as</strong>ured for Cretaceous volcanicl<strong>as</strong>tic and sedimentary<br />
(KVS) rocks (1.6–6.2 km/s) but are generally higher; <strong>the</strong><br />
overlap is a reflection of <strong>the</strong> diverse range of V p values<br />
within <strong>the</strong> KVS package. The CB package is e<strong>as</strong>ily distinguished<br />
from rock types within <strong>the</strong> Middle–Late Jur<strong>as</strong>sic<br />
sedimentary (JS) package on <strong>the</strong> b<strong>as</strong>is of NRM. The CB<br />
package shows a large range of values from below detection<br />
(b.d.) <strong>to</strong> 48 A/m; in contr<strong>as</strong>t, <strong>the</strong> JS rocks have a limited<br />
range (b.d. <strong>to</strong> 1.0 A/m), and most samples have NRM values<br />
of
erty is porosity: <strong>the</strong> EVS package h<strong>as</strong> higher porosity<br />
(~30%) than <strong>the</strong> KVS package, which is consistently less<br />
than 17%. Although not ideal, this is <strong>the</strong> only viable way of<br />
distinguishing between <strong>the</strong> EVS and KVS packages. Rocks<br />
of <strong>the</strong> EVS package are e<strong>as</strong>ily distinguished from those of<br />
<strong>the</strong> JS package in <strong>the</strong> following ways: 1) NRM values for<br />
EVS rocks (b.d. <strong>to</strong> 28 A/m) are substantially higher than<br />
those of JS rocks (most are
KVS (V PDry KVS of 1.6–6.2 km/s; V SDry KVS of 1.0–3.5 km/s).<br />
The ranges of all physical properties for MB p rocks are consistently<br />
narrower than for KVS rocks, due <strong>to</strong> <strong>the</strong><br />
compositional and physical similarity of all <strong>the</strong> b<strong>as</strong>ement<br />
rocks. However, <strong>the</strong> ranges of values for every me<strong>as</strong>ured<br />
geophysical property of MB p rocks lie within <strong>the</strong> broader<br />
ranges of properties of <strong>the</strong> KVS package. Geophysical<br />
identification of MB p rocks in <strong>the</strong> subsurface thus requires<br />
<strong>the</strong> use of all properties.<br />
Jur<strong>as</strong>sic sedimentary (JS) rocks are poorly distinguished<br />
from <strong>the</strong> Jur<strong>as</strong>sic volcanic and sedimentary (JVS) package,<br />
but resistivity values may offer some potential. Although<br />
<strong>the</strong>re is overlap in resistivity values between JS and JVS,<br />
resistivities of JS rocks (460–49 883 m) are consistently<br />
higher than those of JVS rocks (46–12 338 m). The<br />
ranges of all physical properties for MB p are consistently<br />
narrower than those for JVS rocks but are fully enclosed by<br />
<strong>the</strong> large ranges of <strong>the</strong> JVS package. It is recommended that<br />
all <strong>the</strong> available properties be used when identifying MB p<br />
rocks in <strong>the</strong> subsurface.<br />
Both <strong>the</strong> JS and MB p packages represent lithologically<br />
well-defined rock packages that populate distinct geophysical-property<br />
ranges, which makes <strong>the</strong>ir distinction relatively<br />
e<strong>as</strong>y compared <strong>to</strong> o<strong>the</strong>r packages. Their ranges in resistivity<br />
and seismic velocity have relatively little overlap<br />
and are <strong>the</strong> most useful properties for discrimination. The<br />
resistivity range for JS rocks is 460–49 883 m, which is<br />
considerably higher than that for MB p (152–10 771 m).<br />
Ultr<strong>as</strong>onic velocities also offer adequate discrimination because<br />
JS velocities (V PDry JS of 4.20–5.85 km/s; V SDry JS of<br />
2.45–3.39 km/s) are higher than those of MB p rocks<br />
(V PDry MBp of 3.44–5.46 km/s; V SDry MBp of 2.00–3.15 km/s).<br />
Summary<br />
The Nechako B<strong>as</strong>in represents one of <strong>the</strong> most challenging<br />
are<strong>as</strong> for mineral and oil exploration in British Columbia.<br />
The challenge is that <strong>the</strong> b<strong>as</strong>in is likely <strong>to</strong> be underlain by<br />
stratigraphically and structurally complex geology. This<br />
complexity is exacerbated by <strong>the</strong> fact that <strong>the</strong> quality and<br />
distribution of bedrock exposure is highly variable; overall,<br />
<strong>the</strong> exposure is poor throughout <strong>the</strong> region. In addition,<br />
only a limited amount of knowledge of <strong>the</strong> subsurface geology<br />
h<strong>as</strong> been derived from previous oil-exploration efforts.<br />
These early oil-exploration efforts provided few drillholes<br />
and geophysical surveys. However, <strong>the</strong> l<strong>as</strong>t decade h<strong>as</strong> seen<br />
a tremendous incre<strong>as</strong>e in new knowledge derived from<br />
mapping (e.g., Riddell, 2006, 2011; Dohaney et al., 2010;<br />
Andrews et al., 2011; Bordet and Hart, 2011) and multi-<br />
Figure 12. Dependence of dry and wet ultr<strong>as</strong>onic velocities on bulk density and porosity, and dependence of dry and wet el<strong>as</strong>tic moduli on<br />
porosity for Lower–Middle Jur<strong>as</strong>sic volcanic and sedimentary rocks (JVS; Table 3): a) V P <strong>as</strong> a function of bulk density; b) V S <strong>as</strong> a function of<br />
bulk density; c) V P <strong>as</strong> a function of connected porosity; d) V S <strong>as</strong> a function of connected porosity; e) dynamic Young’s modulus (E d )<strong>as</strong>a<br />
function of connected porosity; f) Poisson’s ratio (), calculated from me<strong>as</strong>ured values of V P and V S , <strong>as</strong> a function of connected porosity. In<br />
parts (a) and (b), dry ultr<strong>as</strong>onic velocities are plotted against dry bulk densities, and wet ultr<strong>as</strong>onic velocities against wet bulk densities.<br />
146 <strong>Geoscience</strong> <strong>BC</strong> Summary of Activities 2011
Figure 13. Dependence of dry and wet ultr<strong>as</strong>onic velocities on bulk density and porosity, and dependence of dry and wet el<strong>as</strong>tic moduli on<br />
porosity for Mesozoic b<strong>as</strong>ement rocks (MB p ; Table 3): a) V P <strong>as</strong> a function of bulk density; b) V S <strong>as</strong> a function of bulk density; c) V P <strong>as</strong> a function<br />
of connected porosity; d) V S <strong>as</strong> a function of connected porosity; e) dynamic Young’s modulus (E d ) <strong>as</strong> a function of connected porosity;<br />
f) Poisson’s ratio (), calculated from me<strong>as</strong>ured values of V P and V S , <strong>as</strong> a function of connected porosity. In parts (a) and (b), dry ultr<strong>as</strong>onic<br />
velocities are plotted against dry bulk densities, and wet ultr<strong>as</strong>onic velocities against wet bulk densities.<br />
parameter geophysical surveys (e.g., Hayward and Calvert,<br />
2011; Idowu et al., 2011; Spratt and Craven, 2011).<br />
The range of possible geophysical responses from subsurface<br />
stratigraphic packages must be known in order <strong>to</strong> extract<br />
<strong>the</strong> maximum information from <strong>the</strong>se large-scale<br />
field-b<strong>as</strong>ed geophysical campaigns. The project reported<br />
here w<strong>as</strong> a field-supported experimental program designed<br />
<strong>to</strong> me<strong>as</strong>ure a broad range of physical and geophysical properties<br />
of rock samples representing <strong>the</strong> lithostratigraphic<br />
diversity of <strong>the</strong> subsurface <strong>to</strong> <strong>the</strong> Nechako B<strong>as</strong>in. We sampled<br />
more than 11 major formations or mappable stratigraphic<br />
units (Table 1; Figure 2) across an area of<br />
>50 000 km 2 (Figure 2).<br />
Me<strong>as</strong>urements were taken of <strong>the</strong> physical (e.g., density, porosity)<br />
and geophysical (e.g., chargeability, seismic velocity)<br />
properties of <strong>the</strong> sample suite, with <strong>the</strong> aim of providing<br />
data that would facilitate interpretation of geophysical surveys<br />
probing <strong>the</strong> Nechako B<strong>as</strong>in subsurface. The full range<br />
of me<strong>as</strong>urements included bulk density, porosity, magnetic<br />
susceptibility, remanent magnetization, electrical resistivity,<br />
induced-polarization chargeability and seismic-wave<br />
velocities. Ranges of values were <strong>the</strong>n determined for each<br />
Table 4. Decision table for discrimination of stratigraphic packages within <strong>the</strong> Nechako B<strong>as</strong>in on <strong>the</strong> b<strong>as</strong>is of physical and geophysical<br />
properties.<br />
<strong>Geoscience</strong> <strong>BC</strong> Report 2012-1 147
of six lithostratigraphic packages created by combining<br />
stratigraphic units on <strong>the</strong> b<strong>as</strong>is of age, lithology and geography.<br />
Our compilation culminated in a decision table that<br />
summarizes <strong>the</strong> best opportunities for discriminating stratigraphic<br />
packages within <strong>the</strong> subsurface. Some units are not<br />
e<strong>as</strong>ily distinguished (e.g., Eocene and Cretaceous sedimentary<br />
and volcanic rocks), but <strong>the</strong>re is good potential for discriminating<br />
between several important stratigraphic packages<br />
(Chilcotin b<strong>as</strong>alts and Cretaceous sedimentary and<br />
volcanic rocks). Henceforth, <strong>the</strong>se data should be used in<br />
<strong>the</strong> interpretation and reinterpretation of Nechako B<strong>as</strong>in<br />
geophysical surveys, and correlated with new and existing<br />
boreholes.<br />
Acknowledgments<br />
This study w<strong>as</strong> supported by <strong>Geoscience</strong> <strong>BC</strong> project grant<br />
2008-028 and Geological Survey of Canada contract<br />
23254-096844-001-VAN, awarded <strong>to</strong> JKR. We thank<br />
J. Riddell, B. Struik, M. Mihalynuk, K. MacLaurin and<br />
P. Mustard for providing <strong>the</strong>ir archived samples. Sample<br />
preparation at U<strong>BC</strong> w<strong>as</strong> conducted by P. Van de Reep and<br />
H. Dhillon. H. Lin<strong>to</strong>n and A. Tkachyk performed <strong>the</strong> lab<br />
work at <strong>the</strong> Geological Survey of Canada. Figure 1 w<strong>as</strong> created<br />
by F. Ma of <strong>Geoscience</strong> <strong>BC</strong>. The authors thank<br />
L. Porritt and S. Kolzenburg for peer review comments that<br />
helped clarify <strong>the</strong> paper.<br />
References<br />
Andrews, G., Quane, S., Enkin, R.J., Russell, K., Kushnir, A., Kennedy,<br />
L., Hayward, N., and Heap, M. (2011): Rock physical<br />
property me<strong>as</strong>urements <strong>to</strong> aid geophysical surveys in <strong>the</strong><br />
Nechako B<strong>as</strong>in oil and g<strong>as</strong> region, central British Columbia;<br />
<strong>Geoscience</strong> <strong>BC</strong>, Report 2011-6, 40 p. and Excel ® datab<strong>as</strong>e,<br />
URL <br />
[November 2011].<br />
Andrews, G.D.M., Plouffe, A., Ferbey, T., Russell, J.K., Brown,<br />
S.R. and Anderson, R.G. (2011): The thickness of Neogene<br />
and Quaternary cover across <strong>the</strong> central Interior Plateau,<br />
British Columbia: analysis of water-well drill records and<br />
implications for mineral exploration potential; Canadian<br />
Journal of Earth Sciences, v. 48, p. 973–986.<br />
Andrews, G.D.M. and Russell, J.K. (2007): Mineral exploration<br />
potential beneath <strong>the</strong> Chilcotin Group (NTS 092O, P, 093A,<br />
B, C, F, G, I, J, K), south-central British Columbia: preliminary<br />
insights from volcanic facies analysis; in Geological<br />
Fieldwork 2006, <strong>BC</strong> Ministry of Energy and Mines, Paper<br />
2007-1 and <strong>Geoscience</strong> <strong>BC</strong>, Report 2007-1, p. 229–238,<br />
URL [November 2011].<br />
Andrews, G.D.M. and Russell, J.K. (2008): Cover thickness across<br />
<strong>the</strong> sou<strong>the</strong>rn Interior Plateau, British Columbia (NTS 092O,<br />
P; 093A, B, C, F): constraints from water-well records; in<br />
<strong>Geoscience</strong> <strong>BC</strong> Summary of Activities 2007, <strong>Geoscience</strong><br />
<strong>BC</strong>, Report 2008-1, p. 11–20, URL [November 2011].<br />
Bordet, E. and Hart, C.J.R. (2011): Characterization and structural<br />
framework of Eocene volcanic sequences in <strong>the</strong> Nechako region,<br />
central British Columbia (NTS 092N, O, 093B, C, G);<br />
in <strong>Geoscience</strong> <strong>BC</strong> Summary of Activities 2010, <strong>Geoscience</strong><br />
<strong>BC</strong>, Report 2011-1, p. 239–254, URL [November 2011].<br />
Calvert,A.J.,Hayward,N.,Smithyman,B.R.andTakham<br />
Takougang E.M. (2009): Vibroseis survey acquisition in <strong>the</strong><br />
central Nechako B<strong>as</strong>in, south-central British Columbia; in<br />
<strong>Geoscience</strong> <strong>BC</strong> Summary of Activities 2008, <strong>Geoscience</strong><br />
<strong>BC</strong>, Report 2009-1, p. 145–150, URL [November 2011].<br />
Dohaney, J., Andrews, G.D.M., Russell, J.K. and Anderson, R.G.<br />
(2010): Distribution of <strong>the</strong> Chilcotin Group, T<strong>as</strong>eko Lakes<br />
and Bonaparte Lake map are<strong>as</strong>, British Columbia; Geological<br />
Survey of Canada, Open File 6344, URL [November<br />
2011].<br />
Ferri, F. and Riddell, J. (2006): The Nechako B<strong>as</strong>in project: new<br />
insights from <strong>the</strong> sou<strong>the</strong>rn Nechako B<strong>as</strong>in; in Summary of<br />
Activities 2006, <strong>BC</strong> Ministry of Energy and Mines, pages<br />
89–124, URL [November 2011].<br />
Hannigan, P., Lee, P.J., Osadetz, K.G., Dietrich, J.R. and Olsen-<br />
Heise, K. (1994): Oil and g<strong>as</strong> resource potential of <strong>the</strong><br />
Nechako-Chilcotin area of British Columbia; <strong>BC</strong> Ministry<br />
of Energy and Mines, Geo<strong>file</strong> 2001-6, 38 p. plus appendices<br />
and maps, URL http://www.empr.gov.bc.ca/Mining/<br />
<strong>Geoscience</strong>/PublicationsCatalogue/GeoFiles/Pages/2001-<br />
6.<strong>as</strong>px [November 2011].<br />
Hayes, B.J. (2002): Petroleum exploration potential of <strong>the</strong><br />
Nechako B<strong>as</strong>in, British Columbia; <strong>BC</strong> Ministry of Energy<br />
and Mines, Petroleum Geology Special Paper 2002-3.<br />
Hayward, N. and Calvert, A.J. (2009): Eocene and Neogene volcanic<br />
rocks in <strong>the</strong> sou<strong>the</strong><strong>as</strong>tern Nechako B<strong>as</strong>in, British Columbia:<br />
interpretation of <strong>the</strong> Canadian Hunter seismic reflection<br />
surveys using first-arrival <strong>to</strong>mography; Canadian Journal of<br />
Earth Sciences, v. 46, p. 707–720.<br />
Hayward, N. and Calvert, A.J. (2011): Interpretation of structures<br />
in <strong>the</strong> sou<strong>the</strong><strong>as</strong>tern Nechako B<strong>as</strong>in, British Columbia, from<br />
seismic reflection, well log, and potential field data; Canadian<br />
Journal of Earth Sciences, v. 48, p. 1000–1020.<br />
Idowu, O.A., Frederiksen, A.W. and C<strong>as</strong>sidy, J.F. (2011): Imaging<br />
<strong>the</strong> Nechako B<strong>as</strong>in, British Columbia, using ambient seismic<br />
noise; Canadian Journal of Earth Sciences, v. 48, p.<br />
1038–1049.<br />
Katsube, T.J. (2001): An analytical procedure for determining<br />
spectral induced polarization characteristics of anisotropic<br />
rocks, Yellowknife mining district, Northwest Terri<strong>to</strong>ries;<br />
Geological Survey of Canada, Current Research 2001-E3,<br />
29 p., URL [November 2011].<br />
Kim, H-S. (2010): Mapping crustal structure of <strong>the</strong> Nechako B<strong>as</strong>in<br />
using teleseismic receiver functions; M.Sc. <strong>the</strong>sis, University<br />
of Vic<strong>to</strong>ria, Vic<strong>to</strong>ria, <strong>BC</strong>, 112 p.<br />
MacLaurin, C.I., Mahoney, J.B., James W. Haggart, J.W., Goodin,<br />
J.R. and Mustard, P.S. (2011): The Jack<strong>as</strong>s Mountain Group<br />
of south-central British Columbia: depositional setting and<br />
evolution of an Early Cretaceous deltaic complex; Canadian<br />
Journal of Earth Sciences, v. 48, p. 930–951,<br />
doi:10.1139/e11-035<br />
148 <strong>Geoscience</strong> <strong>BC</strong> Summary of Activities 2011
Mihalynuk, M.G., Orovan, E.A., Larocque, J.P., Friedman, R.M.<br />
and Bachiu, T. (2009): Geology, geochronology and mineralization<br />
of <strong>the</strong> Chilanko Forks <strong>to</strong> sou<strong>the</strong>rn Clusko River<br />
area, west-central British Columbia (NTS 093C/01, 08,<br />
09S); in Geological Fieldwork 2008, <strong>BC</strong> Ministry of Energy<br />
and Mines, Paper 2009-1, p. 81–100, URL <br />
[November 2011].<br />
Mira <strong>Geoscience</strong> (2008): Development and application of a rock<br />
property datab<strong>as</strong>e for British Columbia; <strong>Geoscience</strong> <strong>BC</strong>,<br />
Report 2008-9, 66 p., URL [November 2011].<br />
O’Connell, R.J. and Budiansky, B. (1974): Seismic velocities in<br />
dry and saturated cracked solids; Journal of Geophysical<br />
Research, v. 79, p. 5412–5426.<br />
Parsons, S., McGaughey, J., Mitchinson, D., Phillips, N. and Lane,<br />
T.E. (2009): Development and application of a rock property<br />
datab<strong>as</strong>e for British Columbia; in <strong>Geoscience</strong> <strong>BC</strong> Summary<br />
of Activities 2008, <strong>Geoscience</strong> <strong>BC</strong>, Report 2009-1, p. 137–<br />
144, URL [November<br />
2011].<br />
Riddell, J.M. (2006): Geology of <strong>the</strong> sou<strong>the</strong>rn Nechako B<strong>as</strong>in; <strong>BC</strong><br />
Ministry of Energy and Mines, Oil and G<strong>as</strong> Division, Petroleum<br />
Geology Map 2006-1, scale 1:400 000.<br />
Riddell, J.M. (2011): Lithostratigraphic and tec<strong>to</strong>nic framework of<br />
Jur<strong>as</strong>sic and Cretaceous Intermontane sedimentary b<strong>as</strong>ins of<br />
south-central British Columbia; Canadian Journal of Earth<br />
Sciences, v. 48, no. 6, p. 870–896, doi:10.1139/e11-034<br />
Salisbury, M. and Iuliucci, R. (2011): Physical rock properties datab<strong>as</strong>e;<br />
Geological Survey of Canada–Atlantic, URL<br />
[November<br />
2011].<br />
Spratt, J. and Craven, J. (2011): Near-surface and crustal-scale images<br />
of <strong>the</strong> Nechako b<strong>as</strong>in, British Columbia, Canada, from<br />
magne<strong>to</strong>telluric investigations; Canadian Journal of Earth<br />
Sciences, v. 48, p. 987–999.<br />
Sumner, J.S. (1976): Principles of Induced Polarization for Geophysical<br />
Exploration; Elsevier Scientific Publishing Company,<br />
Amsterdam., The Ne<strong>the</strong>rlands, 277 p.<br />
Telford, W.M., Geldart, L.P., Sheriff, R.E. and Keys, D.A. (1976):<br />
Applied Geophysics; Cambridge University Press, London,<br />
United Kingdom, 860 p.<br />
Walsh, J.B. (1965): The effect of cracks on <strong>the</strong> compressibility of<br />
rock; Journal of Geophysical Research, v. 70, p. 381–389.<br />
<strong>Geoscience</strong> <strong>BC</strong> Report 2012-1 149
150 <strong>Geoscience</strong> <strong>BC</strong> Summary of Activities 2011
Analysis of Magne<strong>to</strong>telluric Transfer Functions <strong>to</strong> Determine <strong>the</strong> Usefulness of<br />
ZTEM Data in <strong>the</strong> Nechako B<strong>as</strong>in, South-Central British Columbia (Parts of NTS<br />
092O, N, 093B, C, F, G)<br />
J.E. Spratt, Geophysical Consultant, Wakefield, QC, jessic<strong>as</strong>pratt@sympatico.ca<br />
C.G. Farquharson, Memorial University of Newfoundland, St. John’s, NL<br />
J.A. Craven, Natural Resources Canada, Geological Survey of Canada–Central Canada, Ottawa, ON<br />
Spratt, J.E., Farquharson, C.G. and Craven, J.A. (2012): Analysis of magne<strong>to</strong>telluric transfer functions <strong>to</strong> determine <strong>the</strong> usefulness of<br />
ZTEM data in <strong>the</strong> Nechako B<strong>as</strong>in, south-central British Columbia (parts of NTS 092O, N, 093B, C, F, G); in <strong>Geoscience</strong> <strong>BC</strong> Summary of<br />
Activities 2011, <strong>Geoscience</strong> <strong>BC</strong>, Report 2012-1, p. 151–162.<br />
Introduction<br />
As part of <strong>Geoscience</strong> <strong>BC</strong>’s initiative <strong>to</strong> develop <strong>the</strong> potential<br />
for hydrocarbon resources in central British Columbia<br />
(<strong>BC</strong>), several geological and geophysical projects have<br />
been undertaken within <strong>the</strong> Nechako B<strong>as</strong>in, including a<br />
high-density broadband and audio-magne<strong>to</strong>telluric survey.<br />
The Nechako B<strong>as</strong>in is an Upper Cretaceous <strong>to</strong> Oligocene<br />
sedimentary b<strong>as</strong>in located in <strong>the</strong> interior plateau of <strong>BC</strong> between<br />
<strong>the</strong> Co<strong>as</strong>tal Mountains and <strong>the</strong> Rocky Mountains<br />
(Figure 1). The potential for reservoir sands h<strong>as</strong> been noted<br />
in <strong>the</strong> Cretaceous sedimentary packages of <strong>the</strong> b<strong>as</strong>in (Hannigan<br />
et al., 1994; Riddell, 2006); however, <strong>the</strong>se packages<br />
are extensively overlain by variable thicknesses of Eocene<br />
and Neogene volcanics, <strong>as</strong> well <strong>as</strong> Quaternary and glacial<br />
deposits, thus limiting <strong>the</strong> surficial exposure of <strong>the</strong> sediments<br />
and interfering with interpretations of <strong>the</strong> subsurface<br />
structure. Magne<strong>to</strong>telluric (MT) data collected within <strong>the</strong><br />
Nechako B<strong>as</strong>in in 2007 were used successfully <strong>to</strong> image <strong>the</strong><br />
conductivity structure beneath two-dimensional (2-D) pro<strong>file</strong>s<br />
and show that <strong>the</strong> method can differentiate between<br />
varying rock types and identify structural features in <strong>the</strong><br />
subsurface (Spratt and Craven, 2011).<br />
Keywords: Nechako B<strong>as</strong>in, magne<strong>to</strong>tellurics, ZTEM, hydrocarbon<br />
exploration, electromagnetics<br />
This publication is also available, free of charge, <strong>as</strong> colour digital<br />
<strong>file</strong>s in Adobe Acrobat ® <strong>PDF</strong> format from <strong>the</strong> <strong>Geoscience</strong> <strong>BC</strong> website:<br />
http://www.geosciencebc.com/s/DataRele<strong>as</strong>es.<strong>as</strong>p.<br />
Figure 1. Location of <strong>the</strong> Nechako B<strong>as</strong>in and <strong>the</strong> magne<strong>to</strong>telluric<br />
survey area.<br />
It h<strong>as</strong> been suggested that acquiring airborne z-axis tipper<br />
electromagnetic (ZTEM) data over <strong>the</strong> Nechako B<strong>as</strong>in could<br />
be useful for mapping <strong>the</strong> thickness of overlying volcanic<br />
layers and identifying are<strong>as</strong> of reservoir potential, particularly<br />
in <strong>the</strong> regions between <strong>the</strong> MT pro<strong>file</strong>s where <strong>the</strong> conductivity<br />
structure is unknown. The ZTEM method me<strong>as</strong>ures<br />
airborne electromagnetic data that provide information<br />
on <strong>the</strong> 3-D conductivity structure of <strong>the</strong> shallow subsurface.<br />
It is a cost-effective way <strong>to</strong> record tipper data, calculated<br />
from <strong>the</strong> vertical component of <strong>the</strong> magnetic field,<br />
over a broad region with a high-density sampling distribution;<br />
however, <strong>the</strong> data are not sensitive <strong>to</strong> 1-D layers (Holtham<br />
and Oldenburg, 2010), and limitations on <strong>the</strong> frequencies<br />
me<strong>as</strong>ured may result in low resolution of <strong>the</strong> models<br />
and shallow penetration depths. As MT data record <strong>the</strong> horizontal<br />
and vertical components of magnetic field, along<br />
with <strong>the</strong> electric fields, <strong>the</strong> tipper data are available at each<br />
recorded site. Transfer functions from me<strong>as</strong>ured MT data,<br />
<strong>as</strong> well <strong>as</strong> syn<strong>the</strong>tic data calculated from <strong>the</strong> existing 2-D<br />
conductivity models, have been analyzed <strong>to</strong> determine which<br />
features could be resolved with additional airborne ZTEM<br />
data.<br />
Geological and Geophysical Background<br />
Geological Setting<br />
A series of Mesozoic and Cenozoic cl<strong>as</strong>tic b<strong>as</strong>ins formed<br />
within <strong>the</strong> Intermontane Belt of <strong>the</strong> Canadian Cordillera in<br />
response <strong>to</strong> oceanic and island-arc terrane amalgamation<br />
along <strong>the</strong> western edge of ancestral North America (Mon-<br />
<strong>Geoscience</strong> <strong>BC</strong> Report 2012-1 151
ger et al., 1972, 1982; Gabrielse and Yorath, 1991). Postaccretionary<br />
sedimentary and volcanic sequences are preserved<br />
in <strong>the</strong> study area within <strong>the</strong> Nechako B<strong>as</strong>in. These are underlain<br />
by <strong>the</strong> Carboniferous <strong>to</strong> Early Cretaceous Stikine island-arc<br />
terrane and <strong>the</strong> Permian <strong>to</strong> Middle Tri<strong>as</strong>sic oceanic<br />
Cache Creek terrane. Extension during <strong>the</strong> Eocene resulted<br />
in magmatism, regional transcurrent faulting and volcanism<br />
(Price, 1994; Struik and MacIntyre, 2001). Volcanism during<br />
<strong>the</strong> Miocene and Pliocene produced <strong>the</strong> mafic volcanic<br />
rocks that blanket much of <strong>the</strong> region (Ma<strong>the</strong>ws, 1989; Andrews<br />
and Russell, 2007).<br />
The Nechako B<strong>as</strong>in is up <strong>to</strong> 5 km thick and consists of three<br />
primary geological elements: Early Cretaceous cl<strong>as</strong>tic marine<br />
and fluvial rocks of <strong>the</strong> Taylor Creek and Skeena<br />
groups, Eocene volcanicl<strong>as</strong>tic rocks that include <strong>the</strong> Endako<br />
and Ootsa Lake groups, and Neogene Chilcotin Group<br />
b<strong>as</strong>alts (Figure 2). The Taylor Creek and Skeena groups in<br />
<strong>the</strong> study area are composed of interbedded chert, pebble<br />
conglomerate, sands<strong>to</strong>ne, silts<strong>to</strong>ne and shale (Riddell,<br />
2006). The Endako Group comprises andesitic <strong>to</strong> b<strong>as</strong>altic<br />
volcanic flows, tuff, breccia and minor amounts of sedimentary<br />
rocks (Riddell, 2006), where<strong>as</strong> <strong>the</strong> Ootsa Lake<br />
Group h<strong>as</strong> intermediate <strong>to</strong> felsic flows and a higher amount<br />
of sedimentary material (Riddell, 2006, 2011). The nearhorizontal<br />
b<strong>as</strong>altic flows of <strong>the</strong> Chilcotin Group blanket<br />
portions of <strong>the</strong> region with an average thickness of
Skeena groups (Riddell et al., 2007). Interpretations of<br />
early 1980s Canadian Hunter gravity and seismic data, <strong>as</strong><br />
well <strong>as</strong> new seismic data collected by <strong>Geoscience</strong> <strong>BC</strong> in<br />
2008, suggest that <strong>the</strong> sedimentary packages are located in<br />
separate sub-b<strong>as</strong>ins ra<strong>the</strong>r than one larger b<strong>as</strong>in (Hayward<br />
and Calvert, 2008; Calvert at al., 2011). This implies that<br />
<strong>the</strong> units with hydrocarbon potential may not regionally underlie<br />
<strong>the</strong> extensive volcanic cover. Locating <strong>the</strong> regional<br />
extent of Cretaceous sedimentary rocks is <strong>the</strong>refore crucial<br />
in developing an understanding of this potential. The presence<br />
of near-surface volcanic rocks significantly complicates<br />
<strong>the</strong> interpretation of some geophysical methods.<br />
Overview of Magne<strong>to</strong>telluric Results<br />
The magne<strong>to</strong>telluric (MT) method provides information on<br />
<strong>the</strong> present-day, in situ electrical conductivity of <strong>the</strong> subsurface<br />
by me<strong>as</strong>uring natural time-varying electromagnetic<br />
fields at <strong>the</strong> Earth’s surface (e.g., Jones, 1992). The MT<br />
method involves comparison of <strong>the</strong> horizontal components<br />
of <strong>the</strong> electric and magnetic fields of <strong>the</strong> Earth, me<strong>as</strong>ured at<br />
<strong>the</strong> surface. These are related <strong>to</strong> each o<strong>the</strong>r by a 2 by 2 complex<br />
impedance tensor that varies <strong>as</strong> a function of frequency<br />
and position of observation (Wait, 1962). The vertical<br />
magnetic field is also recorded and is related <strong>to</strong> <strong>the</strong> horizontal<br />
magnetic components by <strong>the</strong> geomagnetic-transfer<br />
function (TF). The depth of penetration of <strong>the</strong> fields is dependent<br />
on frequency (i.e., <strong>the</strong> lower <strong>the</strong> frequency <strong>the</strong><br />
greater <strong>the</strong> depth) and <strong>the</strong> resistivity of <strong>the</strong> material (i.e., <strong>the</strong><br />
greater <strong>the</strong> resistivity, <strong>the</strong> greater <strong>the</strong> depth; Cagniard,<br />
1953). The transverse electric (TE) and transverse magnetic<br />
(TM) modes of electromagnetic (EM)–field propagation<br />
refer <strong>to</strong> <strong>the</strong> directions parallel and perpendicular <strong>to</strong><br />
geoelectric strike, respectively. Modelling <strong>the</strong> vertical<br />
field-transfer functions, typically displayed <strong>as</strong> induction<br />
vec<strong>to</strong>rs that point <strong>to</strong>wards current concentrations in <strong>the</strong><br />
Earth, can identify conduc<strong>to</strong>rs in <strong>the</strong> subsurface.<br />
In <strong>the</strong> fall of 2007, combined high-frequency audiomagne<strong>to</strong>telluric<br />
(AMT) and broadband magne<strong>to</strong>telluric<br />
(BBMT) data were collected at a <strong>to</strong>tal of 734 sites through<br />
<strong>the</strong> sou<strong>the</strong>rn part of <strong>the</strong> Nechako B<strong>as</strong>in at a site spacing of<br />
500 ·m) is interpreted<br />
<strong>as</strong> <strong>the</strong> Chilcotin b<strong>as</strong>alts, which blanket portions of<br />
<strong>the</strong> region <strong>to</strong> depths of
Figure 3. Two-dimensional conductivity models and interpretations for a) pro<strong>file</strong> A, b) pro<strong>file</strong> B, c) pro<strong>file</strong> C, and d) pro<strong>file</strong> F. The red d<strong>as</strong>hed<br />
line illustrates <strong>the</strong> interpreted b<strong>as</strong>e of <strong>the</strong> Nechako B<strong>as</strong>in and <strong>the</strong> black lines represent faults.<br />
154 <strong>Geoscience</strong> <strong>BC</strong> Summary of Activities 2011
Group (>500 ·m), 900 m in <strong>the</strong> Cretaceous groups (10–<br />
100 ·m) and 200 m in <strong>the</strong> Eocene group (
field data were recorded in <strong>the</strong> BBMT range (200–<br />
0.0001 Hz) at <strong>the</strong> first site (Figure 5a) and <strong>the</strong> AMT range<br />
(10 000–1 Hz) at <strong>the</strong> second site (Figure 5e), and no vertical-field<br />
data were recorded at <strong>the</strong> third site (Figure 4). In<br />
general, <strong>the</strong> data quality is excellent <strong>to</strong> periods below 1 s<br />
(Figure 5a, e). Figure 5 shows examples of different fre-<br />
156 <strong>Geoscience</strong> <strong>BC</strong> Summary of Activities 2011
quency ranges used in various 2-D model inversions for<br />
two sites: one located above conductive Eocene volcanicl<strong>as</strong>tic<br />
rocks (Figure 5a–d) and <strong>the</strong> o<strong>the</strong>r located above exposed<br />
Cretaceous sedimentary units (Figure 5e–h).<br />
Deriving Syn<strong>the</strong>tic Data<br />
Syn<strong>the</strong>tic transfer-function data have been computed from<br />
<strong>the</strong> 2-D conductivity models produced by <strong>the</strong> inversion of<br />
all components of <strong>the</strong> MT data using <strong>the</strong> GEOSYSTEM<br />
SRL WinGlink ® MT interpretation software package (Figures<br />
5b, f). The data have been computed at a site spacing of<br />
100 m along each of <strong>the</strong> MT pro<strong>file</strong>s, a site spacing that<br />
reaches <strong>the</strong> limit of <strong>the</strong> modelling program. These syn<strong>the</strong>tic<br />
data have been generated by creating additional sites along<br />
<strong>the</strong> pro<strong>file</strong>s, importing <strong>the</strong> final 2-D models, running a forward<br />
inversion and <strong>the</strong>n saving <strong>the</strong> calculated responses <strong>as</strong><br />
station data. Note that no noise w<strong>as</strong> added <strong>to</strong> <strong>the</strong> syn<strong>the</strong>tic<br />
data. New models were <strong>the</strong>n generated along <strong>the</strong> pro<strong>file</strong>s<br />
using <strong>the</strong>se syn<strong>the</strong>tic data and various frequency ranges:<br />
<strong>the</strong> <strong>entire</strong> frequency range (0.001–10 000 Hz, Figure 5b, f),<br />
<strong>the</strong> frequency range of <strong>the</strong> ZTEM data (22–2800 Hz, Figure<br />
5c, 5h), and <strong>the</strong> specific frequencies used in <strong>the</strong> ZTEM surveys<br />
(Figure 5d, 5h).<br />
Two-Dimensional Modelling<br />
Several 2-D conductivity models have been generated, using<br />
<strong>the</strong> WinGlink ® interpretation software package, along<br />
<strong>the</strong> main MT pro<strong>file</strong>s. More than 200 iterations have been<br />
employed in <strong>the</strong> inversion for each model, using ei<strong>the</strong>r <strong>the</strong><br />
me<strong>as</strong>ured or <strong>the</strong> syn<strong>the</strong>tic transfer-function data at various<br />
frequencies. Examples of <strong>the</strong> data used in <strong>the</strong> various models<br />
are shown in Figure 5. Each inversion w<strong>as</strong> initiated with<br />
a uniform half space of 500 ·m <strong>as</strong> a starting model. The inversions<br />
of me<strong>as</strong>ured data used a smoothing value (tau)<br />
of 3, a Tyz absolute data-error floor of 0.01 and existing<br />
data errors. Each inversion of syn<strong>the</strong>tic data used a tau of 3,<br />
a Tyz absolute data-error floor of 0.001 and a standard deviationerrorof1%.<br />
Two-dimensional inversions were carried out on <strong>the</strong> me<strong>as</strong>ured<br />
2007 MT magnetic-transfer functions (e.g., Figure<br />
5a, e). The results of <strong>the</strong>se inversions serve <strong>as</strong> a bench mark<br />
Figure 5. Plots of <strong>the</strong> tipper magnitude for two sites at <strong>the</strong> various<br />
frequency distributions included in inversions: a) me<strong>as</strong>ured data<br />
from broadband-magne<strong>to</strong>telluric (BBMT) site dd22amm, located<br />
above <strong>the</strong> conductive Eocene volcanicl<strong>as</strong>tic rocks; b) syn<strong>the</strong>tic<br />
data derived from <strong>the</strong> 2-D magne<strong>to</strong>telluric (MT) model at site<br />
dd22amm; c) syn<strong>the</strong>tic data at site dd22amm, over <strong>the</strong> z-axis tipper<br />
electromagnetic (ZTEM) period range; d) syn<strong>the</strong>tic data at site<br />
dd22amm, at <strong>the</strong> periods typically analyzed using <strong>the</strong> ZTEM<br />
method; e) me<strong>as</strong>ured data from high-frequency audiomagne<strong>to</strong>telluric<br />
(AMT) site dl19aam, located above exposed Cretaceous<br />
sedimentary rocks; f) syn<strong>the</strong>tic data derived from <strong>the</strong> 2-D<br />
MT model at site dl19aam; g) syn<strong>the</strong>tic data at site dl19aam, over<br />
<strong>the</strong> ZTEM period range; and h) syn<strong>the</strong>tic data at site dl19aam, at<br />
<strong>the</strong> periods typically analyzed using <strong>the</strong> ZTEM method.<br />
against which <strong>the</strong> results obtained from <strong>the</strong> syn<strong>the</strong>tic<br />
ZTEM data can be me<strong>as</strong>ured. The subset of <strong>the</strong> me<strong>as</strong>ured<br />
vertical-field MT data that corresponds <strong>to</strong> <strong>the</strong> frequency<br />
range appropriate for ZTEM surveys h<strong>as</strong> been modelled <strong>to</strong><br />
show what can be obtained from ZTEM data were <strong>the</strong>y <strong>to</strong><br />
be collected along <strong>the</strong> MT pro<strong>file</strong>s, and under <strong>the</strong> best possible<br />
conditions. The syn<strong>the</strong>tic transfer-function data have<br />
been inverted using data in <strong>the</strong> MT me<strong>as</strong>urable frequency<br />
range (0.001–10000 Hz; Figure 5b, f), in <strong>the</strong> ZTEM me<strong>as</strong>urable<br />
range (22–2800 Hz; Figure 5c, g) and at <strong>the</strong> six frequencies<br />
specific <strong>to</strong> typical ZTEM analysis (30, 45, 90,<br />
180, 360, 720 Hz; Figure 5d, h).<br />
Results and Conclusion<br />
Results of <strong>the</strong> 2-D modelling of pro<strong>file</strong>s A, B, C, and F are<br />
presented in Figures 6–9. For each pro<strong>file</strong>, <strong>the</strong> original 2-D<br />
model derived from all three components of <strong>the</strong> data me<strong>as</strong>ured<br />
and at each MT site location over <strong>the</strong> <strong>entire</strong> me<strong>as</strong>ured<br />
frequency range are shown (Figures 6a, 7a, 8a, 9a). Also<br />
shown are models derived using only <strong>the</strong> HZ component of<br />
<strong>the</strong> me<strong>as</strong>ured data over <strong>the</strong> <strong>entire</strong> frequency range (Figures<br />
6c, 7b, 8b, 9b); models derived from <strong>the</strong> HZ component<br />
of <strong>the</strong> me<strong>as</strong>ured data at <strong>the</strong> recordable ZTEM frequency<br />
range (Figures 6d, 7c, 8c, 9c); and models<br />
generated using only <strong>the</strong> HZ component of <strong>the</strong> syn<strong>the</strong>tic<br />
data over <strong>the</strong> <strong>entire</strong> frequency range (Figures 6e, 7d,<br />
8d, 9d), at <strong>the</strong> recordable ZTEM frequency range (Figures<br />
6f, 7e, 8e, 9e) and at <strong>the</strong> specific frequency used in<br />
ZTEM surveys (Figure 6g, 7f, 8f, 9f).<br />
In order <strong>to</strong> test <strong>the</strong> modelling parameters applied, an additional<br />
model w<strong>as</strong> generated along pro<strong>file</strong> A by inverting all<br />
three components of <strong>the</strong> syn<strong>the</strong>tic MT data (TM-mode, TEmode<br />
and transfer-function HZ data; Figure 6b). When<br />
compared <strong>to</strong> <strong>the</strong> original 2-D model, <strong>the</strong> syn<strong>the</strong>tic data<br />
show good resolution of <strong>the</strong> subsurface-conductivity structure,<br />
indicating that <strong>the</strong> modelling program and selected parameters<br />
are capable of generating an accurate image of <strong>the</strong><br />
subsurface-conductivity structure. Modelling of <strong>the</strong> transfer<br />
functions from me<strong>as</strong>ured MT data alone does not appear<br />
<strong>to</strong> resolve <strong>the</strong> subsurface-conductivity structure along any<br />
of <strong>the</strong> pro<strong>file</strong>s, regardless of <strong>the</strong> frequency range that w<strong>as</strong><br />
inverted (Figures 6c, 6d, 7b, 7c, 8b, 8c, 9b, 9c). This may be<br />
due <strong>to</strong> inherent errors <strong>as</strong>sociated with real data and, if so, it<br />
should be noted that we expect <strong>the</strong> airborne data <strong>to</strong> have<br />
higher errors. It could also be a result of <strong>the</strong> large station<br />
spacing compared <strong>to</strong> airborne ZTEM surveys. Along pro<strong>file</strong><br />
A, syn<strong>the</strong>tic data were modelled at <strong>the</strong> me<strong>as</strong>ured station<br />
spacing for comparison with those modelled at a spacing of<br />
100 m. Additionally, a model w<strong>as</strong> generated for a small section<br />
at <strong>the</strong> e<strong>as</strong>ternmost end of pro<strong>file</strong> A using syn<strong>the</strong>tic data<br />
at a site spacing of 25 m. Although <strong>the</strong> resulting model w<strong>as</strong><br />
much smoo<strong>the</strong>r, <strong>the</strong> structural resolution w<strong>as</strong> not improved<br />
with a higher station density.<br />
<strong>Geoscience</strong> <strong>BC</strong> Report 2012-1 157
Along pro<strong>file</strong> A(Figure 6), <strong>the</strong> conductivity structure is not<br />
well resolved using <strong>the</strong> syn<strong>the</strong>tic HZ data over <strong>the</strong> <strong>entire</strong><br />
frequency range (Figure 6e) when compared <strong>to</strong> <strong>the</strong> original<br />
2-D model. Models of <strong>the</strong> syn<strong>the</strong>tic HZ data using frequencies<br />
limited <strong>to</strong> <strong>the</strong> ZTEM range, however, reveal features<br />
that are similar <strong>to</strong> <strong>the</strong> original 2-D model, resulting in re<strong>as</strong>onable<br />
conductivity values <strong>to</strong> appropriate depths and significant<br />
structural detail (Figure 6f). This resolution is lost<br />
when fur<strong>the</strong>r limiting <strong>the</strong> frequencies <strong>to</strong> <strong>the</strong> six ZTEM<br />
frequencies (Figure 6g).<br />
over <strong>the</strong> ZTEM range image this feature re<strong>as</strong>onably well, <strong>the</strong><br />
model including just <strong>the</strong> six ZTEM frequencies shows a laterally<br />
uniform, highly conductive unit that would be interpreted<br />
<strong>as</strong> Eocene volcanicl<strong>as</strong>tic rocks (Figure 8f).<br />
Figure 9 shows <strong>the</strong> results for pro<strong>file</strong> F. Here, consistent<br />
with borehole lithology, <strong>the</strong> original 2-D model revealed<br />
In comparison <strong>to</strong> <strong>the</strong> original 2-D model along pro<strong>file</strong> B<br />
(Figure 7a), inversion of <strong>the</strong> syn<strong>the</strong>tic data over <strong>the</strong> <strong>entire</strong><br />
frequency range reveals <strong>the</strong> general subsurface-conductivity<br />
structure, including <strong>the</strong> highly conductive Eocene<br />
volcanicl<strong>as</strong>tic rocks at <strong>the</strong> north end of <strong>the</strong> pro<strong>file</strong> and <strong>the</strong><br />
laterally variable and moderate conductivities of <strong>the</strong> Cretaceous<br />
sediments over <strong>the</strong> sou<strong>the</strong>rn half of <strong>the</strong> pro<strong>file</strong>, and it<br />
shows an appropriate b<strong>as</strong>in depth beneath <strong>the</strong> <strong>entire</strong> pro<strong>file</strong><br />
(Figure 7d). Results using both <strong>the</strong> ZTEM range and <strong>the</strong> six<br />
specific ZTEM frequencies show <strong>the</strong> highly conductive<br />
Eocene units, but <strong>the</strong>se are only observed <strong>to</strong> depths of<br />
Cretaceous Taylor Creek sedimentary rocks <strong>to</strong> depths of 2–<br />
3 km (Figure 9a). Inversion of <strong>the</strong> syn<strong>the</strong>tic HZ data shows<br />
laterally variable conductivities, <strong>the</strong> values being slightly<br />
lower but comparable <strong>to</strong> those <strong>as</strong>sociated with Cretaceous<br />
sedimentary rocks. The general structure, distribution of<br />
<strong>the</strong> conductivity variations and depth of <strong>the</strong> units, however,<br />
are not well resolved, particularly when using just <strong>the</strong> six<br />
ZTEM frequencies (Figure 9f).<br />
P, 093A, B, C, F): constraints from water-well records; in<br />
<strong>Geoscience</strong> <strong>BC</strong> Summary of Activities 2007, <strong>Geoscience</strong><br />
<strong>BC</strong>, Report 2008-1, p. 11–20, URL [November 2011].<br />
Inversions of syn<strong>the</strong>tic data indicate that modelling <strong>the</strong><br />
transfer-function data alone can give a re<strong>as</strong>onable image of<br />
<strong>the</strong> conductivity structure of <strong>the</strong> subsurface; however, revealing<br />
specific features at depth is highly dependent on <strong>the</strong><br />
frequencies included in <strong>the</strong> inversion. In ideal geological<br />
terranes, where <strong>the</strong> depth <strong>to</strong> target, conductivity value and<br />
structure are suitable (e.g., imaging moderate conductivities<br />
at depths of
Andrews, G.D.M., Plouffe, A., Ferbey, T., Russell, J.K., Brown,<br />
S.R. and Anderson, R.G. (2011): The thickness of Neogene<br />
and Quaternary cover across <strong>the</strong> central Interior Plateau,<br />
British Columbia: analysis of water-well drill records<br />
and implications for mineral exploration potential; Canadian<br />
Journal of Earth Sciences, v. 48, no. 6, p. 973–986.<br />
Cagniard, L. (1953): B<strong>as</strong>ic <strong>the</strong>ory of <strong>the</strong> magne<strong>to</strong>telluric<br />
method of geophysical prospecting; Geophysics, v. 18, p.<br />
605–635.<br />
Calvert, A.J., Hayward, N.E., Spratt, J.E. and Craven, J.A.<br />
(2011): Seismic reflection constraints on upper crustal<br />
structures in <strong>the</strong> volcanic-covered central Nechako b<strong>as</strong>in,<br />
British Columbia; Canadian Journal of Earth Sciences,<br />
v. 48, no. 6, p. 1021–1037.<br />
Gabrielse, H. and Yorath, C.J. (1991): Tec<strong>to</strong>nic syn<strong>the</strong>sis; in<br />
Geology of <strong>the</strong> Cordilleran Orogen in Canada, H.<br />
Gabrielse and C.J. Yorath (ed.), Geological Survey of<br />
Canada, Geology of Canada, no. 4, p. 677–705 (also Geological<br />
Society of America, Geology of North America,<br />
v. G-2).<br />
Geotech Limited (2009): Helicopter-borne z-axis tipper electromagnetic<br />
(ZTEM) and aeromagnetic survey, Mt.<br />
Milligan test block; <strong>Geoscience</strong> <strong>BC</strong>, Report 2009-7,<br />
51 p., URL [November 2011]<br />
Hannigan, P., Lee, P.J., Osadetz, K.J., Dietrich, J.R. and Olsen-<br />
Heise, K. (1994): Oil and g<strong>as</strong> resource potential of <strong>the</strong><br />
Nechako-Chilcotin area of British Columbia; <strong>BC</strong> Ministry<br />
of Energy and Mines, GeoFile 2001-6, 5 maps at<br />
1:1 000 000 scale, URL [November 2011].<br />
Hayward, N. and Calvert, A.J. (2008): Structure of <strong>the</strong> sou<strong>the</strong><strong>as</strong>tern<br />
Nechako B<strong>as</strong>in, south-central British Columbia<br />
(NTS 092N, O; 093 B, C): preliminary results of seismic<br />
interpretation and first-arrival <strong>to</strong>mographic modelling; in<br />
<strong>Geoscience</strong> <strong>BC</strong> Summary of Activities 2007, <strong>Geoscience</strong><br />
<strong>BC</strong>, Report 2008-1, p. 129–134, URL [November 2011].<br />
Holtham, E. and Oldenburg, W. (2010): Three-dimensional inversion<br />
of ZTEM data; Geophysical Journal International,<br />
v. 182, p. 168–192, doi:10.1111/j.1365-<br />
246X.2010.0463.x<br />
Jones, A.G. (1992): Electrical conductivity of <strong>the</strong> continental<br />
lower crust; in Continental Lower Crust, D.M. Fountain,<br />
R.J. Arculus and R.W. Kay (ed.), Elsevier, Amsterdam,<br />
The Ne<strong>the</strong>rlands, p. 81–143.<br />
Lo, B., Legault, J., Kuzmin, P. and Fisk, K. (2009): Advances in<br />
airborne EM: introducing ZTEM; South African Geophysical<br />
Association (SAGA), 11 th Biennial Technical<br />
Meeting and Exhibition, extended abstracts, p. 101–104.<br />
Ma<strong>the</strong>ws, W.H. (1989): Neogene Chilcotin b<strong>as</strong>alts in southcentral<br />
British Columbia: geology, ages, and geomorphic<br />
his<strong>to</strong>ry; Canadian Journal of Earth Sciences, v. 26, p.<br />
969–982.<br />
Monger, J.W.H., Price, R.A. and Templeman-Kluit, D. (1982):<br />
Tec<strong>to</strong>nic accretion of two major metamorphic and<br />
plu<strong>to</strong>nic welts in <strong>the</strong> Canadian Cordillera; Geology, v. 10,<br />
p. 70–75.<br />
Monger, J.W.H., Sou<strong>the</strong>r, J.G. and Gabrielse, H. (1972): Evolution<br />
of <strong>the</strong> Canadian Cordillera—a plate tec<strong>to</strong>nic model;<br />
American Journal of Science, v. 272, p. 577–602.<br />
Price, R.A. (1994): Cordilleran tec<strong>to</strong>nics in <strong>the</strong> evolution of <strong>the</strong><br />
Western Canada Sedimentary B<strong>as</strong>in; in Geological Atl<strong>as</strong> of<br />
<strong>the</strong> Western Canada Sedimentary B<strong>as</strong>in, G.D. Mossop and I.<br />
Figure 8. Results of two-dimensional (2-D) modelling of me<strong>as</strong>ured and<br />
syn<strong>the</strong>tic MT data along pro<strong>file</strong> C: a) original 2-D model derived from all<br />
components of <strong>the</strong> me<strong>as</strong>ured MT data; b) model of <strong>the</strong> me<strong>as</strong>ured HZ<br />
data over <strong>the</strong> seven-decade frequency range; c) model of <strong>the</strong> me<strong>as</strong>ured<br />
HZ data over <strong>the</strong> ZTEM frequency range; d) model of <strong>the</strong> syn<strong>the</strong>tic<br />
HZ data over <strong>the</strong> seven-decade frequency range; e) model of <strong>the</strong><br />
syn<strong>the</strong>tic HZ data over <strong>the</strong> ZTEM frequency range; and f) model of <strong>the</strong><br />
syn<strong>the</strong>tic HZ data at <strong>the</strong> six specific ZTEM frequencies.<br />
160 <strong>Geoscience</strong> <strong>BC</strong> Summary of Activities 2011
Shetsen (comp.), Canadian Society of Petroleum Geologists<br />
and Alberta Research Council, 510 p., URL <br />
[November 2011].<br />
Riddell, J.M., comp. (2006): Geology of <strong>the</strong> sou<strong>the</strong>rn Nechako<br />
B<strong>as</strong>in, NTS 92N, 92O, 93B, 93C, 93F, 93G; <strong>BC</strong> Ministry of<br />
Energy and Mines, Petroleum Geology Map 2006-1, 3<br />
sheets at 1:400 000 scale.<br />
Riddell, J. (2011): Lithostratigraphic and tec<strong>to</strong>nic framework of<br />
Jur<strong>as</strong>sic and Cretaceous intermontane sedimentary b<strong>as</strong>ins of<br />
south-central British Columbia; Canadian Journal of Earth<br />
Sciences, v. 48, no. 6, p. 870–896.<br />
Riddell, J., Ferri, F., Sweet, A. and O’Sullivan, P. (2007): New<br />
geoscience data from <strong>the</strong> Nechako B<strong>as</strong>in project; in<br />
Nechako Initiative <strong>Geoscience</strong> Update 2007, <strong>BC</strong> Ministry<br />
of Energy and Mines, Petroleum Geology Open File 2007-1,<br />
URL [November 2011].<br />
Sattel, D., Wi<strong>the</strong>rly, K. and Becken, M. (2010): A brief analysis of<br />
ZTEM data from <strong>the</strong> Forrestanian test site, WA; Australian<br />
Society of Exploration Geophysicists (ASEG), Extended<br />
Abstracts, v. 2010, no. 1, p. 1–4.<br />
Smith, I.F. (2007): Petrophysical analysis—Nechako B<strong>as</strong>in; in<br />
Nechako Initiative <strong>Geoscience</strong> Update 2007, <strong>BC</strong> Ministry<br />
of Energy and Mines, Petroleum Geology Open File 2007-1,<br />
URL [November 2011].<br />
Spratt, J.E. and Craven, J.A. (2009): Preliminary images of <strong>the</strong><br />
conductivity structure of <strong>the</strong> Nechako B<strong>as</strong>in, south-central<br />
British Columbia (NTS 092N, O, 093B, C, F, G) from<br />
magne<strong>to</strong>telluric methods; in <strong>Geoscience</strong> <strong>BC</strong> Summary of<br />
Activities 2008, <strong>Geoscience</strong> <strong>BC</strong>, Report 2009-1, URL<br />
[November 2011].<br />
Spratt, J.E. and Craven, J. (2010): Magne<strong>to</strong>telluric imaging of <strong>the</strong><br />
Nechako B<strong>as</strong>in, British Columbia, Canada; Geological Survey<br />
of Canada, Current Research, 2010-3, 12 p., URL<br />
<br />
[November 2011].<br />
Spratt, J. and Craven, J. (2011): Near-surface and crustal-scale images<br />
of <strong>the</strong> Nechako b<strong>as</strong>in, British Columbia, Canada, from<br />
magne<strong>to</strong>telluric investigations; Canadian Journal of Earth<br />
Sciences, v. 48. p. 987–999.<br />
Struik, L.C. and MacIntyre, D.G. (2001): Introduction <strong>to</strong> <strong>the</strong> special<br />
issue of Canadian Journal of Earth Sciences: The<br />
Nechako NATMAP Project of <strong>the</strong> central Canadian Cordillera;<br />
Canadian Journal of Earth Sciences, v. 38, p. 485–494.<br />
Wait, J.R. (1962): Theory of magne<strong>to</strong>telluric fields; Journal of Research<br />
of <strong>the</strong> National Bureau of Standards, Part D: Radio<br />
Properties, v. 66d, p. 509–541.<br />
Figure 9. Results of two-dimensional (2-D) modelling of me<strong>as</strong>ured<br />
and syn<strong>the</strong>tic MT data along pro<strong>file</strong> F: a) original 2-D model derived<br />
from all components of <strong>the</strong> me<strong>as</strong>ured MT data; b) model of <strong>the</strong><br />
me<strong>as</strong>ured HZ data over <strong>the</strong> seven-decade frequency range;<br />
c) model of <strong>the</strong> me<strong>as</strong>ured HZ data over <strong>the</strong> ZTEM frequency range;<br />
d) model of <strong>the</strong> syn<strong>the</strong>tic HZ data over <strong>the</strong> seven-decade frequency<br />
range; e) model of <strong>the</strong> syn<strong>the</strong>tic HZ data over <strong>the</strong> ZTEM frequency<br />
range; and f) model of <strong>the</strong> syn<strong>the</strong>tic HZ data at <strong>the</strong> six specific<br />
ZTEM frequencies.<br />
<strong>Geoscience</strong> <strong>BC</strong> Report 2012-1 161
162 <strong>Geoscience</strong> <strong>BC</strong> Summary of Activities 2011
<strong>Geoscience</strong> <strong>BC</strong> is an industry-led, industry-focused<br />
not for profit society that works <strong>to</strong> attract mineral<br />
and oil and g<strong>as</strong> investment <strong>to</strong> British Columbia<br />
through collection and marketing of geoscience data.<br />
Suite 440 – 890 West Pender Street<br />
Vancouver <strong>BC</strong> V6C 1J9<br />
info@geosciencebc.com<br />
www.geosciencebc.com<br />
<strong>Geoscience</strong> <strong>BC</strong> is funded through grants from <strong>the</strong> Provincial Government of British Columbia