Written Answers. - Parliamentary Debates - Houses of the Oireachtas
Written Answers. - Parliamentary Debates - Houses of the Oireachtas
Written Answers. - Parliamentary Debates - Houses of the Oireachtas

Create successful ePaper yourself
Turn your PDF publications into a flip-book with our unique Google optimized e-Paper software.
Questions— 14 February 2012. <strong>Written</strong> <strong>Answers</strong><br />
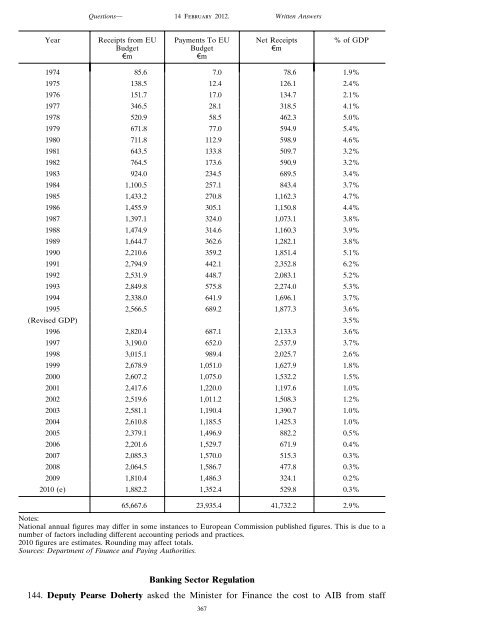
Year Receipts from EU Payments To EU Net Receipts % <strong>of</strong> GDP<br />
Budget Budget €m<br />
€m €m<br />
1974 85.6 7.0 78.6 1.9%<br />
1975 138.5 12.4 126.1 2.4%<br />
1976 151.7 17.0 134.7 2.1%<br />
1977 346.5 28.1 318.5 4.1%<br />
1978 520.9 58.5 462.3 5.0%<br />
1979 671.8 77.0 594.9 5.4%<br />
1980 711.8 112.9 598.9 4.6%<br />
1981 643.5 133.8 509.7 3.2%<br />
1982 764.5 173.6 590.9 3.2%<br />
1983 924.0 234.5 689.5 3.4%<br />
1984 1,100.5 257.1 843.4 3.7%<br />
1985 1,433.2 270.8 1,162.3 4.7%<br />
1986 1,455.9 305.1 1,150.8 4.4%<br />
1987 1,397.1 324.0 1,073.1 3.8%<br />
1988 1,474.9 314.6 1,160.3 3.9%<br />
1989 1,644.7 362.6 1,282.1 3.8%<br />
1990 2,210.6 359.2 1,851.4 5.1%<br />
1991 2,794.9 442.1 2,352.8 6.2%<br />
1992 2,531.9 448.7 2,083.1 5.2%<br />
1993 2,849.8 575.8 2,274.0 5.3%<br />
1994 2,338.0 641.9 1,696.1 3.7%<br />
1995 2,566.5 689.2 1,877.3 3.6%<br />
(Revised GDP) 3.5%<br />
1996 2,820.4 687.1 2,133.3 3.6%<br />
1997 3,190.0 652.0 2,537.9 3.7%<br />
1998 3,015.1 989.4 2,025.7 2.6%<br />
1999 2,678.9 1,051.0 1,627.9 1.8%<br />
2000 2,607.2 1,075.0 1,532.2 1.5%<br />
2001 2,417.6 1,220.0 1,197.6 1.0%<br />
2002 2,519.6 1,011.2 1,508.3 1.2%<br />
2003 2,581.1 1,190.4 1,390.7 1.0%<br />
2004 2,610.8 1,185.5 1,425.3 1.0%<br />
2005 2,379.1 1,496.9 882.2 0.5%<br />
2006 2,201.6 1,529.7 671.9 0.4%<br />
2007 2,085.3 1,570.0 515.3 0.3%<br />
2008 2,064.5 1,586.7 477.8 0.3%<br />
2009 1,810.4 1,486.3 324.1 0.2%<br />
2010 (e) 1,882.2 1,352.4 529.8 0.3%<br />
65,667.6 23,935.4 41,732.2 2.9%<br />
Notes:<br />
National annual figures may differ in some instances to European Commission published figures. This is due to a<br />
number <strong>of</strong> factors including different accounting periods and practices.<br />
2010 figures are estimates. Rounding may affect totals.<br />
Sources: Department <strong>of</strong> Finance and Paying Authorities.<br />
Banking Sector Regulation<br />
144. Deputy Pearse Doherty asked <strong>the</strong> Minister for Finance <strong>the</strong> cost to AIB from staff<br />
367

![[Deputy Michael Noonan.]](https://img.yumpu.com/30494839/1/190x245/deputy-michael-noonan.jpg?quality=85)