Report and Accounts 1999 / 2000 - Carlsberg Group
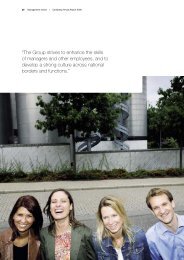
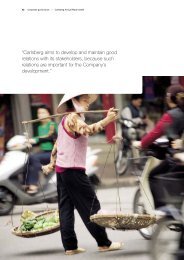
Report and Accounts 1999 / 2000 - Carlsberg Group
Report and Accounts 1999 / 2000 - Carlsberg Group

Create successful ePaper yourself
Turn your PDF publications into a flip-book with our unique Google optimized e-Paper software.
72<br />
Cash Flow Statement of the <strong>Group</strong> <strong>1999</strong>/00<br />
Cash Flow Statement of the <strong>Group</strong> <strong>1999</strong>/00<br />
<strong>1999</strong>/00 1998/99<br />
DKK million DKK million<br />
Operating profit 2,934 1,673<br />
Depreciation 2,153 1,354<br />
Other adjustments 66 -169<br />
Financial income, net -507 -96<br />
Corporate tax paid -753 -20<br />
Cash flow from operations before changes in working capital 3,893 2,742<br />
Change in debtors -953 -503<br />
Change in stocks -254 -125<br />
Change in creditors, excise duties, etc. 538 -293<br />
Cash flow, operations 3,224 1,821<br />
Special items including adjustments in provisions -919 -1,091<br />
Acquisition of tangible fixed assets -2,770 -2,024<br />
20 Acquisition/disposal of companies, net -4,309 -496<br />
Acquisition of other fixed asset investments, net 248 -399<br />
Disposal of securities, net 736 1,427<br />
Dividend received from associated companies 38 33<br />
Cash flow, investments -6,057 -1,459<br />
Dividend paid -256 -256<br />
Minority interests -353 255<br />
Financial income <strong>and</strong> expenditure 4,150 -1,408<br />
Cash flow, financing 3,541 -1,409<br />
Net cash flow from operations, investments <strong>and</strong> financing -211 -2,138<br />
Cash <strong>and</strong> cash equivalents, beginning of year 1,793 3,890<br />
Currency translation adjustments in cash <strong>and</strong> cash equivalents, beginning of year 96 41<br />
Cash flow for the year -211 -2,138<br />
Cash <strong>and</strong> cash equivalents, year-end 1,678 1,793<br />
The statement of cash flow cannot be derived solely from the published annual accounts.

![[Name and Address] - Carlsberg Group](https://img.yumpu.com/49766377/1/184x260/name-and-address-carlsberg-group.jpg?quality=85)
![[Name and Address] - Carlsberg Group](https://img.yumpu.com/49015962/1/184x260/name-and-address-carlsberg-group.jpg?quality=85)