Analysis of Polymer Additives Using the LCMS-8030 Triple - Shimadzu
Analysis of Polymer Additives Using the LCMS-8030 Triple - Shimadzu
Analysis of Polymer Additives Using the LCMS-8030 Triple - Shimadzu

You also want an ePaper? Increase the reach of your titles
YUMPU automatically turns print PDFs into web optimized ePapers that Google loves.
LAAN-A-LM-E050<br />
Liquid Chromatography Mass Spectrometry<br />
No.C79<br />
<strong>Analysis</strong> <strong>of</strong> <strong>Polymer</strong> <strong>Additives</strong> <strong>Using</strong> <strong>the</strong> <strong>LCMS</strong>-<strong>8030</strong> <strong>Triple</strong> Quadrupole LC/MS/MS<br />
Antioxidants, ultraviolet absorbers, flame retardants<br />
and o<strong>the</strong>r polymer additives are indispensable for<br />
improving <strong>the</strong> characteristics and functionality <strong>of</strong><br />
polymers. Understanding <strong>the</strong> types and quantities <strong>of</strong><br />
<strong>the</strong>se additives to be used is extremely important to<br />
effectively control <strong>the</strong> manufacturing process <strong>of</strong> <strong>the</strong><br />
polymers.<br />
Below is an example <strong>of</strong> quantitative analysis <strong>of</strong> 14<br />
types <strong>of</strong> polymer additives using MRM (Multiple<br />
Reaction Monitoring) and <strong>the</strong> <strong>LCMS</strong>-<strong>8030</strong> triple<br />
quadrupole mass spectrometer.<br />
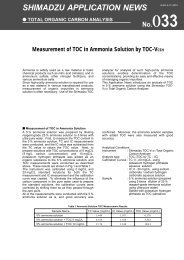
n MRM <strong>Analysis</strong> with <strong>the</strong> <strong>LCMS</strong>-<strong>8030</strong><br />
Conducting MRM measurement with a triple quadrupole<br />
mass spectrometer makes it possible to obtain<br />
molecular structure information while simultaneously<br />
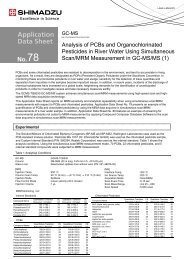
performing quantitative analysis. Fig. 1 shows <strong>the</strong><br />
chromatograms <strong>of</strong> 14 polymer additives. Two additives<br />
were analyzed in positive mode, and 12 were<br />
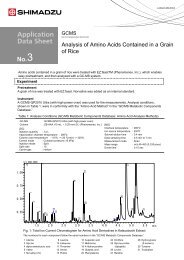
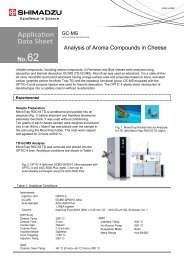
analyzed in negative mode. Fig. 2 shows <strong>the</strong> calibration<br />
curves <strong>of</strong> each <strong>of</strong> <strong>the</strong> constituents. Excellent linearity<br />
was obtained for every compound tested.<br />
(×10,000,000)<br />
1.25<br />
1.00<br />
0.75<br />
0.50<br />
0.25<br />
0.00<br />
Irganox 245 585.30>367.20(-)<br />
Irganox MD 1024 551.35>333.40(-)<br />
Irganox 1098 635.45>417.50(-)<br />
Tinuvin P 226.10>107.10(+)<br />
Cyanox 2246 339.15>163.20(-)<br />
Cyanox425 367.25>177.20(-)<br />
Irganox 1035 641.35>83.20(-)<br />
Irgafos 168 oxide 663.50>57.15(+)<br />
Tinuvin 120 437.25>205.25(-)<br />
Irganox 1010 1175.70>1175.70(-)<br />
Tinuvin 328 350.25>319.85(-)<br />
Irganox 1330 773.55>773.55(-)<br />
Irganox 565 587.35>58.10(-)<br />
Irganox 1076 529.45>41.15(-)<br />
2.5 3.0 3.5 4.0 4.5 5.0 5.5 6.0 6.5 7.0 min<br />
Fig. 1 Chromatograms <strong>of</strong> 14 <strong>Polymer</strong> <strong>Additives</strong><br />
3.0<br />
2.5<br />
(×100,000)<br />
Irganox 245<br />
1-500 ppb<br />
2.25<br />
2.00<br />
1.75<br />
Irganox MD 1024<br />
(×100,000)<br />
1-1000 ppb<br />
1.00<br />
Irganox 1098 Tinuvin P Cyanox 2246<br />
(×100,000) (×100,000) (×1,000,000)<br />
5-500 ppb<br />
2.5<br />
2.0<br />
1-1000 ppb<br />
3.5<br />
3.0<br />
0.01-100 ppb<br />
2.0<br />
1.5<br />
1.0<br />
0.5<br />
0.0<br />
R^2=0.995<br />
0 100 200 300 400 <br />
1.50<br />
1.25<br />
1.00<br />
0.75<br />
0.50<br />
0.25<br />
R^2=0.997<br />
0.75<br />
2.5<br />
1.5<br />
2.0<br />
0.50<br />
1.0<br />
1.5<br />
1.0<br />
0.25<br />
0.5<br />
0.5<br />
R^2=0.996 R^2=0.999 R^2=0.997<br />
0.00<br />
0.00<br />
0.0<br />
0 250 500 750<br />
0 100 200 300 400<br />
0 250 500 750<br />
0.0 25.0 50.0 75.0<br />
<br />
3.0<br />
2.5<br />
2.0<br />
1.5<br />
1.0<br />
0.5<br />
(×1,000,000)<br />
Cyanox 425 Irganox 1035 Irgafos 168 oxide Tinuvin 120 Irganox 1010<br />
0.01-100 ppb<br />
0.0<br />
0.0 25.0 50.0 75.0<br />
<br />
8.0<br />
7.0<br />
6.0<br />
5.0<br />
4.0<br />
3.0<br />
2.0<br />
(×10,000)<br />
0.5-100 ppb<br />
5.0<br />
4.0<br />
3.0<br />
2.0<br />
1.0<br />
(×10,000) (×1,000,000) (×10,000)<br />
5-500 ppb<br />
0.01-100 ppb<br />
0.1-100 ppb<br />
1.0<br />
R^2=0.997 R^2=0.998 R^2=0.996 R^2=0.997 R^2=0.997<br />
0.0<br />
0.00<br />
0.0<br />
0 100 200 300 400 0.0 25.0 50.0 75.0<br />
0.0 25.0 50.0 75.0 <br />
1.75<br />
1.50<br />
1.25<br />
1.00<br />
0.75<br />
0.50<br />
0.25<br />
6.0<br />
5.0<br />
4.0<br />
3.0<br />
2.0<br />
1.0<br />
0.0<br />
0.0 25.0 50.0 75.0<br />
<br />
1.25<br />
1.00<br />
0.75<br />
0.50<br />
0.25<br />
(×100,000)<br />
Tinuvin 328 Irganox 1330<br />
500-10000 ppb<br />
R^2=0.999<br />
(×1,000,000)<br />
0.5-10000 ppb<br />
R^2=0.998<br />
0.00<br />
0.0<br />
0 2500 5000 7500 0 2500 5000 7500<br />
<br />
4.0<br />
3.5<br />
3.0<br />
2.5<br />
2.0<br />
1.5<br />
1.0<br />
0.5<br />
1.00<br />
0.75<br />
0.50<br />
0.25<br />
(×1,000,000)<br />
Irganox 565<br />
0.5-500 ppb<br />
R^2=0.996<br />
0.00<br />
0 100 200 300 400 <br />
3.5<br />
3.0<br />
2.5<br />
2.0<br />
1.5<br />
1.0<br />
0.5<br />
(×100,000)<br />
Irganox 1076<br />
1-1000 ppb<br />
R^2=0.999<br />
0.0<br />
0 250 500 750<br />
<br />
Fig. 2 Calibration Curves <strong>of</strong> 14 <strong>Polymer</strong> <strong>Additives</strong>
No.C79<br />
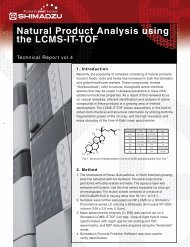
n <strong>Analysis</strong> <strong>of</strong> Unknown <strong>Polymer</strong> <strong>Additives</strong> <strong>Using</strong> <strong>the</strong> <strong>LCMS</strong>-<strong>8030</strong><br />
Quantitative analysis was conducted for <strong>the</strong> polymer chromatograms <strong>of</strong> <strong>the</strong> substances detected. The<br />
additives in a food wrapping material and food concentrations <strong>of</strong> each <strong>of</strong> <strong>the</strong> constituents calculated<br />
container. THF (1 mL) was added to a pulverized using <strong>the</strong> calibration curves <strong>of</strong> Fig. 2 were determined<br />
sample (0.1 g), and this was sonicated for 1 minute. to be 49.4 ng/g <strong>of</strong> Irganox 1010 detected in <strong>the</strong> food<br />
The supernatant was collected, 1 mL <strong>of</strong> 5 mM wrapping material, and 14.3 μg/g <strong>of</strong> <strong>the</strong> Irganox 245<br />
ammonium acetate was added, and <strong>the</strong> final mixture and 48.7 ng/g <strong>of</strong> Irganox 1010 detected in <strong>the</strong> food<br />
was filtered (0.45 μm.)<br />
container.<br />
Fig. 3 shows <strong>the</strong> MS chromatograms and <strong>the</strong> MRM<br />
(×10,000)<br />
7.0<br />
6.0<br />
5.0<br />
4.0<br />
3.0<br />
2.0<br />
1.0<br />
0.0<br />
Food Wrapping Material<br />
(×100,000)<br />
4.0<br />
3.5<br />
3.0<br />
2.5<br />
2.0<br />
1.5<br />
1.0<br />
0.5<br />
0.0<br />
Food Container<br />
2.5 3.0 3.5 4.0 4.5 5.0 5.5 6.0 6.5 7.0 min 2.5 3.0 3.5 4.0 4.5 5.0 5.5 6.0 6.5 7.0 min<br />
2.5<br />
2.0<br />
(×1,000) (×100,000) (×1,000)<br />
1.2<br />
1.5<br />
1.0<br />
4.859<br />
3.258<br />
4.863<br />
1.5<br />
1.0<br />
0.8<br />
1.0<br />
0.5<br />
49.7 ng/g 14.3 μg/g 0.6<br />
0.5<br />
48.7 ng/g<br />
0.4<br />
0.0<br />
4.7 4.8 4.9 5.0<br />
0.0<br />
3.1 3.2 3.3 3.4<br />
0.2<br />
4.7 4.8 4.9 5.0<br />
Irganox 1010<br />
Irganox 245 Irganox 1010<br />
Fig. 3 Chromatograms <strong>of</strong> <strong>Polymer</strong> <strong>Additives</strong> Detected in <strong>the</strong> <strong>Analysis</strong><br />
(Left) Food Wrapping Material, (Right) Food Container<br />
Table 1 Analytical Conditions<br />
Column<br />
: Shim-pack XR-ODS (75 mmL. × 2.0 mmI.D., 2.2 μm)<br />
Mobile Phase A : 0.1 % formic acid<br />
Mobile Phase B : Methanol<br />
Gradient Program : 25 %B (0 min) - 100 %B (2.5-7.5 min) - 25 %B (7.51-10 min)<br />
Flow Rate<br />
: 0.5 mL/min<br />
Injection Volume : 2 μL<br />
Column Temperature : 40 °C<br />
MS<br />
Probe Voltage<br />
Nebulizing Gas Flow : 1.5 L/min<br />
Drying Gas Pressure : 10 L/min<br />
DL Temperature : 250 °C<br />
BH Temperature : 400 °C<br />
: SHIMADZU <strong>LCMS</strong>-<strong>8030</strong><br />
: +4.5 kV (ESI-Positive mode),<br />
–3.5 kV (ESI-Negative mode)<br />
SHIMADZU CORPORATION. International Marketing Division<br />
3. Kanda-Nishikicho 1-chome, Chiyoda-ku, Tokyo 101-8448, Japan Phone: 81(3)3219-5641 Fax. 81(3)3219-5710