Gardner - Supply Chain Performance Management at the ...
Gardner - Supply Chain Performance Management at the ...
Gardner - Supply Chain Performance Management at the ...

Create successful ePaper yourself
Turn your PDF publications into a flip-book with our unique Google optimized e-Paper software.
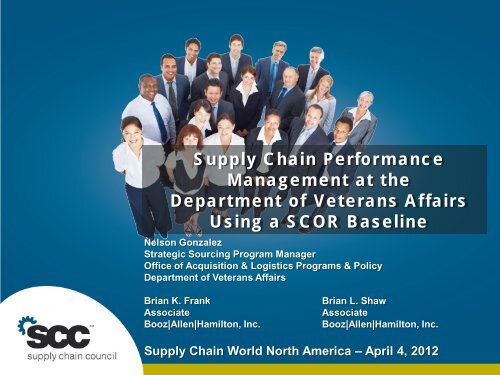
<strong>Supply</strong> <strong>Chain</strong> <strong>Performance</strong><br />
<strong>Management</strong> <strong>at</strong> <strong>the</strong><br />
Department of Veterans Affairs<br />
Using a SCOR Baseline<br />
Nelson Gonzalez<br />
Str<strong>at</strong>egic Sourcing Program Manager<br />
Office of Acquisition & Logistics Programs & Policy<br />
Department of Veterans Affairs<br />
Brian K. Frank<br />
Associ<strong>at</strong>e<br />
Booz|Allen|Hamilton, Inc.<br />
Brian L. Shaw<br />
Associ<strong>at</strong>e<br />
Booz|Allen|Hamilton, Inc.<br />
<strong>Supply</strong> <strong>Chain</strong> World North America – April 4, 2012<br />
© 2010 <strong>Supply</strong> <strong>Chain</strong> Council. ALL RIGHTS RESERVED. | <strong>Supply</strong> <strong>Chain</strong> Perf. Mgmt. <strong>at</strong> VA | Slide 1 | 28 March 2012
Table of Contents<br />
VA <strong>Supply</strong> <strong>Chain</strong> Transform<strong>at</strong>ion<br />
SCOR Baseline<br />
<strong>Supply</strong> <strong>Chain</strong> <strong>Performance</strong> Metrics<br />
Prototype <strong>Supply</strong> <strong>Chain</strong> Dashboard<br />
<strong>Supply</strong> <strong>Chain</strong> <strong>Performance</strong> <strong>Management</strong> Framework<br />
© 2010 <strong>Supply</strong> <strong>Chain</strong> Council. ALL RIGHTS RESERVED. | <strong>Supply</strong> <strong>Chain</strong> Perf. Mgmt. <strong>at</strong> VA | Slide 2 | 28 March 2012
We have an oblig<strong>at</strong>ion to provide assistance for Veterans for <strong>the</strong>ir<br />
entire lives. The size and complexity of <strong>the</strong> supply chain to support<br />
this network dwarfs any o<strong>the</strong>r government or commercial organiz<strong>at</strong>ion<br />
4.1 million Veterans & survivors receiving compens<strong>at</strong>ion & pension benefits (end of FY10)<br />
45.8 billion in active compens<strong>at</strong>ion & pension benefit accounts (end of FY10)<br />
8 million Veterans enrolled in healthcare programs<br />
13 million bed days of care (FY10) 1<br />
75 million outp<strong>at</strong>ient visits (FY10)<br />
111,800 interments in FY10<br />
- - - - - -<br />
16.3 million items consumed 4<br />
5 major commodity groups<br />
1.3 million contract actions 2<br />
$17.4B in annual spend<br />
174,722 contracts 3<br />
27,176 suppliers 3<br />
5000 PMs/COTRs<br />
5500 logistics staff<br />
3000 contracting officers<br />
6 leaders of contracting<br />
$12.7B value of equipment 5<br />
366 million hours of direct labor 1<br />
- - - - - -<br />
56 Regional Benefit Offices, 350 Local Offices & Intake Sites<br />
153 Medical Centers, 807 Outp<strong>at</strong>ient Clinics, 288 Vet Centers<br />
3.1 million gravesites and 131 n<strong>at</strong>ional cemeteries in 39 st<strong>at</strong>es<br />
© 2010 <strong>Supply</strong> <strong>Chain</strong> Council. ALL RIGHTS RESERVED. | <strong>Supply</strong> <strong>Chain</strong> Perf. Mgmt. <strong>at</strong> VA | Slide 3 | 28 March 2012<br />
Sources: 1-DSS; 2-FPDS (does not include purchases
VA <strong>Supply</strong> <strong>Chain</strong> <strong>Management</strong> Transform<strong>at</strong>ion 2012 - 2015<br />
Workforce Development<br />
<strong>Supply</strong> <strong>Chain</strong> <strong>Performance</strong> Dashboard<br />
Technology Integr<strong>at</strong>ion<br />
Str<strong>at</strong>egic Sourcing /<br />
Acquisition Savings<br />
GS1 D<strong>at</strong>a<br />
Standardiz<strong>at</strong>ion<br />
Process Improvement /<br />
Inventory Reduction<br />
<strong>Supply</strong> <strong>Chain</strong><br />
Governance Board<br />
Supplier Rel<strong>at</strong>ionship<br />
Transform<strong>at</strong>ion<br />
© 2010 <strong>Supply</strong> <strong>Chain</strong> Council. ALL RIGHTS RESERVED. | <strong>Supply</strong> <strong>Chain</strong> Perf. Mgmt. <strong>at</strong> VA | Slide 4 | 28 March 2012
Table of Contents<br />
VA <strong>Supply</strong> <strong>Chain</strong> Transform<strong>at</strong>ion<br />
SCOR Baseline<br />
<strong>Supply</strong> <strong>Chain</strong> <strong>Performance</strong> Metrics<br />
Prototype <strong>Supply</strong> <strong>Chain</strong> Dashboard<br />
<strong>Supply</strong> <strong>Chain</strong> <strong>Performance</strong> <strong>Management</strong> Framework<br />
© 2010 <strong>Supply</strong> <strong>Chain</strong> Council. ALL RIGHTS RESERVED. | <strong>Supply</strong> <strong>Chain</strong> Perf. Mgmt. <strong>at</strong> VA | Slide 5 | 28 March 2012
We conducted interviews and collected d<strong>at</strong>a from various sources to<br />
help define <strong>the</strong> baseline, assess <strong>the</strong> supply chain and ultim<strong>at</strong>ely,<br />
recommend a performance management str<strong>at</strong>egy<br />
D<strong>at</strong>a Collection<br />
SCOR Project Approach<br />
Deliverables<br />
SCOR<br />
Process/Metrics<br />
VA OA&L Functional<br />
Interviews<br />
Booz Allen <strong>Supply</strong> <strong>Chain</strong>/<br />
Logistics Expertise<br />
VA Procurement<br />
Reform Task Force Report<br />
Current VA<br />
Organiz<strong>at</strong>ion Charts<br />
VA OA&MM 2006-2010<br />
Str<strong>at</strong>egic Plan<br />
VA 2011 Budget<br />
PwC <strong>Supply</strong> <strong>Chain</strong><br />
Transform<strong>at</strong>ion Study<br />
VA Handbook<br />
7002<br />
VA’s “13 Gre<strong>at</strong>est<br />
Challenges”<br />
VHA CP&LO<br />
Interviews<br />
NCA Functional<br />
(Logistics) Interview<br />
OAL and VHA<br />
Resource Libraries<br />
<strong>Supply</strong> <strong>Chain</strong><br />
Baseline<br />
<strong>Supply</strong> <strong>Chain</strong><br />
M<strong>at</strong>urity Assessment<br />
<strong>Performance</strong><br />
Measurement<br />
Str<strong>at</strong>egy<br />
Enable <strong>Supply</strong> <strong>Chain</strong><br />
VAAA<br />
Str<strong>at</strong>egy<br />
SDC<br />
P<br />
EP ES<br />
OAL<br />
MBR<br />
IT<br />
VACO<br />
Center for<br />
Acquisition<br />
Innov<strong>at</strong>ion<br />
CFM<br />
Med/<br />
Surg HCS<br />
<strong>Performance</strong><br />
Measurement Framework<br />
D<br />
R<br />
Mission, Vision,<br />
Goals<br />
SCOR Framework<br />
<strong>Performance</strong><br />
Measures<br />
1. Define Scope<br />
2. Design<br />
ES S<br />
ER<br />
N<strong>at</strong>ional Acquisition<br />
Center<br />
Technical Acquisition<br />
Center<br />
Suppliers<br />
Pharm<br />
Nutrition<br />
PLANNING AND EXECUTION<br />
Enablers<br />
<strong>Performance</strong><br />
<strong>Management</strong><br />
IT/D<strong>at</strong>a<br />
Collection and<br />
<strong>Management</strong><br />
Production<br />
Risk<br />
<strong>Management</strong><br />
Denver<br />
Acquisition<br />
and Logistics<br />
Center<br />
.<br />
Inventory<br />
<strong>Management</strong><br />
<strong>Supply</strong> <strong>Chain</strong><br />
Str<strong>at</strong>egy<br />
Distribution/<br />
Transport<strong>at</strong>ion<br />
Infrastructure<br />
<strong>Management</strong><br />
S<br />
Regional<br />
Contract Center<br />
S<br />
Veterans<br />
Procurement<br />
Returns/ Retrograde<br />
Customer<br />
Rel<strong>at</strong>ions<br />
<strong>Management</strong><br />
SAO-E<br />
SAO-C<br />
SAO-W<br />
VHA<br />
Product Lifecycle<br />
<strong>Management</strong><br />
P<br />
ES EP<br />
VBA<br />
OAL<br />
NCA<br />
S<br />
P<br />
M<br />
R<br />
Administr<strong>at</strong>ions<br />
Benefit Offices/<br />
Centers<br />
OAL<br />
Hospitals/<br />
Cemeteries<br />
Clinics<br />
D<br />
Human Resources<br />
<strong>Management</strong><br />
Service Providers<br />
3. Develop & Test<br />
4. Implement<br />
OAL <strong>Performance</strong><br />
Measurement Dashboard<br />
© 2010 <strong>Supply</strong> <strong>Chain</strong> Council. ALL RIGHTS RESERVED. | <strong>Supply</strong> <strong>Chain</strong> Perf. Mgmt. <strong>at</strong> VA | Slide 6 | 28 March 2012
The existing VA supply chain management construct and doctrine<br />
were <strong>the</strong>n compared to standard <strong>Supply</strong> <strong>Chain</strong> Oper<strong>at</strong>ions<br />
Reference-model (SCOR) processes and metrics for fur<strong>the</strong>r analysis<br />
Plan<br />
Deliver<br />
Source<br />
Make<br />
Deliver<br />
Source<br />
Make<br />
Deliver<br />
Source<br />
Make<br />
Deliver<br />
Source<br />
Source: SCC<br />
Return Return<br />
Return Return Return Return Return Return<br />
Suppliers’<br />
Supplier<br />
Supplier<br />
VA<br />
Acquisition and Logistics<br />
Service<br />
Providers<br />
Veterans<br />
SCOR takes <strong>the</strong> segments of a supply chain, shows <strong>the</strong> players within each segment and <strong>the</strong> processes <strong>the</strong>y perform,<br />
and <strong>the</strong>n shows <strong>the</strong> interrel<strong>at</strong>ionships of <strong>the</strong>se processes.<br />
There is a m<strong>at</strong>erial flow, an inform<strong>at</strong>ion flow, and a cash flow associ<strong>at</strong>ed with <strong>the</strong>se processes.<br />
SCOR provides…<br />
Standard processes:<br />
Plan, Source, Make, Deliver, Return, Enable<br />
Standard metrics:<br />
Perfect Order Delivery, <strong>Supply</strong>-<strong>Chain</strong> Cost, etc.<br />
Best practices:<br />
EDI, CPFR, etc.<br />
Pre-defined rel<strong>at</strong>ionships among processes,<br />
metrics and practices<br />
SCOR allows…<br />
Common supply chain terminology th<strong>at</strong><br />
transl<strong>at</strong>es across industries and organiz<strong>at</strong>ions,<br />
which permits:<br />
– Meaningful benchmarking with o<strong>the</strong>r<br />
organiz<strong>at</strong>ions<br />
– Common metrics for performance assessment<br />
and comparison<br />
– Incorpor<strong>at</strong>ion of industry best practices to<br />
improve supply chain performance<br />
© 2010 <strong>Supply</strong> <strong>Chain</strong> Council. ALL RIGHTS RESERVED. | <strong>Supply</strong> <strong>Chain</strong> Perf. Mgmt. <strong>at</strong> VA | Slide 7 | 28 March 2012
In <strong>the</strong> baseline, we identified <strong>the</strong> customers and suppliers as well as<br />
<strong>the</strong> products required by <strong>the</strong> customers to define <strong>the</strong> supply chains<br />
Who are <strong>the</strong> stakeholders<br />
Wh<strong>at</strong> are <strong>the</strong>ir responsibilities<br />
Wh<strong>at</strong> processes are used<br />
Service Provider Profiles<br />
RACI M<strong>at</strong>rix<br />
Wh<strong>at</strong> do we procure for<br />
our customers<br />
<strong>Supply</strong> <strong>Chain</strong> <strong>Management</strong> Scope<br />
Which customers require wh<strong>at</strong> products<br />
<strong>Supply</strong> <strong>Chain</strong> Definition M<strong>at</strong>rix<br />
© 2010 <strong>Supply</strong> <strong>Chain</strong> Council. ALL RIGHTS RESERVED. | <strong>Supply</strong> <strong>Chain</strong> Perf. Mgmt. <strong>at</strong> VA | Slide 8 | 28 March 2012
Understanding organiz<strong>at</strong>ional supply chain rel<strong>at</strong>ionships and<br />
hierarchical process linkages are key to identifying performance<br />
measurement dependencies<br />
Enable <strong>Supply</strong> <strong>Chain</strong><br />
P = Plan<br />
S = Source<br />
M = Make<br />
D = Deliver<br />
R = Return<br />
E = Enable<br />
VA Acquisition<br />
Academy<br />
Transactions<br />
Formal Rel<strong>at</strong>ionships<br />
S<br />
R<br />
<strong>Supply</strong><br />
Distribution<br />
Center<br />
P<br />
EP ES<br />
OAL<br />
Marketing &<br />
Business<br />
Rel<strong>at</strong>ionships<br />
Pharm<br />
IT<br />
ES S<br />
ER<br />
VACO<br />
ES S<br />
ER<br />
Str<strong>at</strong>egic<br />
Acquisition<br />
Center<br />
D<br />
R<br />
Center for<br />
Acquisition<br />
Innov<strong>at</strong>ion<br />
Suppliers<br />
Nutrition<br />
CFM Med/<br />
Surg HCS<br />
N<strong>at</strong>ional Acquisition<br />
Center<br />
ES S<br />
ES S<br />
ER<br />
ER<br />
Technical Acquisition<br />
Center<br />
ES<br />
S<br />
Denver ER<br />
Acquisition<br />
and Logistics<br />
Center<br />
M<br />
SAO-E<br />
SAO-C<br />
SAO-W<br />
ES S<br />
ER<br />
Regional<br />
Contract Center<br />
S<br />
Veterans<br />
VHA<br />
P<br />
ES EP<br />
VBA<br />
OAL<br />
NCA<br />
S<br />
P<br />
M<br />
R<br />
Administr<strong>at</strong>ions<br />
Service Providers<br />
Benefit Offices/<br />
Centers<br />
OAL<br />
Medical Centers/ Cemeteries<br />
Clinics<br />
D<br />
© 2010 <strong>Supply</strong> <strong>Chain</strong> Council. ALL RIGHTS RESERVED. | <strong>Supply</strong> <strong>Chain</strong> Perf. Mgmt. <strong>at</strong> VA | Slide 9 | 28 March 2012
The medical supply chains are enabled by prime vendor contracts,<br />
as well as, n<strong>at</strong>ional and local contracts<br />
Veterans<br />
GOODS and SERVICES<br />
$$$/POLICY/GUIDANCE<br />
INFORMATION and REQUIREMENTS<br />
Oversight<br />
Requests<br />
Requirements<br />
© 2010 <strong>Supply</strong> <strong>Chain</strong> Council. ALL RIGHTS RESERVED. | <strong>Supply</strong> <strong>Chain</strong> Perf. Mgmt. <strong>at</strong> VA | Slide 10 | 28 March 2012
The <strong>Supply</strong> <strong>Chain</strong> M<strong>at</strong>urity Assessment is designed to provide a<br />
diagnostic approach to improving supply chain oper<strong>at</strong>ions<br />
<strong>Supply</strong> <strong>Chain</strong> M<strong>at</strong>urity Model Process<br />
Benefits<br />
Best practice assessment for<br />
each supply chain capability<br />
Aligned with SCOR framework<br />
Booz Allen’s <strong>Supply</strong> <strong>Chain</strong> Expertise<br />
Major findings by capability area<br />
Improvement opportunities<br />
mapped against organiz<strong>at</strong>ion<br />
priorities and supply chain<br />
capability areas<br />
Structured Analytic Approach<br />
© 2010 <strong>Supply</strong> <strong>Chain</strong> Council. ALL RIGHTS RESERVED. | <strong>Supply</strong> <strong>Chain</strong> Perf. Mgmt. <strong>at</strong> VA | Slide 11 | 28 March 2012
Source: VA Interviews and Surveys, Booz Allen Hamilton Analysis<br />
Focus areas for improvement can be gleaned by comparing<br />
organiz<strong>at</strong>ional priorities to process m<strong>at</strong>urity<br />
© 2010 <strong>Supply</strong> <strong>Chain</strong> Council. ALL RIGHTS RESERVED. | <strong>Supply</strong> <strong>Chain</strong> Perf. Mgmt. <strong>at</strong> VA | Slide 12 | 28 March 2012
The <strong>Supply</strong> <strong>Chain</strong> M<strong>at</strong>urity Assessment results provide <strong>the</strong> found<strong>at</strong>ion<br />
for pursuing improvement initi<strong>at</strong>ives; improvements in <strong>the</strong>se four<br />
focus areas will have a positive effect on <strong>the</strong> remaining areas<br />
Improvement<br />
Areas<br />
Improvement Initi<strong>at</strong>ives<br />
Objectives<br />
<strong>Supply</strong> <strong>Chain</strong><br />
Str<strong>at</strong>egy<br />
Organiz<strong>at</strong>ional<br />
awareness/alignment<br />
<strong>Performance</strong><br />
<strong>Management</strong><br />
Quantified and<br />
consistent business<br />
outcomes<br />
IT/D<strong>at</strong>a Collection<br />
and <strong>Management</strong><br />
Enterprise visibility of<br />
supply chain<br />
requirements,<br />
resources and<br />
performance<br />
<br />
Risk <strong>Management</strong><br />
Str<strong>at</strong>egically-aligned<br />
and evidence-based<br />
resource management<br />
© 2010 <strong>Supply</strong> <strong>Chain</strong> Council. ALL RIGHTS RESERVED. | <strong>Supply</strong> <strong>Chain</strong> Perf. Mgmt. <strong>at</strong> VA | Slide 13 | 28 March 2012
Table of Contents<br />
VA <strong>Supply</strong> <strong>Chain</strong> Transform<strong>at</strong>ion<br />
SCOR Baseline<br />
<strong>Supply</strong> <strong>Chain</strong> <strong>Performance</strong> Metrics<br />
Prototype <strong>Supply</strong> <strong>Chain</strong> Dashboard<br />
<strong>Supply</strong> <strong>Chain</strong> <strong>Performance</strong> <strong>Management</strong> Framework<br />
© 2010 <strong>Supply</strong> <strong>Chain</strong> Council. ALL RIGHTS RESERVED. | <strong>Supply</strong> <strong>Chain</strong> Perf. Mgmt. <strong>at</strong> VA | Slide 14 | 28 March 2012
<strong>Performance</strong> metrics will capture how well <strong>the</strong> supply chain<br />
organiz<strong>at</strong>ion supports <strong>the</strong> overall VA value stream<br />
Plan<br />
Currently, <strong>the</strong>re is visibility to Veteran-care<br />
outcomes, but little traceability to supply<br />
chain drivers, effects, and impact<br />
Deliver<br />
Source<br />
Make<br />
Deliver<br />
Source Make Deliver<br />
Source Make Deliver<br />
Source<br />
Return<br />
Return<br />
Return Return Return<br />
Return Return Return<br />
Source: SCC<br />
Suppliers’<br />
Supplier<br />
Supplier<br />
VA<br />
Acquisition and Logistics<br />
Service<br />
Providers<br />
Veterans<br />
In addition to <strong>the</strong> effects on “Outcomes”, leadership is interested in monitoring and<br />
optimizing <strong>the</strong> Quality, Responsiveness and Cost of <strong>the</strong> <strong>Supply</strong> <strong>Chain</strong> Organiz<strong>at</strong>ion<br />
• Wh<strong>at</strong> is <strong>the</strong> Quality of supply chain product and service delivery<br />
• How Responsive is <strong>the</strong> supply chain to service providers<br />
• Wh<strong>at</strong> is <strong>the</strong> Cost to <strong>the</strong> enterprise (rel<strong>at</strong>ive to overall expenditures)<br />
© 2010 <strong>Supply</strong> <strong>Chain</strong> Council. ALL RIGHTS RESERVED. | <strong>Supply</strong> <strong>Chain</strong> Perf. Mgmt. <strong>at</strong> VA | Slide 15 | 28 March 2012<br />
15
The SCOR model includes metrics rel<strong>at</strong>ed to five performance <strong>at</strong>tributes<br />
<strong>Performance</strong> Attribute Definition KPIs<br />
Responsiveness<br />
The speed <strong>at</strong> which a supply chain provides<br />
products to <strong>the</strong> customer<br />
Order Fulfillment Cycle Time<br />
Physical SCM<br />
<strong>Performance</strong> KPIs<br />
Reliability<br />
Flexibility<br />
Delivery of <strong>the</strong> correct product to <strong>the</strong> correct place<br />
<strong>at</strong> <strong>the</strong> correct time in <strong>the</strong> correct condition and<br />
packaging in <strong>the</strong> correct quantity with <strong>the</strong> correct<br />
document<strong>at</strong>ion to <strong>the</strong> correct customer<br />
The agility of <strong>the</strong> supply chain in responding to<br />
changes in demand<br />
Perfect Order Fulfillment<br />
Upside <strong>Supply</strong> <strong>Chain</strong> Flexibility<br />
Upside <strong>Supply</strong> <strong>Chain</strong> Adaptability<br />
Downside <strong>Supply</strong> <strong>Chain</strong> Adaptability<br />
Financial SCM<br />
<strong>Performance</strong> KPIs<br />
Cost<br />
Asset<br />
<strong>Management</strong><br />
All costs associ<strong>at</strong>ed with oper<strong>at</strong>ing <strong>the</strong> supply<br />
chain<br />
Effectiveness in <strong>the</strong> management of (fixed and<br />
working capital) assets used in <strong>the</strong> process of<br />
s<strong>at</strong>isfying demand<br />
Total Cost to Serve<br />
Cash-to-cash Cycle Time<br />
Return on <strong>Supply</strong> <strong>Chain</strong> fixed assets<br />
© 2010 <strong>Supply</strong> <strong>Chain</strong> Council. ALL RIGHTS RESERVED. | <strong>Supply</strong> <strong>Chain</strong> Perf. Mgmt. <strong>at</strong> VA | Slide 16 | 28 March 2012<br />
Source: <strong>Supply</strong> <strong>Chain</strong> Council – SCOR model<br />
16
<strong>Performance</strong> <strong>Management</strong> Framework: Three distinct levels of<br />
metrics illumin<strong>at</strong>e <strong>the</strong> health of <strong>the</strong> supply chain from <strong>the</strong> str<strong>at</strong>egic<br />
(top level), oper<strong>at</strong>ional, and diagnostic perspectives<br />
Quality: <strong>the</strong> measurement of how well <strong>the</strong> supply chain provides needed<br />
supplies and services to fill service provider (clinician) requirements<br />
Cost: sum of <strong>the</strong> costs associ<strong>at</strong>ed with<br />
acquiring, managing, and delivering<br />
m<strong>at</strong>erials and services to clinicians<br />
Responsiveness: measures how timely <strong>the</strong> goods and services<br />
are provided to <strong>the</strong> service provider (clinician)<br />
Order<br />
Fulfillment<br />
Cycle Time<br />
SR-01<br />
Perfect<br />
Order<br />
Fulfillment<br />
SQ-01<br />
Total<br />
<strong>Supply</strong><br />
<strong>Chain</strong> Cost<br />
SC-01<br />
Top-level <strong>Performance</strong>:<br />
Measures overall performance in delivering on <strong>the</strong> mission<br />
and <strong>the</strong> str<strong>at</strong>egic goals and objectives. These metrics<br />
provide a broad end-to-end view of <strong>the</strong> supply chain.<br />
EIL<br />
Indices<br />
(In/Out P<strong>at</strong>ient)<br />
Equipment<br />
Availability R<strong>at</strong>e<br />
OR-01<br />
Estim<strong>at</strong>ed Inventory<br />
Usage Per P<strong>at</strong>ient<br />
(In/Out P<strong>at</strong>ient)<br />
Oblig<strong>at</strong>ion R<strong>at</strong>io<br />
(Labor $: M<strong>at</strong>erial $<br />
: Overhead $)<br />
OC-01<br />
Customer<br />
Fulfillment<br />
TSCC as a<br />
% of Total<br />
Budget<br />
OC-02<br />
Logistics<br />
Department Flow<br />
SCM / Oper<strong>at</strong>ional Effectiveness:<br />
Measures execution of particular<br />
aspects of supply chain oper<strong>at</strong>ions.<br />
These metrics provide context to supply<br />
chain functions, often rel<strong>at</strong>ing one set of<br />
functions to ano<strong>the</strong>r.<br />
OC-03<br />
OC-04<br />
OQ-01<br />
OR-02<br />
Reutiliz<strong>at</strong>ion<br />
DC-01<br />
Average<br />
Inventory<br />
Value<br />
DC-02<br />
Inventory<br />
<strong>Management</strong> --<br />
Standard<br />
Items: On-<br />
Demand Items<br />
DR-01<br />
Inventory<br />
Stockouts<br />
DR-02<br />
Inventory<br />
Accuracy<br />
Days of<br />
<strong>Supply</strong><br />
Inventory<br />
Turns<br />
Value of<br />
Inventory<br />
(Long, and<br />
Inactive)<br />
Report<br />
of Survey<br />
(Value<br />
and Dur<strong>at</strong>ion)<br />
DQ-05 DC-03 DR-03 DC-04 DC-05<br />
Planned<br />
Cost to<br />
Actual Cost<br />
R<strong>at</strong>io<br />
DC-07<br />
SCM Diagnostics:<br />
Help identify factors<br />
affecting changes in<br />
performance measures.<br />
Orders<br />
Delivered<br />
in Full<br />
DQ-01<br />
Delivery Perf<br />
To Customer<br />
Required D<strong>at</strong>e<br />
DQ-02<br />
Document<strong>at</strong>ion<br />
Accuracy<br />
DQ-03<br />
Perfect<br />
Condition<br />
DQ-04<br />
Contract<br />
<strong>Management</strong><br />
Lead Time<br />
Average<br />
Age <strong>Supply</strong><br />
<strong>Chain</strong> Policy<br />
Compliance/<br />
Standardiz<strong>at</strong>ion<br />
Percent<br />
Purchased on<br />
Existing<br />
Contracts<br />
Percent<br />
Purchased<br />
Electronically<br />
Transport<strong>at</strong>ion<br />
Costs<br />
DR-04 DQ-06 DQ-07<br />
DR-05<br />
DR-06<br />
DC-06<br />
Spend Analysis<br />
(Method of<br />
Purchase)<br />
DQ-08<br />
© 2010 <strong>Supply</strong> <strong>Chain</strong> Council. ALL RIGHTS RESERVED. | <strong>Supply</strong> <strong>Chain</strong> Perf. Mgmt. <strong>at</strong> VA | Slide 17 | 28 March 2012<br />
17
Metric Detail (Example)<br />
Order Fulfillment Cycle Time<br />
SR-01<br />
DEFINITION<br />
REASON FOR<br />
METRIC<br />
CALCULATION<br />
DATA<br />
ELEMENTS<br />
SOURCE<br />
DATA GAPS<br />
FREQUENCY<br />
Average actual cycle time consistently achieved to fulfill customer orders. For each individual order, this cycle time starts from <strong>the</strong><br />
purchase request placed for an order and ends with d<strong>at</strong>e of customer acceptance of <strong>the</strong> order.<br />
Cycle time improvements have been linked to reduced costs, reduced inventories, and increased capacity. Having to compens<strong>at</strong>e for a<br />
long cycle time drives a need for increased inventory. An increased inventory increases <strong>the</strong> days of supply; increased days of supply lowers<br />
inventory turns. Obviously, an increased inventory raises m<strong>at</strong>eriel costs in <strong>the</strong> supply chain. Order Fulfillment Cycle Time is a top level<br />
measure of <strong>the</strong> str<strong>at</strong>egic responsiveness of <strong>the</strong> supply chain; it is also a point of comparison to work towards cycle time reduction.<br />
Order Fulfillment Cycle Time = [Sum Actual Cycle Times For All Orders Delivered] / [Total Number Of Orders Delivered] Expressed in days.<br />
As shown in <strong>the</strong> example, <strong>the</strong> sum includes <strong>the</strong> elapsed time between <strong>the</strong> d<strong>at</strong>e <strong>the</strong> purchase order is assigned and <strong>the</strong> d<strong>at</strong>e <strong>the</strong> item is<br />
received.<br />
Currently, OFCT is measured as <strong>the</strong> time from <strong>the</strong> release of <strong>the</strong> purchase order to <strong>the</strong> time <strong>the</strong> order is received <strong>at</strong> facility inbound<br />
logistics. However, OFCT is commonly defined as <strong>the</strong> sum of <strong>the</strong> source cycle time and <strong>the</strong> delivery cycle time. Th<strong>at</strong> is, from purchase<br />
request until it is delivered to <strong>the</strong> end user, excluding non-value add time. In our case, Source Cycle Time to Primary Inventory is <strong>the</strong> time<br />
from purchase request to <strong>the</strong> time <strong>the</strong> purchase order is released + time until <strong>the</strong> order is received <strong>at</strong> facility inbound logistics; and Delivery<br />
Cycle Time is <strong>the</strong> time from order receipt <strong>at</strong> <strong>the</strong> VA facility until it is delivered to user, currently only measured to <strong>the</strong> primary inventory.<br />
IFCAP<br />
• Item receipt time-stamp is not regularly recorded<br />
• Initial requirement d<strong>at</strong>e is not regularly recorded<br />
Monthly<br />
PurchaseOrderNum <strong>Supply</strong>St<strong>at</strong>us D<strong>at</strong>ePoAssigned PoD<strong>at</strong>e OriginalDeliveryD<strong>at</strong>e D<strong>at</strong>eReceived LineItemIDNum QtyReceived<br />
XXX-0U8570 Transaction Complete (Amended) 7/8/2010 7/8/2010 7/13/2010 7/14/2010 1 1<br />
XXX-0U8570 Transaction Complete (Amended) 7/8/2010 7/8/2010 7/13/2010 7/14/2010 2 2<br />
XXX-0U8570 Transaction Complete (Amended) 7/8/2010 7/8/2010 7/13/2010 7/14/2010 3 1<br />
XXX-A02051 Partial Order Received (Amended) 7/14/2010 7/14/2010 8/14/2010 8/18/2010 3 1<br />
XXX-A02051 Partial Order Received (Amended) 7/14/2010 7/14/2010 8/14/2010 8/18/2010 4 1<br />
XXX-A02051 Partial Order Received (Amended) 7/14/2010 7/14/2010 8/14/2010 9/7/2010 4 1<br />
XXX-P02854 Transaction Complete 8/30/2010 8/30/2010 9/9/2010 9/15/2010 1 6<br />
XXX-P02854 Transaction Complete 8/30/2010 8/30/2010 9/9/2010 9/15/2010 2 4<br />
XXX-P02854 Transaction Complete 8/30/2010 8/30/2010 9/9/2010 9/21/2010 2 2<br />
© 2010 <strong>Supply</strong> <strong>Chain</strong> Council. ALL RIGHTS RESERVED. | <strong>Supply</strong> <strong>Chain</strong> Perf. Mgmt. <strong>at</strong> VA | Slide 18 | 28 March 2012
Table of Contents<br />
VA <strong>Supply</strong> <strong>Chain</strong> Transform<strong>at</strong>ion<br />
SCOR Baseline<br />
<strong>Supply</strong> <strong>Chain</strong> <strong>Performance</strong> Metrics<br />
Prototype <strong>Supply</strong> <strong>Chain</strong> Dashboard<br />
<strong>Supply</strong> <strong>Chain</strong> <strong>Performance</strong> <strong>Management</strong> Framework<br />
© 2010 <strong>Supply</strong> <strong>Chain</strong> Council. ALL RIGHTS RESERVED. | <strong>Supply</strong> <strong>Chain</strong> Perf. Mgmt. <strong>at</strong> VA | Slide 19 | 28 March 2012
The “Manage <strong>Performance</strong> of <strong>Supply</strong> <strong>Chain</strong>” process has been<br />
visualized in a Prototype <strong>Supply</strong> <strong>Chain</strong> Dashboard<br />
1. <strong>Supply</strong> <strong>Chain</strong><br />
Health<br />
2. Opportunities for<br />
Savings<br />
3. Progress of<br />
Improvement<br />
Initi<strong>at</strong>ives<br />
© 2010 <strong>Supply</strong> <strong>Chain</strong> Council. ALL RIGHTS RESERVED. | <strong>Supply</strong> <strong>Chain</strong> Perf. Mgmt. <strong>at</strong> VA | Slide 20 | 28 March 2012
Prototype Dashboard D<strong>at</strong>a Processing<br />
D<strong>at</strong>a Sources:<br />
– Procurement Records<br />
– Inventory Records<br />
– Asset <strong>Management</strong> Records<br />
– Labor History<br />
– Customer Volume Records<br />
– Policy Records<br />
FY2010 d<strong>at</strong>a – illustr<strong>at</strong>ive only<br />
– Future implement<strong>at</strong>ion requires access to source authorit<strong>at</strong>ive d<strong>at</strong>abases<br />
Received approxim<strong>at</strong>ely 12GB of d<strong>at</strong>a from legacy systems<br />
– Limited granularity (e.g., PO numbers do not reveal <strong>the</strong> items ordered)<br />
– Many blank fields and records<br />
D<strong>at</strong>a required some prepar<strong>at</strong>ory work<br />
– Select primary inventories analyzed<br />
– Excluded some administr<strong>at</strong>ive c<strong>at</strong>egories, research, training, grounds upkeep, etc.<br />
– Classified costs as labor, m<strong>at</strong>erial, overhead, or not applicable<br />
– Required normalizing<br />
Did not try to cleanse <strong>the</strong> d<strong>at</strong>a of mistakes or o<strong>the</strong>r anomalies<br />
– Graphics reflect d<strong>at</strong>a peculiarities (e.g., neg<strong>at</strong>ive inventory values)<br />
– Prototype not connected to live d<strong>at</strong>abases<br />
© 2010 <strong>Supply</strong> <strong>Chain</strong> Council. ALL RIGHTS RESERVED. | <strong>Supply</strong> <strong>Chain</strong> Perf. Mgmt. <strong>at</strong> VA | Slide 21 | 28 March 2012
Dashboard effort focused on metrics th<strong>at</strong> already had available d<strong>at</strong>a;<br />
Where VA does not collect d<strong>at</strong>a <strong>at</strong> <strong>the</strong> n<strong>at</strong>ional-level, metrics are “Pending”<br />
On Display<br />
● Perfect Order Fulfillment (Notional*) (SQ-01)<br />
● Order Fulfillment Cycle Time (SR-01)<br />
● Total <strong>Supply</strong> <strong>Chain</strong> Cost (SC-01)<br />
● Customer Fulfillment (Notional*)(OQ-01)<br />
● Logistics Department Flow (OR-02)<br />
● Oblig<strong>at</strong>ion R<strong>at</strong>io (OC-01)<br />
● TSCC as Percent of Total Cost (OC-02)<br />
● SC EIL Index (OC-03)<br />
● Estim<strong>at</strong>ed Inventory Cost per P<strong>at</strong>ient Day (OC-04)<br />
Pending*<br />
● Equipment Availability R<strong>at</strong>e (OR-01)<br />
● Document<strong>at</strong>ion Accuracy (Notional*) (DQ-03)<br />
● Perfect Condition (Notional*) (DQ-04)<br />
● Inventory Accuracy (DQ-05)<br />
● Inventory Stockouts (DR-02)<br />
● Contract <strong>Management</strong> Lead Time (DR-04)<br />
● Percent Purchased Electronically (DR-05)<br />
● Planned Cost to Actual Cost (DC-07)<br />
● Orders Delivered in Full (DQ-01)<br />
● Delivered by Required D<strong>at</strong>e (DQ-02)<br />
● Average Age <strong>Supply</strong> <strong>Chain</strong> Policy (DQ-06)<br />
● Method of Purchase (DQ-08)<br />
● Compliance and Standardiz<strong>at</strong>ion (DQ-07)<br />
● Inventory <strong>Management</strong> – STD:ODI R<strong>at</strong>io (DR-01)<br />
● Inventory Turnover R<strong>at</strong>e (DR-03)<br />
● Percent Purchased on Existing Contracts (DR-05)<br />
● Reutiliz<strong>at</strong>ion (DC-01)<br />
● Average Inventory Value (DC-02)<br />
● Days of <strong>Supply</strong> (DC-03)<br />
● Value Long and Inactive <strong>Supply</strong> (DC-04)<br />
● Report of Survey Value and Dur<strong>at</strong>ion (DC-05)<br />
● Transport<strong>at</strong>ion Costs (DC-06)<br />
* Complete d<strong>at</strong>a not yet available<br />
© 2010 <strong>Supply</strong> <strong>Chain</strong> Council. ALL RIGHTS RESERVED. | <strong>Supply</strong> <strong>Chain</strong> Perf. Mgmt. <strong>at</strong> VA | Slide 22 | 28 March 2012
Reports will be transmitted using various styles of visualiz<strong>at</strong>ion to<br />
help clarify trends, p<strong>at</strong>terns, and outliers.<br />
Combin<strong>at</strong>ion Charts are used to display such metrics as Reports of Survey and<br />
Perfect Order Fulfillment<br />
Bubble Charts are used to display Average Policy Age<br />
Line Charts are used for metrics such as Days of<br />
<strong>Supply</strong>, Inventory Turns, and Value of Long and Inactive<br />
Inventory<br />
Stacked Column Charts are used to display<br />
metrics such Standard to On Demand<br />
Inventory and Average Inventory Value<br />
Pie Charts are used to display Reutiliz<strong>at</strong>ion<br />
Bar Charts are used to display comparisons such as<br />
comparisons of Total <strong>Supply</strong> <strong>Chain</strong> Costs and comparisons of<br />
EIL Indices<br />
Multi-Series Column Charts are used to display<br />
metrics such as Oblig<strong>at</strong>ion R<strong>at</strong>io as well as<br />
aggreg<strong>at</strong>e reports.<br />
Column Charts are used to display comparisons<br />
such as Percent Purchasing on Existing Contracts<br />
© 2010 <strong>Supply</strong> <strong>Chain</strong> Council. ALL RIGHTS RESERVED. | <strong>Supply</strong> <strong>Chain</strong> Perf. Mgmt. <strong>at</strong> VA | Slide 23 | 28 March 2012
The dashboard gives <strong>the</strong> analyst <strong>the</strong> opportunity to perform<br />
caus<strong>at</strong>ive research<br />
Average Inventory Value (DC-02)<br />
Long and Inactive <strong>Supply</strong> (DC-04)<br />
Days of <strong>Supply</strong> (DC-03)<br />
Standard to On Demand (DR-01a)<br />
© 2010 <strong>Supply</strong> <strong>Chain</strong> Council. ALL RIGHTS RESERVED. | <strong>Supply</strong> <strong>Chain</strong> Perf. Mgmt. <strong>at</strong> VA | Slide 24 | 28 March 2012
The dashboard gives managers <strong>at</strong> all levels <strong>the</strong> ability to drill down<br />
and conduct caus<strong>at</strong>ive research into d<strong>at</strong>a outliers and anomalies<br />
D<strong>at</strong>a “rolls up” and allows for<br />
“drill down” transparency<br />
Identifies inconsistent or<br />
incomplete d<strong>at</strong>a<br />
Conduct compar<strong>at</strong>ive analysis<br />
between like facilities or<br />
contrasting metrics<br />
Highlights d<strong>at</strong>a outliers<br />
Facilit<strong>at</strong>es trend and<br />
root cause analyses<br />
© 2010 <strong>Supply</strong> <strong>Chain</strong> Council. ALL RIGHTS RESERVED. | <strong>Supply</strong> <strong>Chain</strong> Perf. Mgmt. <strong>at</strong> VA | Slide 25 | 28 March 2012
Table of Contents<br />
VA <strong>Supply</strong> <strong>Chain</strong> Transform<strong>at</strong>ion<br />
SCOR Baseline<br />
<strong>Supply</strong> <strong>Chain</strong> <strong>Performance</strong> Metrics<br />
Prototype <strong>Supply</strong> <strong>Chain</strong> Dashboard<br />
<strong>Supply</strong> <strong>Chain</strong> <strong>Performance</strong> <strong>Management</strong> Framework<br />
© 2010 <strong>Supply</strong> <strong>Chain</strong> Council. ALL RIGHTS RESERVED. | <strong>Supply</strong> <strong>Chain</strong> Perf. Mgmt. <strong>at</strong> VA | Slide 26 | 28 March 2012
We have <strong>the</strong> metrics; we have <strong>the</strong> d<strong>at</strong>a; we have <strong>the</strong> dashboard …<br />
…so wh<strong>at</strong> is next and how does it all fit toge<strong>the</strong>r<br />
High d<strong>at</strong>a<br />
confidence,<br />
integr<strong>at</strong>ion,<br />
and accessibility<br />
lead to accur<strong>at</strong>e<br />
reports;<br />
it is <strong>the</strong> backbone<br />
of performance<br />
management<br />
D<strong>at</strong>a<br />
Metrics<br />
Linked to<br />
str<strong>at</strong>egic goals<br />
and objectives;<br />
will provide an<br />
assessment of<br />
supply chain<br />
health<br />
Establishes <strong>the</strong><br />
processes<br />
required for<br />
effective<br />
performance<br />
management of<br />
metrics<br />
sEP.2.1<br />
Define<br />
sEP.2<br />
Manage <strong>Performance</strong><br />
of <strong>Supply</strong> <strong>Chain</strong><br />
sEP.2.2<br />
Monitor<br />
Process<br />
sEP.2.3<br />
Evalu<strong>at</strong>e<br />
Organiz<strong>at</strong>ion<br />
Establishes <strong>the</strong> roles,<br />
responsibilities, and<br />
team structure<br />
sEP.2.4<br />
Leverage<br />
Technology<br />
Provides<br />
visualiz<strong>at</strong>ion of<br />
metrics and<br />
potential<br />
methods of<br />
implement<strong>at</strong>ion<br />
© 2010 <strong>Supply</strong> <strong>Chain</strong> Council. ALL RIGHTS RESERVED. | <strong>Supply</strong> <strong>Chain</strong> Perf. Mgmt. <strong>at</strong> VA | Slide 27 | 28 March 2012
Contact us <strong>at</strong>…<br />
• Nelson Gonzalez<br />
VA Str<strong>at</strong>egic Sourcing Program Manager<br />
Office of Acquisition & Logistics Programs & Policy<br />
U.S. Department of Veterans Affairs<br />
Nelson.Gonzalez2@va.gov<br />
(202) 429-8439<br />
• Brian K. Frank<br />
Booz|Allen|Hamilton, Inc.<br />
frank_brian@bah.com<br />
(202) 429-2090<br />
• Brian L. Shaw<br />
Booz|Allen|Hamilton, Inc.<br />
shaw_brian@bah.com<br />
(202) 429-2074<br />
http://www.va.gov/<br />
© 2010 <strong>Supply</strong> <strong>Chain</strong> Council. ALL RIGHTS RESERVED. | <strong>Supply</strong> <strong>Chain</strong> Perf. Mgmt. <strong>at</strong> VA | Slide 28 | 28 March 2012