Post-class Quiz #3 - Measures of Association Question 1 5 points A ...
Post-class Quiz #3 - Measures of Association Question 1 5 points A ...
Post-class Quiz #3 - Measures of Association Question 1 5 points A ...

You also want an ePaper? Increase the reach of your titles
YUMPU automatically turns print PDFs into web optimized ePapers that Google loves.
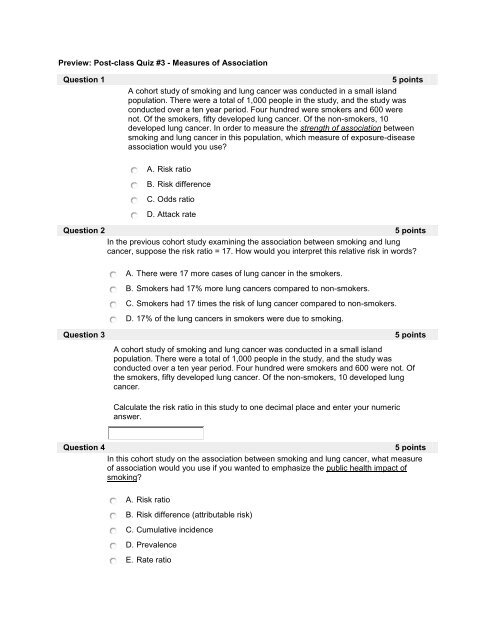
Preview: <strong>Post</strong>-<strong>class</strong> <strong>Quiz</strong> <strong>#3</strong> - <strong>Measures</strong> <strong>of</strong> <strong>Association</strong><br />
<strong>Question</strong> 1<br />
5 <strong>points</strong><br />
A cohort study <strong>of</strong> smoking and lung cancer was conducted in a small island<br />
population. There were a total <strong>of</strong> 1,000 people in the study, and the study was<br />
conducted over a ten year period. Four hundred were smokers and 600 were<br />
not. Of the smokers, fifty developed lung cancer. Of the non-smokers, 10<br />
developed lung cancer. In order to measure the strength <strong>of</strong> association between<br />
smoking and lung cancer in this population, which measure <strong>of</strong> exposure-disease<br />
association would you use<br />
<strong>Question</strong> 2<br />
A. Risk ratio<br />
B. Risk difference<br />
C. Odds ratio<br />
D. Attack rate<br />
5 <strong>points</strong><br />
In the previous cohort study examining the association between smoking and lung<br />
cancer, suppose the risk ratio = 17. How would you interpret this relative risk in words<br />
A. There were 17 more cases <strong>of</strong> lung cancer in the smokers.<br />
B. Smokers had 17% more lung cancers compared to non-smokers.<br />
C. Smokers had 17 times the risk <strong>of</strong> lung cancer compared to non-smokers.<br />
D. 17% <strong>of</strong> the lung cancers in smokers were due to smoking.<br />
<strong>Question</strong> 3<br />
5 <strong>points</strong><br />
A cohort study <strong>of</strong> smoking and lung cancer was conducted in a small island<br />
population. There were a total <strong>of</strong> 1,000 people in the study, and the study was<br />
conducted over a ten year period. Four hundred were smokers and 600 were not. Of<br />
the smokers, fifty developed lung cancer. Of the non-smokers, 10 developed lung<br />
cancer.<br />
Calculate the risk ratio in this study to one decimal place and enter your numeric<br />
answer.<br />
<strong>Question</strong> 4<br />
5 <strong>points</strong><br />
In this cohort study on the association between smoking and lung cancer, what measure<br />
<strong>of</strong> association would you use if you wanted to emphasize the public health impact <strong>of</strong><br />
smoking<br />
A. Risk ratio<br />
B. Risk difference (attributable risk)<br />
C. Cumulative incidence<br />
D. Prevalence<br />
E. Rate ratio
F. Odds ratio<br />
<strong>Question</strong> 5<br />
Calculate the risk difference for the island study on smoking.<br />
5 <strong>points</strong><br />
<strong>Question</strong> 6<br />
A. 7.5<br />
B. 108 per 1,000 population over a ten year period<br />
C. 0.108 per 1,000<br />
D. 0.125 per 1,000<br />
E. 0.017 per 1,000<br />
5 <strong>points</strong><br />
If the risk difference in the cohort study on smoking and lung cancer had been 69 per<br />
1,000 population over a ten year period, how would you interpret this result in words<br />
<strong>Question</strong> 7<br />
A. If smoking is a cause <strong>of</strong> lung cancer, then 69 cases <strong>of</strong> lung cancer will occur in<br />
a ten-year period .<br />
B. If smoking is a cause <strong>of</strong> lung cancer, then 69 cases <strong>of</strong> lung cancer will occur in<br />
a ten-year period in a population <strong>of</strong> 1,000 smokers.<br />
C. Smokers have 69 times more cancer than non-smokers over a 10 year period.<br />
D. If smoking is a cause <strong>of</strong> lung cancer, then smoking caused 69 excess cases <strong>of</strong><br />
lung cancer in a ten-year period in a population <strong>of</strong> 1,000 smokers.<br />
5 <strong>points</strong><br />
What is the attributable proportion among the exposed for the island study on smoking<br />
Round your answer to the nearest whole % and enter just the number, e.g., if the<br />
answer is 14%, just enter 14.<br />
<strong>Question</strong> 8<br />
5 <strong>points</strong><br />
Suppose that in the cohort study on smoking and lung cancer, the attributable proportion<br />
among the exposed had been 79%. Which <strong>of</strong> the following would be the best<br />
interpretation <strong>of</strong> this result<br />
<strong>Question</strong> 9<br />
A. Smokers have 79% more lung cancer.<br />
B. Non-smokers have 79% less lung cancer.<br />
C. 79% <strong>of</strong> all lung cancers in the population are attributable to smoking.<br />
D. 79% <strong>of</strong> the lung cancers occurring in smokers can be attributed to their<br />
smoking.<br />
5 <strong>points</strong><br />
Using the information for the island study on smoking above, calculate the population<br />
attributable fraction. Express your answer as a percentage, and round <strong>of</strong>f your answer to<br />
the nearest whole number (e.g. 0.17 = 17%, so enter 17).<br />
<strong>Question</strong> 10<br />
5 <strong>points</strong><br />
A pharmacist noticed an increase in the sale <strong>of</strong> anti-diarrhea medications and<br />
contacted the local Department <strong>of</strong> Public Health. An investigation revealed that most <strong>of</strong>
those who developed diarrhea had attended a wedding the previous weekend. After<br />
interviewing those who had attended the wedding, the investigators believed that a<br />
cream sauce used in the pasta may have been the source <strong>of</strong> the outbreak. There were<br />
332 people at the wedding. Of the 285 who chose pasta, 197 became ill, while only 8<br />
<strong>of</strong> those who did not eat pasta became ill. What is the value <strong>of</strong> the appropriate<br />
measure <strong>of</strong> association<br />
A. 1.0<br />
B. 4.06<br />
C. 0.83<br />
D. None <strong>of</strong> the above<br />
<strong>Question</strong> 11<br />
5 <strong>points</strong><br />
A cohort study <strong>of</strong> alcohol use and academic performance was conducted in an<br />
undergraduate student population over 3 years. There were 2,000 students in the<br />
study. Of the 1,450 who drank alcohol, 872 displayed significantly reduced academic<br />
performance on standardized tests. Of the 550 students who didn' t drink alcohol, 124<br />
showed reduced academic performance on standardized tests. What is the risk ratio in<br />
this study for drinkers compared to non-drinkers<br />
A. 2.67<br />
B. 1.0<br />
C. 1.77<br />
D. 0.37<br />
<strong>Question</strong> 12<br />
What is the risk difference for the above study<br />
5 <strong>points</strong><br />
<strong>Question</strong> 13<br />
A. 0.376<br />
B. 376<br />
C. -0.376<br />
D. 376 per 1000<br />
E. 376 per 1000 over 3 years<br />
5 <strong>points</strong><br />
D'Souza et al. conducted a study on the association between human papillomavirus<br />
and oropharyngeal cancer (N Engl J Med 2007;356:1944-56). They identified 100<br />
patients with newly diagnosed squamous-cell carcinomas <strong>of</strong> the head and neck in<br />
Baltimore from 2000 through 2005. The comparison group consisted <strong>of</strong> 200 patients<br />
without a history <strong>of</strong> cancer who were seen for benign conditions between 2000 and<br />
2005 in the same clinic. All patients completed a computer-assisted self-administered<br />
interview that recorded information about demographic characteristics, past oral<br />
hygiene, medical history, family history <strong>of</strong> cancer, lifetime sexual behaviors, and<br />
lifetime history <strong>of</strong> marijuana, tobacco, and alcohol use. Part <strong>of</strong> their results focused on<br />
the association between oral hygiene and oropharyngeal cancer, as shown in the table.<br />
To answer this question use the data table (DSouza_Table.JPG) from the article by<br />
D'Souza et al. (N Engl J Med 2007;356:1944-56) looking at a possible association
etween human papillomavirus and oropharyngeal cancer.<br />
Why is the odds ratio for tooth loss 1.0 for subjects with no tooth loss<br />
DSouza_Table.jpg<br />
<strong>Question</strong> 14<br />
A. On average, these subjects were missing one tooth.<br />
B. This was the reference group against which the other two groups were<br />
compared.<br />
C. The group that had no missing teeth had one subject with oropharyngeal<br />
cancer.<br />
D. All categories had an increased risk <strong>of</strong> oropharyngeal cancer, but it was lowest<br />
for the group with no missing teeth.<br />
5 <strong>points</strong><br />
Using the same data table, which <strong>of</strong> the following is the best interpretation <strong>of</strong> the odds<br />
ratio <strong>of</strong> 5.4 for those who did not brush their teeth every day<br />
DSouza_Table.jpg<br />
<strong>Question</strong> 15<br />
A. Oropharyngeal cancer occurred in 5.4% <strong>of</strong> those who did not brush their teeth<br />
daily.<br />
B. The prevalence <strong>of</strong> not brushing among people with oropharyngeal cancer was<br />
5.4%.<br />
C. The prevalence <strong>of</strong> not brushing among people without oropharyngeal cancer<br />
was 5.4%..<br />
D. Subjects who did not brush their teeth on a daily basis had 5.4 times the risk<br />
<strong>of</strong> oropharyngeal cancer compared to those who brushed daily.<br />
5 <strong>points</strong><br />
Statins and the Risk <strong>of</strong> Colorectal Cancer. Poynter, et al. N Engl J Med 2005;352:2184-<br />
92.<br />
Aspirin and other non-steroidal anti-inflammatory drugs (NSAIDS) have been shown to<br />
be associated with a decreased risk <strong>of</strong> colorectal cancer, but their chronic use is<br />
associated with complications and side effects. The statins drugs reduce serum<br />
cholesterol levels and reduce the risk <strong>of</strong> cardiovascular disease, and they are now<br />
widely used. Some evidence suggested that statins might also be effective in reducing<br />
the risk <strong>of</strong> colorectal cancer, but the studies were small and inconclusive.<br />
Health care coverage in Israel is mandated and is provided by four groups similar to<br />
HMOs. Their computerized records were used to identify all cases <strong>of</strong> colorectal cancer<br />
within a well defined geographic area in northern Israel for a six-year period from 1998<br />
to 2004. Subjects without colorectal cancer were identified by the same mechanism,<br />
and they were matched to the colorectal cancer patients year <strong>of</strong> birth, gender, primary<br />
clinic location, and ethnic group (Jewish vs. non-Jewish). Potential subjects in the<br />
comparison group were excluded if they had a history <strong>of</strong> colorectal cancer.<br />
“Participants were interviewed to obtain demographic information and information<br />
about their personal and family history <strong>of</strong> cancer, reproductive history, medical history,<br />
medication use, and health habits; they also completed a dietary questionnaire.<br />
Diagnoses <strong>of</strong> colorectal cancer were confirmed by means <strong>of</strong> a standardized<br />
pathological review by one pathologist.”
“Participants were asked to recall each medication they had used for at least five<br />
years, and statin use was determined on the basis <strong>of</strong> this list. The information gathered<br />
included dose, duration <strong>of</strong> use, and indication for use. ”<br />
The table (see link to Statin_Table. JPG) from the article on statins and colorectal<br />
cancer also suggests that there are differences in vegetable consumption between<br />
subjects with colorectal cancer and those who do not have cancer. Using subjects with<br />
low vegetable consumption as the reference group, what is the odds ratio for high<br />
vegetable consumption Which number is closest to the odds ratio<br />
Statin_Table.jpg<br />
<strong>Question</strong> 16<br />
A. 0.68<br />
B. 1.47<br />
C. 0.82<br />
D. 1.22<br />
E. 0.28<br />
5 <strong>points</strong><br />
From the CDC’s MMWR (Morbidity and Mortality Weekly Report, Jan. 13, 2006: In<br />
May 2004 MA DPH investigated an outbreak <strong>of</strong> gastrointestinal illness among students<br />
in grades 1-6 who ate lunch at a school in Suffolk County. Symptoms included nausea,<br />
headache, abdominal cramps, fatigue, dizziness, and vomiting. The investigation<br />
focused on 187 students who ate in the school cafeteria, 36 <strong>of</strong> whom became ill shortly<br />
after lunch. Fajitas were among the suspected foods. Among the ill students, 17 had<br />
eaten fajitas. Among the students who did not become ill, 25 had eaten fajitas.<br />
Calculate the appropriate measure <strong>of</strong> association that focuses on the strength <strong>of</strong> the<br />
association using the subjects who ate fajitas as the “exposed” group, and use the<br />
subjects who did not eat fajitas as the “unexposed group. Round your answer to the<br />
nearest tenth and submit the number.<br />
5)<br />
<strong>Question</strong> 17<br />
5 <strong>points</strong><br />
Antonia Trichopoulou, M.D., et al: Adherence to a Mediterranean Diet and Survival in a<br />
Greek Population. N Engl J Med 2003;348:2599-608.<br />
From 1994 to1999 a study was conducted to identify nutritional and lifestyle behaviors<br />
associated with survival in Greek adults. A total <strong>of</strong> 28,572 participants, 20 to 86 years<br />
old, were recruited from all regions <strong>of</strong> Greece. One goal was to study the extent to<br />
which close adherence to a traditional Mediterranean (Greek) diet was associated with<br />
survival, but the investigators also examined a number <strong>of</strong> other potential risk factors.<br />
After enrollment (i.e. at the baseline or beginning <strong>of</strong> the study), subjects completed<br />
extensive questionnaires administered in person by specially trained interviewers. The<br />
dietary questionnaire documented food intake during the past year using a semi-
quantitative food-frequency questionnaire that included 150 foods and beverages<br />
commonly consumed in Greece. Adherence to the traditional Mediterranean diet was<br />
assessed by a 10-point Mediterranean-diet scale. Some <strong>of</strong> the results are shown in the<br />
table included here.<br />
1) Low diet scores (0-3) indicated poor adherence to the Greek diet; scores <strong>of</strong> 4-5<br />
indicated moderate adherence, and scores <strong>of</strong> 6-9 indicated close (high) adherence to<br />
the Greek diet. Using men with poor (low) diet scores as the reference group,<br />
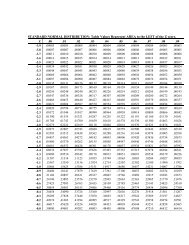
calculate incidence rates to 5 decimal places, and then calculate the rate ratio for men<br />
with a high degree <strong>of</strong> adherence compared to men with low adherence. Round your<br />
answer to two decimal places and submit your numeric answer online in the quiz.<br />
MediterraneanDiet_Table.jpg<br />
<strong>Question</strong> 18<br />
5 <strong>points</strong><br />
Based on the study above on the effects <strong>of</strong> adherence to a Mediterranean diet<br />
compute the rate difference per 10,000 person-yrs. <strong>of</strong> close (high) adherence to the<br />
Mediterranean diet versus poor (low) adherence. Over the course <strong>of</strong> one year, how<br />
many lives would be saved by convincing 10,000 Greek men with poor adherence to<br />
switch to a Mediterranean diet and adhere to it to a high degree (Round your answer<br />
to the nearest whole number <strong>of</strong> men.)<br />
<strong>Question</strong> 19<br />
5 <strong>points</strong><br />
A stroke prevention task force is trying to identify risk factors that, if modified by<br />
public health prevention programs, would have the greatest impact on reducing the<br />
incidence <strong>of</strong> stroke in the study population. There is disagreement among the task<br />
force about whether the number <strong>of</strong> strokes in the overall population would be<br />
reduced more by eliminating alcohol or smoking. The following information is<br />
available to you about alcohol abuse and smoking as risk factors.<br />
Risk <strong>of</strong> stroke Risk <strong>of</strong> stroke Proportion <strong>of</strong><br />
in exposed in unexposed cases exposed<br />
Risk factor (/100000) (/100000) in the population<br />
Alcohol abuse 107 43 0.21<br />
Smoking 90 60 0.31<br />
Compute the population attributable fraction for alcohol abuse and also for smoking<br />
in order to determine which risk factor, if modified, would have the greatest impact<br />
on reducing stroke in the study population. Modification <strong>of</strong> which risk factor would<br />
have the greatest impact in preventing stroke<br />
A. Elimination <strong>of</strong> alcohol would have the greatest impact<br />
B. Elimination <strong>of</strong> smoking would have the greatest impact
<strong>Question</strong> 20<br />
C. The impact would be equal<br />
D. This can't be determined from the information given here.<br />
5 <strong>points</strong><br />
If a cohort study is conducted to assess the association between an exposure and an<br />
outcome, but there is no association at all, what would the value <strong>of</strong> the attributable<br />
proportion in the exposed be