Estuary Component - Biodiversity GIS - SANBI
Estuary Component - Biodiversity GIS - SANBI
Estuary Component - Biodiversity GIS - SANBI

You also want an ePaper? Increase the reach of your titles
YUMPU automatically turns print PDFs into web optimized ePapers that Google loves.
South African<br />
National Spatial <strong>Biodiversity</strong> Assessment<br />
2004<br />
Technical Report<br />
Volume 3: <strong>Estuary</strong> <strong>Component</strong><br />
Prepared by<br />
Dr Jane K. Turpie<br />
Anchor Environmental Consultants CC<br />
April 2005
The National Spatial <strong>Biodiversity</strong> Assessment was commissioned by the Department<br />
of Environmental Affairs and Tourism as part of the National <strong>Biodiversity</strong> Strategy<br />
and Action Plan (NBSAP). It was co-funded by the Department of Environmental<br />
Affairs and Tourism and the South African National <strong>Biodiversity</strong> Institute.<br />
This report forms part of a set of five reports on South Africa’s National Spatial<br />
<strong>Biodiversity</strong> Assessment 2004. The full set is listed below, and is available at<br />
www.sanbi.org.<br />
NSBA Summary Report<br />
Driver, A, Maze, K, Rouget, M, Lombard, AT, Nel, J, Turpie, JK, Cowling, RM,<br />
Desmet, P, Goodman, P, Harris, J, Jonas, Z, Reyers, B, Sink, K & Strauss, T. 2005.<br />
National Spatial <strong>Biodiversity</strong> Assessment 2004: Priorities for <strong>Biodiversity</strong><br />
Conservation in South Africa. Strelitzia 17. Pretoria: South African National<br />
<strong>Biodiversity</strong> Institute.<br />
NSBA Technical Reports<br />
Volume 1: Terrestrial <strong>Component</strong><br />
Rouget, M., Reyers, B., Jonas, Z., Desmet, P., Driver, A., Maze, K., Egoh, B. &<br />
Cowling, R.M. 2004. South African National Spatial <strong>Biodiversity</strong> Assessment 2004:<br />
Technical Report. Volume 1: Terrestrial <strong>Component</strong>. Pretoria: South African National<br />
<strong>Biodiversity</strong> Institute.<br />
Volume 2: River <strong>Component</strong><br />
Nel, J., Maree, G., Roux, D., Moolman, J., Kleynhans, N., Silberbauer, M. & Driver,<br />
A. 2004. South African National Spatial <strong>Biodiversity</strong> Assessment 2004: Technical<br />
Report. Volume 2: River <strong>Component</strong>. CSIR Report Number ENV-S-I-2004-063.<br />
Stellenbosch: Council for Scientific and Industrial Research.<br />
Volume 3: <strong>Estuary</strong> <strong>Component</strong><br />
Turpie, J.K. 2004. South African National Spatial <strong>Biodiversity</strong> Assessment 2004:<br />
Technical Report. Volume 3: <strong>Estuary</strong> <strong>Component</strong>. Pretoria: South African National<br />
<strong>Biodiversity</strong> Institute.<br />
Volume 4: Marine <strong>Component</strong><br />
Lombard, A.T., Strauss, T., Harris, J., Sink, K., Attood, C. & Hutchings, L. 2004:<br />
South African National Spatial <strong>Biodiversity</strong> Assessment 2004: Technical Report.<br />
Volume 4: Marine <strong>Component</strong>. Pretoria: South African National <strong>Biodiversity</strong><br />
Institute.
TABLE OF CONTENTS<br />
1. INTRODUCTION...............................................................................................................1<br />
2. METHODS ........................................................................................................................1<br />
2.1 Definition and typology of estuaries..........................................................................1<br />
2.2 Analytical framework.................................................................................................5<br />
2.3 Data sources and methods.......................................................................................6<br />
2.1.1 Health status.........................................................................................................6<br />
2.1.2 Protection status ...................................................................................................9<br />
2.1.3 Ecological processes ..........................................................................................11<br />
2.1.4 Future pressures.................................................................................................12<br />
3. RESULTS AND RECOMMENDATIONS ........................................................................13<br />
3.1 Health status of estuaries .......................................................................................13<br />
3.2 Current protection of estuarine ecosystems ...........................................................16<br />
3.3 Ecological processes ..............................................................................................18<br />
3.3.1 Nursery area habitat ...........................................................................................18<br />
3.3.2 Outputs to the marine zone ................................................................................20<br />
3.4 Vulnerability ............................................................................................................21<br />
3.5 Conservation priorities ............................................................................................23<br />
3.6 Priorities for further research ..................................................................................26<br />
4. REFERENCES................................................................................................................26<br />
South African National Spatial <strong>Biodiversity</strong> Assessment 2004: Technical Report Vol. 3 <strong>Estuary</strong> component<br />
DRAFT October 2004
1. Introduction<br />
This study was commissioned by the South African National <strong>Biodiversity</strong> Institute (<strong>SANBI</strong>) as<br />
part of the National Spatial <strong>Biodiversity</strong> Assessment (NSBA) of the National <strong>Biodiversity</strong><br />
Strategy and Action Plan (NBSAP). Estuaries were included relatively late in the process,<br />
and have thus been treated relatively briefly, based on a cursory analysis of existing<br />
information. This has been done in conjunction with consultations with the estuarine<br />
research and management community through the Consortium for Estuarine Research and<br />
Management (CERM) and through individual and group meetings with estuarine scientists.<br />
The following estuarine scientists and managers provided inputs into this study:<br />
• Janine Adams, University of Port Elizabeth<br />
• Tris Wooldridge, University of Port Elizabeth<br />
• Alan Whitfield, South African Institute for Aquatic <strong>Biodiversity</strong><br />
• Michael Silberbauer, Resource Quality Services, Dept of Water Affairs & Forestry<br />
• Steve Lamberth, Marine & Coastal Management, DEAT<br />
• Alan Boyd, Marine & Coastal Management, DEAT<br />
• Lara van Niekerk, CSIR Environmentek<br />
• Colin Archibald<br />
• Ricky Taylor, KwaZulu-Natal Wildlife<br />
• Fiona MacKay, Coastal Research Unit of Zululand, University of Zululand<br />
• Pete Goodman, KwaZulu-Natal Wildlife<br />
• Barry Clark, Anchor Environmental Consulting, University of Cape Town<br />
• Jill Slinger, Delft University of Technology, Netherlands (formerly CSIR)<br />
• Susan Taljaard, CSIR Environmentek<br />
• Nadine Strydom, South African Institute for Aquatic <strong>Biodiversity</strong><br />
• Paul Martin, Nelson Mandela Metropolitan Municipality<br />
2. Methods<br />
2.1 Definition and typology of estuaries<br />
An estuary is defined as “a partially enclosed coastal body of water which is either<br />
permanently or periodically open to the sea and within which there is a measurable variation<br />
of salinity due to the mixture of sea water with freshwater derived from land drainage” (Day<br />
1980).<br />
There are a great many catchment systems that flow out into the sea, but many of these are<br />
extremely small and not generally considered to function as estuaries. Whitfield (2000)<br />
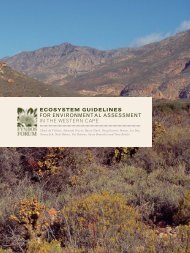
identified a total of 258 systems that fit the above definition of estuaries (Whitfield 2000;<br />
Figure 1). In addition, Verlorenvlei is also considered to be an estuary, although it was<br />
excluded by Whitfield (2000) because much of its estuarine functioning has been lost due to<br />
a causeway development. Thus the total number of estuaries considered in this study is 259.<br />
This list excludes Langebaan Lagoon, which bears some affinity to estuaries due to the<br />
influence of groundwater inputs, but which is more accurately classified as a marine bay.<br />
South African National <strong>Biodiversity</strong> Spatial Assessment 2004: Technical Report Vol. 3 <strong>Estuary</strong> <strong>Component</strong><br />
DRAFT October 2004<br />
1
Figure 1. Location of South African estuaries (source: Department of Water Affairs & Forestry).<br />
South African National <strong>Biodiversity</strong> Spatial Assessment 2004: Technical Report Vol. 3 <strong>Estuary</strong> <strong>Component</strong><br />
DRAFT October 2004<br />
2
There are two classifications of estuaries in terms of their physical characteristics. The<br />
geomorphological classification used by Harrison et al. (2000) recognises six main types<br />
based on mouth condition (open or closed), size and the presence of a bar. This study uses<br />
the Whitfield (1992) classification, as it is more widely accepted than other classification<br />
systems. Whitfield’s (1992) classification recognises five types:<br />
1. Estuarine Bay<br />
2. Permanently Open<br />
3. River Mouth<br />
4. Estuarine Lake, and<br />
5. Temporarily Open.<br />
The first three types tend to remain open to the sea on a permanent basis, whereas several<br />
lakes and all temporarily open estuaries close periodically, sometimes for periods of years.<br />
The five types can be roughly distinguished by the size of the tidal prism (amount of tidal<br />
water exchange), mixing process and their average salinity, as described in Box 1.<br />
A few minor changes have been made for this study, in reclassifying estuaries from one type<br />
to another (Table 1). It should also be noted that some other estuaries, such as Richard’s<br />
Bay and Mhlathuze have been highly modified, though still classified as estuarine bays.<br />
Table 1. Estuaries for which classification in this study differs from Whitfield (2000).<br />
<strong>Estuary</strong><br />
Whitfield Reclassification Reason<br />
classification<br />
Palmiet Perm Temporarily open Does close from time to time<br />
Mkomazi Perm Temporarily open Closes for weeks at a time<br />
Sipingo Perm Temporarily open Almost permanently closed since<br />
river inflow was diverted<br />
Nhlabane Lake Temporarily open Lake was cut off from estuary by a<br />
weir<br />
Mfolozi River mouth Permanently open Tidal for at least 15 km<br />
Mgobeseleni Estuarine Lake Temporarily open The lakes are entirely freshwater<br />
systems upstream of the estuary,<br />
and not tidally influenced<br />
South African estuaries fall within three biogeographical zones: the Cool Temperate zone on<br />
the west coast, the Warm Temperate zone which extends approximately from Cape Point to<br />
the Mbashe River in the Eastern Cape, and the Subtropical Zone on the east coast.<br />
Estuaries within these zones have been shown to have relatively distinct faunal communities,<br />
and have also been found to differ significantly in their physico-chemical characteristics<br />
(Harrison 2004). Estuarine temperatures follow the trend for marine coastal waters, being<br />
coldest on the west coast. Warm temperate estuaries are characterised by high salinities<br />
and low turbidities due to low rainfall and runoff, high seawater input and evaporative loss,<br />
while cold temperate, and especially subtropical, estuaries have lower salinities and higher<br />
turbidity, due to relatively high runoff (Harrison 2004).<br />
South African National <strong>Biodiversity</strong> Spatial Assessment 2004: Technical Report Vol. 3 <strong>Estuary</strong> <strong>Component</strong><br />
DRAFT October 2004<br />
3
Box 1. Whitfield's (1992) Physical Classification of Estuaries.<br />
Type Tidal prism Mixing process Average salinity *<br />
Estuarine Bay<br />
Large (>10 x 10 6 m 3 )<br />
Tidal 20 - 35<br />
Permanently Open<br />
Moderate (1-10 x 10 6 m 3 )<br />
Tidal/riverine 10 - >35<br />
River Mouth<br />
Small (
While relatively high numbers of estuaries are found in both the Warm Temperate and<br />
Subtropical zones, only 11 are found in the Cool Temperate zone on the west coast (Table<br />
2). In general, estuaries increase in density along the coast from west to east (Figure 1).<br />
Table 2. Number of estuaries of each physical type in each biogeographical zone (modified from Whitfield 2000).<br />
Cool Temperate Warm Temperate Subtropical<br />
Estuarine Bay 0 1 3<br />
Permanently open 2 28 15<br />
River mouth 2 6 3<br />
Estuarine lake 0 4 2<br />
Temporarily closed 7 88 98<br />
2.2 Analytical framework<br />
The large number of estuaries and their pattern of distribution around the coast plays an<br />
important role in determining an analytical framework for the NSBA, especially since the data<br />
are to be represented spatially. The NSBA requires a broad scale, spatial analysis of<br />
estuaries rather than a detailed, estuary-level approach. This requires aggregating<br />
information about estuaries in a way which would be compatible with the other components<br />
of the NSBA, as well as making sense in terms of formulating a conservation strategy for<br />
estuaries in the NBSAP.<br />
Various characteristics such as ecological importance of estuaries have been analysed at the<br />
estuary level. These include the relative importance of estuaries in terms of birds (Turpie<br />
1995), plants (Colloty et al. 2000), Fish (Maree et al. 2003) and invertebrates (Turpie et al.<br />
2004), as well as composite analyses based on all biotic and abiotic components (Turpie et<br />
al. 2002, Turpie 2004a). Priority estuaries for conservation have been identified based on<br />
complementarity analysis of largely quantitative biotic data (Turpie et al. 2002), although<br />
more rigorous analysis incorporating more up-to-date data and a broader scope (e.g. socioeconomic<br />
perspectives) is considered necessary before arriving at a final estuarine protected<br />
area system.<br />
Several options were explored for aggregation of data for the NSBA. These included<br />
working at the scale of the three biogeographical zones or using the 50km stretches of coast<br />
used as planning units for the marine component of the NSBA. The former is very coarse,<br />
even if estuaries are differentiated by type within each of these zones. The 50km zones<br />
were considered rather arbitrary for estuaries, especially further to the west where estuaries<br />
become more sparsely distributed. Instead it was decided that it would be most sensible to<br />
analyse the situation in relation to catchment boundaries, specifically at the scale of<br />
secondary catchments. The physical characteristics and management of these catchments<br />
has an enormous influence on the characteristics and status of estuaries. The estuaries of<br />
South Africa fall into approximately 57 catchment areas around the coast, which is a<br />
convenient scale at which to work. This is not dissimilar from the level of resolution used for<br />
the marine zone, but makes a lot more sense in that management and water requirements<br />
are determined at the catchment scale.<br />
Since estuaries are influenced by their catchment characteristics, it also follows that their<br />
characteristics, especially health and pressures, are more similar within a catchment than<br />
between catchments, thus aggregation at the catchment level will produce average indices<br />
with the least underlying variation.<br />
South African National <strong>Biodiversity</strong> Spatial Assessment 2004: Technical Report Vol. 3 <strong>Estuary</strong> <strong>Component</strong><br />
DRAFT October 2004<br />
5
2.3 Data sources and methods<br />
Data on the physical and biotic characteristics of estuaries have been collated in various<br />
studies over the years (see summary in Turpie 2004a). Data compiled by JK Turpie of<br />
Anchor Environmental Consultants on behalf of the Consortium of Estuarine Research and<br />
Management were used as the baseline data for this study, together with additional data<br />
supplied by the Department of Water Affairs and Forestry. The data and analytical methods<br />
were devised and presented to the estuarine research community for critique before being<br />
finalised for this study. Details pertaining to each of the assessments required for the NSBA<br />
are given below.<br />
2.1.1 Health status<br />
There has been concern about the condition of South African estuaries since the 1970s,<br />
when it was already noted that few estuaries remained in their natural state, particularly in<br />
KwaZulu-Natal (Heydorn 1972, 1973 in Morant & Quinn 1999). In his assessment of the<br />
condition of KwaZulu-Natal estuaries, Begg (1978) found only 20 out of 72 to be in a good<br />
condition. Here, siltation was the greatest culprit, due to intensive sugar-cane cultivation in<br />
the catchments, and reduction in flow was also recognised as a problem. Heydorn & Tinley<br />
(1980) reviewed the condition of the estuaries of the former Cape Province (from the Orange<br />
to the Great Kei), and this was followed by a national assessment of the condition of South<br />
African estuaries (Heydorn 1986, 1989, Table 3). The national assessment was initiated by<br />
DWAF in response to concerns about freshwater supplies to estuaries (Morant & Quinn<br />
1999).<br />
Table 3. Condition of estuaries in the former Cape Province (Orange to Kei) and KwaZulu-Natal (Heydorn 1986).<br />
No. of estuaries Present condition (%)<br />
Good Fair Poor<br />
(a) Cape<br />
Large 35 6 83 11<br />
Small 118 30 41 22<br />
Total 153 24 50 20<br />
(b) KwaZulu-Natal<br />
Large 6 67 16.5 16.5<br />
Small 66 24 49 27<br />
Total 72 28 46 26<br />
According to Heydorn’s (1986) assessment, KwaZulu-Natal has a greater proportion of large<br />
estuaries in good condition. The pattern for small estuaries is similar in the Cape and<br />
KwaZulu-Natal, with roughly a quarter to a third of estuaries being in good condition. Overall,<br />
about a quarter of KwaZulu-Natal estuaries and a fifth of Cape estuaries were considered to<br />
be in a poor condition. The assessment of condition, however, depends strongly on how it is<br />
measured. Using fish as an index of community degradation (Ramm 1988), Ramm (1990)<br />
categorised KwaZulu-Natal estuaries as being far more degraded, with 78% falling into the<br />
“moderately, strongly or severely degraded” category.<br />
None of these assessments incorporated the estuaries of the former Ciskei and Transkei<br />
coasts, however, which span much of the eastern half of the present Eastern Cape Province.<br />
Whitfield (2000) conducted a recent assessment on the condition of estuaries. The estuaries<br />
were broadly classified as follows:<br />
South African National <strong>Biodiversity</strong> Spatial Assessment 2004: Technical Report Vol. 3 <strong>Estuary</strong> <strong>Component</strong><br />
DRAFT October 2004<br />
6
• Excellent: estuary in near pristine condition (negligible human impact)<br />
• Good: no major negative anthropogenic influences on either the estuary or<br />
catchment (low impact).<br />
• Fair: noticeable degree of ecological degradation in the catchment and/or estuary<br />
(moderate impact)<br />
• Poor: major ecological degradation arising from a combination of anthropogenic<br />
influences (high impact).<br />
Using these guidelines, 62% of estuaries were considered to be in good or excellent<br />
condition. This apparently higher proportion of estuaries considered to be in good condition is<br />
largely due to the inclusion of the Transkei region, where a large proportion of estuaries are<br />
in good/excellent condition. 26% of KZN estuaries were considered to be in good condition,<br />
similar to Heydorn’s (1986) assessment.<br />
Catchment health was an important factor included in the assessments by both Heydorn<br />
(1986) and Whitfield (2000). Further information is available on the utilisation of estuarine<br />
catchment areas and their deviation from natural condition in Harrison et al. (2000). The<br />
latter study examines 62 estuarine catchments (mainly the relatively large catchments of<br />
>500km 2 ) in South Africa. Systems in the Western Cape were most affected by commercial<br />
agriculture, which accounted for >40% of catchment land-use, while >20% of KwaZulu-Natal<br />
catchment areas were under commercial agriculture. More than 20% of catchments were<br />
affected by subsistence agriculture in the Transkei region of the Eastern Cape. Estuaries in<br />
the Transkei and Ciskei regions of the Eastern Cape had the highest proportion of degraded<br />
land cover in their catchments, mostly over 10%, and many exceeding 20% (Harrison et al.<br />
2000). Catchments of estuaries in the southwest region of the Eastern Cape (Kromme –<br />
Great Kei) had the highest proportion of natural land cover, mostly above 70%, although<br />
most very large catchments also had a high proportion of natural land cover. Further<br />
information on Transkei systems is available, in the form of a video and aerial surveys of<br />
anglers from 1999, from CSIR Environmentek, Durban.<br />
In addition to these general assessments of health, much work has recently been carried out<br />
on the health of certain biotic and abiotic components of estuaries. Harrison et al. (2000)<br />
present an assessment of the health of all South African estuaries in terms of ichthyofaunal<br />
diversity, water quality and aesthetics, and Coetzee et al. (1997) and Colloty et al. (2000)<br />
have classified selected estuaries in terms of their botanical integrity.<br />
There are limitations to all these data, in that they are based largely on subjective<br />
assessments. Detailed methods have been developed for the systematic assessment of<br />
estuarine health as part of the Resource Directed Measures (RDM) methodology, which is<br />
used to set the freshwater Reserve for estuaries under the new National Water Act of 1998.<br />
However, these have only been carried out for a handful of estuaries at this stage. Those<br />
that have been carried out have produced results, which are most similar to Whitflield’s<br />
(2000) assessment (Table 4). It was thus decided that Whitfield’s assessment was the most<br />
appropriate for the purpose of the NSBA. Where discrepancies do exist, the Whitfield<br />
categories have been updated accordingly for this study by members of CERM.<br />
The overall level of health of estuaries within a catchment was determined from the average<br />
scores, after converting Whitfield’s categories to scores of 1 (= poor) to 4 (= excellent).<br />
Overall categories were based on average scores as follows (Table 5).<br />
Finally, in order to produce a layer compatible with that of the other components of the<br />
NSBA, data on the health of individual estuaries was used to express the “ecosystem status”<br />
of each estuarine type per biogeographical zone. Ecosystem status (from least threatened to<br />
critically endangered) was determined on the basis of the proportion of estuaries in each type<br />
within each zone that were in a good or excellent state of health (Table 6).<br />
South African National <strong>Biodiversity</strong> Spatial Assessment 2004: Technical Report Vol. 3 <strong>Estuary</strong> <strong>Component</strong><br />
DRAFT October 2004<br />
7
Table 4. Assessment of health status using EFR or RDM methodology, compared with Whitfield’s (2000)<br />
assessments.<br />
<strong>Estuary</strong> Level PES Category Health Status Whitfield 2000<br />
Orange Rapid D Fair Fair<br />
Olifants EFR B Good Good<br />
Berg EFR C Fair Fair<br />
Palmiet EFR B Good Excellent<br />
Breede Intermediate B Good Good<br />
Great Brak EFR C Fair Fair<br />
Tstitkamma Rapid A/B Natural/Good Good<br />
Keurbooms EFR A/B Good Good<br />
Swartkops EFR D Fair Fair<br />
Sundays EFR C Fair Fair<br />
Umtata Rapid Fair Good<br />
Great Fish EFR C Fair Fair<br />
Nahoon Intermediate C Fair Fair<br />
Mvoti Rapid B Good Fair<br />
Mdloti Rapid C Fair Fair<br />
Mhlanga Rapid C Fair Good<br />
Mhlatuze C Fair Fair<br />
Thukela Comprehensive D Fair Poor<br />
St Lucia Rapid D Fair Good<br />
Bloukrans Desktop Natural/Good Excellent<br />
Lottering Desktop Good Excellent<br />
Elandsbos Desktop Good Excellent<br />
Storms Desktop Natural/Good Excellent<br />
Elands Desktop Good Excellent<br />
Groot (oos) Desktop Good Excellent<br />
Klipdrif (oos) Desktop Fair Good<br />
Slang Desktop Poor Good<br />
Table 5. Scores used to determine the overall health of estuaries within a catchment.<br />
Overall health status<br />
Average health score<br />
Poor 3.5<br />
Table 6. Method to determine ecosystem status from health of estuaries within a group of estuaries.<br />
Ecosystem status category<br />
Proportion of estuaries in a good or excellent<br />
state of health<br />
Critically endangered < 30<br />
Endangered 30 – 59<br />
Vulnerable 60 – 79<br />
Least threatened 80 – 100<br />
South African National <strong>Biodiversity</strong> Spatial Assessment 2004: Technical Report Vol. 3 <strong>Estuary</strong> <strong>Component</strong><br />
DRAFT October 2004<br />
8
2.1.2 Protection status<br />
All estuaries are subject to certain regulations under the Marine Living Resources Act<br />
(MLRA), and thus enjoy some level of protection, at least on paper. In addition to this, a total<br />
of 41 estuaries have some level of protection within a formal protected area. Most of these<br />
are only partly protected. It should be noted that of the numerous Marine Protected Areas<br />
(MPA) that have been proclaimed to date under section 43 of the Marine Living Resources<br />
Act, very few have significant estuarine components, even though a number of estuaries<br />
drain into these MPAs. Table 7 lists the estuaries that fall wholly or partly within protected<br />
areas, the name of the protected area, managing agency, and what is protected. The<br />
category assigned is subjective based on the following guidelines:<br />
High:<br />
• whole estuary within a protected area,<br />
• significant restrictions on consumptive and non-consumptive activities,<br />
• significant restrictions on surrounding development<br />
Medium:<br />
• part of estuary within a protected area,<br />
• some restrictions on activities,<br />
• some restrictions on surrounding development<br />
Low:<br />
• part of estuary within a protected area,<br />
• little restriction on activities,<br />
• little restriction on surrounding development<br />
The current protection status of South African estuaries is not clear-cut. The MLRA<br />
supersedes any legislation that might be in conflict with it, but the interpretation of this<br />
provision varies. One interpretation is that if an estuary was protected under a provincial<br />
ordinance, then this protection is now null and void. Another interpretation is that the law<br />
which is more specific to the estuary is the one that holds. Thus, if an estuary is protected<br />
specifically by a provincial ordinance then it still holds, as the MLRA does not refer to any<br />
specific estuary. The reality is that in most cases, it is still business as usual, in that<br />
estuaries that were protected under the provincial ordinances are still being treated as such.<br />
How effective this is will only be determined when an issue is brought to court (Turpie<br />
2003a).<br />
Apart from those within the Tsitsikamma National Park, there are no estuaries in which<br />
fishing or consumptive use of any kind is totally banned. Some estuaries are zoned and<br />
contain areas where exploitation of fish or bait is not allowed. These include the Wilderness<br />
National Park, Knysna estuary and Mtentu estuary. Banning of fishing in only part of an<br />
estuary is not considered very effective for protection of estuary fishes, however, as fish<br />
within estuaries are far more mobile than those in marine areas. The only time when such a<br />
measure can make a significant contribution to the conservation of fish species is when<br />
protecting a vulnerable part of an estuary, such as a narrow channel, which would facilitate<br />
overexploitation, such as is the case at Wilderness Lakes National Park (Turpie 2003a).<br />
South African National <strong>Biodiversity</strong> Spatial Assessment 2004: Technical Report Vol. 3 <strong>Estuary</strong> <strong>Component</strong><br />
DRAFT October 2004<br />
9
Table 7. Estuaries with some level of protection status, and the degree of protection .<br />
<strong>Estuary</strong> Protected area Agency Amount of estuary<br />
included<br />
Category<br />
assigned<br />
Orange* (Planned)# Provincial Part Low<br />
Rietvlei/Diep Rietvlei NR Municipal Part Medium<br />
Wildevoëlvlei Table Mountain NP SANP Entirely (new) Medium<br />
Krom Table Mountain NP SANP Entirely High<br />
Sand Sandvlei NR Municipal Top
Protection levels were scored from 1 (= no formal protection) to 4 (= high level of protection).<br />
The overall level of protection of estuaries within a catchment was determined from the<br />
average scores. Overall categories were based on average scores as follows (Table 8).<br />
Table 8. Scores used to determine the overall level of protection of estuaries within a catchment.<br />
Overall protection level<br />
Average protection score<br />
None 1<br />
Low < 2.5<br />
Medium < 3.5<br />
High > 3.5<br />
Finally, in order to produce a layer compatible with that of the other components of the<br />
NSBA, levels of protection were expressed per estuarine type per biogeographical zone.<br />
Protection levels were described in relation to a target level of 30% of estuaries protected at<br />
a high level, as follows (Table 9).<br />
Table 9. Method of describing levels of protection for estuaries within a “zone-type”.<br />
Protection status<br />
Proportion of target met<br />
Targets reached 100%<br />
High 50-99%<br />
Medium 20-49%<br />
Low
estimated at the estuary level. However, it was deemed useful to consider the area of<br />
estuarine habitat available around the coast as a rough indicator of available nursery habitat,<br />
since the findings of Strydom et al. (2003) do suggest that estuary size is a primary<br />
determinant of nursery importance.<br />
At the catchment level, overall nursery value of estuaries along a stretch of coast was taken<br />
to be roughly proportional to the total estuarine area. Thus four categories of importance<br />
were assigned as follows (Table 10).<br />
Table 10. Catchment scale determination of nursery area function.<br />
Available nursery habitat<br />
Low<br />
Medium<br />
High<br />
Very high<br />
Total estuarine area (ha)<br />
< 100 ha<br />
100 - 500 ha<br />
500 – 1000 ha<br />
> 1000 ha<br />
B. Outputs to the marine zone<br />
Estuaries are important conduits for the transportation of sediments and nutrients into the<br />
marine zone, where they contribute to marine ecosystem productivity. A prime example is<br />
the influence of such outputs on crustacean fisheries on the east coast. We used natural<br />
mean annual runoff (MAR) as a proxy for the amount of sediment and nutrients transported<br />
into the marine zone. MAR was estimated using catchment data generated by the WR90<br />
model, considered to be the most appropriate model for the purpose (R. Shulze, pers.<br />
comm.). Natural MAR is considered a good proxy for marine outputs given the lack of data<br />
on actual MAR and sediment or nutrient loads, especially at a national scale (J. Slinger, pers.<br />
comm.). Due to lack of data at the estuary level, the assessment is made at the catchment<br />
level only. Five categories of importance were assigned as follows (Table 11).<br />
Table 11. Catchment scale determination of the importance of outputs to the marine zone.<br />
Marine outputs<br />
Total natural MAR (Mm 3 per annum)<br />
Very low < 100<br />
Low 100 – 199<br />
Medium 200 - 399<br />
High 400 - 799<br />
Very high 800 +<br />
2.1.4 Future pressures<br />
Estuaries are threatened by (a) the activities that occur within and immediately around them,<br />
and (b) by activities that reduce the supply of freshwater inputs.<br />
Cowan & van Riet (1998) scored the level of threat to most estuaries in South Africa. These<br />
scores mostly describe the direct threats to estuaries described above (activities within and<br />
around estuaries), and are categorised as 1 to 5, as follows:<br />
1: no information;<br />
2: no known threat;<br />
3: minor threat (e.g. some disturbance from fishing, recreation);<br />
4: moderate threat - some serious threats, but irreparable damage not inevitable;<br />
South African National <strong>Biodiversity</strong> Spatial Assessment 2004: Technical Report Vol. 3 <strong>Estuary</strong> <strong>Component</strong><br />
DRAFT October 2004<br />
12
5: under serious threat, from one or several sources; most, if not all of the habitat is<br />
likely to be lost or major ecological changes are likely to occur unless some<br />
immediate remedial action is taken<br />
Complementing the above data, Turpie et al. (2002), in collaboration with the Department of<br />
Water Affairs and Forestry (DWAF), devised a water demand index, which indicates the level<br />
of threat to an estuary’s freshwater inputs. This score was compiled as the sum of scores<br />
(on a 1-5 scale) for each of the following factors:<br />
1. The amount of water supply schemes already in operation<br />
2. The expected need for new water supply infrastructure in an estuary catchment<br />
3. The expected demand for abstraction licenses<br />
4. Applications for the discharge of water containing waste<br />
Wherever it was felt that new pressures had arisen since the above assessments were<br />
made, the scores given by Cowan & van Riet (1998) and Turpie et al. (2002) were updated<br />
accordingly.<br />
For this study, the water demand score was adjusted to the same scale as the estuary threat<br />
score (1-5). Overall threat at the estuary level was taken to be the maximum of the two<br />
scores.<br />
The overall level of future pressures on estuaries within a catchment was determined from<br />
the average scores. Overall categories were based on average scores as follows (Table 8).<br />
Table 12. Scores used to determine the overall level of future pressures on estuaries within a catchment.<br />
Overall future pressure<br />
Average threat score<br />
Low < 3<br />
Medium < 4<br />
High < 5<br />
Very high 5<br />
3. Results and Recommendations<br />
3.1 Health status of estuaries<br />
The overall health of South African estuaries is relatively good. A total of 28% of estuaries (=<br />
73 estuaries), are considered to be in excellent condition, and another 31% are in good<br />
condition. 25% are in a fair condition, and 15% are in poor condition. The overall picture is<br />
largely a reflection of the state of the 194 temporarily open estuaries. This group contains<br />
the most estuaries in an excellent state (31%), and the most estuaries in a poor state (19%).<br />
25% of the 44 permanently open estuaries are still in an excellent state, 41% are in a good<br />
state and only 5% are considered to be in a poor state. The 11 river mouths follow a similar<br />
pattern. While no bays or lakes remain in an excellent state, two thirds of the six lakes are in<br />
good condition and the rest fair. Bays do not fare as well, with only one of the three in good<br />
condition and the other two in fair condition. The health state of estuaries of each type in<br />
relation to biogeographical zones is summarized in Table 13.<br />
South African National <strong>Biodiversity</strong> Spatial Assessment 2004: Technical Report Vol. 3 <strong>Estuary</strong> <strong>Component</strong><br />
DRAFT October 2004<br />
13
Table 13. Summary of the health status of estuaries of each type in each zone.<br />
Biogeographical Health category Bay Perm River Lake Temp Total<br />
Region<br />
mouth<br />
Cool Temp excellent 1 1<br />
good 1 1<br />
fair 1 1 2 4<br />
poor 1 4 5<br />
Total 2 2 7 11<br />
Warm Temp excellent 4 2 28 34<br />
good 1 12 4 3 35 55<br />
fair 10 1 12 23<br />
poor 1 14 15<br />
Total 1 27 6 4 89 127<br />
Subtropical excellent 7 31 38<br />
good 5 1 1 18 25<br />
fair 3 2 2 1 31 39<br />
poor 1 18 19<br />
Total 3 15 3 2 98 121<br />
Estuaries along the south and south-east coast tend to be healthier than those in the rest of<br />
the country (Figure 2). The catchments along the former Transkei/Ciskei coastal area have<br />
the best health. Average health state is also relatively good for the major systems on the<br />
west coast and in northern KwaZulu-Natal. Estuaries tend to be in fair to poor health along<br />
the intensively developed areas of the Cape south-west coast, around Port Elizabeth, and<br />
almost all of the KwaZulu-Natal coast.<br />
Figure 2. Map of the average state of health of estuaries per catchment.<br />
South African National <strong>Biodiversity</strong> Spatial Assessment 2004: Technical Report Vol. 3 <strong>Estuary</strong> <strong>Component</strong><br />
DRAFT October 2004<br />
14
A general trend that emerges from the catchment level analysis is that estuaries fed by larger<br />
catchments tend to be in poorer health than the estuaries in adjacent smaller catchments.<br />
This is particularly evident in the eastern half of the country, where small catchments<br />
containing several estuaries are regularly interspersed with a single estuary from a large<br />
catchment. Because the pattern breaks down on the western side, there is no correlation<br />
between estuary size and health, or between catchment runoff and average health of<br />
estuaries within a catchment at a national scale. Nevertheless, the observed spatial pattern<br />
suggests that estuaries in smaller catchments have generally been subjected to fewer<br />
pressures than those in larger catchments. In the latter case, the estuaries themselves are<br />
usually larger, and thus attract more coastal development, and the catchments are more<br />
pressured in terms of water abstraction.<br />
The NSBA identifies the status of ecosystems from critically endangered to least threatened,<br />
on the basis of their current ecological state. It is difficult to translate this type of analysis to<br />
estuaries, since estuaries are not in danger of disappearing, but may suffer changes in<br />
ecosystem functioning resulting in a loss of biodiversity and valuable ecosystem services.<br />
Thus in this analysis, a group of estuaries which is critically endangered should be<br />
understood as being in extreme danger of suffering a loss of biodiversity, functioning and<br />
value.<br />
For this analysis, a group of similar-type estuaries within a biogeographical zone, herein<br />
referred to as a zonal-type group, is implicitly assumed to represent a single “ecoregional”<br />
type, supporting a characteristic suite of biodiversity (including its functional aspects). If all of<br />
the estuaries in a zonal-type group are in a good condition, then the biodiversity in those<br />
estuaries is considered least threatened, and so on.<br />
Following this reasoning, it appears that most of the zonal-type groups are endangered or<br />
critically endangered (Table 14). In the subtropical zone, all but permanently open estuaries<br />
are endangered or critically endangered, and all estuary types in the cool temperate zone are<br />
endangered or critically endangered. In the warm temperate zone, permanently open<br />
estuaries are endangered, but other estuary types are in a better position (Table 14).<br />
Table 14. Summary of the status of estuaries of each type within each zone, based on proportion of estuaries in<br />
good or excellent state of health.<br />
Cool Temperate Warm Temperate Subtropical<br />
Bay - 100%<br />
Least threatened<br />
Perm Open 50%<br />
59%<br />
Endangered<br />
Endangered<br />
River mouth 0%<br />
100%<br />
Critically endangered Least threatened<br />
Lake - 75%<br />
Vulnerable<br />
Temp Open 14%<br />
Critically endangered<br />
71%<br />
Vulnerable<br />
0%<br />
Critically endangered<br />
80%<br />
Least threatened<br />
33%<br />
Endangered<br />
50%<br />
Endangered<br />
50%<br />
Endangered<br />
South African National <strong>Biodiversity</strong> Spatial Assessment 2004: Technical Report Vol. 3 <strong>Estuary</strong> <strong>Component</strong><br />
DRAFT October 2004<br />
15
Bay<br />
Perm<br />
River<br />
mouth<br />
Lake<br />
Temp<br />
Figure 3. Status of estuarine ecosystems by zone-type.<br />
This analysis suggests that action is required for most of the zonal-type groups. There is<br />
tremendous variability within the groups, and the action needs to be guided by catchmentlevel<br />
and individual health assessments of estuaries, as well as by their relative importance.<br />
Given the strong congruency between Whitfield’s (2000) assessment of estuarine health and<br />
the findings of more detailed studies undertaken since then, the health index is considered to<br />
be fairly robust. Nevertheless, there will be considerable value in undertaking empirical<br />
health studies of South African estuaries, as this will also pinpoint the causes of a system’s<br />
poor health.<br />
3.2 Current protection of estuarine ecosystems<br />
The overall level of protection of South African estuaries is very low. Of the 41 estuaries that<br />
are included within protected areas, only 14 (5.4%) are considered to have a high level of<br />
protection. Moreover, the majority of these are very small estuaries. This is a long way from<br />
the NSBA target of 30% of estuaries protected at a high level.<br />
The spatial distribution of estuarine protected areas is shown in Figure 4. Several wellprotected<br />
areas occur in KwaZulu-Natal, including some of the country’s largest estuaries (St<br />
Lucia and Kosi). On the Cape south coast, a series of small estuaries are afforded a high<br />
level of protection within the Tsitsikamma National Park. Further west, the Heuningnes and<br />
Krom estuaries fall within securely protected areas. For the remaining estuaries, protection<br />
is only partial, i.e. only parts of the estuary, or only below the high tide mark, as is the case<br />
for the estuaries within the Pondoland Marine Protected Area.<br />
South African National <strong>Biodiversity</strong> Spatial Assessment 2004: Technical Report Vol. 3 <strong>Estuary</strong> <strong>Component</strong><br />
DRAFT October 2004<br />
16
Figure 4. Map of the protection status of estuaries per catchment, and showing the locality of estuaries with<br />
different levels of protection.<br />
It is anticipated that the targets should be representative, including representation within<br />
each zonal-type group. If the representation is to be even (30% in each group, or a minimum<br />
of 2 estuaries), then targets have only been met in warm temperate river mouths and<br />
subtropical estuarine lakes. Most other groups have none or low levels of protection with<br />
respect to this target (Table 15).<br />
Table 15. Summary of the protection status of estuaries of each type within each zone, based on proportion of<br />
estuaries with a high level of protection.<br />
Cool Temperate Warm Temperate Subtropical<br />
Bay 0%<br />
None<br />
0%<br />
None<br />
Perm open 0%<br />
None<br />
4%<br />
Low<br />
13%<br />
Medium<br />
River mouth 0%<br />
None<br />
100%<br />
Target met<br />
0%<br />
None<br />
Lake 0%<br />
None<br />
100%<br />
Target met<br />
Temp open 20%<br />
High<br />
2%<br />
Low<br />
2%<br />
Low<br />
South African National <strong>Biodiversity</strong> Spatial Assessment 2004: Technical Report Vol. 3 <strong>Estuary</strong> <strong>Component</strong><br />
DRAFT October 2004<br />
17
Bay<br />
Perm<br />
River<br />
mouth<br />
Lake<br />
Temp<br />
Figure 5. Protection status of estuarine ecosystems by zone-type.<br />
These findings can be used in conjunction with biodiversity protection and other criteria in<br />
order to guide the selection of estuaries for inclusion in a protected area network. However,<br />
the current analysis is relatively limited in that it does not make provision for the relative<br />
importance of different estuary types, or the area that they cover. Gap analysis in examining<br />
estuarine protection will need to be far more comprehensive.<br />
3.3 Ecological processes<br />
3.3.1 Nursery area habitat<br />
The amount of estuarine habitat per catchment area varies tremendously around the coast<br />
(Figure 6). By far the greatest amount of estuarine habitat is found along the northern<br />
KwaZulu-Natal coast, where the largest number of estuary-dependent species is also to be<br />
found. The nursery areas along this part of the coast support inshore marine biodiversity and<br />
fisheries including crustacean fisheries such as those of the Thukela banks. The subtropical<br />
zone contains 68% of South Africa’s estuarine habitat. Indeed, just over half of the country’s<br />
estuarine area is made up by the St Lucia estuary alone (over 38 000 ha). Despite the fact<br />
that this estuary is relatively well protected, reductions in freshwater inputs have severely<br />
compromised its functioning and thus its contribution as a nursery habitat. There is thus now<br />
a greater reliance on the remaining 11 000 ha of estuaries in the subtropical zone. The<br />
eastern half of the warm temperate zone contains a large number of fairly small estuaries<br />
that individually do not rank very highly, but collectively make up a significant area of habitat<br />
which is important for marine fish along this coast. Along the southern Cape coast, most<br />
nursery area is supplied by a few large estuaries that are relatively isolated from one<br />
another, and thus also very important at the individual estuary scale. The few large estuaries<br />
along the west coast are all considered to be important nursery areas, although relatively<br />
fewer species are dependent on them.<br />
South African National <strong>Biodiversity</strong> Spatial Assessment 2004: Technical Report Vol. 3 <strong>Estuary</strong> <strong>Component</strong><br />
DRAFT October 2004<br />
18
Figure 6. Map of the amount of estuarine habitat per catchment as an indicator of potential nursery area.<br />
Table 16. Total estuarine area (ha) by estuary type for each biogeographical zone.<br />
Cool Temperate Warm Temperate Subtropical Total<br />
Bay 3 594 4 551 8 145<br />
Perm Open 4 317 4 941 1 704 10 961<br />
River mouth 975 23 224 1 222<br />
Lake 5 734 41 790 47 524<br />
Temp Open 591 3 158 1 391 5 140<br />
Total 5 882 17 450 49 660 72 992<br />
This assessment assumes that nursery value is a function of the overall amount of estuarine<br />
habitat. Of course the nursery area value of a hectare of estuary varies considerably<br />
according to individual estuarine characteristics. While overall estuary habitat area will give<br />
some indication of the relative nursery value, much more research is required to investigate<br />
the contribution of individual estuaries to improve this assessment.<br />
The presence of a large amount of estuarine habitat in an area does not necessarily mean<br />
that there is more area to sacrifice. The case of St Lucia illustrates the importance of<br />
investigating the quality of those areas at a finer scale. If anything, Figure 6 serves to<br />
indicate that maintaining the ecosystem health of all estuaries is important. Estuaries may<br />
be quite different to other types of ecosystems in this regard.<br />
Supporting this is the fact that all nursery habitat has economic value (Table 17). It is<br />
important to realise, however, that the unit value of estuarine nursery habitat differs around<br />
South African National <strong>Biodiversity</strong> Spatial Assessment 2004: Technical Report Vol. 3 <strong>Estuary</strong> <strong>Component</strong><br />
DRAFT October 2004<br />
19
the coast for reasons other than the productive capacity of those habitats, such as proximity<br />
to coastal recreational centres.<br />
Table 17. The value of estuarine fisheries and estuary contribution to marine fisheries around different parts of the<br />
coast. Values given in 1997 Rands. This excludes crustacean fisheries (Lamberth & Turpie 2003).<br />
West South East Transkei KZN Total<br />
Estuarine fisheries (R million) 7.7 170.4 92.9 58.6 103.3 433.0<br />
Inshore marine (R million) 10.1 169.2 191.3 30.6 89.3 490.4<br />
TOTAL 17.83 339.56 284.20 89.15 192.56 923.39<br />
No estuaries 9 52 54 67 73 255<br />
Ha 5 884 12 866 3 764 2 612 46 811 71 937<br />
Average value/estuary<br />
2.0 6.5 5.3 1.3 2.6 3.6<br />
(R million)<br />
Average value/ha (R) 3 030 26 392 75 503 34 131 4 114 12 836<br />
3.3.2 Outputs to the marine zone<br />
Estuaries form the conduits for the transport of riverine nutrients and sediments into the<br />
inshore marine zone. Outputs to the marine zone are highest for catchments on the west<br />
and east coasts (Figure 7), while isolated large estuaries (or large catchments) make<br />
important contributions around the entire coast. While these areas can be considered<br />
important because of the contribution they make, those zones where outputs are relatively<br />
small could be seen to be just as important in that the reliance on them could be even higher.<br />
Furthermore, the tendency for the estuaries associated with smaller catchments to close is<br />
usually much higher. Again, this provides justification for a high level of conservation for all<br />
estuaries.<br />
Figure 7. Map of the level of outputs to the marine zone per catchment, based on natural MAR .<br />
South African National <strong>Biodiversity</strong> Spatial Assessment 2004: Technical Report Vol. 3 <strong>Estuary</strong> <strong>Component</strong><br />
DRAFT October 2004<br />
20
The level of outputs to the marine zone is affected by the management of estuaries,<br />
particularly the manipulation of their mouths, and the amount of freshwater inputs into<br />
estuaries. It is important to note that while the National Water Act of 1998 allows for the<br />
maintenance of a reserve of freshwater inflows to estuaries, no provision is made for the<br />
needs of the inshore marine zone. These inputs are thus highly dependent on the level of<br />
health assured for estuaries. The level of freshwater inputs reserved for an estuary is<br />
currently influenced by the level of protection of an estuary, or its desired future protection<br />
status.<br />
3.4 Vulnerability<br />
Estuaries face a number of types of pressures. Existing pressures affect the current state of<br />
health of estuaries, as described above. It is also important to consider where future<br />
pressures lie for the purposes of conservation planning. Proximate pressures on estuaries<br />
come in two main forms: (a) direct pressures on the estuarine environment and its immediate<br />
surrounds, and (b) pressures on the freshwater supplies into estuaries. These are<br />
elaborated as follows:<br />
Direct pressures on estuaries include:<br />
• habitat alteration, for example due to the construction of marinas and jetties<br />
• changes in mouth dynamics, such as the manipulation of mouths to maintain constant<br />
water levels or prevent flooding of holiday homes<br />
• overexploitation of estuarine resources such as fish<br />
• sedimentation of estuaries due to bad catchment or mouth management<br />
• recreational disturbance, which is known to have a major impact on avifauna and fish<br />
• pollution, for example release of sewage into Knysna estuary<br />
Pressures on freshwater inputs include:<br />
• Reductions in freshwater inputs due to upstream abstraction or afforestation<br />
• Increase in freshwater inputs due to agricultural or sewage return flows<br />
• Reductions in water quality, including turbidity, due to bad catchment management,<br />
polluted return flows and effluent disposal<br />
It should always be borne in mind that these proximate pressures are driven by numerous<br />
underlying pressures, the most important of which are poverty and wealth, market failure<br />
(e.g. underpricing of ecosystem goods and services), government failure (e.g. policies which<br />
favour activities that impact on biodiversity), population dynamics and HIV/AIDS. In addition<br />
to these existing pressures, climate change poses a potentially serious future threat to<br />
estuaries, particularly along the western and southern coasts. Unless these ultimate threats<br />
are addressed, attempting to protect biodiversity from proximate pressures may prove futile<br />
in the long run.<br />
Future pressures on estuaries are considered to be particularly high in the south-western<br />
Cape, where pressures on water supplies are immense, and along the KwaZulu-Natal coast,<br />
for similar reasons. Development is also increasing tremendously in both of these areas.<br />
There are also several parts of the southern Cape cost where future pressures are expected<br />
to be high (Figure 8).<br />
South African National <strong>Biodiversity</strong> Spatial Assessment 2004: Technical Report Vol. 3 <strong>Estuary</strong> <strong>Component</strong><br />
DRAFT October 2004<br />
21
Figure 8. Map of the level of future pressures on estuaries per catchment.<br />
The level of pressures on estuaries is summarised in Table 18 and analysed for each zonetype<br />
in Table 19 and Figure 9. The rarer estuary types are subject to the highest pressures<br />
in the subtropical zone, and all cool temperate estuary types are under high pressure. In<br />
general pressures are expected to be medium to high in all but one zone-type (warm<br />
temperate bays), suggesting that conservation action is relatively urgent.<br />
Table 18. Summary of the future pressures to estuaries by type and biogeographical zone.<br />
Threat<br />
Bay Perm River Lake Temp<br />
status<br />
mouth<br />
Cool Temp Medium 1<br />
High 1 1<br />
Very high 1 2 4<br />
Warm Temp Low 4 1 1 25<br />
Medium 1 7 3 31<br />
High 13 2 1 17<br />
Very high 3 2 14<br />
Subtropical Low 3 21<br />
Medium 4 1 15<br />
High 1 8 2 1 41<br />
Very high 2 1 21<br />
South African National <strong>Biodiversity</strong> Spatial Assessment 2004: Technical Report Vol. 3 <strong>Estuary</strong> <strong>Component</strong><br />
DRAFT October 2004<br />
22
Table 19. Summary of the vulnerability of estuaries of each type within each zone, based on proportion of estuaries<br />
with a high to very high level of threat.<br />
Cool Temperate Warm Temperate Subtropical<br />
Bay - 0%<br />
Low<br />
100%<br />
High<br />
Perm open 100%<br />
High<br />
59%<br />
Medium<br />
53%<br />
Medium<br />
River mouth 100%<br />
High<br />
40%<br />
Medium<br />
66%<br />
High<br />
Lake - 75%<br />
High<br />
100%<br />
High<br />
Temp open 66%<br />
High<br />
36%<br />
Medium<br />
63%<br />
Medium<br />
Bay<br />
Perm<br />
River<br />
mouth<br />
Lake<br />
Temp<br />
Figure 9. Vulnerability status by zone type.<br />
3.5 Conservation priorities<br />
There is much consensus in the South African estuarine research and management<br />
community that estuaries each tend to be unique in their characteristics (Boyd et al. 2000).<br />
While information has had to be summarised in terms of zone-types to align with the overall<br />
NSBA ecoregional approach, it would be naïve to pretend that the biodiversity of estuaries<br />
within a zone-type is similar, or governed by the same ecological parameters, at least to the<br />
extent that this may be the case in other types of ecosystems.<br />
<strong>Estuary</strong> conservation needs to be approached from the perspective that all estuaries are<br />
sufficiently valuable to warrant the maintenance of their health. Fortunately, many of the<br />
human activities associated with estuaries are compatible with their conservation, when<br />
managed appropriately. Thus estuary conservation on a broad scale does not necessarily<br />
carry an opportunity cost. Nevertheless, it is also desirable to protect a core set of estuaries<br />
in a highly natural state, to the level where freshwater and other protection requirements may<br />
limit certain human economic activity or at least change its nature. This is necessary to<br />
South African National <strong>Biodiversity</strong> Spatial Assessment 2004: Technical Report Vol. 3 <strong>Estuary</strong> <strong>Component</strong><br />
DRAFT October 2004<br />
23
safeguard certain endangered species (such as the estuarine pipefish), to maintain viable<br />
populations of all estuarine species, and to maintain a representative set of estuaries in their<br />
reference state.<br />
In devising guidelines for a strategy for the conservation of estuarine biodiversity, Turpie<br />
(2003b, 2004b) envisaged assigning all South African estuaries to one of three categories,<br />
as follows:<br />
a) Estuarine Protected Areas (EPAs), in which part or all of the estuary is a sanctuary,<br />
providing protection from consumptive use. EPAs should be selected with both<br />
biodiversity representation and socio-economic considerations in mind.<br />
b) Estuarine Conservation Areas (ECAs) - co-managed estuaries in which general<br />
regulation is augmented by estuary-specific regulation. These are particularly suited to<br />
estuaries used primarily for recreation.<br />
c) Estuarine Management Areas (EMA), to which general regulation applies<br />
Ideally, the core Estuarine Protected Area network should be determined with<br />
representativeness as a major goal. Because of their ad hoc proclamation, the existing<br />
estuarine protected areas are inefficient at biodiversity protection in this sense (Turpie et al.<br />
2002). Although it is commonly believed that top-ranking sites for biodiversity should be<br />
conserved, the conservation of the top-scoring sites only, does not generally result in an<br />
efficient solution. The top twenty estuaries contain only 89% of estuarine species.<br />
Representativeness can be achieved to a large extent by assessing priorities separately<br />
within each biogeographical zone (Turpie 1995). However, only the use of sophisticated<br />
complementarity algorithms will achieve an efficient solution, in which all species are<br />
represented in a minimum number of sites.<br />
Using presence-absence and abundance data for estuarine species, and without specifying<br />
any estuaries for inclusion at the outset, Turpie et al. (2002) identified a set of 32 estuaries<br />
that would represent 100% of the species considered (Table 20). Of the estuaries making up<br />
this set, 11 already enjoy some degree of formal protection.<br />
Table 20. Minimum set of estuaries required in a protected area network to represent 100% of species, based on<br />
complementarity analysis. Estuaries which are already protected are marked with an asterisk (Turpie et al.<br />
2002).<br />
<strong>Estuary</strong><br />
Additional<br />
spp<br />
conserved<br />
Cumulative<br />
spp<br />
conserved<br />
% <strong>Estuary</strong> Additional<br />
spp<br />
conserved<br />
Cumulative<br />
spp<br />
conserved<br />
1 St Lucia * 246 246 44.9 17 Bot 2 518 94.5<br />
2 Berg 95 341 62.2 18 Bushmans 1 519 94.7<br />
3 Kosi* 17 358 65.3 19 Nhlabane 1 520 94.9<br />
4 Swartkops 74 432 78.8 20 Rietvlei* 2 522 95.3<br />
5 Nyoni* 16 448 81.8 21 Mtamvuna 3 525 95.8<br />
6 Wildevoelvlei 11 459 83.8 22 Palmiet 4 529 96.5<br />
7 Wilderness* 10 469 85.6 23 Mvoti 2 531 96.9<br />
8 Manzimtoti 4 473 86.3 24 Great Kei 2 533 97.3<br />
9 Gouritz 4 477 87.0 25 Mgeni* 2 535 97.6<br />
10 Swartvlei 8 485 88.5 26 Mpenjati* 2 537 98.0<br />
11 Heuningnes* 5 490 89.4 27 Mntafufu* 2 539 98.4<br />
12 Olifants 6 496 90.5 28 Mhlali 2 541 98.7<br />
13 Knysna* 5 501 91.4 29 Mlalazi* 2 543 99.1<br />
14 Keiskamma 5 506 92.3 30 Kromme 2 545 99.5<br />
15 Kariega 6 512 93.4 31 Goda 2 547 99.8<br />
16 Lovu 4 516 94.2 32 Mbashe 1 548 100.0<br />
%<br />
South African National <strong>Biodiversity</strong> Spatial Assessment 2004: Technical Report Vol. 3 <strong>Estuary</strong> <strong>Component</strong><br />
DRAFT October 2004<br />
24
The spatial spread of estuaries listed in Table 20 reflects the overall spread of estuaries in<br />
the country (Figure 10), but the proportion of estuaries of each type is not representative of<br />
the relative proportions (Table 21). The set is biased towards the largest estuary types,<br />
mainly because species diversity and population sizes are highest in these estuaries.<br />
Temporarily open estuaries are generally much smaller than the other estuary types.<br />
Nevertheless, the minimum set represents only 12% of estuaries, compared to the NSBA<br />
target of 30%. Thus, there are opportunities to increase the value of the protected area<br />
system in terms of being representative of estuarine types in each biogeographical zone.<br />
The final identification of a set of EPAs and ECAs will require substantial further research<br />
which also takes cognisance of ecosystem functions, zonal type rarity, and socio-economic<br />
factors. In addition, it should align with other conservation initiatives in adjacent marine and<br />
terrestrial areas, with a view to achieving catchment-to-coast conservation of systems.<br />
Figure 10. Location of estuaries listed in Table 20, showing estuary types.<br />
Table 21. The representativeness of the minimum set of estuaries in terms of the types of estuaries and the<br />
biogeographical zones.<br />
Cool Temperate Warm Temperate Subtropical Total<br />
Bay - 1<br />
(100%)<br />
0<br />
(0%)<br />
1<br />
(25%)<br />
Perm open 2 (100%) 7<br />
(26%)<br />
4<br />
(27%)<br />
13<br />
(30%)<br />
River mouth 0<br />
0%<br />
0<br />
(0%)<br />
1<br />
(33%)<br />
1<br />
(9%)<br />
Lake - 3<br />
(75%)<br />
2<br />
(100%)<br />
5<br />
(83%)<br />
Temp open 2<br />
(29%)<br />
3<br />
(3%)<br />
7<br />
(7%)<br />
12<br />
(6%)<br />
Total 4<br />
(36%)<br />
14<br />
(11%)<br />
14<br />
(12%)<br />
32<br />
(12%)<br />
South African National <strong>Biodiversity</strong> Spatial Assessment 2004: Technical Report Vol. 3 <strong>Estuary</strong> <strong>Component</strong><br />
DRAFT October 2004<br />
25
3.6 Priorities for further research<br />
Based on this study and a meeting of CERM during 2004, the following areas are seen as<br />
priorities for research that will enable the setting of conservation priorities and appropriate<br />
management action to achieve biodiversity conservation goals and maximise the value of<br />
estuaries in South Africa:<br />
1. A fresh look at the classification of estuaries<br />
Many estuarine researchers struggle to work within the existing classification systems, due to<br />
inherent flaws and ambiguities. A fresh look at estuaries is required to devise a more robust<br />
system of classification that will also be useful in applied conservation research.<br />
2. A quantitative assessment of the health of estuaries<br />
The methods developed for the Resource Directed Measures (RDM) (Reserve<br />
determination) methodology need to be applied at a national scale, albeit at a desktop or<br />
rapid level if necessary. This will provide a better baseline from which to manage estuaries<br />
and determine their freshwater requirements, as well as for monitoring the effects of<br />
conservation efforts.<br />
3. Quantifying ecosystem interactions with the marine environment<br />
Our understanding of estuarine ecosystem functioning is poor, especially with respect to<br />
functions such as nursery areas and outputs to the marine zone.<br />
4. The impacts of climate change<br />
Very little is known as to how climate change might affect estuaries. Preliminary research<br />
indicates that it may have a major impact on the functioning and biodiversity of a large<br />
proportion of South Africa’s estuaries. A better understanding of this threat will greatly<br />
enhance our ability to take the necessary management and appropriate water supply<br />
decisions.<br />
5. Integrative conservation planning<br />
Estuaries have fallen behind most other ecosystem types in terms of conservation planning<br />
and implementation. Such planning will need to be integrated with other conservation<br />
planning as well as with development initiatives.<br />
4. References<br />
Begg, G. 1978. The estuaries of Natal. Natal Town and Regional Planning Report 41.<br />
Backhouse Press, Pietermaritzburg.<br />
Boyd, A.J., Barwell, L. & Taljaard, S. (eds). 2000. Report on the National Estuaries<br />
Workshop 3-5 May 2000 Port Elizabeth, South Africa. Report No. 2, Marine and<br />
Coastal Management Implementation Workshops.<br />
Coetzee, J.C., Adams, J. B. & Bate, G.C. 1997. A botanical importance rating of selected<br />
Cape estuaries. Water SA 23: 81–93.<br />
Colloty, B.M., Adams, J.B. and Bate, G.C. 2000. The botanical importance of the estuaries<br />
in former Ciskei/Transkei. WRC report 812/1/00 150 pp.<br />
Cowan, G.I. & van Riet, W. 1998. A directory of South African wetlands. Department of<br />
Environmental Affairs and Tourism, Pretoria.<br />
Day, J.H. 1980. What is an estuary South African Journal of Science 76:198.<br />
South African National <strong>Biodiversity</strong> Spatial Assessment 2004: Technical Report Vol. 3 <strong>Estuary</strong> <strong>Component</strong><br />
DRAFT October 2004<br />
26
Harrison, T.D., Cooper, J.A.G. & Ramm, A.E.L. 2000. State of South African estuaries:<br />
geomorphology, ichthyofauna, water quality and aesthetics. State of the Environment<br />
Series, Report No. 2. Department of Environmental Affairs and Tourism. 127pp.<br />
Harrison, T.D. 2004. Physico-chemical characteristics of South African estuaries in relation to<br />
the zoogeography of the region. Estuarine, Coastal and Shelf Science 61: 73–87.<br />
Heydorn, A.E.F. 1972. South African estuaries, their function and the threat to their existence.<br />
Findiver 32: 18–19.<br />
Heydorn, A.E.F. 1973. South African estuaries: an economic asset or a national resource being<br />
squandered. Natal Wildlife 14: 10–15.<br />
Heydorn, A.E.F. 1986. An assessment of the state of the estuaries of the Cape and Natal in<br />
1985/6. South African National Scientific Programmes Report No. 130. Pretoria:<br />
CSIR.<br />
Heydorn, A.E.F. 1989. The conservation status of southern African estuaries. In: Huntley,<br />
B.J. (ed). Biotic diversity in southern Africa: concepts and conservation. Pp. 290–297.<br />
Oxford University Press, Cape Town.<br />
Heydorn, A.E.F. & Tinley, K.L. 1980. Estuaries of the Cape. Part 1. Synopsis of the Cape<br />
Coast. CSIR Research Report No. 380. Stellenbosch: CSIR.<br />
Lamberth, S.J. & Turpie, J.K. 2003. The role of estuaries in South African fisheries: economic<br />
importance and economic implications. African Journal of Marine Science 25: 131–<br />
157.<br />
Maree, R.C., Whitfield, A.K. & Quinn, N.W. 2003. Prioritisation of South African estuaries<br />
based on their potential importance to estuarine-associated fish species. WRC<br />
Report no. TT 203/03.<br />
Morant, P. & Quinn, N. 1999. Influence of man and management of South African estuaries.<br />
In: Allanson, B.R. & Baird, D. (eds). Estuaries of South Africa. Pp. 289–320.<br />
Cambridge University Press, Cambridge.<br />
Ramm, A.E.L. 1988. The Community Degradation Index: a new method for assessing the<br />
deterioration of aquatic habitats Water Res. 22: 293–301.<br />
Ramm, A.E.L. 1990. Application of the community degradation index to South African estuaries.<br />
Water Res. 24: 383–389.<br />
Strydom, N.A., Whitfield, A.K. & Wooldridge, T.H. 2003. The role of estuarine type in<br />
characterising early stage fish assemblages in warm temperate estuaries, South Africa.<br />
African Zoology 38: 29–43.<br />
Turpie, J.K. 1995. Prioritizing South African estuaries for conservation: a practical example<br />
using waterbirds. Biological Conservation 74: 175–185.<br />
Turpie, J.K. 2003a. Goals and guidelines for a strategy for the protection of biodiversity in<br />
Eastern Cape estuaries. <strong>Biodiversity</strong> protection subproject of the Eastern Cape<br />
Estuaries Management Programme, Report 3, Submitted to Institute of Natural<br />
Resources.<br />
Turpie, J.K. 2003b. The current state of protection and health of estuarine biodiversity in<br />
South Africa, with emphasis on Eastern Cape estuaries. Report to Institute of Natural<br />
Resources. 38pp.<br />
Turpie, J.K. 2004a. Improving the biodiversity importance rating of estuaries. Water<br />
Research Commission Report. 126pp.<br />
Turpie, J.K. 2004b. Current status of estuaries, their protection and threats to their<br />
biodiversity, proposed goals for conservation and guidelines for a strategy for the<br />
protection of estuarine biodiversity. WRC report (forthcoming).<br />
Turpie, J.K., Adams, J.B., Joubert, A., Harrison, T.D., Colloty, B.M., Maree, R.C., Whitfield,<br />
A.K., Wooldridge, T.H., Lamberth, S.J., Taljaard, S. & van Niekerk, L. 2002.<br />
Assessment of the conservation priority status of South African estuaries for use in<br />
management and water allocation. Water SA. 28: 191–206.<br />
Turpie, J.K., Clark, B.M. & Savy, C.E. 2004. Predicting invertebrate species richness on the<br />
basis of broadscale estuary characteristics. In: Turpie, JK. Improving the biodiversity<br />
importance rating of estuaries. Water Research Commission Report.<br />
South African National <strong>Biodiversity</strong> Spatial Assessment 2004: Technical Report Vol. 3 <strong>Estuary</strong> <strong>Component</strong><br />
DRAFT October 2004<br />
27
Whitfield, A.K. 1992. A characterisation of southern African estuarine systems. Southern African<br />
Journal of Aquatic Sciences 12: 89–103.<br />
Whitfield, A.K. 1994. An estuary-associated classification for the fishes of southern Africa. South<br />
African Journal of Science 90: 411–417.<br />
Whitfield, A.K. 1998. Biology and ecology of fishes in southern African estuaries. JLB Smith<br />
Institute of Ichthyology, Grahamstown.<br />
Whitfield, A.K. 2000. Available scientific information on individual estuarine systems. WRC<br />
Report no. 577/3/00.<br />
South African National <strong>Biodiversity</strong> Spatial Assessment 2004: Technical Report Vol. 3 <strong>Estuary</strong> <strong>Component</strong><br />
DRAFT October 2004<br />
28