MSA 640 â Homework Assignment #1 Due Friday, August 27, 2010 ...
MSA 640 â Homework Assignment #1 Due Friday, August 27, 2010 ...
MSA 640 â Homework Assignment #1 Due Friday, August 27, 2010 ...

Create successful ePaper yourself
Turn your PDF publications into a flip-book with our unique Google optimized e-Paper software.
Name: ______________________________<br />
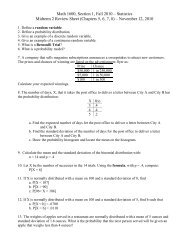
<strong>MSA</strong> <strong>640</strong> – <strong>Homework</strong> <strong>Assignment</strong> <strong>#1</strong><br />
<strong>Due</strong> <strong>Friday</strong>, <strong>August</strong> <strong>27</strong>, <strong>2010</strong> (100 Points Total/20 Points per Question)<br />
The numerical answers for most of these problems are provided. Consequently, grading will be<br />
based almost entirely on the correctness and clarity of the procedure and formulas you use to<br />
obtain your answer. You may use a calculator, laptop computer, or any tool you wish, but you<br />
must show all your work. You may consult with or discuss these problems with anyone you<br />
wish, but your work must be the product of your own personal effort. You may use additional<br />
paper if necessary.<br />
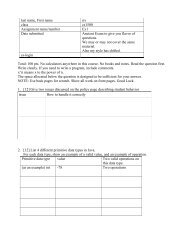
1. An urn contains 12 balls described as follows:<br />
5 are white (W) and lettered (L)<br />
2 are white (W) and numbered (N)<br />
4 are yellow (Y) and lettered (L)<br />
1 is yellow (Y) and numbered (N)<br />
Find the following probabilities for one ball drawn from the urn:<br />
5 balls white (W)<br />
and lettered (L)<br />
2 balls white (W)<br />
and numbered (N)<br />
4 balls yellow (Y)<br />
and lettered (L)<br />
1 ball yellow (Y)<br />
and numbered (N)<br />
P(WL) =<br />
P(YL) =<br />
P(WN) =<br />
P(YN) =<br />
Suggestion: Complete the<br />
following table for use in<br />
computing the probabilities.<br />
L<br />
N<br />
W<br />
Y<br />
P(W) =<br />
P(L) =<br />
P(Y) =<br />
P(N) =<br />
N.B.: P(WL) = 0.42, P(WN) = 0.17, P(L) = 0.75, P(N) = 0.25<br />
<strong>Homework</strong> <strong>#1</strong> Page 1 of 6
Name: ______________________________<br />
#2 Last year at Northern Manufacturing Company, 550 people had colds during the year. There<br />
were 340 people who did no exercising and had colds, while all other people with colds were<br />
involved in a weekly exercise program. Sixty-eight percent (68%) of the 2,600 employees were<br />
involved in some type of exercise.Use the following variables and show all formulas that you<br />
use:<br />
E = people who exercised, ~E = people who did not exercise, C = people who got colds<br />
Given: P(C), P(~E and C), P(E and C), P(E), P(~E)<br />
(a) What is the probability that an employee will have a cold next year (0.21)<br />
(b) Given that an employee is involved in an exercise program, what is the probability that he<br />
or she will get a cold next year (0.12)<br />
(c) Given that an employee is not involved in an exercise program, what is the probability<br />
that he or she will get a cold next year (0.41)<br />
(d) Explain whether exercising and getting a cold are independent events. Prove your answer<br />
using the conditional probability equation. Hint: If P(C | E) is equal to P(C), then events<br />
C and E are independent, otherwise, they are dependent.<br />
Suggestion:<br />
Complete the table to the right for use in<br />
computing the probabilities.<br />
C<br />
~C<br />
E ~E<br />
(a) P(C) =<br />
(b) P(C | E) =<br />
(c) P(C | ~E) =<br />
(d) Prove whether C and E are independent events.<br />
#3 The time to complete a construction project is normally distributed with a mean of 62 weeks and a standard<br />
deviation of 3 weeks. In addition to producing numerical answers, complete drawing and labeling the following<br />
normal curves to show approximate solutions for each part of this problem. Show all the formulas you use.<br />
(a) What is the probability the project will be finished in fewer than 64 weeks (0.75)<br />
(b) What is the probability the project will be finished in fewer than 59 weeks (0.16)<br />
(c) What is the probability the project will take longer than 63 weeks (0.37)<br />
(d) What is the probability the project will take between 58 and 66 weeks (0.82)<br />
<strong>Homework</strong> <strong>#1</strong> Page 2 of 6
Name: ______________________________<br />
#3 (continued)<br />
Given information:<br />
µ = ______________ σ = _____________<br />
(a) P(X < 64)<br />
Show work in this space<br />
62<br />
(b) P(X < 59)<br />
62<br />
(c) P(X > 63)<br />
62<br />
(d) P(58 < X < 66)<br />
62<br />
<strong>Homework</strong> <strong>#1</strong> Page 3 of 6
Name: ______________________________<br />
#4 Armstrong Faber produces a standard number two pencil called Ultra-Lite. Since Chuck Armstrong started<br />
Armstrong Faber, sales have grown steadily. With the increase in the price of wood products, however, Chuck has<br />
been forced to increase the price of the Ultra-Lite pencils. As a result, the demand for Ulta-Lite has been fairly<br />
stable over the past 6 years. On the average, Armstrong Faber has sold 550 thousand pencils each year. Furthermore,<br />
90% of the time sales have been between 540 and 560 thousand pencils. It is expected that the sales follow a normal<br />
distribution with a mean of 550 thousand pencils. Given this information, find the standard deviation of this<br />
distribution. Complete drawing and labeling the following normal curve to show an approximate solution and show<br />
all intermediate work, including formulas. Hint: Start by working backward to find the Z value.<br />
(Z-value = 1.645, standard deviation = 6.08)<br />
550<br />
Use this<br />
space to<br />
show how<br />
the value of<br />
Z was<br />
obtained<br />
Use this<br />
space to<br />
show how<br />
the value of<br />
the standard<br />
deviation (σ)<br />
was obtained<br />
<strong>Homework</strong> <strong>#1</strong> Page 4 of 6
Name: ______________________________<br />
#5 During the summer months in Washington, D.C., bus and subway ridership is believed to be heavily tied to the<br />
number of tourists visiting the city. During the past 12 years, the following data has been obtained where the X<br />
column represents millions of tourists and the Y column represents ridership in millions.<br />
(a) Develop the slope and intercept for the regression equation. (b 0 =0.539, b 1 =0.146)<br />
(b) What is the expected ridership if 20 million tourists visit the city (3.46)<br />
(c) What is the expected ridership if 21 million tourists visit the city (3.51)<br />
Don’t forget to show all formulas that you use as well as all intermediate work.<br />
X Y ( X − X ) ( Y − Y ) ( X − X ) 2<br />
( X − X ) × ( Y −Y<br />
)<br />
1 0.8<br />
3 0.9<br />
4 1.1<br />
6 1.3<br />
8 1.5<br />
9 1.8<br />
10 2.2<br />
12 2.5<br />
14 2.7<br />
16 2.9<br />
18 3.1<br />
19 3.2<br />
∑( X ) ( )<br />
2<br />
∑ Y ( X − X ) ( Y −Y ) ( X − X ) ( X − X ) × ( Y −Y<br />
)<br />
∑<br />
∑<br />
∑<br />
∑<br />
X = Y =<br />
b 1 =<br />
b 0 =<br />
The regression equation is:<br />
Forecast the value of Y for X = 20 using the regression equation:<br />
Forecast the value of Y for X = 21 using the regression equation:<br />
<strong>Homework</strong> <strong>#1</strong> Page 5 of 6
Name: ______________________________<br />
Some Useful Formulas<br />
P(<br />
Aand B)<br />
P ( A|<br />
B)<br />
=<br />
P(<br />
B)<br />
P ( Aand B)<br />
= P(<br />
A|<br />
B)<br />
× P(<br />
B)<br />
Z = X − µ<br />
σ<br />
X − µ<br />
σ =<br />
Z<br />
X = µ + ( Z × σ )<br />
∑ x<br />
X =<br />
n<br />
∑ y<br />
Y =<br />
n<br />
b<br />
∑<br />
( X − X ) × ( Y −Y<br />
)<br />
1<br />
=<br />
2<br />
∑<br />
( X − X )<br />
b0 = Y −b1<br />
X<br />
ˆ = b + b X<br />
Y<br />
0 1<br />
<strong>Homework</strong> <strong>#1</strong> Page 6 of 6