A critical appraisal of South Africa's market-based land reform policy
A critical appraisal of South Africa's market-based land reform policy
A critical appraisal of South Africa's market-based land reform policy

You also want an ePaper? Increase the reach of your titles
YUMPU automatically turns print PDFs into web optimized ePapers that Google loves.
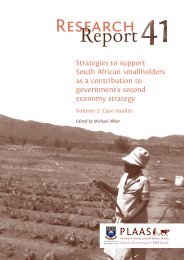
A <strong>critical</strong> <strong>appraisal</strong> <strong>of</strong> <strong>South</strong> Africa’s<br />
<strong>market</strong>-<strong>based</strong> <strong>land</strong> <strong>reform</strong> <strong>policy</strong><br />
Vaalkop project in Chapter 6). Land prices<br />
for the rest <strong>of</strong> the projects reveal that in the<br />
other group project, Mankweng Integrated<br />
(see Chapter 6), the <strong>land</strong> price was<br />
R11 666 per hectare while the individual<br />
beneficiaries got their <strong>land</strong> at an average<br />
price <strong>of</strong> just R269 per hectare. Differences<br />
in <strong>land</strong> prices could be explained by<br />
objective factors such as the difference in<br />
<strong>land</strong> quality and assets on the <strong>land</strong>, but<br />
administrative practices also appear to<br />
have been a factor.<br />
Making direct contact with the<br />
beneficiaries quickly revealed at least part<br />
<strong>of</strong> the reason for some <strong>of</strong> the differences in<br />
<strong>land</strong> prices noted above. Seventeen <strong>of</strong> the<br />
18 individual projects approved are on two<br />
blocks <strong>of</strong> state owned <strong>land</strong>, at Steilloop,<br />
where there are five beneficiaries, and at<br />
Manamead, where there are 12. It emerged<br />
that in both <strong>of</strong> these areas the beneficiaries<br />
had already been leasing the <strong>land</strong> in<br />
question before the initiation <strong>of</strong> the LRAD<br />
project. The state <strong>land</strong> they were on was<br />
priced at production value rather than at<br />
<strong>market</strong> value, yielding substantially lower<br />
prices per hectare than could have been<br />
obtained for <strong>land</strong> on the open <strong>market</strong>. The<br />
private <strong>land</strong> to be acquired for the<br />
Mankweng Integrated group project was<br />
valued at <strong>market</strong> rates. DLA information<br />
on projects approved identifies four<br />
categories <strong>of</strong> planning grant expenses:<br />
business planning, valuation, legal entity,<br />
and other (Table 4). The largest amount <strong>of</strong><br />
planning grant money reported as spent is<br />
allocated to ‘other’, giving little idea what<br />
it was actually used for (Makharamedzha<br />
2002). According to one DLA <strong>of</strong>ficial, the<br />
planning grant money listed under ‘other’<br />
may be a provision and not money<br />
actually spent, as he did not know what it<br />
had been spent on (interview 33). The<br />
Agricultural Research Council (ARC)<br />
carried out the business planning for most<br />
<strong>of</strong> the projects free <strong>of</strong> charge; other<br />
planning required was done by DLA<br />
<strong>of</strong>ficials, so there was little expenditure on<br />
business plans. The Land Bank was paid to<br />
do the <strong>land</strong> valuations on all the state <strong>land</strong>.<br />
In addition to the DLA projects, 29<br />
projects implemented by the Land Bank in<br />
Limpopo involved the transfer <strong>of</strong> 8 144.81<br />
hectares to 125 beneficiaries (Table 5).<br />
A comparison with DLA-implemented<br />
LRAD projects shows that the DLA<br />
reached twice as many beneficiaries with<br />
less than two thirds <strong>of</strong> the grant money.<br />
Not surprisingly the loan component <strong>of</strong> the<br />
DLA-implemented projects is far smaller<br />
Table 4: Expenditure <strong>of</strong> planning grants on LRAD projects (R)<br />
Business plans Valuations Legal entity Other Total<br />
28 000 62 323 16 850 448 759 555 932<br />
Source: Makharamedzha 2002.<br />
Table 5: Land Bank-implemented LRAD projects<br />
Number <strong>of</strong> Hectares Average Grants Average Loans (R) Average<br />
beneficiaries hectares per (R) grant per loan per<br />
person person (R) person (R)<br />
Total 125 8 144.81 65.16 9 225 264 73 802 27 455 807 219 646<br />
Men 92 6 960.92 75.66 6 373 293 69 275 16 581 692 180 236<br />
Women 33 1 183.89 35.88 2 851 971 86 423 10 874 115 329 519<br />
DLA-implemented LRAD projects (for comparison)<br />
Total 251 14 147 56.4 5 977 307 23 814 4 623 251 18 419<br />
Source: Land Bank, Polokwane Branch (Land Bank 2003).<br />
24