A critical appraisal of South Africa's market-based land reform policy
A critical appraisal of South Africa's market-based land reform policy
A critical appraisal of South Africa's market-based land reform policy

You also want an ePaper? Increase the reach of your titles
YUMPU automatically turns print PDFs into web optimized ePapers that Google loves.
Chapter 5: The LRAD programme<br />
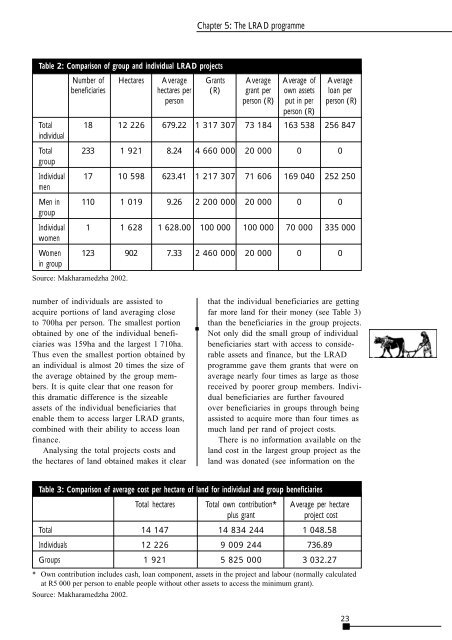
Table 2: Comparison <strong>of</strong> group and individual LRAD projects<br />
Number <strong>of</strong> Hectares Average Grants Average Average <strong>of</strong> Average<br />
beneficiaries hectares per (R) grant per own assets loan per<br />
person person (R) put in per person (R)<br />
person (R)<br />
Total 18 12 226 679.22 1 317 307 73 184 163 538 256 847<br />
individual<br />
Total 233 1 921 8.24 4 660 000 20 000 0 0<br />
group<br />
Individual 17 10 598 623.41 1 217 307 71 606 169 040 252 250<br />
men<br />
Men in 110 1 019 9.26 2 200 000 20 000 0 0<br />
group<br />
Individual 1 1 628 1 628.00 100 000 100 000 70 000 335 000<br />
women<br />
Women 123 902 7.33 2 460 000 20 000 0 0<br />
in group<br />
Source: Makharamedzha 2002.<br />
number <strong>of</strong> individuals are assisted to<br />
acquire portions <strong>of</strong> <strong>land</strong> averaging close<br />
to 700ha per person. The smallest portion<br />
obtained by one <strong>of</strong> the individual beneficiaries<br />
was 159ha and the largest 1 710ha.<br />
Thus even the smallest portion obtained by<br />
an individual is almost 20 times the size <strong>of</strong><br />
the average obtained by the group members.<br />
It is quite clear that one reason for<br />
this dramatic difference is the sizeable<br />
assets <strong>of</strong> the individual beneficiaries that<br />
enable them to access larger LRAD grants,<br />
combined with their ability to access loan<br />
finance.<br />
Analysing the total projects costs and<br />
the hectares <strong>of</strong> <strong>land</strong> obtained makes it clear<br />
that the individual beneficiaries are getting<br />
far more <strong>land</strong> for their money (see Table 3)<br />
than the beneficiaries in the group projects.<br />
Not only did the small group <strong>of</strong> individual<br />
beneficiaries start with access to considerable<br />
assets and finance, but the LRAD<br />
programme gave them grants that were on<br />
average nearly four times as large as those<br />
received by poorer group members. Individual<br />
beneficiaries are further favoured<br />
over beneficiaries in groups through being<br />
assisted to acquire more than four times as<br />
much <strong>land</strong> per rand <strong>of</strong> project costs.<br />
There is no information available on the<br />
<strong>land</strong> cost in the largest group project as the<br />
<strong>land</strong> was donated (see information on the<br />
Table 3: Comparison <strong>of</strong> average cost per hectare <strong>of</strong> <strong>land</strong> for individual and group beneficiaries<br />
Total hectares Total own contribution* Average per hectare<br />
plus grant project cost<br />
Total 14 147 14 834 244 1 048.58<br />
Individuals 12 226 9 009 244 736.89<br />
Groups 1 921 5 825 000 3 032.27<br />
* Own contribution includes cash, loan component, assets in the project and labour (normally calculated<br />
at R5 000 per person to enable people without other assets to access the minimum grant).<br />
Source: Makharamedzha 2002.<br />
23