
You also want an ePaper? Increase the reach of your titles
YUMPU automatically turns print PDFs into web optimized ePapers that Google loves.
Capital Structure<br />
Managerial Finance, 2008<br />
Konan Chan<br />
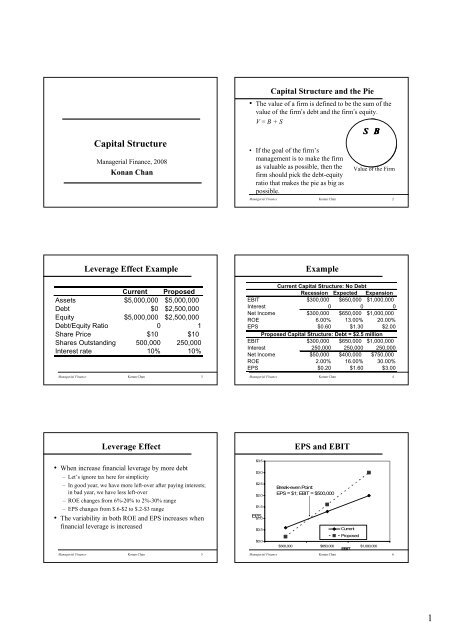
Capital Structure and the Pie<br />
• The value of a firm is defined to be the sum of the<br />
value of the firm’s debt and the firm’s equity.<br />
V = B + S<br />
• If the goal of the firm’s<br />
management is to make the firm<br />
as valuable as possible, then the<br />
firm should pick the debt-equity<br />
ratio that makes the pie as big as<br />
possible.<br />
S B<br />
Value of the Firm<br />
Managerial Finance Konan Chan 2<br />
Leverage Effect Example<br />
Current Proposed<br />
Assets $5,000,000 $5,000,000<br />
Debt $0 $2,500,000<br />
Equity $5,000,000 $2,500,000<br />
Debt/Equity Ratio 0 1<br />
Share Price $10 $10<br />
Shares Outstanding 500,000 250,000<br />
Interest rate 10% 10%<br />
Managerial Finance Konan Chan 3<br />
Example<br />
Current Capital Structure: No Debt<br />
Recession Expected Expansion<br />
EBIT $300,000 $650,000 $1,000,000<br />
Interest 0 0 0<br />
Net Income $300,000 $650,000 $1,000,000<br />
ROE 6.00% 13.00% 20.00%<br />
EPS $0.60 $1.30 $2.00<br />
Proposed Capital Structure: Debt = $2.5 million<br />
EBIT $300,000 $650,000 $1,000,000<br />
Interest 250,000 250,000 250,000<br />
Net Income $50,000 $400,000 $750,000<br />
ROE 2.00% 16.00% 30.00%<br />
EPS $0.20 $1.60 $3.00<br />
Managerial Finance Konan Chan 4<br />
Leverage Effect<br />
EPS and EBIT<br />
• When increase financial leverage by more debt<br />
– Let’s ignore tax here for simplicity<br />
– In good year, we have more left-over after paying interests;<br />
in bad year, we have less left-over<br />
– ROE changes from 6%-20% to 2%-30% range<br />
– EPS changes from $.6-$2 to $.2-$3 range<br />
• The variability in both ROE and EPS increases when<br />
financial leverage is increased<br />
Managerial Finance Konan Chan 5<br />
$3.5<br />
$3.0<br />
$2.5<br />
$2.0<br />
$1.5<br />
EPS<br />
$1.0<br />
Break-even Point:<br />
EPS = $1; EBIT = $500,000<br />
$0.5<br />
Current<br />
Proposed<br />
$0.0<br />
$300,000 $650,000 $1,000,000<br />
EBIT<br />
Managerial Finance Konan Chan 6<br />
1
Capital Structure Theory<br />
• Modigliani & Miller Propositions<br />
– No tax (MM,1958)<br />
– With corporate tax (MM, 1963)<br />
– With both corporate and <strong>per</strong>sonal tax (Miller, 1977)<br />
• Trade-off theory<br />
• Pecking order theory (Myers and Majluf, 1984)<br />
• Free cash flow theory (Jensen, 1986)<br />
• Market timing (Baker and Wurgler, 2002)<br />
Managerial Finance Konan Chan 7<br />
Homemade Leverage<br />
Current Capital Structure<br />
• Investor borrows $500 and<br />
uses $500 of her own to buy<br />
100 shares of stock<br />
• Payoffs:<br />
– Recession: 100(0.60) -<br />
.1(500) = $10<br />
– Expected: 100(1.30) - .1(500)<br />
= $80<br />
– Expansion: 100(2.00) -<br />
.1(500) = $150<br />
• Mirrors the payoffs from<br />
purchasing 50 shares from the<br />
firm under the proposed<br />
capital structure<br />
Proposed Capital Structure<br />
• Investor buys $250 worth of<br />
stock (25 shares) and $250<br />
worth of bonds paying 10%.<br />
• Payoffs:<br />
– Recession: 25(.20) + .1(250) =<br />
$30<br />
– Expected: 25(1.60) + .1(250) =<br />
$65<br />
– Expansion: 25(3.00) + .1(250) =<br />
$100<br />
• Mirrors the payoffs from<br />
purchasing 50 shares under the<br />
current capital structure<br />
Managerial Finance Konan Chan 8<br />
MM Propositions (no tax)<br />
• MM proposition I<br />
– Capital structure does affect not firm value or WACC<br />
– WACC keeps the same for any debt ratio<br />
• MM proposition II<br />
– Given proposition I, WACC keeps the same<br />
– WACC = R B (B/V) + R S (S/V) = R 0 where V=B+S<br />
– R S = R 0 + (B/S)(R 0 - R B )<br />
– the expected return on equity increases with the debt-equity<br />
ratio<br />
Managerial Finance Konan Chan 9<br />
Cost of capital: R (%)<br />
MM Proposition II (No Taxes)<br />
B<br />
RS<br />
= R 0<br />
+ × ( R 0<br />
− R B<br />
)<br />
S<br />
R B<br />
R 0 R<br />
WACC<br />
B S<br />
= × RB<br />
+ × RS<br />
B + S B + S<br />
R B<br />
Debt-to-equity Ratio<br />
B<br />
S<br />
Managerial Finance Konan Chan 10<br />
L<br />
Example: MM w/o Tax<br />
• Suppose required return on assets = 16%, cost of debt<br />
= 10%, debt/assets = 45%<br />
• What is the cost of equity<br />
– R S = 16% + (16% - 10%)(.45/.55) = 20.91%<br />
• Suppose the cost of equity is 25%, what is the debtto-equity<br />
ratio What is equity/assets<br />
– 25% = 16% + (16% - 10%)(B/S)<br />
– B/S = (25% - 16%) / (16% - 10%) = 1.5<br />
– S/V = 1 / 2.5 = 40%<br />
Managerial Finance Konan Chan 11<br />
Tax Shield<br />
• Compare unlevered (U) with levered firm (L: 4 million debt,<br />
r B<br />
= 10% )<br />
U L<br />
EBIT 1,000,000 1,000,000<br />
Interests (r B * B) 0 -400,000<br />
EBT 1,000,000 600,000<br />
Taxes (T C = 0.35) -350,000 -210,000<br />
Earnings 650,000 390,000 (EBIT - r B B)(1-T C )<br />
Total cash flows 650,000 790,000<br />
• The difference between 790,000 and 650,000 is 140,000<br />
(T C<br />
r B<br />
B = 0.35 * 0.1 * 4,000,000)<br />
• T C<br />
r B<br />
B: tax shield from debt - the advantage of using debt<br />
(disadvantage of equity financing)<br />
EBIT(1-T C ) + T C r B B<br />
Managerial Finance Konan Chan 12<br />
2
MM Theory with Taxes<br />
• If tax shield is <strong>per</strong>petual,<br />
PV of tax shield = B * R B * T C / R B = T C * B<br />
• Value of levered firm (V L )<br />
= unlevered firm value (V U ) + PV of tax shield<br />
= EBIT(1- T C ) / R 0 + T C * D<br />
• More debt is better, because the interest deduction<br />
generates extra value (save tax)<br />
• R WACC = (S/V)R S + (B/V)(R B )(1-T C )<br />
• R S = R 0 + (R 0 – R B )(B/S)(1-T C )<br />
Managerial Finance Konan Chan 13<br />
MM Propositions (with corp. tax)<br />
• MM proposition I (with tax)<br />
– Capital structure does matter<br />
EBIT (1 −TC<br />
) TC<br />
RBB<br />
– VL =<br />
+ = VU<br />
+ TC<br />
B<br />
R0<br />
RB<br />
• MM proposition II<br />
– The cost of equity is positively related to leverage<br />
– R<br />
S<br />
B<br />
= R0 + ( 1−TC<br />
)( r0<br />
− RB<br />
)<br />
S<br />
Managerial Finance Konan Chan 14<br />
Cost of capital: R<br />
(%)<br />
The Effect of Financial Leverage<br />
B<br />
RS<br />
= R 0<br />
+ × ( R 0<br />
− R B<br />
)<br />
S<br />
B<br />
RS<br />
= R0 + × ( 1−TC<br />
) × ( R0<br />
− RB<br />
)<br />
SL<br />
R 0<br />
R B<br />
B<br />
L<br />
R<br />
WACC<br />
=<br />
B + S<br />
L<br />
× RB<br />
× (1 −TC<br />
) + ×<br />
B + SL<br />
L<br />
S<br />
R<br />
S<br />
Example - MM with Tax<br />
• Suppose EBIT is 25 million, tax rate 35%, debt $75<br />
million, cost of debt 9%, unlevered cost of capital 12%<br />
• V U = 25(1-.35) / .12 = $135.42 million<br />
• V L = 135.42 + 75(.35) = $161.67 million<br />
• S = 161.67 – 75 = $86.67 million<br />
• R S = 12% + (12%-9%)(75/86.67)(1-.35) = 13.69%<br />
• R WACC = (86.67/161.67)(13.69%) +<br />
(75/161.67)(9%)(1-.35) = 10.05%<br />
Debt-to-equity<br />
ratio (B/S)<br />
Managerial Finance Konan Chan 15<br />
Managerial Finance Konan Chan 16<br />
Example - MM with Tax<br />
• Suppose that the firm changes its capital structure so<br />
that the debt-to-equity ratio becomes 1.<br />
• What will happen to the cost of equity under the new<br />
capital structure<br />
– R S = 12% + (12% - 9%)(1)(1-.35) = 13.95%<br />
• What will happen to the weighted average cost of<br />
capital<br />
– R WACC = .5(13.95%) + .5(9%)(1-.35) = 9.9%<br />
Miller Theory<br />
• Allow both corporate and <strong>per</strong>sonal tax to exist<br />
⎛ (1 − TC<br />
)(1 − TS<br />
) ⎞<br />
V<br />
⎜<br />
⎟<br />
L<br />
= VU<br />
+ B 1−<br />
⎝ (1 − TB<br />
) ⎠<br />
• The cost of equity is positively related to leverage<br />
B ⎛ (1 − TC<br />
)(1 − TS<br />
) ⎞<br />
rS<br />
= r0 +<br />
( r0<br />
rB<br />
)<br />
S<br />
⎜<br />
(1 TB<br />
)<br />
⎟ −<br />
⎝ − ⎠<br />
• In some cases, capital structure will not matter; i.e.,<br />
back to original MM propositions w/o tax<br />
Managerial Finance Konan Chan 17<br />
Managerial Finance Konan Chan 18<br />
3
MM in Reality and Trade-off<br />
• In reality, no firm takes the extreme step of using<br />
100% debt financing as implied by MM with tax<br />
• MM ignored the costs of bankruptcy in their analysis<br />
of MM with taxes<br />
• By including the cost of bankruptcy, there is a tradeoff<br />
between the benefits of debt financing (tax<br />
shields) against costs of debt financing (increased<br />
risk of bankruptcy)<br />
• Firm value = unlevered firm value + PV tax shield -<br />
PV of financial distress costs<br />
Costs of Financial Distress<br />
• Direct costs<br />
– Legal and administrative costs (lawyers, accountants,<br />
professional witness, …etc.)<br />
– About 3% of market value (Warner, 1977)<br />
• Indirect costs<br />
– Impaired ability to conduct business (lost sales)<br />
– Agency costs of debt (over-investment (Jensen and<br />
Meckling, 1976), under-investment (Myers and Majluf,<br />
1984))<br />
– Costly managerial efforts<br />
– Employee’s unwillingness to work (wage reduction, search<br />
new jobs)<br />
Managerial Finance Konan Chan 19<br />
Managerial Finance Konan Chan 20<br />
Trade-off Theory<br />
• Trade-off between the benefits (tax shields) and costs<br />
(financial distress) of using debt<br />
• There exists an optimal level of debt which maximizes the<br />
firm value<br />
Firm Value<br />
V U<br />
PV(costs of financial distress)<br />
B*<br />
V L = V U + T C B<br />
PV(tax shields)<br />
Debt<br />
Managerial Finance Konan Chan 21<br />
Factors Affect Trade-off<br />
• Growth<br />
– high growth firms should use less debt<br />
– because their growth potential will be easily destroyed by<br />
financial distress<br />
• Types of assets<br />
– firms with more intangible assets should have less debt<br />
(high-tech. vs. airlines) because firms with tangible assets<br />
can sell assets to recover from financial distress<br />
• Uncertainty of o<strong>per</strong>ating income<br />
– firms with more uncertain o<strong>per</strong>ating income should have<br />
less debt (software vs. utilities) because these firms have a<br />
high probability of ex<strong>per</strong>iencing financial distress<br />
Managerial Finance Konan Chan 22<br />
Pecking Order Theory<br />
• Theory<br />
– Firms heavily rely on internally generated funds<br />
– When needs external financing is necessary, debt is the<br />
primary way to get financing<br />
– Equity is the last resort to finance projects<br />
• Rationale<br />
– Information asymmetry causes difficulty in pricing equity<br />
– Firm will issue over-valued shares only and thus investors<br />
discount shares<br />
– Firms prefer to use internally generated funds<br />
– Bonds are safer than equity because valuation of bonds is<br />
less affected by information asymmetry<br />
Managerial Finance Konan Chan 23<br />
Implications from Pecking Order<br />
• Theory<br />
– No defined target (optimal) capital structure<br />
– Most profitable firms generally borrow less is not because they have<br />
low target debt ratios but because they don’t need outside money<br />
– Less profitable firms issue debt because debt financing is first on the<br />
pecking order of external financing<br />
– Firms will avoid external financing, if with enough internal funds<br />
• Financial slack<br />
– Cash buildup, low debt level, and ready access to debt financing<br />
– Financial slack is valuable because it avoids the costs of financial<br />
distress and external financing during bad times<br />
– It’s more valuable if firms with more positive NPV projects<br />
– Explains why growth firms have low debt ratios<br />
– Time the issues in good times to reserve financial slack<br />
Managerial Finance Konan Chan 24<br />
4
Agency Costs<br />
• What is the agency relationship<br />
– The relationship between the principal and agent<br />
– The agent is hired by the principal to act on behalf of the<br />
principal<br />
– Examples: stockholders and the manager, investors and<br />
fund manager, landlord and tenant<br />
• Is there any problem<br />
– Will the agent always act in the interests of the principal<br />
Why<br />
– Conflict of interests ⇒ agency costs<br />
Managerial Finance Konan Chan 25<br />
Types of Agency Problems<br />
• Agency problem between stockholders and the manager<br />
(agency costs of equity)<br />
– Shirking<br />
– Perquisites<br />
– Over-investment<br />
– Wasting free cash flows (free cash flows are cash flows in excess of<br />
that required to fund all positive NPV projects)<br />
• Agency problem between stockholders and bondholders<br />
(agency costs of debt)<br />
– Over-investment (risk-shifting/asset substitution)<br />
– Under-investment (pass out positive NPV projects)<br />
– Milking the pro<strong>per</strong>ty (cash in and run)<br />
– Bait and switch (promise to do safe project,but invest in risky project)<br />
Managerial Finance Konan Chan 26<br />
Over-Investment Problem<br />
• When a firm is in financial distress, and there is a<br />
risky project (high payoff with very small chance)<br />
• What will the shareholders do<br />
Over-Investment (Risk-Shifting)<br />
• Stockholders have only limited liabilities<br />
• Given financial distress, shareholders will be<br />
forced to give up the ownership<br />
• If head I win, if tail you lose:<br />
– Stockholders shift the project risks to bondholders. So,<br />
stockholders gain at the expense of bondholders<br />
• Financial distress leads stockholders to take high<br />
risks<br />
Managerial Finance Konan Chan 27<br />
Managerial Finance Konan Chan 28<br />
Under-Investment Problem<br />
• The firm is in financial distress and has a safe<br />
positive project, but it is short of cash<br />
• What will shareholders do Raise money to take the<br />
project or not<br />
Under-Investments<br />
• Stockholders and bondholders share the benefits of<br />
positive NPV projects<br />
• So, shareholders will pass up the positive NPV<br />
project<br />
• Financial distress destroys the investment policy<br />
Managerial Finance Konan Chan 29<br />
Managerial Finance Konan Chan 30<br />
5
Ways to Reduce Agency Costs:<br />
• Align interests of the manager and stockholders<br />
– The threat of firing<br />
– (Hostile) Takeover<br />
– Managerial compensation<br />
– Leveraged buyouts (LBOs): pro and con<br />
• Align interests of the stockholders and bondholders<br />
– Protective covenants<br />
– Consolidation of debt<br />
– Strip financing<br />
RJR Nabisco LBOs:<br />
Stock price Bond value<br />
• Oct. 27, 1988 (before ann.) $56 $5.0 billion<br />
• Oct. 28, 1988 (after ann.) $75 $4.4 billion<br />
• Nov. 30, 1988 (final bid) $109<br />
• KKR won the bid (25 billion in total), even though<br />
the management bid $3 more<br />
Managerial Finance Konan Chan 31<br />
Managerial Finance Konan Chan 32<br />
Free Cash Flow Theory<br />
• Managers have incentives to not distribute free cash<br />
flows and cause their firms to grow beyond the<br />
optimal size<br />
• The use of debt and corporate market control<br />
(takeovers, LBOs) can help to reduce the agency<br />
costs of free cash flows<br />
– benefits of using debt<br />
– ways to reduce the agency cost of equity<br />
• Example: Oil industry in 80’s<br />
Agency Cost of Equity<br />
• An individual will work harder for a firm if he is one of the<br />
owners than if he is one of the “hired help.”<br />
• While managers may have motive to partake in <strong>per</strong>quisites,<br />
they also need opportunity. Free cash flow provides this<br />
opportunity.<br />
• The free cash flow hypothesis says that an increase in<br />
dividends should benefit the stockholders by reducing the<br />
ability of managers to pursue wasteful activities.<br />
• The free cash flow hypothesis also argues that an increase in<br />
debt will reduce the ability of managers to pursue wasteful<br />
activities more effectively than dividend increases.<br />
Managerial Finance Konan Chan 33<br />
Managerial Finance Konan Chan 34<br />
Market Timing Theory<br />
Market Value Debt Ratios, 2002<br />
• Managers “time” the market and issue equity when<br />
the market price is high<br />
– Loughran and Ritter (1995) find issuers under<strong>per</strong>form after<br />
equity issuance<br />
• The market timing has long and <strong>per</strong>sistent effect on<br />
capital structure<br />
– Capital structure is the outcome of managers’ past attempt<br />
to issue equity opportunistically<br />
Company<br />
Microsoft<br />
Intel<br />
ExxonMobil<br />
Merck<br />
Procter & Gamble<br />
Boeing<br />
Walt Disney<br />
Debt/Assets<br />
0<br />
0<br />
0.04<br />
0.08<br />
0.12<br />
0.27<br />
0.27<br />
LT debt/capital<br />
0<br />
0<br />
0.03<br />
0.04<br />
0.07<br />
0.24<br />
0.25<br />
M/B<br />
5.54<br />
4.03<br />
3.72<br />
7.18<br />
10.13<br />
3.65<br />
1.92<br />
American Electric Power<br />
0.54<br />
0.36<br />
1.62<br />
Delta Air Lines<br />
0.77<br />
0.75<br />
0.82<br />
General Motors<br />
0.84<br />
0.83<br />
4.12<br />
Managerial Finance Konan Chan 35<br />
Managerial Finance Konan Chan 36<br />
6
Country<br />
Leverage Ratios<br />
Total debt to<br />
total asset<br />
(Book value %)<br />
LT debt to total<br />
assets<br />
(Book value %)<br />
LT debt to total<br />
capital<br />
(Market value %)<br />
United States 58% 37% 28%<br />
Japan 69 53 29<br />
Germany 73 38 23<br />
France 71 48 41<br />
Italy 70 47 46<br />
UK 54 28 35<br />
Canada 56 39 35<br />
India 67 34 35<br />
South Korea 73 49 64<br />
Capital Structure Patterns Worldwide<br />
• Capital structures have strong industry patterns<br />
– High: utilities, transport, and capital-intensive manufacture<br />
– Low: service, mining, most rapidly growing or high-tech<br />
– The industry's asset mix and variability affect capital structure<br />
• Capital structures vary across countries<br />
– US, UK, Canadian firms have lower book debt ratios than firms<br />
in Japan, France, and Italy<br />
– US & German firms have lower market value debt ratios<br />
– Leverage in developing countries is less than developed ones<br />
– Historical, institutional, & cultural factors may play a part<br />
Managerial Finance Konan Chan 37<br />
Managerial Finance Konan Chan 38<br />
Capital Structure Patterns Worldwide<br />
• Leverage ratios are inversely related to the <strong>per</strong>ceived costs of<br />
financial distress.<br />
– Both across industries & across countries, the more costly is financial<br />
distress, the less debt will be used.<br />
– Companies rich in collateralizeable assets have higher leverage than<br />
firms rich in growth options.<br />
• Within industries, leverage is inversely related to profitability<br />
– In all industries, the most profitable firms typically borrow the least<br />
• Taxes influence capital structures, but they cannot explain the<br />
differences in leverage across industries and countries<br />
– Increased corporate tax rates yield increased debt usage<br />
– It’s not clear firms in US use more debt now<br />
Capital Structure Patterns Worldwide<br />
• Existing shareholders consider leverage-increasing events<br />
"good news" and leverage-decreasing events "bad news"<br />
– Stock prices rise when leverage-increasing events announced, but fall<br />
for leverage-decreasing events.<br />
• Corporations that are forced away from a preferred capital<br />
structure tend to return to that structure over time<br />
– Has occurred frequently, particularly for US firms that have taken on<br />
large amounts of new debt to finance takeovers.<br />
– More generally, corporations like to o<strong>per</strong>ate within target leverage<br />
zones, and will issue new equity when debt ratios get too high and<br />
will issue debt if they fall too low.<br />
Managerial Finance Konan Chan 39<br />
Managerial Finance Konan Chan 40<br />
Negative news for Equity offerings<br />
Positive news for leverage-increasing<br />
Security type<br />
Common stock<br />
Preferred stock<br />
Convertible preferred stock<br />
Straight bonds<br />
Convertible bonds<br />
Two-day announcement<strong>per</strong>iod<br />
abnormal return<br />
-3.14%<br />
-0.19%<br />
-1.44%<br />
-0.26%<br />
-2.07%<br />
Managerial Finance Konan Chan 41<br />
Managerial Finance Konan Chan 42<br />
7
Rajan and Zingales (1995)<br />
US Financing Pattern<br />
90<br />
Historical US financing patterns<br />
60<br />
30<br />
0<br />
-30<br />
79 80 81 82 83 84 85 86 87 88 89 90 91 92 93 94 95 96 97 98 99 00 01 02<br />
Internal Debt Equity<br />
Managerial Finance Konan Chan 43<br />
Managerial Finance Konan Chan 44<br />
Junk Bonds<br />
• Low-grade bonds, with high default risks, but offer high<br />
yield.<br />
• Prior to 1970, most junk bonds are “Fallen Angels”.<br />
• From late 1970, Michael Milken of Drexel Burnham Lambert<br />
changed the market by creating the demand and supply of the<br />
junk bonds.<br />
• Junk bonds grew rapidly from 1984 to 1989, changing the<br />
corporate finance in 80s.<br />
• Small firms can get a huge amount of financing through junk<br />
bonds, where they were not allowed to do so in the past<br />
• Threat of hostile takeover, wave of mergers and acquisitions,<br />
popularity of share repurchases<br />
LBOs<br />
• The acquisition by a small group of investors<br />
financed primarily with debt.<br />
• Going private transaction, usually with very high<br />
debt ratio after LBOs.<br />
• Top ten LBOs happened in 1986-1989.<br />
• Too much money was chasing too few good deals<br />
Managerial Finance Konan Chan 45<br />
Managerial Finance Konan Chan 46<br />
The Development<br />
• The increasing defaulted events in late 80s increased<br />
the burden of DBL.<br />
• Milken was charged for securities fraud, and DBL<br />
filed bankruptcy in 1990.<br />
• Junk bond market collapsed in 1990, so as the<br />
decline of LBOs.<br />
Junk Bonds and M&A<br />
Amount<br />
Junk Bonds Issues<br />
160000<br />
80%<br />
140000<br />
70%<br />
120000<br />
60%<br />
100000<br />
50%<br />
80000<br />
40%<br />
60000<br />
30%<br />
40000<br />
20%<br />
20000<br />
10%<br />
0<br />
0%<br />
80 81 82 83 84 85 86 87 88 89 90 91 92 93 94 95 96 97 98 99<br />
Amount M&A%<br />
Year<br />
Managerial Finance Konan Chan 47<br />
Managerial Finance Konan Chan 48<br />
8
Junk Bonds and Default<br />
Amount<br />
Junk Bonds Issues<br />
800<br />
12%<br />
700<br />
10%<br />
600<br />
8%<br />
500<br />
400<br />
6%<br />
300<br />
4%<br />
200<br />
2%<br />
100<br />
0<br />
0%<br />
80 81 82 83 84 85 86 87 88 89 90 91 92 93 94 95 96 97 98 99<br />
New issues Default<br />
Year<br />
Testing Trade-off<br />
• Supportive<br />
– Significant negative relationship between R&D and debt<br />
– Leverage is positively related to tangibility of assets, but<br />
negatively related to growth opportunity. Leverage is also<br />
positively related to sales (firm size)<br />
• Against<br />
– Profitability is negatively related to leverage<br />
– Stock prices increase for leverage-increasing<br />
announcements, and stock prices decrease for leveragedecreasing<br />
announcements<br />
Managerial Finance Konan Chan 49<br />
Managerial Finance Konan Chan 50<br />
Testing Pecking Order<br />
• Supportive<br />
– Inverse relationship between profitability and financial<br />
leverage within industries<br />
– Stock prices increase for leverage-increasing<br />
announcements, and stock prices decrease for leveragedecreasing<br />
announcements<br />
– Leverage is positively related to firm size<br />
• Against<br />
– Cannot explain the inter-industry differences in debt ratios<br />
– Leverage is positively related to tangibility of assets<br />
Testing Free Cash Flow<br />
• Supportive<br />
– Stock prices increase for leverage-increasing<br />
announcements, and stock prices decrease for leveragedecreasing<br />
announcements<br />
• Against<br />
– Leverage is positively related to tangibility of assets<br />
– Profitability is negatively related to leverage<br />
Managerial Finance Konan Chan 51<br />
Managerial Finance Konan Chan 52<br />
Testing Market Timing<br />
• (M/B) efwa is the weighted average of historical<br />
market-to-book ratios, giving more weight when<br />
firms issue more equity<br />
Graham and Harvey (2001)<br />
• Survey on 392 corporate managers (CFOs) to see if<br />
theories match practice<br />
• For each question, managers rate their answers from<br />
0~4<br />
– 0 means they never care about it<br />
– 4 means it’s important<br />
– Summarized by <strong>per</strong>centage of CFOs answer 3 or 4<br />
Managerial Finance Konan Chan 53<br />
Managerial Finance Konan Chan 54<br />
9
Survey on Debt Issue Decision<br />
Trade-Off in Practice<br />
• CFOs think that the corporate tax advantage of debt<br />
is moderately important (rating: 2.07, 45%)<br />
– It’s more important for large, higher levered, dividendpaying,<br />
manufacturing, regulated, public firms<br />
• Distress is not very important (rating: 1.24, 21%)<br />
• Almost 60% CFOs think flexibility and credit rating<br />
are important factors in raising debt, an evidence<br />
saying that they want to avoid distress<br />
• Earnings volatility is important when making debt<br />
decisions (rating: 2.32, 48%)<br />
Managerial Finance Konan Chan 55<br />
Managerial Finance Konan Chan 56<br />
Target Debt Ratio<br />
Trade-Off in Practice<br />
• Targets that are tight or somewhat strict are more<br />
common for<br />
– large firms (55%) than for small firms (36%)<br />
– investment-grade (64%) than speculative firms (41%)<br />
– regulated (67%) than unregulated firms (43%)<br />
• Given large investment-grade firms represent the big<br />
portion of the economy, the evidence fairly strongly<br />
supports the trade-off theory<br />
Managerial Finance Konan Chan 57<br />
Managerial Finance Konan Chan 58<br />
Pecking Order in Practice<br />
• Financial flexibility is the most important item about<br />
corporate debt decisions (rating: 2.59, 59%)<br />
• Insufficient internal funds is important in debt<br />
issuance decisions (rating: 2.13, 47%)<br />
• Flexibility is more important for dividend-paying<br />
firms, which are thought to have less information<br />
asymmetry<br />
• No strong evidence that firms issue equity because<br />
recent profits are insufficient to fund activities, or<br />
because the ability to obtain funds from debt is<br />
diminished<br />
Managerial Finance Konan Chan 59<br />
Pecking Order in Practice<br />
• The importance of financial flexibility (financial<br />
slack) and insufficient internal fund to security<br />
issuance decisions is generally consistent with the<br />
pecking-order model<br />
• But, the desire for flexibility and the claim of<br />
insufficient funds are not driven by information<br />
asymmetry, the factors behind the pecking order<br />
theory<br />
Managerial Finance Konan Chan 60<br />
10
Survey on Equity Issue Decision<br />
Pecking Order and Equity Issue<br />
• Undervaluation is important when firms avoid to<br />
issue equity, consistent with pecking order<br />
• But, large, dividend-paying firms are more likely to<br />
think this is important than small, nondividendpaying<br />
firms<br />
Managerial Finance Konan Chan 61<br />
Managerial Finance Konan Chan 62<br />
Agency Cost in Practice<br />
• Jensen (1986) argue that when a firm has ample free<br />
cash flow, its managers tend to waste<br />
• Firms can use debt to commit to pay out free cash<br />
flow and discipline management to work efficiently<br />
• Little evidence that firms discipline managers in this<br />
way. It is important to note, that<br />
– managers might be unwilling to admit to using debt in this<br />
manner<br />
– <strong>per</strong>haps a low rating on this question reflects an<br />
unwillingness of firms to adopt Jensen’s solution more<br />
than a weakness in Jensen’s argument<br />
Managerial Finance Konan Chan 63<br />
11