Computational Mechanics Research and Support for Aerodynamics ...
Computational Mechanics Research and Support for Aerodynamics ...
Computational Mechanics Research and Support for Aerodynamics ...

You also want an ePaper? Increase the reach of your titles
YUMPU automatically turns print PDFs into web optimized ePapers that Google loves.
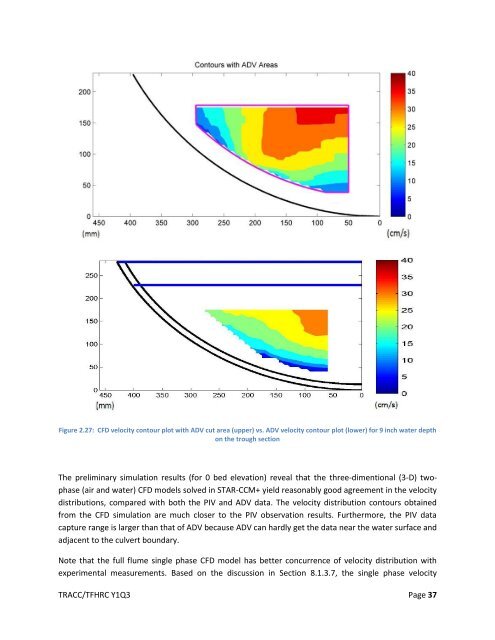
Figure 2.27: CFD velocity contour plot with ADV cut area (upper) vs. ADV velocity contour plot (lower) <strong>for</strong> 9 inch water depth<br />
on the trough section<br />
The preliminary simulation results (<strong>for</strong> 0 bed elevation) reveal that the three-dimentional (3-D) twophase<br />
(air <strong>and</strong> water) CFD models solved in STAR-CCM+ yield reasonably good agreement in the velocity<br />
distributions, compared with both the PIV <strong>and</strong> ADV data. The velocity distribution contours obtained<br />
from the CFD simulation are much closer to the PIV observation results. Furthermore, the PIV data<br />
capture range is larger than that of ADV because ADV can hardly get the data near the water surface <strong>and</strong><br />
adjacent to the culvert boundary.<br />
Note that the full flume single phase CFD model has better concurrence of velocity distribution with<br />
experimental measurements. Based on the discussion in Section 8.1.3.7, the single phase velocity<br />
TRACC/TFHRC Y1Q3 Page 37