Computational Mechanics Research and Support for Aerodynamics ...
Computational Mechanics Research and Support for Aerodynamics ...
Computational Mechanics Research and Support for Aerodynamics ...

You also want an ePaper? Increase the reach of your titles
YUMPU automatically turns print PDFs into web optimized ePapers that Google loves.
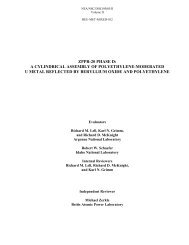
In Figure 2.14, the x-axis of the plot represents velocity <strong>and</strong> the y-axis represents the position of the line<br />
probe at a trough in the vertical direction. The minimum unit on the y-axis is 0.2 m <strong>and</strong> the maximum<br />
unit is 0.4572 m. The y coordinate of the boundary representing the water surface (namely the top of<br />
the reduced culvert section in the CFD study) is at 0.2286 m <strong>and</strong> the y coordinate of the boundary<br />
representing the bottom of the culvert at the wall in 0.4572 m. The same CAD model has been used <strong>for</strong><br />
all the CFD simulations with the co-ordinates of the reduced symmetric barrel section considered from a<br />
trough to a trough as mentioned above. The top surface of the culvert is simulated as a symmetry plane<br />
as mentioned previously which represents an imaginary plane of symmetry in the simulation. It<br />
implicates an infinitely spread region modeled as if in its entirety. The bottom of the culvert is simulated<br />
as a wall with a no slip condition. When velocity is plotted against position, the velocity at the wall is<br />
zero, the first point plotted is the velocity in the cell next to the wall <strong>and</strong> increases with distance from<br />
the wall. In Figure 2.14, the velocity profiles change as the base size of the mesh is varied. All of these<br />
cases show some mesh dependence but may be adequate <strong>for</strong> engineering analysis of fish passage.<br />
However, because cases using the relatively small geometry of a barrel section with periodic boundary<br />
conditions complete in a short time further mesh refinement was investigated.<br />
Figure 2.15: Velocity profiles of the different mesh cases with base size 5mm plotted at a crest<br />
TRACC/TFHRC Y1Q3 Page 26