Directors' report on remuneration (PDF 174 KB) - Inchcape
Directors' report on remuneration (PDF 174 KB) - Inchcape
Directors' report on remuneration (PDF 174 KB) - Inchcape

Create successful ePaper yourself
Turn your PDF publications into a flip-book with our unique Google optimized e-Paper software.
Directors’ <str<strong>on</strong>g>report</str<strong>on</strong>g> <strong>on</strong> remunerati<strong>on</strong> c<strong>on</strong>tinued<br />
TOTAL ACTUAL REMUNERATION<br />
To aid transparency for our shareholders, the table below sets out the total actual remunerati<strong>on</strong> received by each Director for the year<br />
to 31 December 2012.<br />
Executive Director<br />
1. Base salary<br />
£’000<br />
2. Benefi ts<br />
£’000<br />
3. Pensi<strong>on</strong><br />
£’000<br />
4. Annual b<strong>on</strong>us<br />
£’000<br />
5. L<strong>on</strong>g-term incentives<br />
£’000<br />
Total remunerati<strong>on</strong><br />
£’000<br />
André Lacroix 790 18 311 815 232 2,166<br />
John McC<strong>on</strong>nell 408 10 168 420 120 1,126<br />
Director<br />
1. Fee<br />
£’000<br />
2. Benefi ts<br />
£’000<br />
3. Pensi<strong>on</strong><br />
£’000<br />
4. Annual b<strong>on</strong>us<br />
£’000<br />
5. L<strong>on</strong>g-term incentives<br />
£’000<br />
Total remunerati<strong>on</strong><br />
£’000<br />
Ken Hanna 275 7 – – – 282<br />
Vicky Bindra 57 – – – – 57<br />
Sim<strong>on</strong> Borrows 60 – – – – 60<br />
Alis<strong>on</strong> Cooper 50 – – – – 50<br />
Nigel Northridge 60 – – – – 60<br />
Will Samuel 76 – – – – 76<br />
David Scotland 23 – – – – 23<br />
Till Vestring 50 – – – – 50<br />
The fi gures have been calculated as follows:<br />
1. Base salary/fee: amount earned for the year. N<strong>on</strong>-Executive Directors received a fee of £50,000 p.a. plus an additi<strong>on</strong>al £10,000 for Committee Chair. The Deputy<br />
Chairman received a fee of £76,000 p.a.<br />
2. Benefi ts: the taxable value of annual benefi ts received in the year<br />
3. Pensi<strong>on</strong>: the value of the Company’s c<strong>on</strong>tributi<strong>on</strong> during the year<br />
4. Annual b<strong>on</strong>us: the value at grant of the annual incentive payable for performance over 2012, including amounts paid in shares<br />
5. L<strong>on</strong>g-term incentives: Includes any CIP, PSP and opti<strong>on</strong>s based <strong>on</strong> the value at vesting of shares or opti<strong>on</strong>s vesting <strong>on</strong> performance over the three year period ending<br />
31 December 2012. Value stated relates to the vesting of 2010 opti<strong>on</strong> grants, valued based <strong>on</strong> the average share price from 1 October to 31 December 2012 of £4.05.<br />
BASE SALARY<br />
Salaries are reviewed annually and typically take effect from<br />
1 April of each year. The Committee reviews base salary for<br />
the Executive Directors and Executive Committee against<br />
organisati<strong>on</strong>s of similar size, complexity and type, and also<br />
takes into account pay and c<strong>on</strong>diti<strong>on</strong>s elsewhere in the Group.<br />
During the year the quantum of executive total remunerati<strong>on</strong><br />
was reviewed against four comparator groups: retailers,<br />
distributors, companies of similar market cap and companies<br />
with similar revenues.<br />
The salaries for 2011, 2012 and 2013 are set out in the table below,<br />
together with the average increases across the Group.<br />
Name 1 April 2011 1 April 2012 1 April 2013<br />
André Lacroix £778,680<br />
(3% increase)<br />
John McC<strong>on</strong>nell £401,700<br />
(3% increase)<br />
Average increase<br />
across the Group<br />
£794,254<br />
(2% increase)<br />
£409,734<br />
(2% increase)<br />
3.16%<br />
increase<br />
£810,140<br />
(2% increase)<br />
£426,123<br />
(4% increase)<br />
2.84%<br />
increase<br />
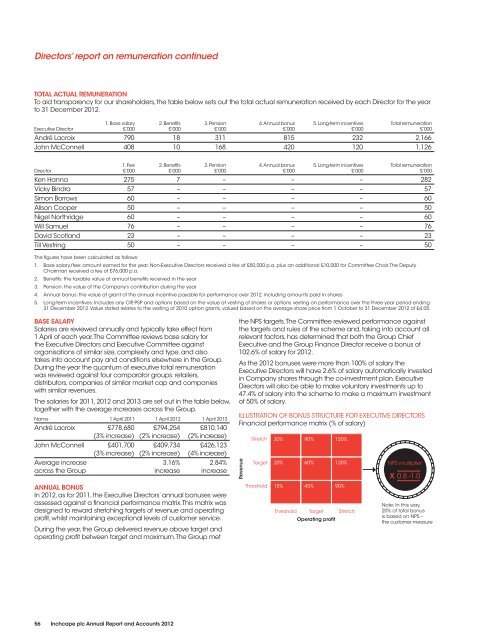
ANNUAL BONUS<br />
In 2012, as for 2011, the Executive Directors’ annual b<strong>on</strong>uses were<br />
assessed against a fi nancial performance matrix. This matrix was<br />
designed to reward stretching targets of revenue and operating<br />
profi t, whilst maintaining excepti<strong>on</strong>al levels of customer service.<br />
During the year, the Group delivered revenue above target and<br />
operating profi t between target and maximum. The Group met<br />
the NPS targets. The Committee reviewed performance against<br />
the targets and rules of the scheme and, taking into account all<br />
relevant factors, has determined that both the Group Chief<br />
Executive and the Group Finance Director receive a b<strong>on</strong>us of<br />
102.6% of salary for 2012.<br />
As the 2012 b<strong>on</strong>uses were more than 100% of salary the<br />
Executive Directors will have 2.6% of salary automatically invested<br />
in Company shares through the co-investment plan. Executive<br />
Directors will also be able to make voluntary investments up to<br />
47.4% of salary into the scheme to make a maximum investment<br />
of 50% of salary.<br />
ILLUSTRATION OF BONUS STRUCTURE FOR EXECUTIVE DIRECTORS<br />
Financial performance matrix (% of salary)<br />
Revenue<br />
Stretch<br />
Target<br />
Threshold<br />
30% 90% 150%<br />
20% 60% 120%<br />
15% 45% 90%<br />
Threshold<br />
Target<br />
Operating profit<br />
Stretch<br />
NPS multiplier<br />
X 0.8 -1.0<br />
Note: In this way,<br />
20% of total b<strong>on</strong>us<br />
is based <strong>on</strong> NPS –<br />
the customer measure<br />
56 <strong>Inchcape</strong> plc Annual Report and Accounts 2012