Directors' report on remuneration (PDF 174 KB) - Inchcape
Directors' report on remuneration (PDF 174 KB) - Inchcape
Directors' report on remuneration (PDF 174 KB) - Inchcape

Create successful ePaper yourself
Turn your PDF publications into a flip-book with our unique Google optimized e-Paper software.
Directors’ <str<strong>on</strong>g>report</str<strong>on</strong>g> <strong>on</strong> remunerati<strong>on</strong> c<strong>on</strong>tinued<br />
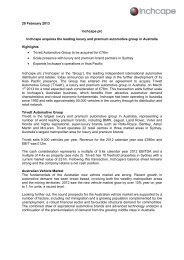
PERFORMANCE SCENARIOS<br />
The charts below show the remunerati<strong>on</strong> that Executive Directors could be expected to obtain based <strong>on</strong> varying<br />
performance scenarios.<br />
In order to achieve maximum vesting of all incentives, as illustrated in the ‘maximum’ scenario below, the Executive Directors<br />
would need to deliver EPS growth in excess of 20% p.a. over the next three years. Illustrati<strong>on</strong>s are intended to provide further informati<strong>on</strong><br />
to shareholders regarding the pay for performance relati<strong>on</strong>ship. However, actual pay delivered will be influenced by changes in<br />
share price and the vesting period of awards.<br />
GROUP CHIEF EXECUTIVE<br />
5000<br />
4,820<br />
9%<br />
26%<br />
GROUP FINANCE DIRECTOR<br />
3000<br />
Total remunerati<strong>on</strong> (£000s)<br />
4000<br />
3000<br />
2000<br />
1000<br />
1,152<br />
30%<br />
70%<br />
2,149<br />
14%<br />
9%<br />
23%<br />
16%<br />
38%<br />
17%<br />
25%<br />
7%<br />
17%<br />
Total remunerati<strong>on</strong> (£000s)<br />
2400<br />
1800<br />
1200<br />
600<br />
565<br />
25%<br />
75%<br />
1,060<br />
13%<br />
10%<br />
24%<br />
13%<br />
40%<br />
17%<br />
2,266<br />
5%<br />
23%<br />
19%<br />
28%<br />
6%<br />
19%<br />
43%<br />
0<br />
Fixed On-plan Maximum<br />
0<br />
Fixed On-plan Maximum<br />
Key:<br />
Enhanced PSP<br />
Normal PSP CIP B<strong>on</strong>us Pensi<strong>on</strong> & bens Salary<br />
Key:<br />
Enhanced PSP<br />
Normal PSP CIP B<strong>on</strong>us Pensi<strong>on</strong> & bens Salary<br />
Base salary Annual base salary: £810k<br />
Pensi<strong>on</strong><br />
40% of salary<br />
Benefits Taxable value of annual benefits provided: £18k<br />
Annual<br />
B<strong>on</strong>us<br />
CIP<br />
Normal<br />
PSP<br />
Enhanced<br />
PSP<br />
No incentives<br />
included<br />
No incentives<br />
included<br />
No incentives<br />
included<br />
No incentives<br />
included<br />
60% of salary 150% of salary<br />
25% of salary<br />
i.e. 50% of salary<br />
invested matched<br />
2:1 vesting 25%<br />
at threshold<br />
£308k<br />
i.e. 304.170 shares<br />
at £4.05, vesting 25%<br />
at threshold<br />
£0k<br />
No vesting –<br />
rewards superior<br />
performance <strong>on</strong>ly<br />
100% of salary<br />
i.e. 50% of salary<br />
invested matched<br />
2:1 vesting 100%<br />
at max<br />
£1,232k<br />
i.e. 304.170 shares<br />
at £4.05, vesting<br />
100% at max<br />
£411k<br />
i.e. 101.390 shares<br />
at £4.05, vesting<br />
100% at max<br />
Base salary Annual base salary: £426k<br />
Pensi<strong>on</strong><br />
30% of salary<br />
Benefits Taxable value of annual benefits provided: £6k<br />
Annual<br />
B<strong>on</strong>us<br />
CIP<br />
Normal<br />
PSP<br />
Enhanced<br />
PSP<br />
No incentives<br />
included<br />
No incentives<br />
included<br />
No incentives<br />
included<br />
No incentives<br />
included<br />
60% of salary 150% of salary<br />
25% of salary<br />
i.e. 50% of salary<br />
invested matched<br />
2:1 vesting 25%<br />
at threshold<br />
£132k<br />
i.e. 130.760 shares<br />
at £4.05, vesting<br />
25% at threshold<br />
£0k<br />
No vesting –<br />
rewards superior<br />
performance <strong>on</strong>ly<br />
100% of salary<br />
i.e. 50% of salary<br />
invested matched<br />
2:1 vesting 100%<br />
at max<br />
£530k<br />
i.e. 130.760 shares<br />
at £4.05, vesting<br />
100% at max<br />
£106k<br />
i.e. 26.150 shares<br />
at £4.05, vesting<br />
100% at max<br />
Potential reward opportunities illustrated above are based <strong>on</strong> the policy which will apply in the forthcoming financial year, applied<br />
to the base salary effective 1 April 2013.<br />
For the annual b<strong>on</strong>us, the amounts illustrated are those potentially receivable in respect of performance for 2013. For the CIP,<br />
the award opportunities assume full voluntary investment in <strong>Inchcape</strong> shares. It should be noted that any awards granted under<br />
the CIP and PSP in a year do not normally vest until the third anniversary of the date of grant. The projected value of CIP and PSP<br />
amounts excludes the impact of share price growth and dividend accrual. PSP values are based <strong>on</strong> the average share price<br />
from 1 October 2012 to 31 December 2012 of £4.05.<br />
54 <strong>Inchcape</strong> plc Annual Report and Accounts 2012